Letter Report: Stable Hydrogen and Oxygen Isotope Analysis ...
Biogeosciences, 12, 1733–1752, 2015
www.biogeosciences.net/12/1733/2015/
doi:10.5194/bg-12-1733-2015
© Author(s) 2015. CC Attribution 3.0 License.
Oxygen and carbon isotope composition of modern planktic
foraminifera and near-surface waters in the Fram Strait (Arctic
Ocean) – a case study
T. Pados1, R. F. Spielhagen1,2, D. Bauch1, H. Meyer3, and M. Segl4
1GEOMAR Helmholtz Centre for Ocean Research Kiel, Kiel, Germany2Academy of Sciences, Humanities, and Literature Mainz, Mainz, Germany3Alfred Wegener Institute Helmholtz Centre for Polar and Marine Research, Potsdam, Germany4MARUM – Center for Marine Environmental Sciences, Bremen, Germany
Correspondence to: T. Pados ([email protected])
Received: 14 May 2014 – Published in Biogeosciences Discuss.: 11 June 2014
Revised: 16 January 2015 – Accepted: 20 January 2015 – Published: 17 March 2015
Abstract. The upper 500 m of the water column and the sed-
iment surface along an E–W transect in the Fram Strait were
sampled for recent planktic foraminifera. The δ18O and δ13C
values of the tests are compared to the stable isotope com-
position of the water samples taken from the same depths,
and related to the characteristics of the water column. The
polar species Neogloboquadrina pachyderma clearly domi-
nates the species assemblage in the Fram Strait in the early
summer, while the subpolar Turborotalita quinqueloba ac-
counts only for 5–23 %. In this area the average depth of
calcification of N. pachyderma lies between 70–150 m water
depth, T. quinqueloba shows a similar range with 50–120 m
water depth. The δ18O values of N. pachyderma show an av-
erage vital effect of about −1.5 ‰ compared to calculated
equilibrium calcite values. Except for the upper ∼ 75 m, the
vertical profiles of δ13C of the net-sampled shells are nearly
parallel to the values measured in the water column with an
average offset of −1.6 ‰ and −3.6 ‰ for N. pachyderma
and T. quinqueloba, respectively. The discrepancy found in
the upper ∼ 75 m might indicate an influence of the “car-
bonate ion effect” on the carbon isotope incorporation in the
tests. Oxygen and carbon isotopes from the sediment sur-
face yield higher values than those from the water column for
both species. This may be because specimens from the wa-
ter column reflect a modern snapshot only, while tests from
surface sediments record environmental parameters from the
past ∼ 1000 years.
1 Introduction
The stable isotope composition of foraminiferal shells from
sediment cores is often used in palaeoceanographic studies to
reconstruct past oceanic environments. Planktic foraminifera
precipitate their calcite tests from the surrounding seawater.
Thus, the stable oxygen isotope ratios (18O / 16O, δ18O) of
shell carbonate are controlled by the ratio in the seawater
and the calcification temperature, while the stable carbon iso-
tope ratios (13C / 12C, δ13C) are a function of the ratio of dis-
solved inorganic carbon. The stable isotope ratios of seawa-
ter, on the other hand, are determined by the interplay of var-
ious factors (e.g. evaporation, sea-ice formation, productiv-
ity). Therefore, δ18O values of fossil planktic foraminiferal
shells have been widely used to estimate sea surface tem-
peratures (e.g. Kellogg et al., 1978; Erez and Luz, 1983),
salinity (e.g. Duplessy et al., 1992) and ocean stratification
(Simstich et al., 2003). Planktic δ13C records are generally
assumed to reflect changes in palaeoproductivity and venti-
lation of surface and near-surface waters (Duplessy, 1978).
Several studies of living planktic foraminifera showed that
these protozoa do not calcify in equilibrium with the ambient
sea water (Shackleton et al., 1973; Vergnaud Grazzini, 1976;
Kahn, 1979; Kohfeld et al., 1996; Bauch et al., 1997; Volk-
mann and Mensch, 2001) and that the stable isotope compo-
sition of their tests is influenced not only by regional effects
but also by numerous other chemical (e.g. pH, carbonate
ion concentration) and biological (e.g. symbiont photosyn-
thesis, metabolic activity, test weight) factors. Increasing pH
Published by Copernicus Publications on behalf of the European Geosciences Union.
1734 T. Pados et al.: Oxygen and carbon isotope composition of modern planktic foraminifera
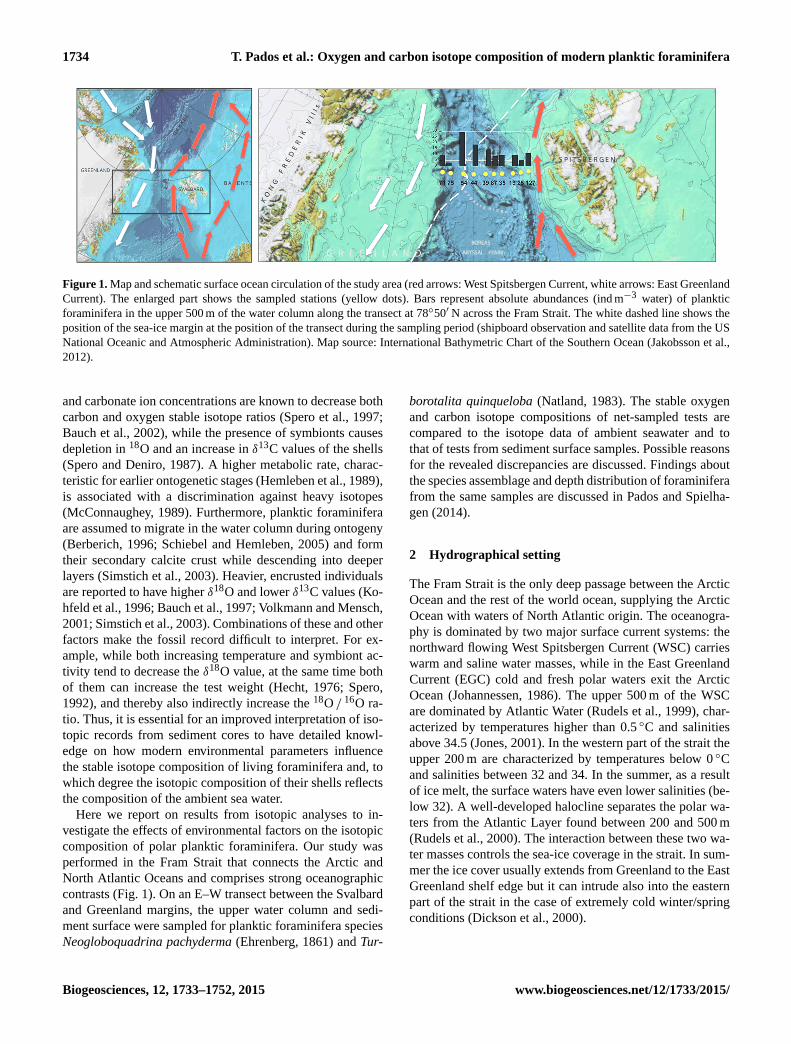
Figure 1. Map and schematic surface ocean circulation of the study area (red arrows: West Spitsbergen Current, white arrows: East Greenland
Current). The enlarged part shows the sampled stations (yellow dots). Bars represent absolute abundances (ind m−3 water) of planktic
foraminifera in the upper 500 m of the water column along the transect at 78◦50′ N across the Fram Strait. The white dashed line shows the
position of the sea-ice margin at the position of the transect during the sampling period (shipboard observation and satellite data from the US
National Oceanic and Atmospheric Administration). Map source: International Bathymetric Chart of the Southern Ocean (Jakobsson et al.,
2012).
and carbonate ion concentrations are known to decrease both
carbon and oxygen stable isotope ratios (Spero et al., 1997;
Bauch et al., 2002), while the presence of symbionts causes
depletion in 18O and an increase in δ13C values of the shells
(Spero and Deniro, 1987). A higher metabolic rate, charac-
teristic for earlier ontogenetic stages (Hemleben et al., 1989),
is associated with a discrimination against heavy isotopes
(McConnaughey, 1989). Furthermore, planktic foraminifera
are assumed to migrate in the water column during ontogeny
(Berberich, 1996; Schiebel and Hemleben, 2005) and form
their secondary calcite crust while descending into deeper
layers (Simstich et al., 2003). Heavier, encrusted individuals
are reported to have higher δ18O and lower δ13C values (Ko-
hfeld et al., 1996; Bauch et al., 1997; Volkmann and Mensch,
2001; Simstich et al., 2003). Combinations of these and other
factors make the fossil record difficult to interpret. For ex-
ample, while both increasing temperature and symbiont ac-
tivity tend to decrease the δ18O value, at the same time both
of them can increase the test weight (Hecht, 1976; Spero,
1992), and thereby also indirectly increase the 18O / 16O ra-
tio. Thus, it is essential for an improved interpretation of iso-
topic records from sediment cores to have detailed knowl-
edge on how modern environmental parameters influence
the stable isotope composition of living foraminifera and, to
which degree the isotopic composition of their shells reflects
the composition of the ambient sea water.
Here we report on results from isotopic analyses to in-
vestigate the effects of environmental factors on the isotopic
composition of polar planktic foraminifera. Our study was
performed in the Fram Strait that connects the Arctic and
North Atlantic Oceans and comprises strong oceanographic
contrasts (Fig. 1). On an E–W transect between the Svalbard
and Greenland margins, the upper water column and sedi-
ment surface were sampled for planktic foraminifera species
Neogloboquadrina pachyderma (Ehrenberg, 1861) and Tur-
borotalita quinqueloba (Natland, 1983). The stable oxygen
and carbon isotope compositions of net-sampled tests are
compared to the isotope data of ambient seawater and to
that of tests from sediment surface samples. Possible reasons
for the revealed discrepancies are discussed. Findings about
the species assemblage and depth distribution of foraminifera
from the same samples are discussed in Pados and Spielha-
gen (2014).
2 Hydrographical setting
The Fram Strait is the only deep passage between the Arctic
Ocean and the rest of the world ocean, supplying the Arctic
Ocean with waters of North Atlantic origin. The oceanogra-
phy is dominated by two major surface current systems: the
northward flowing West Spitsbergen Current (WSC) carries
warm and saline water masses, while in the East Greenland
Current (EGC) cold and fresh polar waters exit the Arctic
Ocean (Johannessen, 1986). The upper 500 m of the WSC
are dominated by Atlantic Water (Rudels et al., 1999), char-
acterized by temperatures higher than 0.5 ◦C and salinities
above 34.5 (Jones, 2001). In the western part of the strait the
upper 200 m are characterized by temperatures below 0 ◦C
and salinities between 32 and 34. In the summer, as a result
of ice melt, the surface waters have even lower salinities (be-
low 32). A well-developed halocline separates the polar wa-
ters from the Atlantic Layer found between 200 and 500 m
(Rudels et al., 2000). The interaction between these two wa-
ter masses controls the sea-ice coverage in the strait. In sum-
mer the ice cover usually extends from Greenland to the East
Greenland shelf edge but it can intrude also into the eastern
part of the strait in the case of extremely cold winter/spring
conditions (Dickson et al., 2000).
Biogeosciences, 12, 1733–1752, 2015 www.biogeosciences.net/12/1733/2015/
T. Pados et al.: Oxygen and carbon isotope composition of modern planktic foraminifera 1735
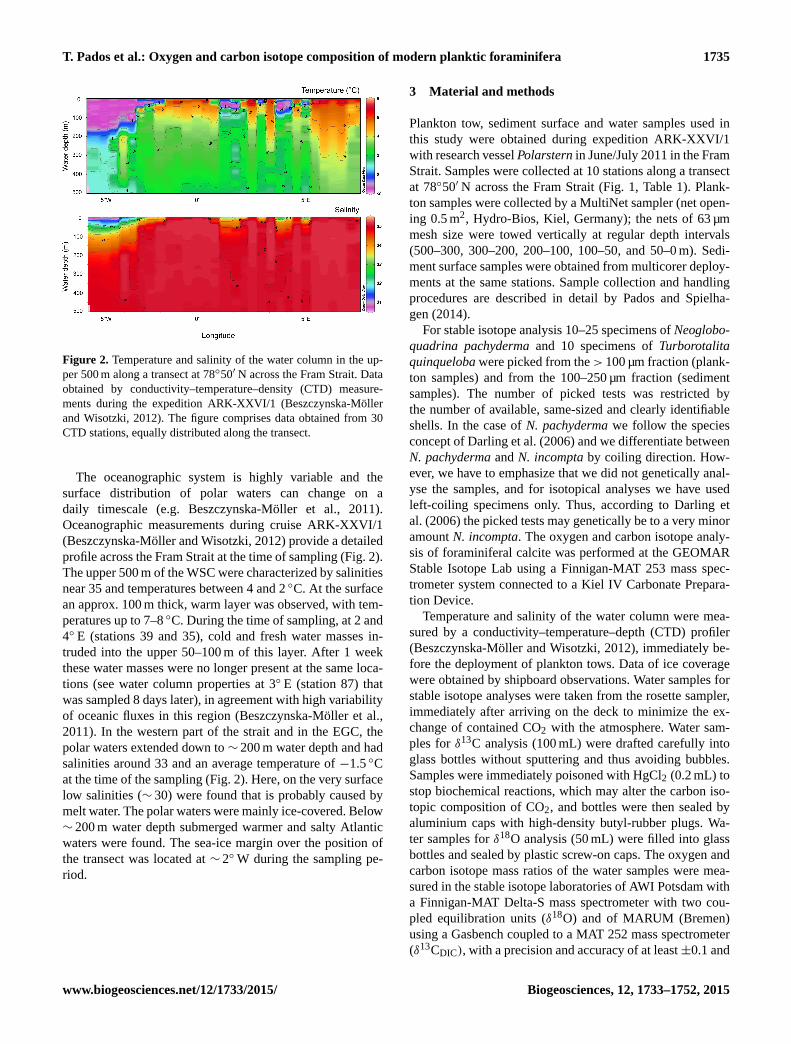
Figure 2. Temperature and salinity of the water column in the up-
per 500 m along a transect at 78◦50′ N across the Fram Strait. Data
obtained by conductivity–temperature–density (CTD) measure-
ments during the expedition ARK-XXVI/1 (Beszczynska-Möller
and Wisotzki, 2012). The figure comprises data obtained from 30
CTD stations, equally distributed along the transect.
The oceanographic system is highly variable and the
surface distribution of polar waters can change on a
daily timescale (e.g. Beszczynska-Möller et al., 2011).
Oceanographic measurements during cruise ARK-XXVI/1
(Beszczynska-Möller and Wisotzki, 2012) provide a detailed
profile across the Fram Strait at the time of sampling (Fig. 2).
The upper 500 m of the WSC were characterized by salinities
near 35 and temperatures between 4 and 2 ◦C. At the surface
an approx. 100 m thick, warm layer was observed, with tem-
peratures up to 7–8 ◦C. During the time of sampling, at 2 and
4◦ E (stations 39 and 35), cold and fresh water masses in-
truded into the upper 50–100 m of this layer. After 1 week
these water masses were no longer present at the same loca-
tions (see water column properties at 3◦ E (station 87) that
was sampled 8 days later), in agreement with high variability
of oceanic fluxes in this region (Beszczynska-Möller et al.,
2011). In the western part of the strait and in the EGC, the
polar waters extended down to ∼ 200 m water depth and had
salinities around 33 and an average temperature of −1.5 ◦C
at the time of the sampling (Fig. 2). Here, on the very surface
low salinities (∼ 30) were found that is probably caused by
melt water. The polar waters were mainly ice-covered. Below
∼ 200 m water depth submerged warmer and salty Atlantic
waters were found. The sea-ice margin over the position of
the transect was located at ∼ 2◦W during the sampling pe-
riod.
3 Material and methods
Plankton tow, sediment surface and water samples used in
this study were obtained during expedition ARK-XXVI/1
with research vessel Polarstern in June/July 2011 in the Fram
Strait. Samples were collected at 10 stations along a transect
at 78◦50′ N across the Fram Strait (Fig. 1, Table 1). Plank-
ton samples were collected by a MultiNet sampler (net open-
ing 0.5 m2, Hydro-Bios, Kiel, Germany); the nets of 63 µm
mesh size were towed vertically at regular depth intervals
(500–300, 300–200, 200–100, 100–50, and 50–0 m). Sedi-
ment surface samples were obtained from multicorer deploy-
ments at the same stations. Sample collection and handling
procedures are described in detail by Pados and Spielha-
gen (2014).
For stable isotope analysis 10–25 specimens of Neoglobo-
quadrina pachyderma and 10 specimens of Turborotalita
quinqueloba were picked from the> 100 µm fraction (plank-
ton samples) and from the 100–250 µm fraction (sediment
samples). The number of picked tests was restricted by
the number of available, same-sized and clearly identifiable
shells. In the case of N. pachyderma we follow the species
concept of Darling et al. (2006) and we differentiate between
N. pachyderma and N. incompta by coiling direction. How-
ever, we have to emphasize that we did not genetically anal-
yse the samples, and for isotopical analyses we have used
left-coiling specimens only. Thus, according to Darling et
al. (2006) the picked tests may genetically be to a very minor
amount N. incompta. The oxygen and carbon isotope analy-
sis of foraminiferal calcite was performed at the GEOMAR
Stable Isotope Lab using a Finnigan-MAT 253 mass spec-
trometer system connected to a Kiel IV Carbonate Prepara-
tion Device.
Temperature and salinity of the water column were mea-
sured by a conductivity–temperature–depth (CTD) profiler
(Beszczynska-Möller and Wisotzki, 2012), immediately be-
fore the deployment of plankton tows. Data of ice coverage
were obtained by shipboard observations. Water samples for
stable isotope analyses were taken from the rosette sampler,
immediately after arriving on the deck to minimize the ex-
change of contained CO2 with the atmosphere. Water sam-
ples for δ13C analysis (100 mL) were drafted carefully into
glass bottles without sputtering and thus avoiding bubbles.
Samples were immediately poisoned with HgCl2 (0.2 mL) to
stop biochemical reactions, which may alter the carbon iso-
topic composition of CO2, and bottles were then sealed by
aluminium caps with high-density butyl-rubber plugs. Wa-
ter samples for δ18O analysis (50 mL) were filled into glass
bottles and sealed by plastic screw-on caps. The oxygen and
carbon isotope mass ratios of the water samples were mea-
sured in the stable isotope laboratories of AWI Potsdam with
a Finnigan-MAT Delta-S mass spectrometer with two cou-
pled equilibration units (δ18O) and of MARUM (Bremen)
using a Gasbench coupled to a MAT 252 mass spectrometer
(δ13CDIC), with a precision and accuracy of at least±0.1 and
www.biogeosciences.net/12/1733/2015/ Biogeosciences, 12, 1733–1752, 2015
1736 T. Pados et al.: Oxygen and carbon isotope composition of modern planktic foraminifera
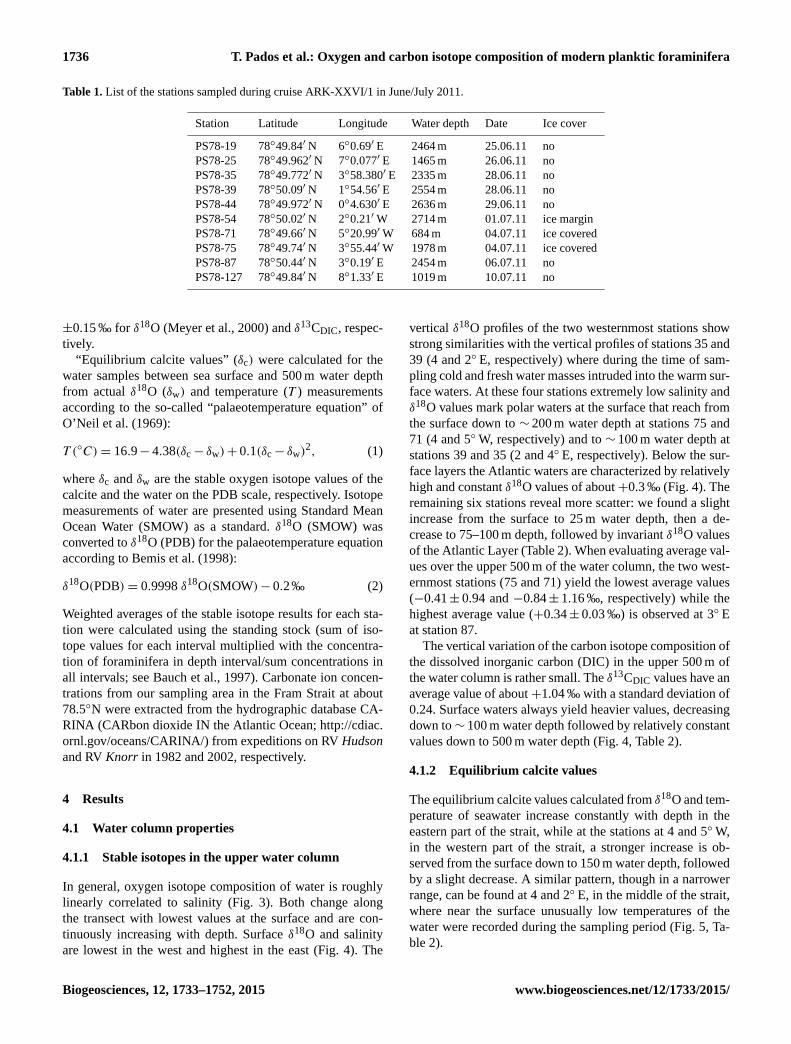
Table 1. List of the stations sampled during cruise ARK-XXVI/1 in June/July 2011.
Station Latitude Longitude Water depth Date Ice cover
PS78-19 78◦49.84′ N 6◦0.69′ E 2464 m 25.06.11 no
PS78-25 78◦49.962′ N 7◦0.077′ E 1465 m 26.06.11 no
PS78-35 78◦49.772′ N 3◦58.380′ E 2335 m 28.06.11 no
PS78-39 78◦50.09′ N 1◦54.56′ E 2554 m 28.06.11 no
PS78-44 78◦49.972′ N 0◦4.630′ E 2636 m 29.06.11 no
PS78-54 78◦50.02′ N 2◦0.21′W 2714 m 01.07.11 ice margin
PS78-71 78◦49.66′ N 5◦20.99′W 684 m 04.07.11 ice covered
PS78-75 78◦49.74′ N 3◦55.44′W 1978 m 04.07.11 ice covered
PS78-87 78◦50.44′ N 3◦0.19′ E 2454 m 06.07.11 no
PS78-127 78◦49.84′ N 8◦1.33′ E 1019 m 10.07.11 no
±0.15 ‰ for δ18O (Meyer et al., 2000) and δ13CDIC, respec-
tively.
“Equilibrium calcite values” (δc) were calculated for the
water samples between sea surface and 500 m water depth
from actual δ18O (δw) and temperature (T ) measurements
according to the so-called “palaeotemperature equation” of
O’Neil et al. (1969):
T (◦C)= 16.9− 4.38(δc− δw)+ 0.1(δc− δw)2, (1)
where δc and δw are the stable oxygen isotope values of the
calcite and the water on the PDB scale, respectively. Isotope
measurements of water are presented using Standard Mean
Ocean Water (SMOW) as a standard. δ18O (SMOW) was
converted to δ18O (PDB) for the palaeotemperature equation
according to Bemis et al. (1998):
δ18O(PDB)= 0.9998 δ18O(SMOW)− 0.2‰ (2)
Weighted averages of the stable isotope results for each sta-
tion were calculated using the standing stock (sum of iso-
tope values for each interval multiplied with the concentra-
tion of foraminifera in depth interval/sum concentrations in
all intervals; see Bauch et al., 1997). Carbonate ion concen-
trations from our sampling area in the Fram Strait at about
78.5◦N were extracted from the hydrographic database CA-
RINA (CARbon dioxide IN the Atlantic Ocean; http://cdiac.
ornl.gov/oceans/CARINA/) from expeditions on RV Hudson
and RV Knorr in 1982 and 2002, respectively.
4 Results
4.1 Water column properties
4.1.1 Stable isotopes in the upper water column
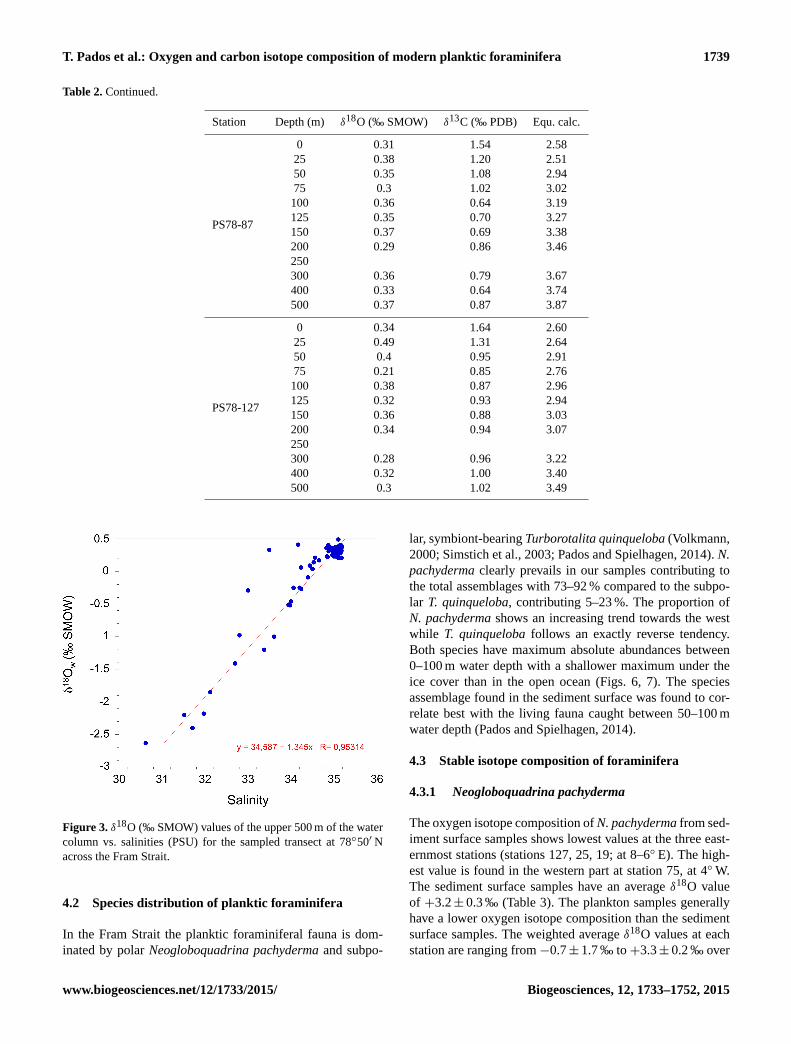
In general, oxygen isotope composition of water is roughly
linearly correlated to salinity (Fig. 3). Both change along
the transect with lowest values at the surface and are con-
tinuously increasing with depth. Surface δ18O and salinity
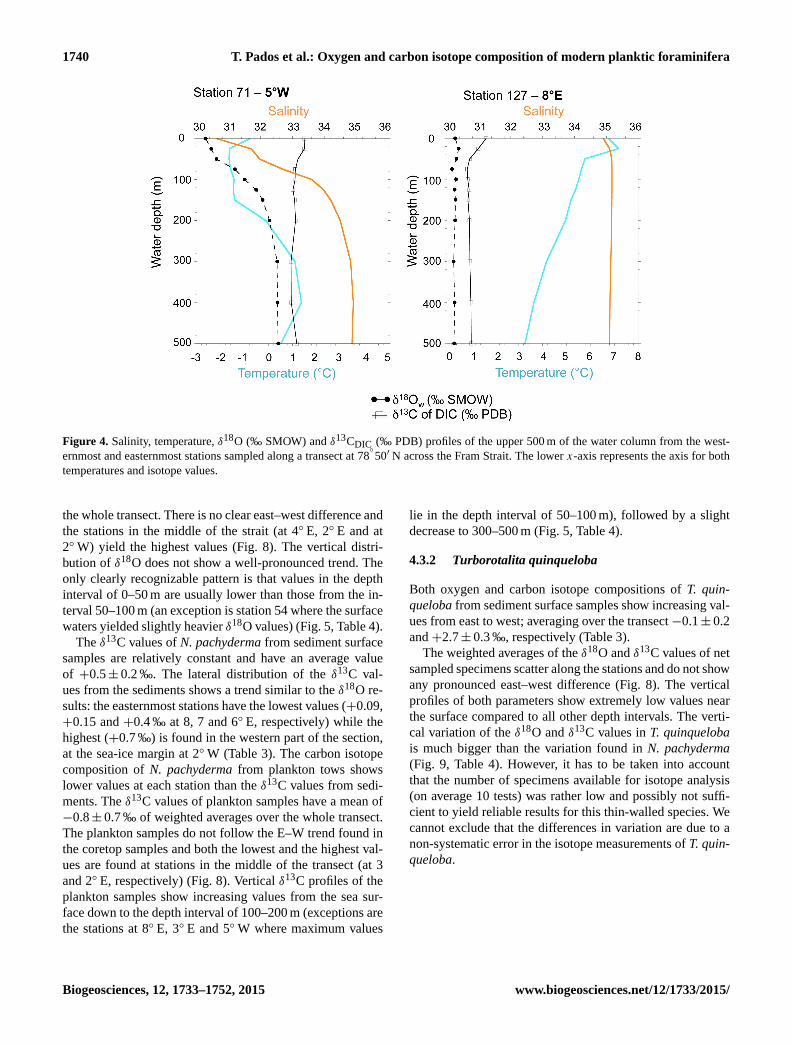
are lowest in the west and highest in the east (Fig. 4). The
vertical δ18O profiles of the two westernmost stations show
strong similarities with the vertical profiles of stations 35 and
39 (4 and 2◦ E, respectively) where during the time of sam-
pling cold and fresh water masses intruded into the warm sur-
face waters. At these four stations extremely low salinity and
δ18O values mark polar waters at the surface that reach from
the surface down to ∼ 200 m water depth at stations 75 and
71 (4 and 5◦W, respectively) and to ∼ 100 m water depth at
stations 39 and 35 (2 and 4◦ E, respectively). Below the sur-
face layers the Atlantic waters are characterized by relatively
high and constant δ18O values of about+0.3 ‰ (Fig. 4). The
remaining six stations reveal more scatter: we found a slight
increase from the surface to 25 m water depth, then a de-
crease to 75–100 m depth, followed by invariant δ18O values
of the Atlantic Layer (Table 2). When evaluating average val-
ues over the upper 500 m of the water column, the two west-
ernmost stations (75 and 71) yield the lowest average values
(−0.41± 0.94 and −0.84± 1.16 ‰, respectively) while the
highest average value (+0.34± 0.03 ‰) is observed at 3◦ E
at station 87.
The vertical variation of the carbon isotope composition of
the dissolved inorganic carbon (DIC) in the upper 500 m of
the water column is rather small. The δ13CDIC values have an
average value of about+1.04 ‰ with a standard deviation of
0.24. Surface waters always yield heavier values, decreasing
down to∼ 100 m water depth followed by relatively constant
values down to 500 m water depth (Fig. 4, Table 2).
4.1.2 Equilibrium calcite values
The equilibrium calcite values calculated from δ18O and tem-
perature of seawater increase constantly with depth in the
eastern part of the strait, while at the stations at 4 and 5◦W,
in the western part of the strait, a stronger increase is ob-
served from the surface down to 150 m water depth, followed
by a slight decrease. A similar pattern, though in a narrower
range, can be found at 4 and 2◦ E, in the middle of the strait,
where near the surface unusually low temperatures of the
water were recorded during the sampling period (Fig. 5, Ta-
ble 2).
Biogeosciences, 12, 1733–1752, 2015 www.biogeosciences.net/12/1733/2015/
T. Pados et al.: Oxygen and carbon isotope composition of modern planktic foraminifera 1737
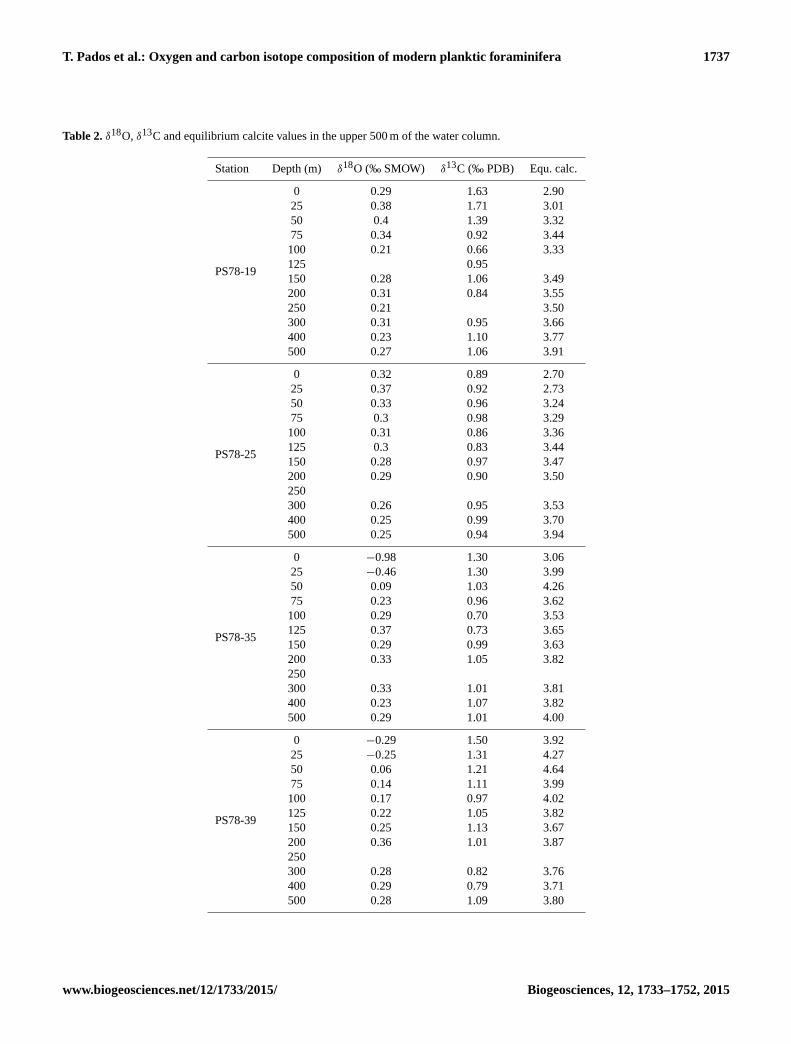
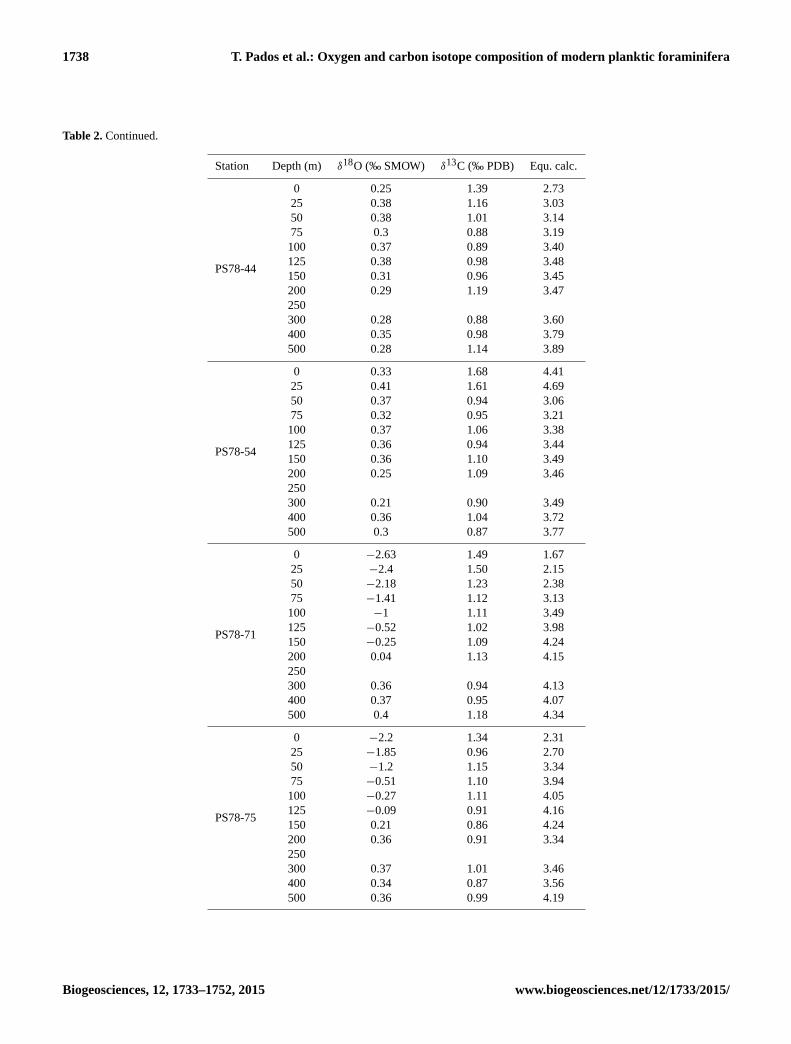
Table 2. δ18O, δ13C and equilibrium calcite values in the upper 500 m of the water column.
Station Depth (m) δ18O (‰ SMOW) δ13C (‰ PDB) Equ. calc.
PS78-19
0 0.29 1.63 2.90
25 0.38 1.71 3.01
50 0.4 1.39 3.32
75 0.34 0.92 3.44
100 0.21 0.66 3.33
125 0.95
150 0.28 1.06 3.49
200 0.31 0.84 3.55
250 0.21 3.50
300 0.31 0.95 3.66
400 0.23 1.10 3.77
500 0.27 1.06 3.91
PS78-25
0 0.32 0.89 2.70
25 0.37 0.92 2.73
50 0.33 0.96 3.24
75 0.3 0.98 3.29
100 0.31 0.86 3.36
125 0.3 0.83 3.44
150 0.28 0.97 3.47
200 0.29 0.90 3.50
250
300 0.26 0.95 3.53
400 0.25 0.99 3.70
500 0.25 0.94 3.94
PS78-35
0 −0.98 1.30 3.06
25 −0.46 1.30 3.99
50 0.09 1.03 4.26
75 0.23 0.96 3.62
100 0.29 0.70 3.53
125 0.37 0.73 3.65
150 0.29 0.99 3.63
200 0.33 1.05 3.82
250
300 0.33 1.01 3.81
400 0.23 1.07 3.82
500 0.29 1.01 4.00
PS78-39
0 −0.29 1.50 3.92
25 −0.25 1.31 4.27
50 0.06 1.21 4.64
75 0.14 1.11 3.99
100 0.17 0.97 4.02
125 0.22 1.05 3.82
150 0.25 1.13 3.67
200 0.36 1.01 3.87
250
300 0.28 0.82 3.76
400 0.29 0.79 3.71
500 0.28 1.09 3.80
www.biogeosciences.net/12/1733/2015/ Biogeosciences, 12, 1733–1752, 2015
1738 T. Pados et al.: Oxygen and carbon isotope composition of modern planktic foraminifera
Table 2. Continued.
Station Depth (m) δ18O (‰ SMOW) δ13C (‰ PDB) Equ. calc.
PS78-44
0 0.25 1.39 2.73
25 0.38 1.16 3.03
50 0.38 1.01 3.14
75 0.3 0.88 3.19
100 0.37 0.89 3.40
125 0.38 0.98 3.48
150 0.31 0.96 3.45
200 0.29 1.19 3.47
250
300 0.28 0.88 3.60
400 0.35 0.98 3.79
500 0.28 1.14 3.89
PS78-54
0 0.33 1.68 4.41
25 0.41 1.61 4.69
50 0.37 0.94 3.06
75 0.32 0.95 3.21
100 0.37 1.06 3.38
125 0.36 0.94 3.44
150 0.36 1.10 3.49
200 0.25 1.09 3.46
250
300 0.21 0.90 3.49
400 0.36 1.04 3.72
500 0.3 0.87 3.77
PS78-71
0 −2.63 1.49 1.67
25 −2.4 1.50 2.15
50 −2.18 1.23 2.38
75 −1.41 1.12 3.13
100 −1 1.11 3.49
125 −0.52 1.02 3.98
150 −0.25 1.09 4.24
200 0.04 1.13 4.15
250
300 0.36 0.94 4.13
400 0.37 0.95 4.07
500 0.4 1.18 4.34
PS78-75
0 −2.2 1.34 2.31
25 −1.85 0.96 2.70
50 −1.2 1.15 3.34
75 −0.51 1.10 3.94
100 −0.27 1.11 4.05
125 −0.09 0.91 4.16
150 0.21 0.86 4.24
200 0.36 0.91 3.34
250
300 0.37 1.01 3.46
400 0.34 0.87 3.56
500 0.36 0.99 4.19
Biogeosciences, 12, 1733–1752, 2015 www.biogeosciences.net/12/1733/2015/
T. Pados et al.: Oxygen and carbon isotope composition of modern planktic foraminifera 1739
Table 2. Continued.
Station Depth (m) δ18O (‰ SMOW) δ13C (‰ PDB) Equ. calc.
PS78-87
0 0.31 1.54 2.58
25 0.38 1.20 2.51
50 0.35 1.08 2.94
75 0.3 1.02 3.02
100 0.36 0.64 3.19
125 0.35 0.70 3.27
150 0.37 0.69 3.38
200 0.29 0.86 3.46
250
300 0.36 0.79 3.67
400 0.33 0.64 3.74
500 0.37 0.87 3.87
PS78-127
0 0.34 1.64 2.60
25 0.49 1.31 2.64
50 0.4 0.95 2.91
75 0.21 0.85 2.76
100 0.38 0.87 2.96
125 0.32 0.93 2.94
150 0.36 0.88 3.03
200 0.34 0.94 3.07
250
300 0.28 0.96 3.22
400 0.32 1.00 3.40
500 0.3 1.02 3.49
Figure 3. δ18O (‰ SMOW) values of the upper 500 m of the water
column vs. salinities (PSU) for the sampled transect at 78◦50′ N
across the Fram Strait.
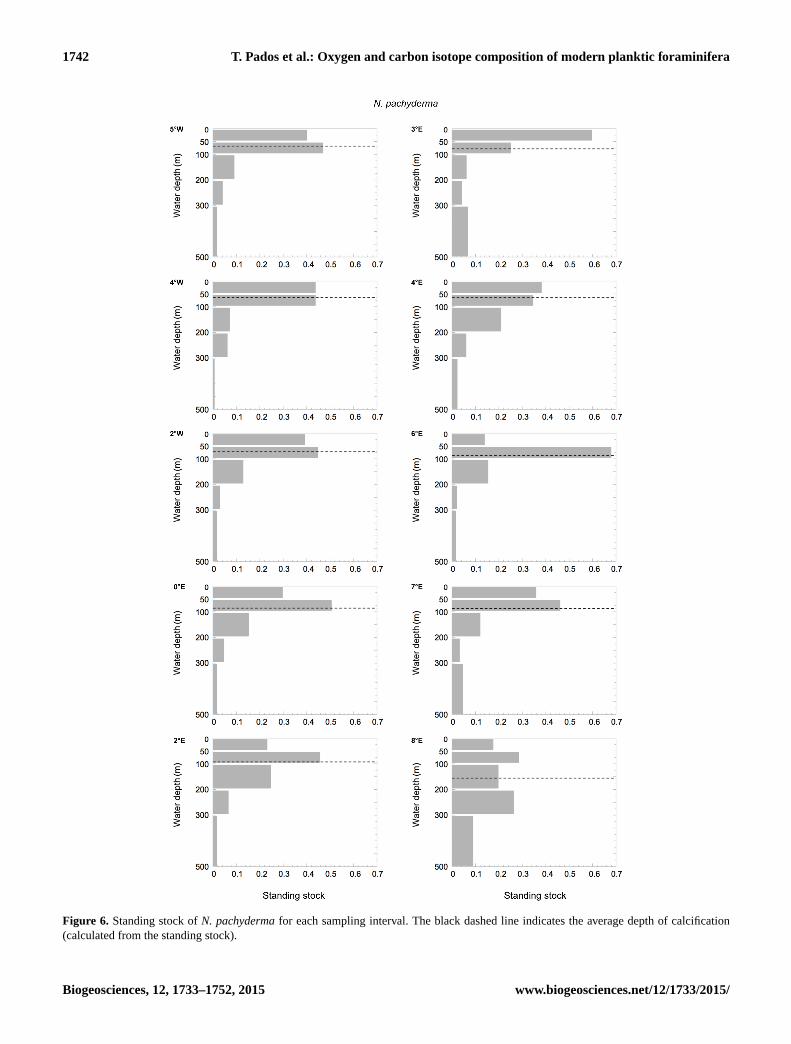
4.2 Species distribution of planktic foraminifera
In the Fram Strait the planktic foraminiferal fauna is dom-
inated by polar Neogloboquadrina pachyderma and subpo-
lar, symbiont-bearing Turborotalita quinqueloba (Volkmann,
2000; Simstich et al., 2003; Pados and Spielhagen, 2014). N.
pachyderma clearly prevails in our samples contributing to
the total assemblages with 73–92 % compared to the subpo-
lar T. quinqueloba, contributing 5–23 %. The proportion of
N. pachyderma shows an increasing trend towards the west
while T. quinqueloba follows an exactly reverse tendency.
Both species have maximum absolute abundances between
0–100 m water depth with a shallower maximum under the
ice cover than in the open ocean (Figs. 6, 7). The species
assemblage found in the sediment surface was found to cor-
relate best with the living fauna caught between 50–100 m
water depth (Pados and Spielhagen, 2014).
4.3 Stable isotope composition of foraminifera
4.3.1 Neogloboquadrina pachyderma
The oxygen isotope composition of N. pachyderma from sed-
iment surface samples shows lowest values at the three east-
ernmost stations (stations 127, 25, 19; at 8–6◦ E). The high-
est value is found in the western part at station 75, at 4◦W.
The sediment surface samples have an average δ18O value
of +3.2± 0.3 ‰ (Table 3). The plankton samples generally
have a lower oxygen isotope composition than the sediment
surface samples. The weighted average δ18O values at each
station are ranging from −0.7± 1.7 ‰ to +3.3± 0.2 ‰ over
www.biogeosciences.net/12/1733/2015/ Biogeosciences, 12, 1733–1752, 2015
1740 T. Pados et al.: Oxygen and carbon isotope composition of modern planktic foraminifera
Figure 4. Salinity, temperature, δ18O (‰ SMOW) and δ13CDIC (‰ PDB) profiles of the upper 500 m of the water column from the west-
ernmost and easternmost stations sampled along a transect at 78◦
50′ N across the Fram Strait. The lower x-axis represents the axis for both
temperatures and isotope values.
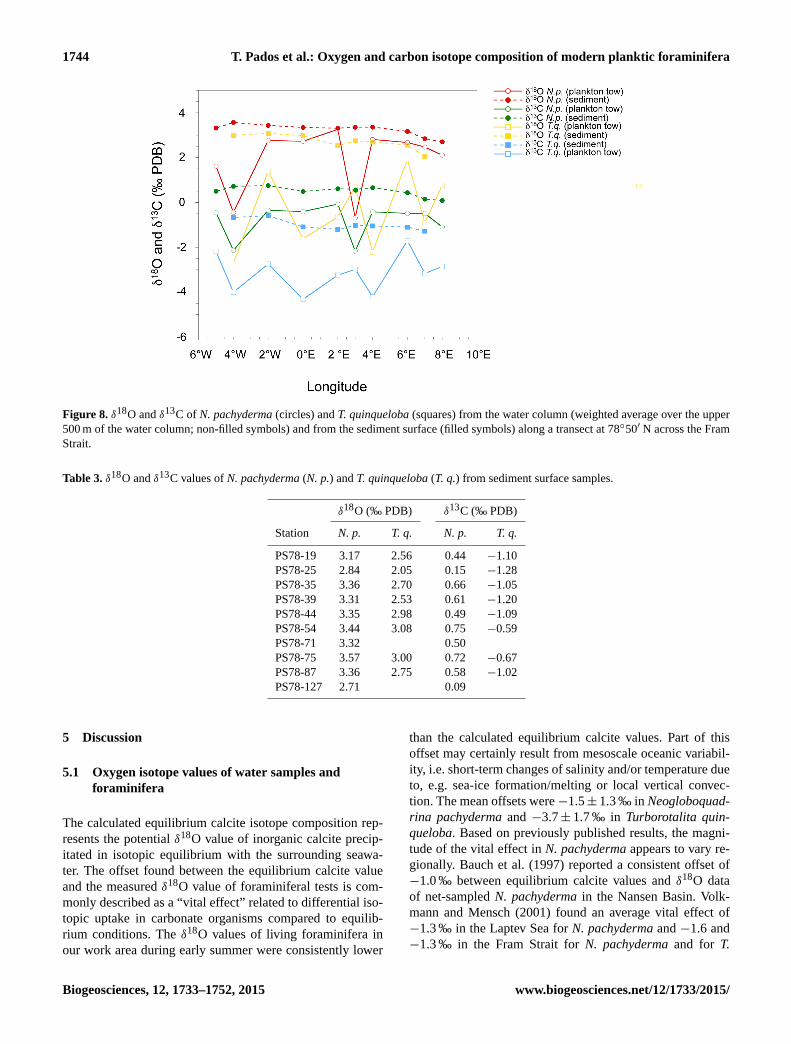
the whole transect. There is no clear east–west difference and
the stations in the middle of the strait (at 4◦ E, 2◦ E and at
2◦W) yield the highest values (Fig. 8). The vertical distri-
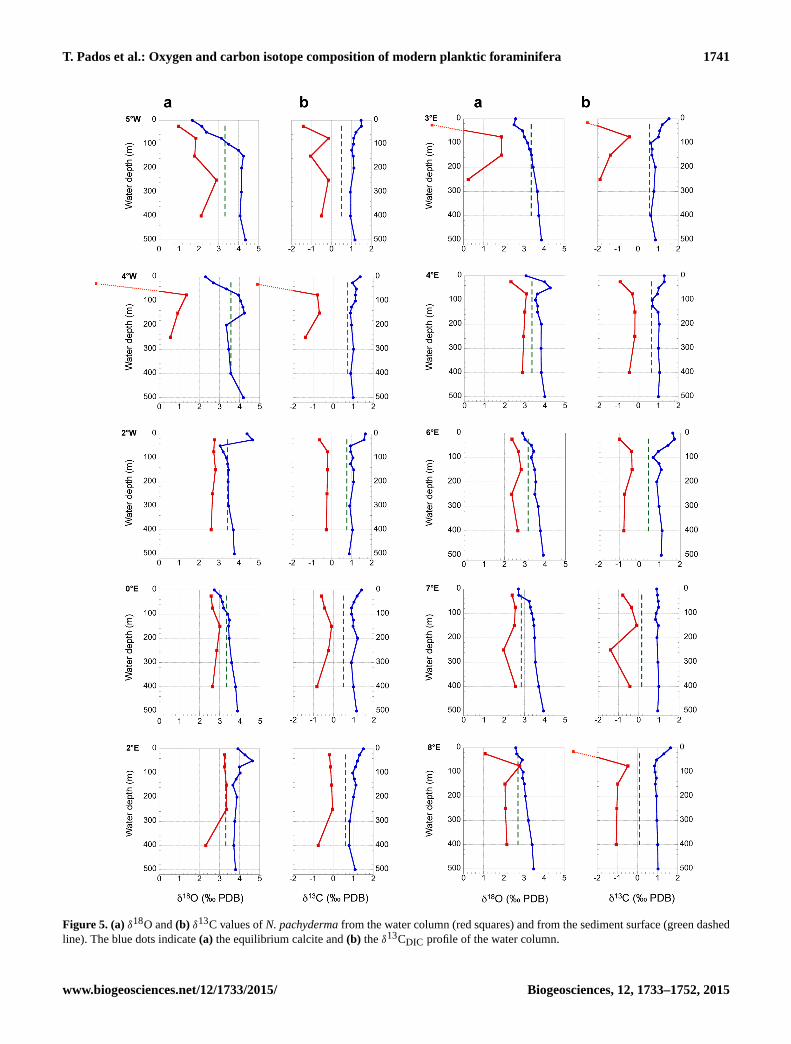
bution of δ18O does not show a well-pronounced trend. The
only clearly recognizable pattern is that values in the depth
interval of 0–50 m are usually lower than those from the in-
terval 50–100 m (an exception is station 54 where the surface
waters yielded slightly heavier δ18O values) (Fig. 5, Table 4).
The δ13C values of N. pachyderma from sediment surface
samples are relatively constant and have an average value
of +0.5± 0.2 ‰. The lateral distribution of the δ13C val-
ues from the sediments shows a trend similar to the δ18O re-
sults: the easternmost stations have the lowest values (+0.09,
+0.15 and +0.4 ‰ at 8, 7 and 6◦ E, respectively) while the
highest (+0.7 ‰) is found in the western part of the section,
at the sea-ice margin at 2◦W (Table 3). The carbon isotope
composition of N. pachyderma from plankton tows shows
lower values at each station than the δ13C values from sedi-
ments. The δ13C values of plankton samples have a mean of
−0.8± 0.7 ‰ of weighted averages over the whole transect.
The plankton samples do not follow the E–W trend found in
the coretop samples and both the lowest and the highest val-
ues are found at stations in the middle of the transect (at 3
and 2◦ E, respectively) (Fig. 8). Vertical δ13C profiles of the
plankton samples show increasing values from the sea sur-
face down to the depth interval of 100–200 m (exceptions are
the stations at 8◦ E, 3◦ E and 5◦W where maximum values
lie in the depth interval of 50–100 m), followed by a slight
decrease to 300–500 m (Fig. 5, Table 4).
4.3.2 Turborotalita quinqueloba
Both oxygen and carbon isotope compositions of T. quin-
queloba from sediment surface samples show increasing val-
ues from east to west; averaging over the transect−0.1± 0.2
and +2.7± 0.3 ‰, respectively (Table 3).
The weighted averages of the δ18O and δ13C values of net
sampled specimens scatter along the stations and do not show
any pronounced east–west difference (Fig. 8). The vertical
profiles of both parameters show extremely low values near
the surface compared to all other depth intervals. The verti-
cal variation of the δ18O and δ13C values in T. quinqueloba
is much bigger than the variation found in N. pachyderma
(Fig. 9, Table 4). However, it has to be taken into account
that the number of specimens available for isotope analysis
(on average 10 tests) was rather low and possibly not suffi-
cient to yield reliable results for this thin-walled species. We
cannot exclude that the differences in variation are due to a
non-systematic error in the isotope measurements of T. quin-
queloba.
Biogeosciences, 12, 1733–1752, 2015 www.biogeosciences.net/12/1733/2015/
T. Pados et al.: Oxygen and carbon isotope composition of modern planktic foraminifera 1741
Figure 5. (a) δ18O and (b) δ13C values of N. pachyderma from the water column (red squares) and from the sediment surface (green dashed
line). The blue dots indicate (a) the equilibrium calcite and (b) the δ13CDIC profile of the water column.
www.biogeosciences.net/12/1733/2015/ Biogeosciences, 12, 1733–1752, 2015
1742 T. Pados et al.: Oxygen and carbon isotope composition of modern planktic foraminifera
Figure 6. Standing stock of N. pachyderma for each sampling interval. The black dashed line indicates the average depth of calcification
(calculated from the standing stock).
Biogeosciences, 12, 1733–1752, 2015 www.biogeosciences.net/12/1733/2015/
T. Pados et al.: Oxygen and carbon isotope composition of modern planktic foraminifera 1743
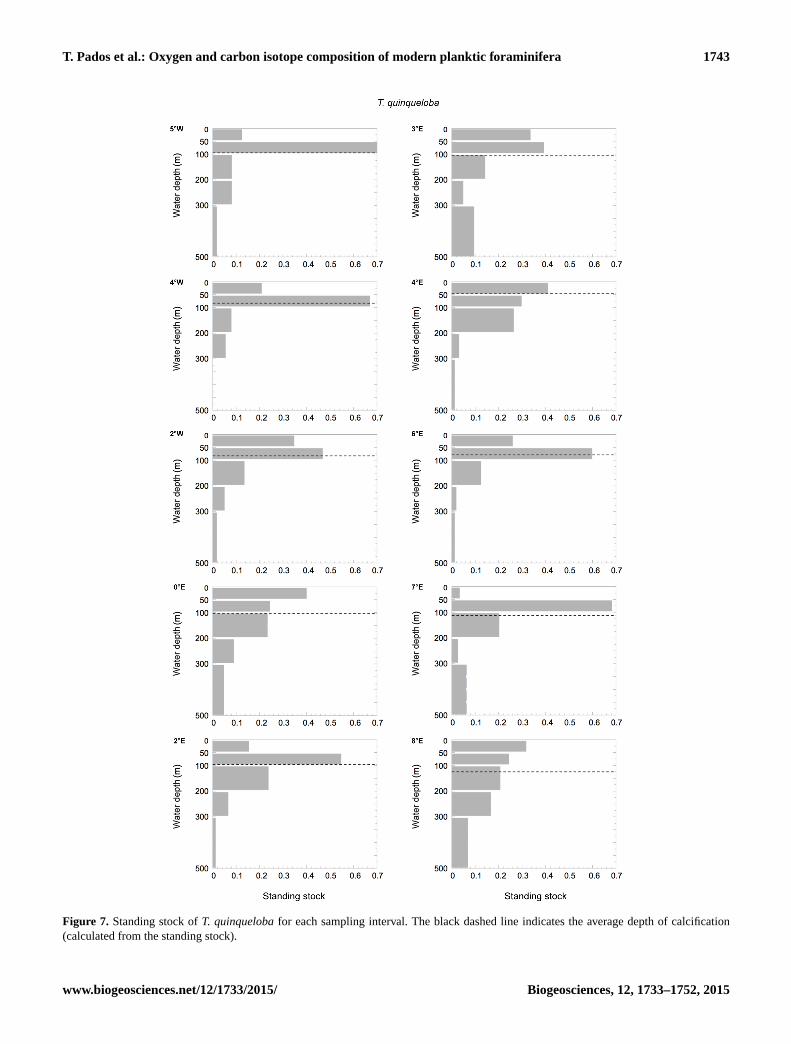
Figure 7. Standing stock of T. quinqueloba for each sampling interval. The black dashed line indicates the average depth of calcification
(calculated from the standing stock).
www.biogeosciences.net/12/1733/2015/ Biogeosciences, 12, 1733–1752, 2015
1744 T. Pados et al.: Oxygen and carbon isotope composition of modern planktic foraminifera
Figure 8. δ18O and δ13C of N. pachyderma (circles) and T. quinqueloba (squares) from the water column (weighted average over the upper
500 m of the water column; non-filled symbols) and from the sediment surface (filled symbols) along a transect at 78◦50′ N across the Fram
Strait.
Table 3. δ18O and δ13C values of N. pachyderma (N. p.) and T. quinqueloba (T. q.) from sediment surface samples.
δ18O (‰ PDB) δ13C (‰ PDB)
Station N. p. T. q. N. p. T. q.
PS78-19 3.17 2.56 0.44 −1.10
PS78-25 2.84 2.05 0.15 −1.28
PS78-35 3.36 2.70 0.66 −1.05
PS78-39 3.31 2.53 0.61 −1.20
PS78-44 3.35 2.98 0.49 −1.09
PS78-54 3.44 3.08 0.75 −0.59
PS78-71 3.32 0.50
PS78-75 3.57 3.00 0.72 −0.67
PS78-87 3.36 2.75 0.58 −1.02
PS78-127 2.71 0.09
5 Discussion
5.1 Oxygen isotope values of water samples and
foraminifera
The calculated equilibrium calcite isotope composition rep-
resents the potential δ18O value of inorganic calcite precip-
itated in isotopic equilibrium with the surrounding seawa-
ter. The offset found between the equilibrium calcite value
and the measured δ18O value of foraminiferal tests is com-
monly described as a “vital effect” related to differential iso-
topic uptake in carbonate organisms compared to equilib-
rium conditions. The δ18O values of living foraminifera in
our work area during early summer were consistently lower
than the calculated equilibrium calcite values. Part of this
offset may certainly result from mesoscale oceanic variabil-
ity, i.e. short-term changes of salinity and/or temperature due
to, e.g. sea-ice formation/melting or local vertical convec-
tion. The mean offsets were−1.5± 1.3 ‰ in Neogloboquad-
rina pachyderma and −3.7± 1.7 ‰ in Turborotalita quin-
queloba. Based on previously published results, the magni-
tude of the vital effect in N. pachyderma appears to vary re-
gionally. Bauch et al. (1997) reported a consistent offset of
−1.0 ‰ between equilibrium calcite values and δ18O data
of net-sampled N. pachyderma in the Nansen Basin. Volk-
mann and Mensch (2001) found an average vital effect of
−1.3 ‰ in the Laptev Sea for N. pachyderma and −1.6 and
−1.3 ‰ in the Fram Strait for N. pachyderma and for T.
Biogeosciences, 12, 1733–1752, 2015 www.biogeosciences.net/12/1733/2015/
T. Pados et al.: Oxygen and carbon isotope composition of modern planktic foraminifera 1745
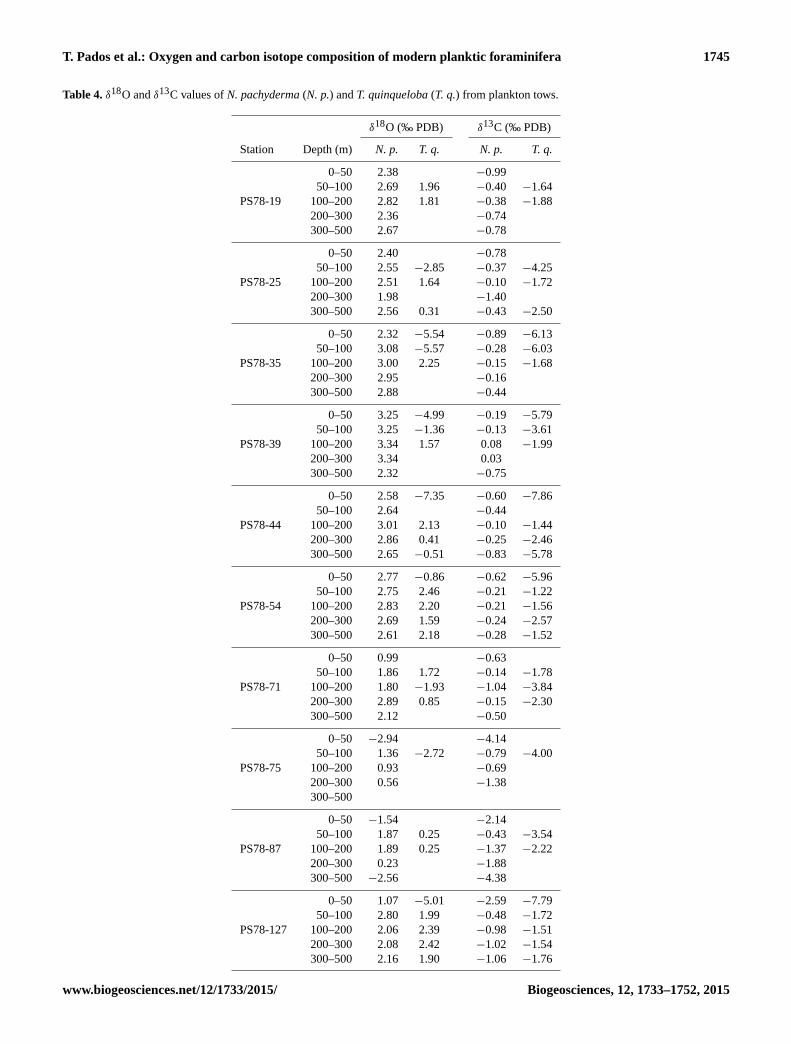
Table 4. δ18O and δ13C values of N. pachyderma (N. p.) and T. quinqueloba (T. q.) from plankton tows.
δ18O (‰ PDB) δ13C (‰ PDB)
Station Depth (m) N. p. T. q. N. p. T. q.
0–50 2.38 −0.99
50–100 2.69 1.96 −0.40 −1.64
PS78-19 100–200 2.82 1.81 −0.38 −1.88
200–300 2.36 −0.74
300–500 2.67 −0.78
0–50 2.40 −0.78
50–100 2.55 −2.85 −0.37 −4.25
PS78-25 100–200 2.51 1.64 −0.10 −1.72
200–300 1.98 −1.40
300–500 2.56 0.31 −0.43 −2.50
0–50 2.32 −5.54 −0.89 −6.13
50–100 3.08 −5.57 −0.28 −6.03
PS78-35 100–200 3.00 2.25 −0.15 −1.68
200–300 2.95 −0.16
300–500 2.88 −0.44
0–50 3.25 −4.99 −0.19 −5.79
50–100 3.25 −1.36 −0.13 −3.61
PS78-39 100–200 3.34 1.57 0.08 −1.99
200–300 3.34 0.03
300–500 2.32 −0.75
0–50 2.58 −7.35 −0.60 −7.86
50–100 2.64 −0.44
PS78-44 100–200 3.01 2.13 −0.10 −1.44
200–300 2.86 0.41 −0.25 −2.46
300–500 2.65 −0.51 −0.83 −5.78
0–50 2.77 −0.86 −0.62 −5.96
50–100 2.75 2.46 −0.21 −1.22
PS78-54 100–200 2.83 2.20 −0.21 −1.56
200–300 2.69 1.59 −0.24 −2.57
300–500 2.61 2.18 −0.28 −1.52
0–50 0.99 −0.63
50–100 1.86 1.72 −0.14 −1.78
PS78-71 100–200 1.80 −1.93 −1.04 −3.84
200–300 2.89 0.85 −0.15 −2.30
300–500 2.12 −0.50
0–50 −2.94 −4.14
50–100 1.36 −2.72 −0.79 −4.00
PS78-75 100–200 0.93 −0.69
200–300 0.56 −1.38
300–500
0–50 −1.54 −2.14
50–100 1.87 0.25 −0.43 −3.54
PS78-87 100–200 1.89 0.25 −1.37 −2.22
200–300 0.23 −1.88
300–500 −2.56 −4.38
0–50 1.07 −5.01 −2.59 −7.79
50–100 2.80 1.99 −0.48 −1.72
PS78-127 100–200 2.06 2.39 −0.98 −1.51
200–300 2.08 2.42 −1.02 −1.54
300–500 2.16 1.90 −1.06 −1.76
www.biogeosciences.net/12/1733/2015/ Biogeosciences, 12, 1733–1752, 2015
1746 T. Pados et al.: Oxygen and carbon isotope composition of modern planktic foraminifera
quinqueloba, respectively. Plankton tows from various hy-
drographic regimes in the Nordic Seas revealed vital offsets
of −1.0 and −1.1 ‰ for N. pachyderma and T. quinqueloba,
respectively (Simstich et al., 2003). Significantly smaller off-
sets were reported from the western subpolar North Atlantic,
calculated from shells collected with sediment traps (Jonkers
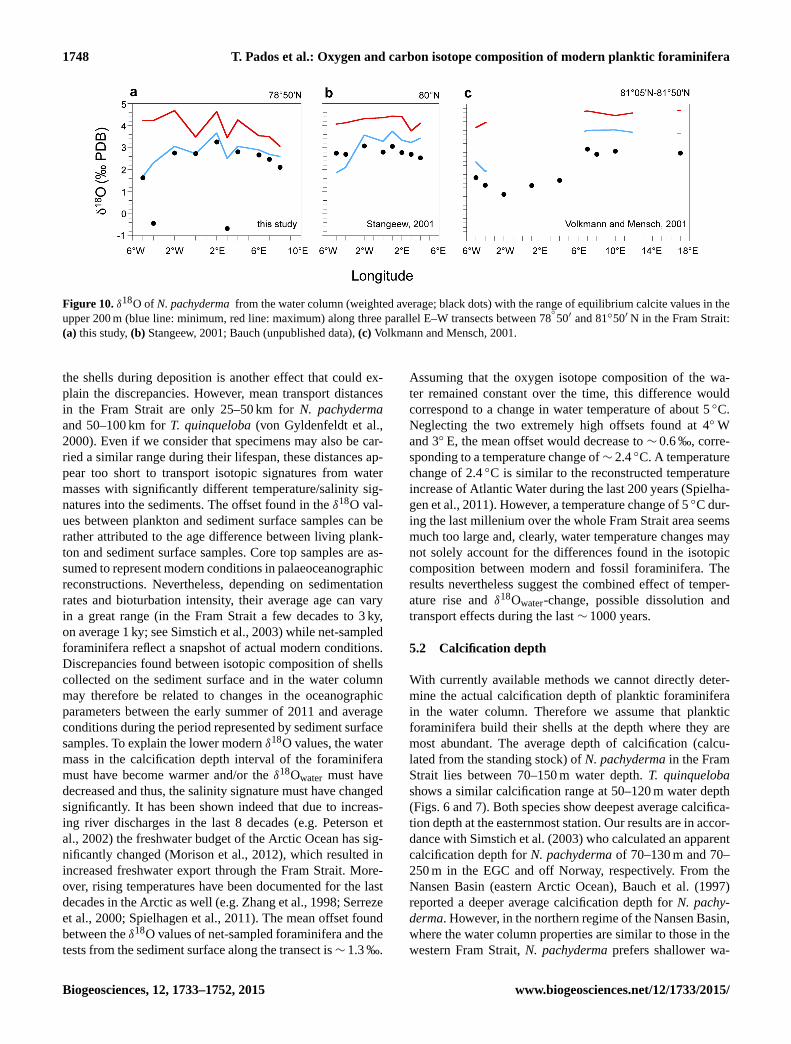
et al., 2013). Even studies conducted in the Fram Strait reveal
slightly different values (see Stangeew, 2001; Volkmann and
Mensch, 2001). Figure 10 comprises results on δ18ON.p. and
equilibrium calcite values in the upper water column reported
from the Fram Strait.
In our study T. quinqueloba shows larger offsets between
the equilibrium calcite values and the measured δ18O val-
ues than N. pachyderma (on average −3.7 and −1.5 ‰,
respectively). Earlier works (e.g. Fairbanks et al., 1980;
Loncaric et al., 2006) also recorded a larger negative offset in
spinose species compared to nonspinose species. Moreover,
symbiont-bearing species, like T. quinqueloba, are known to
be more depleted in 18O as a consequence of higher CO2 fix-
ation caused by photosynthesis (Bijma et al., 1990; Spero et
al., 1997). In N. pachyderma we found a clear east–west dif-
ference in the magnitude of the vital effect along the transect,
similar to observations by Volkmann and Mensch (2001). In
their study the eastern and western part of the strait yielded
significantly different offsets, with highest deviations from
the equilibrium calcite values in the west. They concluded
that ice coverage increases the magnitude of the vital effect.
In our samples in N. pachyderma the strongest disequilib-
rium was indeed found at the two ice-covered stations (−4.0
and −1.8 ‰, at 4 and 5◦W, respectively) and at station 87
(−3.9 ‰, at 4◦ E). These results are also in line with obser-
vations of Bauch et al. (1997) who found slightly increas-
ing isotopic differences between water and plankton samples
with decreasing salinity and temperature. Similar to these
results, Volkmann and Mensch (2001) observed greater vi-
tal offset in the cold and less saline waters of the west-
ern Fram Strait. They concluded that unfavourable condi-
tions here make the individuals grow faster (i.e. increase
their calcification rate). An increased calcification rate de-
creases the δ18O of tests (McConnaughey, 1989) and may
thus increase the disequilibrium. While this hypothesis can
explain high offsets at increased calcification rates, the valid-
ity of the hypothesis seems rather unlikely as unfavourable
conditions generally lead to lower metabolism and thus, de-
creased calcification rates. Moreover, lower temperatures de-
crease metabolic rates in all organisms (Hemmingsen, 1960;
Gillooly et al., 2001). The abrupt increase in the offset close
to the sea-ice margin may rather be explained by increased
primary production, associated with the ice margin where
ice melting increases stratification and consequently the sta-
bility of the water column, which triggers phytoplankton
blooms (see Alexander, 1980; Carstens et al., 1997; Pados
and Spielhagen, 2014). During biological production dis-
solved inorganic carbon is consumed. This considerably in-
creases pH and consequently the carbonate ion concentration
([CO2−3 ]) of the water (Chierchi and Franson, 2009). Spero et
al. (1997) showed that increasing seawater [CO2−3 ] decreases
the 18O / 16O ratios of the shells of foraminifera and may
thus simultaneously increase the vital effect. Still, the effect
of carbonate ion concentrations alone cannot explain the high
deviation from equilibrium calcite found at the station at 4◦ E
where no increased primary production is expected. A pos-
sible reason for the increased vital effect at the stations at
5◦W, 4◦W and 4◦ E might also be a sampling during dif-
ferent ontogenetic stages. N. pachyderma is known to repro-
duce on a synodic lunar cycle (Bijma et al., 1990; Schiebel
and Hemleben, 2005) and as these three stations were sam-
pled in sequence in the second half of the cruise, it is possible
that in the respective samples there were more specimens in
early life stages compared to the stations sampled 7–10 days
before. Early ontogenetic stages are associated with higher
respiration and calcification rates (Hemleben et al., 1989).
Rapidly growing skeletons tend to show depletion in both13C and 18O (McConnaughey, 1989), which could account
for the increased vital effect observed at the respective sta-
tions.
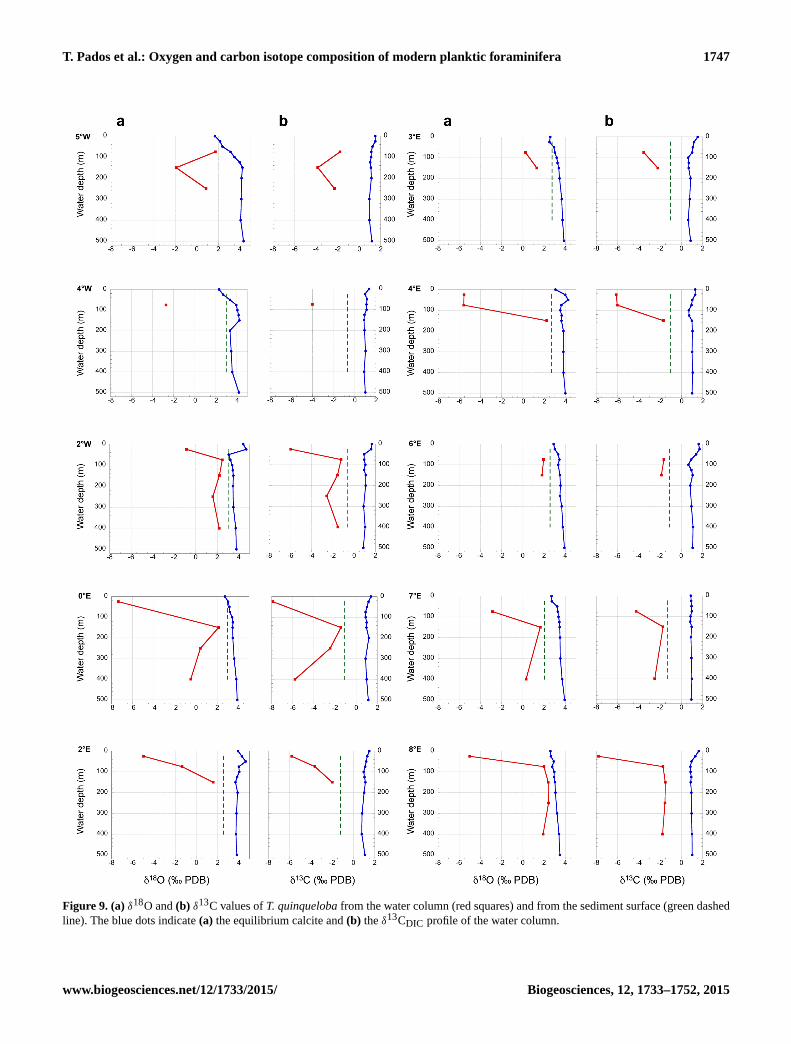
In contrast to N. pachyderma, the offsets found between
equilibrium calcite values and the δ18O values of T. quin-
queloba do not follow a clear trend along the transect and
show great scatter (Fig. 9). However, the low numbers of
specimens found in the samples at most of the stations did
not allow us to determine δ18O over the whole water column
sampled. Moreover, as a consequence, lower numbers of tests
(on average ten) were used for stable isotope analysis than in
N. pachyderma (25), which might also account for the scatter
in both δ13C and δ18O values in T. quinqueloba. We therefore
refrain from discussing the vital effect in T. quinqueloba.
Our analysis shows that recent specimens of planktic
foraminifera from the water column have a lower oxygen
isotopic value than fossils on the sediment surface (Figs. 5,
9). This is in agreement with a number of studies conducted
in different regions of the world (e.g. Duplessy et al., 1981;
Schmidt and Mulitza, 2002). Berger (1970) suggested in his
hypothesis on intraspecific selective dissolution that within
one species preferentially the thin-shelled individuals are dis-
solved during deposition. These tests are secreted during the
warmest period of the year and thus, their dissolution in-
creases the average δ18O value of the species in the core-
top samples. Even though the length of growing season of
planktic foraminifera in the Fram Strait is unknown, it has
been shown that in the Nordic Seas the production maximum
of planktic foraminifera occurs during summer (Kohfeld et
al., 1996; Jonkers et al., 2010), with almost zero production
during other seasons. This means that the majority of the
specimens calcifies the shells under similar conditions. Ac-
cordingly, differences in the thickness of tests are not to be
expected. Therefore the hypothesis of Berger (1970) cannot
explain the isotopic differences between plankton and sedi-
ment surface samples in our study area. Lateral transport of
Biogeosciences, 12, 1733–1752, 2015 www.biogeosciences.net/12/1733/2015/
T. Pados et al.: Oxygen and carbon isotope composition of modern planktic foraminifera 1747
Figure 9. (a) δ18O and (b) δ13C values of T. quinqueloba from the water column (red squares) and from the sediment surface (green dashed
line). The blue dots indicate (a) the equilibrium calcite and (b) the δ13CDIC profile of the water column.
www.biogeosciences.net/12/1733/2015/ Biogeosciences, 12, 1733–1752, 2015
1748 T. Pados et al.: Oxygen and carbon isotope composition of modern planktic foraminifera
Figure 10. δ18O of N. pachyderma from the water column (weighted average; black dots) with the range of equilibrium calcite values in the
upper 200 m (blue line: minimum, red line: maximum) along three parallel E–W transects between 78◦
50′ and 81◦50′ N in the Fram Strait:
(a) this study, (b) Stangeew, 2001; Bauch (unpublished data), (c) Volkmann and Mensch, 2001.
the shells during deposition is another effect that could ex-
plain the discrepancies. However, mean transport distances
in the Fram Strait are only 25–50 km for N. pachyderma
and 50–100 km for T. quinqueloba (von Gyldenfeldt et al.,
2000). Even if we consider that specimens may also be car-
ried a similar range during their lifespan, these distances ap-
pear too short to transport isotopic signatures from water
masses with significantly different temperature/salinity sig-
natures into the sediments. The offset found in the δ18O val-
ues between plankton and sediment surface samples can be
rather attributed to the age difference between living plank-
ton and sediment surface samples. Core top samples are as-
sumed to represent modern conditions in palaeoceanographic
reconstructions. Nevertheless, depending on sedimentation
rates and bioturbation intensity, their average age can vary
in a great range (in the Fram Strait a few decades to 3 ky,
on average 1 ky; see Simstich et al., 2003) while net-sampled
foraminifera reflect a snapshot of actual modern conditions.
Discrepancies found between isotopic composition of shells
collected on the sediment surface and in the water column
may therefore be related to changes in the oceanographic
parameters between the early summer of 2011 and average
conditions during the period represented by sediment surface
samples. To explain the lower modern δ18O values, the water
mass in the calcification depth interval of the foraminifera
must have become warmer and/or the δ18Owater must have
decreased and thus, the salinity signature must have changed
significantly. It has been shown indeed that due to increas-
ing river discharges in the last 8 decades (e.g. Peterson et
al., 2002) the freshwater budget of the Arctic Ocean has sig-
nificantly changed (Morison et al., 2012), which resulted in
increased freshwater export through the Fram Strait. More-
over, rising temperatures have been documented for the last
decades in the Arctic as well (e.g. Zhang et al., 1998; Serreze
et al., 2000; Spielhagen et al., 2011). The mean offset found
between the δ18O values of net-sampled foraminifera and the
tests from the sediment surface along the transect is∼ 1.3 ‰.
Assuming that the oxygen isotope composition of the wa-
ter remained constant over the time, this difference would
correspond to a change in water temperature of about 5 ◦C.
Neglecting the two extremely high offsets found at 4◦W
and 3◦ E, the mean offset would decrease to ∼ 0.6 ‰, corre-
sponding to a temperature change of∼ 2.4 ◦C. A temperature
change of 2.4 ◦C is similar to the reconstructed temperature
increase of Atlantic Water during the last 200 years (Spielha-
gen et al., 2011). However, a temperature change of 5 ◦C dur-
ing the last millenium over the whole Fram Strait area seems
much too large and, clearly, water temperature changes may
not solely account for the differences found in the isotopic
composition between modern and fossil foraminifera. The
results nevertheless suggest the combined effect of temper-
ature rise and δ18Owater-change, possible dissolution and
transport effects during the last ∼ 1000 years.
5.2 Calcification depth
With currently available methods we cannot directly deter-
mine the actual calcification depth of planktic foraminifera
in the water column. Therefore we assume that planktic
foraminifera build their shells at the depth where they are
most abundant. The average depth of calcification (calcu-
lated from the standing stock) of N. pachyderma in the Fram
Strait lies between 70–150 m water depth. T. quinqueloba
shows a similar calcification range at 50–120 m water depth
(Figs. 6 and 7). Both species show deepest average calcifica-
tion depth at the easternmost station. Our results are in accor-
dance with Simstich et al. (2003) who calculated an apparent
calcification depth for N. pachyderma of 70–130 m and 70–
250 m in the EGC and off Norway, respectively. From the
Nansen Basin (eastern Arctic Ocean), Bauch et al. (1997)
reported a deeper average calcification depth for N. pachy-
derma. However, in the northern regime of the Nansen Basin,
where the water column properties are similar to those in the
western Fram Strait, N. pachyderma prefers shallower wa-
Biogeosciences, 12, 1733–1752, 2015 www.biogeosciences.net/12/1733/2015/
T. Pados et al.: Oxygen and carbon isotope composition of modern planktic foraminifera 1749
ters than in the southern Nansen Basin where the water col-
umn is strongly influenced by the subsurface inflow of At-
lantic Waters (Bauch et al., 1997). This trend observed by
Bauch et al. (1997) coincides with our results. The differ-
ence found in calcification depths in the Nansen Basin and
in the Fram Strait might be caused by the different habitats
that these locations represent. The northern Nansen Basin is
covered by sea ice throughout the year and thus represents
a different habitat for planktic foraminifera than the narrow
Fram Strait. Here, the interannual E–W variability in the po-
sition of the average summer sea-ice margin is high and the
ice-covered stations sampled in this study might therefore be
ice-free in another summer. It has been shown that the depth
habitat of planktic foraminifera in the Fram Strait in the early
summer is predominantly controlled by the position of the
deep chlorophyll maximum (Pados and Spielhagen, 2014).
The permanent ice cover in the Nansen Basin may alter the
factors controlling the depth habitat of foraminifera and may
consequently cause a different depth habitat (and calcifica-
tion depth) than in the Fram Strait.
Calculating the vital effect from differences between wa-
ter and plankton samples at each depth level assumes that
foraminifera calcified their tests at the depth interval where
they were caught. This might not be true, as foraminifera are
known to migrate in the water column during their life cy-
cle. Alternatively we may assume that the main encrustation
process of foraminifera indeed happened solely at the aver-
age calcification depth that is derived in our study from the
standing stock. When calculating the average offset between
water and foraminifera for the calcification depth only, a vital
effect of −0.9± 0.5 ‰ in N. pachyderma and −3.1± 2.9 ‰
in T. quinqueloba is determined. These vital effects are sig-
nificantly smaller than those determined over the whole wa-
ter column, which are −1.5± 1.3 ‰ and −3.7± 1.7 ‰ for
N. pachyderma and T. quinqueloba, respectively. In general,
we have to take into account that both calcification-scenarios
represent extreme cases and the actual vital effect may be
between these two extremes.
5.3 Carbon isotope values of DIC and foraminifera
The interpretation of the carbon isotope composition of
foraminiferal shells is quite complicated as several factors
can influence the carbon isotope incorporation. The gas ex-
change between sea and atmosphere, the biological produc-
tion, the community respiration and species-dependent incor-
porations of carbon isotopes are the main processes that can
affect the 13C / 12C ratio in calcite tests. A number of studies
reported on a consistent offset between δ13C of calcite shells
and the δ13CDIC measured within the water column (e.g.
Bauch et al., 2000; Volkmann and Mensch, 2001). Accord-
ing to Romanek et al. (1992) the δ13C of inorganic calcite
that precipitates in equilibrium with seawater is 1 ‰ higher
than δ13CDIC. In our study area below 75 m water depth the
δ13C values of N. pachyderma run relatively parallel to the
δ13CDIC, but with an average offset of −1.6± 0.7 ‰. This
reveals a vital effect of about −2.6 ‰. Kohfeld et al. (1996)
reported from the Northeast Water Polynya on the Greenland
shelf a vital effect of−1 ‰ while another study in the Nansen
Basin (Bauch et al., 2000) revealed a vital effect of −2 ‰.
The discrepancies found here may suggest the influence of
oceanographic variability on the vital effect in δ13C of N.
pachyderma. The δ13C of T. quinqueloba shows a stronger
vertical scatter with an average vital effect of −4.6± 1.5 ‰.
Again we emphasize that in the case of T. quinqueloba the
low amounts of calcite analysed might have also influenced
the results. Nevertheless, in the upper 75–100 m of the water
column for both species the δ13CDIC and the δ13C of shells
show an exactly reverse tendency (Figs. 5, 9): the δ13CDIC
is increasing towards sea surface while the δ13C of the tests
is decreasing. The high δ13CDIC values found close to the
sea surface are assumed to be caused by high primary pro-
duction, resulting in enrichment in 13C (Fogel and Cifuentes,
1993): as 12C is taken for photosynthesis, the water becomes
enriched in 13C. However, if no other processes would af-
fect the incorporation of carbon into the calcite shells, the
tests should also show the enrichment in 13C. One possi-
ble explanation for the deviation in the upper ∼ 75 m could
be the effect of high (near-surface) temperatures on the car-
bon isotope incorporation of the tests. Laboratory (Bemis et
al., 2000) and field experiments (Jonkers et al., 2013) have
shown that foraminiferal δ13C linearly decreases with in-
creasing temperatures. However, in our data set the offsets
measured between δ13CDIC and δ13Cforaminifera have no cor-
relation with in situ water temperatures. Therefore this hy-
pothesis cannot explain in our case the greater vital effect
found in near-surface waters.
Another explanation for the deviation might be an in-
creased carbonate ion concentration ([CO2−3 ]) as a conse-
quence of strong biological production in the upper wa-
ter column (Chierchi and Franson, 2009). Both culturing
(Spero et al., 1997) and field experiments (Bauch et al.,
2002) have shown that the carbon isotope composition of
foraminifera is correlated to the carbonate ion concentra-
tion of the water. The “carbonate ion effect” (CIE) de-
scribes that increasing seawater [CO2−3 ] causes depletion in
13C of the foraminiferal tests. The CIE could therefore ex-
plain our observed low δ13C values of shells living in 13C-
enriched waters. A direct interpretation of this effect is not
possible as during cruise ARK-XXVI/1 the concentration of
[CO2−3 ] or the parameters needed to calculate [CO2−
3 ] (e.g.
pH and total alkalinity of the water samples) were not de-
termined. However, vertical profiles of [CO2−3 ] measured
in the area (CARINA database, 2015) show in the upper
500 m of the water column a quite uniform [CO2−3 ] dis-
tribution, with values of 100–120 µmol kg−1. Only at the
surface in the WSC (upper 50 m) values are higher (up to
160 µmol kg−1). Applying the observed effect on Globige-
rina bulloides (−1.3 ‰ in δ13Cforaminifera / 100 µmol kg−1 in
www.biogeosciences.net/12/1733/2015/ Biogeosciences, 12, 1733–1752, 2015
1750 T. Pados et al.: Oxygen and carbon isotope composition of modern planktic foraminifera
[CO2−3 ]; Spero et al., 1997) the range of about 50 µmol kg−1
in [CO2−3 ] implies a potential effect of −0.65 ‰ on the δ13C
values of foraminifera, and thus might explain the lower val-
ues found in the surface waters in the east. However, we
cannot see this difference between east and west in the off-
sets measured between δ13CDIC and δ13CN.p., which points
to the fact that other processes are responsible for the de-
viation found in near-surface waters as well. Nevertheless,
assuming that the vital effect in δ13C close to the sea sur-
face is influenced by increased carbonate ion concentrations
induced through high primary production, the smaller aver-
age vital effects reported by Volkmann and Mensch (2001;
−2.15 ‰) and Stangeew (2001; −2 ‰) from the Fram Strait
more than 10 years earlier may point to an increase in bio-
productivity during the last decades in the area. Data sets of
[CO2−3 ] recorded between 1982 and 2002 in the Fram Strait
(CARINA database, 2015) however do not show respective
changes, which may indicate a significant shift only after
2002. We also have to consider that bioproductivity may vary
interannually and within the summer season.
As also discussed with respect to the offset in δ18O be-
tween coretop and living foraminifera, the age of sediment
surface samples can vary in a great range (between modern
to 3 ky, with an average of∼ 1 ky; Simstich et al., 2003). Ac-
cordingly, they may reflect significantly older environments
than the plankton samples. The negative offset in δ13C be-
tween the sediment and plankton samples may thus be ex-
plained by the surface ocean Suess effect: during the last
100 years the carbon isotope composition of the atmosphere
has changed due to the increased anthropogenic combus-
tion of fossil carbon which is extremely negative in δ13C.
The δ13C values of the atmospheric CO2 have decreased by
about 1.4 ‰ (Friedli et al., 1986; Francey et al., 1999) and
the concurrent shift in the stable carbon isotope composition
of ocean surface water is reflected in the decrease of δ13C of
recent foraminiferal shells (Bauch et al., 2000). The offset of
roughly −1 ‰ in δ13C between the sediment and plankton
samples observed both in this study and in that of Bauch et
al. (2000) may therefore be explained by the different ages of
the carbonate in both sample sets and the developments that
have occurred in the last ca. 100 years.
6 Conclusions
1. The polar species Neogloboquadrina pachyderma
clearly dominates the foraminiferal species assemblage
in the Fram Strait in the early summer. Subpolar Tur-
borotalita quinqueloba accounts for only 5–23 %.
2. In the study area both species dwell shallower under the
ice cover than in the open ocean. The average depth of
calcification of N. pachyderma lies between 70–150 m
water depth, T. quinqueloba shows a similar range with
50–120 m water depth.
3. When calculating the average vital effect in the oxy-
gen isotope composition for the whole sampled wa-
ter column, N. pachyderma and T. quinqueloba show
an average offset of about −1.5 and −3.7 ‰ (respec-
tively) compared to calculated equilibrium calcite val-
ues. These vital effects are higher than those determined
at the calcification depth only where they are −0.9 ‰
for N. pachyderma and −3.1 ‰ for T. quinqueloba.
4. The δ13CDIC and the δ13C values of the net-sampled
shells show an average offset of −1.6 and −3.6 ‰ for
N. pachyderma and T. quinqueloba, respectively. The
discrepancies with earlier published results may suggest
the influence of regional variability on the vital effect in
δ13C.
5. In the upper ∼ 75 m of the water column the δ13CDIC
and the δ13C of shells of both species show an exactly
reverse tendency that might relate to the influence of the
“carbonate ion effect” on the carbon isotope incorpora-
tion in the tests.
6. The shells of both species collected from the water col-
umn yield lower δ18O and δ13C values than those from
the sediment surface, suggesting a significant change
of the stable isotope ratios in the recent past (last cen-
turies, likely the last 100–150 years only) The negative
offset in δ18O between the sediment and plankton sam-
ples suggests a combined effect of temperature rise and
δ18Owater-change, while the offset in δ13C may be ex-
plained by the surface ocean Suess effect.
Acknowledgements. The authors wish to thank the captain and
crew of RV Polarstern and the Alfred Wegener Institute, Helmholtz
Centre for Polar and Marine Research in Bremerhaven for support
during the cruise ARK-XXVI/1. We are indebted to Angelina Kraft
for assisting in the deployments of the MultiNet sampler and to
Maciej Telesinski for collecting the sediment surface samples for
this study. Agnieszka Beszczynska-Möller and Andreas Wisotzki
provided the CTD data for the study. Thanks also go to Hart-
mut Schulz for kindly providing the low temperature vacuum asher
at the University of Tübingen and for his hospitality and technical
assistance during the process. Lukas Jonkers and two anonymous
reviewers gave important comments that significantly helped to
improve the manuscript. This research was conducted with funding
of the European Community’s 7th Framework Programme FP7
2007/2013, Marie-Curie Actions, under Grant Agreement No.
238111 – CASE ITN. R. F. Spielhagen acknowledges the financial
support through the “Akademienprogramm” by the Academy of
Sciences, Humanities, and Literature Mainz.
Edited by: A. Shemesh
Biogeosciences, 12, 1733–1752, 2015 www.biogeosciences.net/12/1733/2015/
T. Pados et al.: Oxygen and carbon isotope composition of modern planktic foraminifera 1751
References
Alexander, V.: Interrelationships between the seasonal sea ice and
biological regimes, Cold Reg. Sci. Technol., 2, 157–178, 1980.
Bauch, D., Carsens, J., and Wefer, G.: Oxygen isotope composi-
tion of living Neogloboquadrina pachyderma (sin.) in the Arctic
Ocean, Earth Planet. Sc. Lett., 146, 47–58, 1997.
Bauch, D., Carstens, J., Wefer, G., and Thiede, J.: The imprint of
anthropogenic CO2 in the Arctic Ocean: evidence from planktic
δ13C data from water column and sediment surfaces, Deep-Sea
Res. Pt. II., 47, 1791–1808, 2000.
Bauch, D., Erlenkeuser, H., Winckler, G., Pavlova, G., and Thiede,
J.: Carbon isotopes and habitat of polar planktic foraminifera in
the Okhotsk Sea: the ’carbonate ion effect’ under natural condi-
tions, Mar. Micropaleontol., 45, 83–99, 2002.
Bemis, B. E., Spero, H. J., Bijma, J., and Lea, D. W.: Reevaluation
of the oxygen isotopic composition of planktonic foraminifera:
Experimental results and revised paleotemperature equations,
Paleoceanography, 13, 150–160, 1998.
Bemis, B. E., Spero, H. J., Lea, D. W., and Bijma, J.: Tempera-
ture influence on the carbon isotopic composition of Globigerina
bulloides and Orbulina universa (planktonic foraminifera), Mar.
Micropaleontol., 38, 213–228, 2000.
Berberich, D.: Die planktische Foraminifere Neogloboquadrina
pachyderma (Ehrenberg) im Weddellmeer, Antarktis [The plank-
tonic foraminifera Neogloboquadrina pachyderma (Ehrenberg)
in the Weddell Sea, Antarctica], Berichte zur Polarforschung
(Reports on Polar Research), 195, 1–193, 1996.
Berger, W. H.: Planktonic foraminifera: selective solution and the
lysocline, Mar. Geol., 8, 111–138, 1970.
Beszczynska-Möller, A. and Wisotzki, A.: Physical oceanography
during POLARSTERN cruise ARKXXVI/1, Alfred Wegener In-
stitute, Helmholtz Centre for Polar and Marine Research, Bre-
merhaven, doi:10.1594/PANGEA.774196, 2012.
Beszczynska-Möller, A., Woodgate, R. A., Lee, C., Melling, H.,
and Karcher, M.: A synthesis of exchanges through the main
oceanic gateways to the Arctic Ocean. In: The Changing Arc-
tic Ocean: Special Issue on the International Polar Year (2007–
2009), Oceanography, 24, 82–99, 2011.
Bijma, J., Erez, J., and Hemleben, C.: Lunar and semi-lunar re-
productive cycles in some spinose planktonic foraminifers, J.
Foramin. Res., 20, 117–127, 1990.
CARbon dioxide IN the Atlantic Ocean: http://cdiac.ornl.gov/
oceans/CARINA/, last access: 12 January 2015.
Carstens, J., Hebbeln, D., and Wefer, G.: Distribution of planktic
foraminifera at the ice margin in the Arctic (Fram Strait), Mar.
Micropaleontol., 29, 257–269, 1997.
Chierici, M. and Fransson, A.: Calcium carbonate saturation in
the surface water of the Arctic Ocean: undersaturation in
freshwater influenced shelves, Biogeosciences, 6, 2421–2431,
doi:10.5194/bg-6-2421-2009, 2009.
Darling, K. F., Kucera, M., Kroon, D. and Wade, C. M.: A
resolution for the coiling direction paradox in Neoglobo-
quadrina pachyderma, Paleoceanography, 21, PA2011,
doi:10.1029/2005PA001189, 2006.
Dickson, R. R., Osborn, T. J., Hurrell, J. W., Meincke, J., Blindheim,
J., Adlandsvik, B., Vinje, T., Alekseev, G. and Maslowski, W.:
The Arctic Ocean response to the North Atlantic Oscillation, J.
Climate, 13, 2671–2696, 2000.
Duplessy, J. C.: Isotope studies, Climatic Change, 3, 47–67, 1978.
Duplessy, J. C., Bé, A. W. H., and Blanc, P. L.: Oxygen and carbon
isotopic composition and biogeographic distribution of plank-
tonic foraminifera in the Indian Ocean, Palaeogeogr. Palaeocli-
matol. Palaeoecol., 33, 9–46, 1981.
Duplessy, J. C., Labeyrie, L., Arnold, M., Paterne, M., Duprat, J.,
and van Weering, T. C.: Changes in surface salinity of the North
Atlantic Ocean during the last deglaciation, Nature, 358, 485–
488, 1992.
Ehrenberg, C. G.: Über die Tiefgrund-Verhältnisse des Oceans
am Eingange der Davisstrasse und bei Island (About sea bot-
tom conditions at the mouth of Davis Strait and near Iceland),
Monatsbericht der Königlichen Preussischen Akademie der Wis-
senschaften zu Berlin 1861, 275–315, 1861.
Erez, J. and Luz, B.: Experimental paleotemperature equation for
planktonic foraminifera, Geochim. Cosmochim. Acta, 47, 1025–
1031, 1983.
Fairbanks, R. G., Wiebe, P. H., and Be, A. W. H.: Vertical distribu-
tion and isotopic composition of living planktonic foraminifera
in the western North Atlantic, Science, 207, 61–63, 1980.
Fogel, M. L. and Cifuentes, L. A.: Isotope fractionation during pri-
mary production, in: Organic geochemistry, Springer US, 73–98,
1993.
Francey, R. J., Allison, C. E., Etheridge, D. M., Trudinger, C. M.,
Enting, I. G., Leuenberger, M., Langenfelds, R. L., Michel, E.,
and Steele, L. P.: A 1000-year high precision record of δ13C in
atmospheric CO2, Tellus B, 51, 170–193, 1999.
Friedli, H., Lötscher, H., Oeschger, H., Siegenthaler, U., and Stauf-
fer, B.: Ice core record of the 13C / 12C ratio of atmospheric CO2
in the past two centuries, Nature, 324, 237–238, 1986.
Gillooly, J. F., Brown, J. H., West, G. B., Savage, V. M., and
Charnov, E. L.: Effects of size and temperature on metabolic rate,
Science, 293, 2248–2251, 2001.
Hecht, A. D.: An ecologic model for test size variation in re-
cent planktonic foraminifera; applications to the fossil record, J.
Foramin. Res., 6, 295–311, 1976.
Hemleben, C., Spindler, M., and Anderson, O. R.: Modern plank-
tonic foraminifera, Springer, New York, 1989.
Hemmingsen, A. M.: Energy metabolism as related to body size and
respiratory surfaces, and its evolution. Rep. Steno Mem. Hosp.
Nord. Insulinlab., 9, 1–110, 1960.
Jakobsson, M., Mayer, L., Coakley, B., Dowdeswell, J. A., Forbes,
S., Fridman, B., Hodnesdal, H., Noormets, R., Pedersen, R.,
Rebesco, M., Schenke, H. W., Zarayskaya, Y., Accettella, D.,
Armstrong, A., Anderson, R. M., Bienhoff, P., Camerlenghi, A.,
Church, I., Edwards, M., Gardner, J. V., Hall, J. K., Hell, B.,
Hestvik, O., Kristoffersen, Y., Marcussen, C., Mohammad, R.,
Mosher, D., Nghiem, S. V., Pedrosa, M. T., Travaglini, P. G., and
Weatherall, P.: The International Bathymetric Chart of the Arctic
Ocean (IBCAO) version 3.0., Geophys. Res. Lett., 39, L12609,
doi:10.1029/2012GL052219, 2012.
Johanessen, O. M.: Brief overview of the physical oceanography, in:
The Nordic Seas, edited by: Hurdle, B. G., Springer, New York,
103–128, 1986.
Jones, E. P.: Circulation in the Arctic Ocean, Polar Res., 20, 139–
146, 2001.
Jonkers, L., Brummer, G.-J. A., Peeters, F. J. C., van Aken, H. M.,
and De Jong, M. F.: Seasonal stratification, shell flux, and oxy-
gen isotope dynamics of left-coiling N. pachyderma (sin.) and
www.biogeosciences.net/12/1733/2015/ Biogeosciences, 12, 1733–1752, 2015
1752 T. Pados et al.: Oxygen and carbon isotope composition of modern planktic foraminifera
T. quinqueloba in the western subpolar North Atlantic, Paleo-
ceanography, 25, PA2204, doi:10.1029/2009PA001849, 2010.
Jonkers, L., Heuven, S., Zahn, R., and Peeters, F. J.: Seasonal pat-
terns of shell flux, δ18O and δ13C of small and large N. pachy-
derma (s) and G. bulloides in the subpolar North Atlantic, Pale-
oceanography, 28, 164–174, 2013.
Kahn, M. I.: Non-equilibrium oxygen and carbon isotopic fraction-
ation in tests of living planktonic-foraminifera, Oceanol. Acta, 2,
195–208, 1979.
Kellogg, T., Duplessy, J. C. and Shackleton, N.: Planktonic
foraminiferal and oxygen isotopic stratigraphy and paleoclima-
tology of Norwegian Sea deep-sea cores, Boreas, 7, 61–73, 1978.
Kohfeld, K. E., Fairbanks, R. G., Smith, S. L., and Walsh, I. D.:
Neogloboquadrina pachyderma (sinistral coiling) as paleoceano-
graphic tracers in polar oceans: Evidence from Northeast Water
Polynya plankton tows, sediment traps, and surface sediments,
Paleoceanography, 11, 679–699, 1996.
Loncaric, N., Peeters, F. J. C., Kroon, D. and Brummer, G.-J.
A.: Oxygen isotope ecology of recent planktic foraminifera at
the central Walvis Ridge (SE Atlantic), Paleoceanography, 21,
PA3009, doi:10.1029/2005PA001207, 2006.
McConnaughey, T.: 13C and 18O isotopic disequilibrium in biologi-
cal carbonates: I. Patterns, Geochim. Cosmochim. Acta, 53, 151–
162, 1989.
Meyer, H., Schoenicke, L., Wand, U., Hubberten, H.-W., and
Friedrichsen, H.: Isotope studies of hydrogen and oxygen in
ground ice – Experiences with the equilibration technique, Isot.
Environ. Healt. S., 36, 133–149, 2000.
Morison, J., Kwok, R., Peralta-Ferriz, C., Alkire, M., Rigor, I., An-
dersen R., and Steele, M.: Changing Arctic Ocean freshwater
pathways, Nature, 481, 66–70, 2012.
Natland, M. L.: New species of foraminifera from off the west coast
of North America and from the later Tertiary of the Los Angeles
Basin, Scripp. Instit. Oceanogr. Bull. Techn. Ser., 4, 137–164,
1938.
O’Neil, J. R., Clayton, R. N., and Mayeda, T. K.: Oxygen isotope
fractionation in divalent metal carbonates, J. Chem. Phys., 51,
5547–58, 1969.
Pados, T. and Spielhagen, R.F.: Species distribution and depth
habitat of recent planktic foraminifera in the Fram Strait (Arc-
tic Ocean), Pol. Res., 33, 22483, doi:10.3402/polar.v33.22483,
2014.
Peterson, B. J., Holmes, R. M., McClelland, J. W., Vörösmarty, C.
J., Lammers, R. B., Shiklomanov, A. I., and Rahmstorf, S.: In-
creasing river discharge to the Arctic Ocean, Science, 298, 2171–
2173, 2002.
Romanek, C. S., Grossman, E. L., and Morse, J. W.: Carbon iso-
topic fractionation in synthetic aragonite and calcite: effects of
temperature and precipitation rate, Geochim. Cosmochim. Acta,
56, 419–430, 1992.
Rudels, B., Friedrich, H. J., and Quadfasel, D.: The Arctic Circum-
polar Boundary Current, Deep-Sea Res. Pt. II, 46, 1023–1062,
1999.
Rudels, B., Meyer, R., Fahrbach, E., Ivanov, V. V., Østerhus, S.,
Quadfasel, D., Schauer, U., Tverberg, V., and Woodgate, R. A.:
Water mass distribution in Fram Strait and over the Yermak
Plateau in summer 1997, Ann. Geophys., 18, 687–705, 2000,
http://www.ann-geophys.net/18/687/2000/.
Schiebel, R. and Hemleben, C.: Modern planktic foraminifera.
Paläontologische Zeitschrift, 79, 135–148, 2005.
Schmidt, G. A. and Mulitza, S.: Global calibration of ecological
models for planktic foraminifera from coretop carbonate oxygen-
18, Mar. Micropaleontol., 44, 125–140, 2002.
Serreze, M. C., Walsh, J. E., Chapin, III. F. S., Osterkamp, T.,
Dyurgerov, M., Romanovsky, V., Oechel, W. C., Morison, J.,
Zhang, T., and Barry, R. G.: Observational evidence of recent
change in the northern high latitude environment, Clim. Chang.,
46, 159–207, 2000.
Shackleton, N. J., Wiseman, J. D. H., and Buckley, H. A.: Non-
equilibrium isotopic fractionation between seawater and plank-
tonic foraminiferal tests, Nature, 242, 177–179, 1973.
Simstich, J., Sarnthein, M., and Erlenkeuser, H.: Paired δ18O sig-
nals of Neogloboquadrina pachyderma (s) and Turborotalita
quinqueloba show thermal stratification structure in the Nordic
Seas, Mar. Micropaleontol., 48, 107–125, 2003.
Spero, H. J.: Do planktic foraminifera accurately record shifts in the
carbon isotopic composition of seawater 6CO2?, Mar. Micropa-
leontol., 19, 275–285, 1992.
Spero, H. J. and Deniro, M. J.: The influence of symbiont photosyn-
thesis on the δ18O and δ13C values of planktonic foraminiferal
shell calcite, Symbiosis, 4, 213–228, 1987.
Spero, H. J., Bijma, J., Lea, D. W., and Bemis, B. E.: Effect of sea-
water carbonate concentration on foraminiferal carbon and oxy-
gen isotopes, Nature, 390, 497–500, 1997.
Spielhagen, R. F., Werner, K., Sorensen, S. A., Zamelczyk, K., Kan-
diano, E., Budeus, G., Husum, K., Marchitto, T. M., and Hald,
M.: Enhanced modern heat transfer to the Arctic by warm At-
lantic water, Science, 331, 450–453, 2011.
Stangeew, E.: Distribution and isotopic composition of living plank-
tonic foraminifera N. pachyderma (sinistral) and T. quinqueloba
in the high latitude North Atlantic, Doctoral dissertation, 2001.
Vergnaud Grazzini, C.: Non-equilibrium isotopic compositions of
shells of planktonic foraminifera in the Mediterranean Sea, Pale-
ogeogr. Paleoclimatol. Paleoecol., 20, 263–276, 1976.
Volkmann, R.: Planktic foraminifers in the outer Laptev Sea and the
Fram Strait – Modern distribution and ecology, J. Foramin. Res.,
30, 157–176, 2000.
Volkmann, R. and Mensch, M.: Stable isotope composition (δ18O,
δ13C) of living planktic foraminifers in the outer Laptev Sea and
the Fram Strait, Mar. Micropaleontol., 42, 163–188, 2001.
von Gyldenfeldt, A.-B., Carstens, J., and Meincke, J.: Estimation
of the catchment area of a sediment trap by means of current
meters and foraminiferal tests, Deep-Sea Res. Pt. II, 47, 1701–
1717, 2000.
Zhang, J., Rothrock, D. A., and Steele, M.: Warming of the Arctic
Ocean by a strengthened Atlantic inflow: Model results, Geo-
phys. Res. Lett., 25, 1745–1748, 1998.
Biogeosciences, 12, 1733–1752, 2015 www.biogeosciences.net/12/1733/2015/