OXIRED D2.2 Biomass quantification methods
63
Berlin, Germany 2011 © Copyright 2011 by the KompetenzZentrum Wasser Berlin gGmbH. All rights including translation into other languages, reserved under the Universal Copyright Convention, the Berne Convention or the Protection of Literacy and Artistic Works, and the International and Pan American Copyright Conventions. Cicerostr. 24 D-10709 Berlin Germany Tel +49 (0)30 536 53 800 Fax +49 (0)30 536 53 888 www.kompetenz-wasser.de REPORT MICROORGANISMS IN SOILS & SEDIMENTS Detection, quantification and activity by Suzanne van der Velde Department “Groundwater” KompetenzZentrum Wasser Berlin, Cicerostraße 24, 10709 Berlin, Germany Tel. ++49 (0)30-536-53813 for Kompetenzzentrum Wasser Berlin gGmbH Preparation of this report was financed in part through funds provided by
Transcript of OXIRED D2.2 Biomass quantification methods

Berlin, Germany 2011
© Copyright 2011 by the KompetenzZentrum Wasser Berlin gGmbH. All rights including translation into other languages, reserved under the Universal Copyright Convention, the Berne Convention or the Protection of Literacy and Artistic Works, and the International and Pan American Copyright Conventions.
Cicerostr. 24 D-10709 Berlin Germany Tel +49 (0)30 536 53 800 Fax +49 (0)30 536 53 888 www.kompetenz-wasser.de
REPORT
MICROORGANISMS IN SOILS & SEDIMENTS
Detection, quantification and activity by
Suzanne van der Velde
Department “Groundwater”
KompetenzZentrum Wasser Berlin, Cicerostraße 24, 10709 Berlin, Germany
Tel. ++49 (0)30-536-53813
for Kompetenzzentrum Wasser Berlin gGmbH
Preparation of this report was financed in part through funds provided by

ii
Import Legal Notice
Disclaimer: The information in this publication was considered technically sound by the consensus of persons engaged in the development and approval of the document at the time it was developed. KWB disclaims liability to the full extent for any personal injury, property, or other damages of any nature whatsoever, whether special, indirect, consequential, or compensatory, directly or indirectly resulting from the publication, use of application, or reliance on this document. KWB disclaims and makes no guaranty or warranty, expressed or implied, as to the accuracy or completeness of any information published herein. It is expressly pointed out that the information and results given in this publication may be out of date due to subsequent modifications. In addition, KWB disclaims and makes no warranty that the information in this document will fulfill any of your particular purposes or needs. The disclaimer on hand neither seeks to restrict nor to exclude KWB’s liability against all relevant national statutory provisions.
Wichtiger rechtlicher Hinweis
Haftungsausschluss: Die in dieser Publikation bereitgestellte Information wurde zum Zeitpunkt der Erstellung im Konsens mit den bei Entwicklung und Anfertigung des Dokumentes beteiligten Personen als technisch einwandfrei befunden. KWB schließt vollumfänglich die Haftung für jegliche Personen-, Sach- oder sonstige Schäden aus, ungeachtet ob diese speziell, indirekt, nachfolgend oder kompensatorisch, mittelbar oder unmittelbar sind oder direkt oder indirekt von dieser Publikation, einer Anwendung oder dem Vertrauen in dieses Dokument herrühren. KWB übernimmt keine Garantie und macht keine Zusicherungen ausdrücklicher oder stillschweigender Art bezüglich der Richtigkeit oder Vollständigkeit jeglicher Information hierin. Es wird ausdrücklich darauf hingewiesen, dass die in der Publikation gegebenen Informationen und Ergebnisse aufgrund nachfolgender Änderungen nicht mehr aktuell sein können. Weiterhin lehnt KWB die Haftung ab und übernimmt keine Garantie, dass die in diesem Dokument enthaltenen Informationen der Erfüllung Ihrer besonderen Zwecke oder Ansprüche dienlich sind. Mit der vorliegenden Haftungsausschlussklausel wird weder bezweckt, die Haftung der KWB entgegen den einschlägigen nationalen Rechtsvorschriften einzuschränken noch sie in Fällen auszuschließen, in denen ein Ausschluss nach diesen Rechtsvorschriften nicht möglich ist.
iii
Colofon
Microorganisms in sediments – Dectection, quantification and activity
Suzanne van der Velde Student Delft University of Technology, KWB Internship
Quality Assurance
K. Delabre, C.Panneton, P. Roche (VERI) U. Böckelmann (BWB) G. Grützmacher (KWB) O. Thronicker (TUB)
Publication/ dissemination approved by technical committee members
M. Jekel (TUB) P. Roche (VERI) E. Soyeux (VERI) U. Dünnbier (BWB, Laboratories) R. Gnirss (BWB, R&D)
Deliverable number
D 2.1

iv
Abstract
Artificial groundwater recharge (AR) is used as semi-natural pre-treatment for drinking water production in Berlin and many other sites world-wide. Earlier research has focussed on the degradation of organic substances in these recharge systems (NASRI final reports 1 – 6), and has improved our knowledge of AR in the specific sites in Berlin. Nevertheless, a process understanding which might enable a transfer to other sites and boundary conditions is still lacking. Since biodegradation – which is assumed to be the main removal process of organic compounds – depends on the presence and activity of microorganisms, characterisation experiments with respect to biological activity will help to interpret results from soil column experiments simulating AR.
In this stage of the OXIRED project, it will be of interest to link biological activity to degradation patterns in soil columns. Therefore, the following questions related to micro-organisms could be necessary to answer: 1) How many are there? 2) How active are they? 3) Who is living there?
A review of published literature yielded that in general, soils and sediments contain great numbers of microorganisms. Whereas in surface soils concentrations of culturable microorganisms can be found in the range of 108 per gram of dry soil, the number of culturable organisms in the subsurface are dependent on depth and are generally lower.
In order to analyse them, adapted sampling methods and a sound sampling strategy are necessary for a reliable overview of microbial life. Another important aspect of microbial investigations is the detachment of organisms from biofilms for which enzymatic based methods have proven to be very useful.
Different microbiological and biomolecular methods were described and assessed with respect to their suitability:
1) Cultivation: Since less than 1% of the microorganisms in natural environments can be cultured they will not be useful when one aims to get more insight into the microbial community.
2) Nucleic acid based techniques: Whereas DNA based primers can be used to detect specific species, general primers can be used to get a broad overview of the microbial life within a sample. Furthermore, active organisms can be detected by the use of RNA based primers.
3) Physiological technique: Microbial activity can be estimated indirectly based on AOC or BDOC measurements.
To assess the micro-organisms present in soil columns and their activity the following methods are recommended:
o Substrate degradation assessments by BDOC (or AOC) measurements (normally done in column studies)
o Direct counts (DAPI/ Acridine Orange) of direct extracted organisms and organisms present on buried slides.
o DGGE with universal primers
o qPCR
o Direct counts with LIFE/DEAD staining and CTC redox dye
o Clone libraries constructed from DGGE bands
In addition to an extensive literature database of references for further details the results are summarized in a table with an overview of methods for detection, quantification and activity assessments of microbial communities in soils and sediments.

v
Acknowledgements
The project team is grateful to BWB and Veolia for sponsoring the OXIRED-2 -project.
We thank all involved persons at the technical divisions and research and development departments as well as the technical committee for the valuable discussions and provided information. We received valuable input from the microbiology working group at the Technical University of Berlin, Prof. Szewzyk and O. Thronicker, as well as from H. Dizer (UBA).
Special thanks to the microbiology and soil experts from BWB and Veolia (K.Delabre, C.Panneton, and U. Böckelmann) for their quality review and encouraging remarks. We would also like to thank P. Roche for coming up with the idea of preparing this report as basis for further investigations in the field of subsurface passage and his constant support.
Thank you!

vi
Table of Contents
Import Legal Notice ............................................................................................... ii
Colofon ........................................................................................................................... iii
Abstract........................................................................................................................... iv
Acknowledgements .......................................................................................................... v
Table of Contents ............................................................................................................ vi
Abbreviations ................................................................................................................ viii
1 Microorganisms in sediments - Detection, quantification and activity ...................... 1
1.1 General introduction .......................................................................................... 2
1.1.1 Biofilms ...................................................................................................... 2
1.1.2 The Tree of Life ......................................................................................... 5
1.1.3 Microbial habitats ....................................................................................... 7
1.2 Technical description of methods for detection, quantification and activity measurements ........................................................................................................... 10
1.2.1 Methods for soil and sediment sampling .................................................. 11
1.2.1.1 Environmental sampling .................................................................... 11
1.2.1.2 Detachment of microorganisms from an environmental biofilm ......... 12
1.2.1.3 Extraction of nucleic acids from soils ................................................ 12
1.2.2 Microscopic techniques ............................................................................ 14
1.2.2.1 Fluorescent microscopy .................................................................... 14
1.2.2.2 Visible light microscopy ..................................................................... 16
1.2.2.3 Electron microscopy.......................................................................... 17
1.2.2.4 Atomic force microscopy ................................................................... 17
1.2.3 Laser Cytometry ...................................................................................... 18
1.2.3.1 Flow cytometry .................................................................................. 18
1.2.3.2 Solid phase cytometry ....................................................................... 18
1.2.4 Cultural methods ...................................................................................... 19
1.2.4.1 Extraction and plating of microorganisms from soil and sediments ... 19
1.2.5 Nucleic acid based techniques ................................................................. 21
1.2.5.1 Preparation of soil samples ............................................................... 22
1.2.5.2 Polymerase chain reaction (PCR) ..................................................... 22
1.2.5.3 Phylogenetic markers: the SSU rRNA genes .................................... 24
1.2.5.4 Quantitative PCR (qPCR) ................................................................. 24
1.2.5.5 Temperature and Denaturing gradient gel electrophoresis (T/DGGE) 27
1.2.5.6 Clone libraries ................................................................................... 28
1.2.5.7 Sequence analysis ............................................................................ 29

vii
1.2.5.8 Fluorescent in situ hybridization (FISH) ............................................. 30
1.2.5.9 Restriction Fragment Length Polymorphism analysis (RFLP) ............ 31
1.2.6 Physiological methods ............................................................................. 32
1.2.6.1 Assimilable organic carbon (AOC) removal ....................................... 32
1.2.6.2 Carbon respiration / substrate utilisation ........................................... 33
1.2.6.3 ATP measurements .......................................................................... 34
1.2.6.4 Enzyme activity assays ..................................................................... 35
1.2.6.5 Stable isotope probing ...................................................................... 36
1.2.6.6 Incorporation of radio labelled tracers / Microautoradiography (MAR) 37
1.2.7 Other methods ......................................................................................... 39
1.2.7.1 Functional genomics and proteomics based methods ....................... 39
1.2.7.2 Phospolipid analysis .......................................................................... 39
1.2.7.3 Immunological methods .................................................................... 41
1.2.7.4 Probe active counts (PAC) ................................................................ 41
1.2.7.5 Combinations of methods in soil column investigations ..................... 41
1.3 Summary of the different approaches .............................................................. 43
1.4 Conclusion / Overview..................................................................................... 46
Bibliography .................................................................................................................. 51

viii
Abbreviations
AOC Assimilable organic carbon
AOD Acridine orange
AODC Acridine orange direct counts
AFM Atomic force microscopy
BDOC Biological dissolved organic carbon
CFU Colony-Forming Unit
DGGE Denaturing gradient gel electrophoresis
DNA Deoxyribonucleic acid
dsDNA Double stranded DNA
cDNA Complementary DNA
DOC Dissolved organic carbon
ELISA Enzyme-linked immunosorbent assay
EM Electron microscopy
EPS Extracellular polymeric substance
MPN Most probable number
PAC Probe active counts
QAPP Quality Assurance Project Plan
RNA Ribonucleic acid
mRNA messenger RNA
SDS Sodium dodencyl sulphate
SEM Scanning electron microscopy
SPM Scanning probe microscopy
TEA Terminal electron acceptor
TEM Transmission electron microscopy
TGGE Temperature gradient gel electophoresis
TOC Total organic carbon
VBNC Viable but noncultarable
VBDC Viable but difficult to culture

ix
List of figures
Figure 1 Schematic overview of concentration pattern in a soil column. .......................... 2
Figure 2 Different stages of biofilm formation (Dalke 2002) ............................................. 3
Figure 3 Biofilms as microbial landscapes: A microbial biofilm in a sedimentary environment. (Adapted from Battin et al. 2007) 1) Coalesce and accumulation of biomass in slow flow. 2) Development of filamentous streamers in fast flow. 3) The landscape topography might be preferential trajectory for dispersal cells to land. 4) Heterogeneity of the microbial landscape. .................................................................................................. 4
Figure 4 Biofilms in nature. A. Photograph of biofilm dominated by cyanobaceteria, grown over a sediment layer. (Banfield et al. 2007) B. Biofilm inhabitants (From: D.C. Sigee 2005) ..................................................................................................................... 4
Figure 5 The three domains of life, based on the comparision DNA sequences from different organisms. ......................................................................................................... 5
Figure 6 Simplified version of the nitrogen cycle. (From: Stars and Seas.com 2010 ) ...... 7
Figure 7 Relative abunances of different bacterial phyla in soil. Fierer et al. 2007 ........... 8
Figure 8: A. Schematic overview of the optical system of a fluorescence microscope ; B. Different fluorescent dyes (Alberts et al. 2002) .............................................................. 14
Figure 9 The diversity of marine bacteria on an agar plate. (From: NIWA 2006) ........... 19
Figure 10 Schematic overview of combination of nucleic acid techniques. A. 16S ribosomal RNA analysis of microbial communities (From: Green Tringe & Rubin 2005)). B. Flow diagram of the different steps in the analysis of microbial community structure (From: Muyzer 1999) ..................................................................................................... 21
Figure 11 The PCR technique (From : Alberts et al. 2002) ............................................ 23
Figure 12 X-ray crystal structure of a 70S ribosome functional complex (Thermus thermophilus) at 3.7Å resolution. ................................................................................... 24
Figure 13 Illustration plot of nomenclature generally used in qPCR (From: Ginzinger 2002) ............................................................................................................................. 25
Figure 14 Schematical overview of the (A)TaqMan® method and (B) the SYBR Green I ® method (From: Gene-quantification 2002) ................................................................. 26
Figure 15 Schematic overview and example of T/DGGE ............................................... 27
Figure 16 Cloning a gene into a plasmide ..................................................................... 28
Figure 17: Transformation of Plasmid-DNA into competent E. coli-cells (Wikipedia, 2011). ...................................................................................................................................... 29
Figure 18: Different hybridization conditions allow less than perfect DNA matching. (Alberts et al. 2002 ) ...................................................................................................... 30
Figure 19: Process steps for the application of FISH microscopy (From: BioVisible Microbial Diagnostics 2008) .......................................................................................... 31
Figure 20 Adenosine triphosphate (from:Astrobiology Magazine 2010. Image Credit: Nanyang Technological University) ............................................................................... 34
Figure 21 Bio-trap method (From: Microbial Insights Inc. (MI) 2009) ............................ 37
Figure 22 : Visualization of the Micro-FISH method (http://www.hpl.umces.edu/faculty/bcrump/Micro-FISH.pdf) .......................................... 38

x
Figure 23 Phospholipid structure and the orientation of phospholipids in membranes (Alberts et al. 2002 ). ..................................................................................................... 39
Figure 24: Views of a cell membrane (A) An electron micrograph of a plasma membrane (of a human red blood cell) seen in cross section. (B and C)These drawings show two-dimensional and three-dimensional views of a cell membrane. (Alberts et al. 2002) (D)Molecular view of the cell membrane (Encyclopaedia Britannica Online 2010 ) ....... 40

1
1 Microorganisms in sediments - Detection, quantification and activity
“…But what if one should tell such people in the future that there are more animals living in the scum on the teeth in a man's mouth, than there are men in a whole kingdom? ”
A. van Leeuwenhoek (1632 – 1723)
In 1632, the Founding Father of microbiology, Antonie van Leeuwenhoek, was born in Delft, The Netherlands. He was able to build a microscope, which made it possible to observe microorganisms in water. Besides, he was the first one to detect animalcules, currently known as bacteria.
Four centuries later, our knowledge of the microbial world exponentially extended. Modern techniques made it possible to detect and classify these organisms. Studies revealed their importance in the earth’s elements cycles and microorganisms are commonly used for industrial applications. An example of the use of natural existing microorganisms can be found in the field of drink water production, where biological filtration is applied for purification.
At different sites in Berlin, artificial groundwater recharge (AR) is used as a biological filtration step. Earlier research focussed on degradation of organic substances in these recharge systems (NASRI reports 1 – 6), which improved our knowledge of AR in the specific sites in Berlin. Nevertheless, our knowledge can be extended by examination of microbial life in the artificial recharge sediments.
Since removal of organic compounds depends on the presence and activity of microorganisms, characterisation experiments with respect to biological activity will help to interpret results from soil column experiments.
Until now, changes in degradation patterns were ascribed to different microbial activities. Despite this ascription, those differences were never quantified. Fortunately, methods for biomass analysis will provide a better inside into the biological processes occurring in subsurface area’s.
In this stage of the OXIRED project, it will be of interest to link biological activity to degradation patterns in soil columns. Therefore, the following questions must be answered according to microorganisms:
1. How many are there?
2. How active are they?
3. Who is living there?
Thereby, the decrease in substrate concentration can be couple to the amount of organisms. For example, the hypothesis that the amount or activity of microorganisms in area A is higher than in area B (see Figure 1), since substrate is slower degraded in the latter can be confirmed or rejected based on investigation of above mentioned questions.

2
In summary, this report will provide an overview of different methods for the i) detection, ii) quantification and iii) the estimation of activity of microbial life in sediments. In a general introduction, the world of microorganisms will be briefly described followed by a review of our current knowledge of life in sediments. The second part will consist of a description of different techniques currently used in environmental microbiology. Furthermore, the feasibility of these techniques will be investigated in order to give a recommendation for the use in sediment analysis.
1.1 General introduction
Although van Leeuwenhoek was the first one to detect a layer of microorganisms which could attach and grow universally on tooth, it took more than three centuries before this phenomenon was reinvented. For a long time, microorganisms were seen as free moving cells. It must be mentioned that microorganisms could indeed be present as single cell, but a majority of organisms can be found in colonies attached to a surface, also known as a biofilm. In order to understand microbial life in sediments, the process of biofilm formation will be clarified.
1.1.1 Biofilms
An ideal environment for microbial attachments and microbial growth, can be found in the solid-liquid interface between an aquatic environment and a surface. Different factors, such as effects of substratum and hydrodynamics, will influence these growth and attachment processes. In general, biofilm formation can be separated in different stages (Figure 2). Furthermore, microorganisms can appear in different configurations e.g. as planktonic cells, colonies or biofilms.
The first step in the process of biofilm formation is the reversible adhesion of microorganisms on a certain surface, such as rock, metal, glass or human tissue. Since this step is reversible, the organisms are able to review the suitability of their “new” environment. When the environment is proved to be suitable and the primary colony is attached to the surface, secondary colonizers are involved resulting in a multi-species biofilm. The species within this biofilm will grow, resulting in an increase in biomass and the production of an extracellular matrix, also known as extracellular polymeric
Figure 1 Schematic overview of concentration pattern in a soil column.

3
substance (EPS). This EPS fraction consists primarily of polysaccharides and may account for 50% to 90% of the total organic carbon of biofilms (Donlan 2002). For many bacterial species the specific polysaccharide composition is known. Nevertheless, this composition is largely unknown in biofilms in environmental samples (Böckelmann et al. 2003).
After irreversible adhesion of the biomass, two maturation stages can be seen in which the biofilm grows. Due to internal forces, the biofilm is able to withstand detachment forces. Nevertheless, the layer will not grow unlimited and cells are dispersed in the last stage of the biofilm lifecycle. This gives the cells the possibility to spread and colonizes on new surfaces.
Although every biofilm is unique, they can be seen as heterogeneous structures separated from other microcolonies by interstitial voids. These microcolonies, which can be seen as the basic structural unit of the biofilm, can create gradients in nutrient concentrations, are able to exchange genes and can communicate due to quorum sensing, also known as cell-to-cell signalling. (Donlan 2002)
After a decade of research, biofilms are regarded as a complex and dynamic systems, allowing microorganisms to adapt to changes in environment. (Battin et al. 2007). Although, biofilm research in laboratory experiments can provide knowledge about e.g. microbial interactions, they are not sufficient to provide an overview of the open and highly dynamic communities in nature. Natural biofilms are assumed to be a part of a larger microbial network. Battin et al. 2007 laid the foundation for a unifying theoretical basis for research in the field of the relationships between biodiversity, ecosystem function, and the effects of composition, structure and biofilm function, by assuming that biofilms should be regarded as microbial landscapes.
Figure 2 Different stages of biofilm formation (Dalke 2002)
1. Initial attachment; 2. Irreversible attachment; 3. Maturation I; 4. Maturation II; 5. Dispersion

4
Figure 3 Biofilms as microbial landscapes: A microbial biofilm in a sedimentary environment. (Adapted
from Battin et al. 2007) 1) Coalesce and accumulation of biomass in slow flow. 2) Development of filamentous streamers in fast flow. 3) The landscape topography might be preferential trajectory for dispersal cells to land. 4) Heterogeneity of the microbial landscape.
Within these landscapes, the texture of the surface determinates the primary structure of the biofilm. Furthermore, boundary conditions induced by e.g. water dynamics, will determine mass transfer. Figure 3 illustrates the theory of these microbial landscapes.
An example of a natural biofilm, dominated by cyanabacteria growing over a sediment layer is shown in Figure 4. As indicated before, many different species inhibit such a biofilm. Some examples are also shown in this figure. Since it is important to see what kind of organisms can be found in biofilms on sediments, the next chapter will focus on different species in general.
A
B
Figure 4 Biofilms in nature. A. Photograph of biofilm dominated by cyanobaceteria, grown over a sediment layer. (Banfield et al. 2007) B. Biofilm inhabitants (From: D.C. Sigee 2005)

5
1.1.2 The Tree of Life
"The affinities of all the beings of the same class have sometimes been represented by a great tree... As buds give rise by growth to fresh buds, and these if vigorous, branch out and overtop on all sides many a feebler branch, so by generation I believe it has been with the great Tree of Life, which fills with its dead and broken branches the crust of the earth, and covers the surface with its ever branching and beautiful ramifications."
Charles Darwin, 1859
151 years ago, an English revolutionist was born. Charles Robert Darwin changed the world with the publication of On the Origin of Species (1859). Nowadays, his theory forms (in modified form) the basis of the theory of life sciences and explains the diversity of life. This diversity can be illustrated by the Tree of Life, a branching diagram showing the evolutionary relationships among various biological species. Darwin would be pleased to see that modern DNA techniques made it possible to track evolution and relatedness of species.
The Tree of Life, also known as the phylogenetic tree, contains an enormous amount of microorganisms. For example, the number of bacterial species worldwide is estimated to be more than a thousand million (Bach et al. 2002). It goes behind this report to clarify the different techniques to make it possible to track down the relatedness of species, but decades of research resulted in the modern classification of living organisms into three domains of life (Figure 5).
Figure 5 The three domains of life, based on the comparision DNA sequences from different organisms.

6
Characteristics of the organisms dedicated to these domains are described next, but first it must be mentioned that the origin of life is still unknown. Therefore, the root can be seen as a question mark. Furthermore, it is important to realize that the tree is a simplified overview of the relatedness, which is sometimes more like a web. Nevertheless, those trees can be seen as a useful summary of relationships as they appeared in time, since the distance of the braches in the tree are indicators of the time line of evolution. Nevertheless, it does not show the actual number of species and new information can result in a change in the branches, indicating that a tree is not sufficient to show the complete history of life. Furthermore, there is a difference between a gene tree and the tree of life. The latter is based on taxonomy, which is less relevant for the later chapters in this report, whereas genetic trees can be used to identify species in an environmental sample.
Bacteria, Archaea and Eucaryotes1
The group of bacteria, also known as eubacteria, are single-celled organisms. They do not have a cell nucleus and are therefore prokaryotic. Of all living organisms, bacteria are least complex according to structure. On the other hand, their metabolic pathways are diverse and flexible. Furthermore, a diverse range of morphology can be found. One can make a distinction between gram negative and gram positive bacteria, which differ in membrane composition. Besides, bacteria can be classified according to their metabolic activity.
In general, a heterotrophic organism cannot fix carbon and uses organic carbon for growth and maintenance. Heterotrophic organisms can be classified as chemohetereotrophs and photoheterotrophs. The latter uses light as electron donor. Autotrophic organisms at the other site, are able to convert inorganic compounds and can be divided in chemoautotrophic- and photoautotrophic organisms.
While a big group of organisms can use oxygen (aerobic), this molecule can be highly toxic for others (strictly anaerobic organisms).
The second group of prokaryotes are the archaea, or archaebacteria. Their biochemical processes differ from those of bacteria and eukaryotes. Furthermore, their membranes contain ether-linked lipids bonded to glycerol, which cannot be found in bacterial membranes.
Eukaryotic organisms, on the other hand, have separate organelles as well as a cell nucleus. These cells consist of different compartments and are therefore more complicated. The greatest biomass is covered by fungi, who can be divided into three general groups: molds, mushrooms and yeasts. Other groups of eukaryotic microorganisms commonly found in water related environments are protozoa and algae.
Fortunately, all these cells consist of cell membranes which can be used for biomass quantification (see chapter 1.2.7.2). On the other hand, the different species can be distinguished based on conserved gene sequences as described in chapter 1.2.5.3.
Furthermore, the basics of biological classification must not be unmentioned. All three domains (Bacteria, Archaea and Eukarya) are subdived into kingdoms (e.g. animals).
1 It goes beyond this report to go into details on the different organisms and I would like to refer to Madigan, M. and J. Martinko (2005). Brock Biology of Microorganisms, Prentice Hall. for further information.

7
These kingdoms are again divided in phyla. Each phylium consists of different classes which are then divided in orders. The orders consists of different families, which are then divided into genera and subdivided in species. The classification is illustrated in Table 1. Note that the full name of a species must be written in italic and consists of the genus name with a capital letter and the species name with a small letter.
Table 1 Biological classification and an example of classification of a tiger.
Before different quantification, detection and activity measurement techniques are discussed, it is important to point out what microbial life looks like in soils and sediments.
1.1.3 Microbial habitats
Microorganisms can be detected everywhere on earth, due to their unique ability to adapt to extreme conditions. Regarding this report, it is of interest to see what microbial life in soils and subsurface material looks like. These materials consist of three phase systems: i) a solid or mineral inorganic phase, ii) a liquid phase and iii) a gas phase. In general, those organisms that are best adapted to the soil environment are most successful. (Maier et al. 2009)
In surface soils, great numbers of archaea, bacteria, fungi, algae and protozoa populations can be found. Concentrations of culturable microorganisms can be found in the range of 108 per gram of dry soil, whereas direct counts are one or two orders of magnitude larger. The distribution of these organisms in the surface soil is dependent on the soil texture and structure.
Concentrations of culturable microorganisms in subsurface soil are dependent on depth and the type of porous media and range from zero to 107 per gram of dry soil. On the other hand, direct counts range from 105 to > 107 cells per gram of porous media. This difference is high compared to life in surface soils which is dedicated to the presences of viable but non-culturable and viable but difficult to culture microbes (VBNC and VBDC respectively). Furthermore, one can distinguish between shallow- and deep subsurface area’s. (Maier et al. 2009)
The groundwater environment is located in the subsurface zone. Bacteria are the dominant organisms in this environment and most populations are attached in biofilms. Especially in intermediate and deep aquifers, low levels of activity are found compared to other aquatic habitats.
In a soil habitat, the majority of bacteria are heterotrophic. They derive carbon and energy from complex organic substances and nitrates and ammonia compounds are used as nitrogen source.
Dominant culturable soil bacteria are Arthrobacter, Streptomyces, Pseudomonas and Bacillus. The
Domain Kingdom Phylum Class Order Family Genus Species
Eukarya Animals Chordata Mammalia Carnivora Felidae Panthera Panthera tigris
Figure 6 Simplified version of the nitrogen cycle. (From: Stars and Seas.com 2010 )

8
Arthrobacter genus is an aerobic, gram-positive bacterium that is resistant to extreme dryness and starvation. Furthermore, this bacterium is classified in the phylum of Actinobacteria, which count for 13 ± 12 percent of the total soil community Maier et al. 2009. The largest genus of this phylum is Streptomyces, which is characterized by a complex secondary metabolism.
The Pseudomonas genus are rod shaped gram-negative bacteria classified as gamma Proteobacteria. They can metabolise a broad range of nutrients and can be found in biofilm layers. The Proteobacteria phylum is estimated to count for 40 ± 20 percent of the total soil community. Besides, organisms within this phylum are relative easy to culture. (Maier et al. 2009 )
On one hand, taxa with specific physiological capacities can be found in soil habitats. An example of biological processes in soil can be found within the nitrogen-cycle. Thereby, the Nitroso-genera are able to oxydize ammonia, whereas Rhizobium-genera are responsible for nitrogen fixation. Other taxa with specific physiological capacities are the Methylo-genera, which can oxidize methane. These organisms have been well studied, resulting in reasonable knowledge about their ecological capacities.
On the other hand, there is a lack of understanding of the majority of soil organisms. This can be dedicated to the fact that the majority of those organisms can not be cultured. Fortunately, molecular methods (see chapter 1.2.5) have been developed and are proved to be very useful for the examination of the ecological characteristics of individual soil bacteria or microbial communities. Fierer et al. 2007 investigated the microbial taxa within 71 soil samples from a wide range of ecosystem types. Quantitative PCR techniques with 16S ribosomal DNA (see chapter 1.2.5.4 and 1.2.5.3 respectively) as well as statistical analysis resulted in the distribution of soil taxa represented in Figure 7.
Figure 7 Relative abunances of different bacterial phyla in soil. Fierer et al. 2007

9
Besides, carbon and nitrogen mineralization rates were used in the research of Fierer et al. 2007 in order to see if those different phyla could be characterized as copiotrophs or oligotrophs. Copiotrophic organisms have high nutritional requirements and consume easy degradable soil organic carbon pools. Furthermore, abundant resource conditions can result in high growth rates. Oligotrophic organisms, at the other hand, are characterized by lower growth rates and are able to grow under low nutrient availability. It was concluded that some of the abundant phyla could be divided into copiothrophic and oligotrophic groups. The Acidobacteria were abundant under low nutrient conditions and could therefore be grouped as oligothrophs. On the other hand, β-Proteobacteria and Bacteriodetes were indicated to be a member of the copiotrophic group. The other groups (α- Proteobacteria, Firmicultes and Actinobacteria) could not be grouped based on this study. Therefore, it might be that this classification might not apply to certain taxa.

10
1.2 Technical description of methods for detection, quantification and activity measurements
Microorganisms can be detected, quantified and their activity can be determined. In order to do so, different techniques are necessary. These different methods are described in the following chapters. It is important to notice that a combination of various techniques is crucial for a proper overview of the microbial life in a natural environment, such as in sediments.
Questions like “who is living there?”, “how many are there?” and “how active are they” or “what are they doing there?” are important in order to extent knowledge of degradation processes in artificial recharge sites. In other words, knowledge about inhabitants of a microbial community can help to understand underlying principles of biological degradation. These single inhabitants are not per se interesting, but when microbial community composition under influence of different environmental changes (e.g. temperature and the presence of oxygen) are compared one can get a deeper inside in degradation processes caused by the different organisms.
As described above, those questions can be unravelled by various techniques, which can be grouped according to the following classes:
• Microscopic techniques
• Cultural methods
• Nucleic acid based techniques
• Physiological methods
Furthermore, there are some methods that are not consistent with this classification. Therefore, they will be described under the name of “various techniques”.
Finally yet importantly, some methods can be grouped in different classes. An example is the FISH method (chapter 1.2.2.1.3), which is used in microscopic analyses but is based on nucleic acid based techniques. In combination with other analysing techniques it can also be used for physiological analysis.

11
1.2.1 Methods for soil and sediment sampling
As indicated before, the aim of this report is to provide a recommendation for the use of microbial analysis of aquifer recharge sediments. In the light of this goal, it will be important to describe sampling techniques necessary to obtain the most reliable results.
The various analyses will be performed during soil column studies. This chapter will not focus on the sampling of these columns, but on obtaining natural sediments for in the columns. Sampling techniques used for e.g. microscopic analysis, such as the buried slide technique, are described when necessary for a specific method and thus not in this chapter.
1.2.1.1 Environmental sampling
Many factors will influence the presence of organisms in a given environment. Therefore, the general sampling strategies for analysis of microbial communities in soil and sediments are dependent on many factors. Existing standards for soil and sediment sampling (e.g. ISO 10381-2 (2002) and ASTM E 1391-03 (2008)) were developed having in mind specific purposes like optimization of nutrient availability in farm land, assessment of contamination at industrial sites or lake sediment sampling in connection with water quality assessments. They need to be therefore applied carefully to solve microbiological questions and potentially adapted to fit the specific needs:
Since the inhabitants of a microbial community will vary with e.g. dept and soil type, it is important to establish a suitable sampling strategy. This can be done by performing a Quality Assurance Project Plan (QAPP). This plan contains a strategy for sampling separated in the estimation of the number and locations of samples, as well as the depths, times and intervals. Furthermore, the specific methods and equipment that will be used for sampling must be estimated and a strategy for sampling storage must be ascertained. (Maier et al. 2009)
In order to obtain representative information about the community, taking many samples at different places and analyse them separately will be most accurate. Nevertheless, this will be very expensive. It is also possible to combine samples into a composite sample, which will reduce the costs of the analysis. Furthermore, a site can be sampled over time in order to see influences of temporal effects. (Maier et al. 2009)
Sampling of surface sediments is less expensive than subsurface sampling, since a simple hand auger can be used for sampling. It must be mentioned that these augers have a limited diameter, and since soils are heterogeneous, the collected sample might not be representative for the whole sampling site. (Maier et al. 2009)
Different methods can be used to obtain samples from subsurface sediments. In case of unsaturated sediments, air rotary drilling can be used. Thereby, the drilling process will be cooled in order to prevent overheating which can cause sterilization and will demolish the sample. An disadvantage of this cooling, which is performed by the use of a surfactant, is an increase in the contamination risk. Therefore, another option to prevent overheating is to drill very slowly. Saturated sediments, on the other hand, are less cohesive which makes the drilling process more difficult. In this case, hollow stem auger drilling and push tube sampling can be used for a sampling depth till 30 meters. For deeper sampling procedures, mud rotary drilling is used. Overall, drilling is a difficult and expensive procedure and the obtained cores are not always representative for the field site due to heterogeneity of the sediments and possible compression during the drilling process. (Maier et al. 2009)
The most important aspect of sampling is to prevent contamination. Therefore, samples must be stored in ice as soon as possible and must be kept frozen until further analysis. Since microorganisms in the subsurface are not routinely exposed to the atmosphere it is of importance to handle these samples with even more care. Furthermore, for a more

12
reliable representation of the microorganisms in a sample, the outside layer of a subsurface core can be scrapped of before analysis.
In summary, sampling is a sophisticated engineering field which requires a specific strategy depending on the field site that is been researched.
1.2.1.2 Detachment of microorganisms from an environmental biofilm
As indicated before, microorganisms can be found in biofilms. Since most analysing techniques are based on investigation of the number of microorganisms as well as indication of different species, it is important to detach the organisms for the EPS matrix (see chapter 1.1.1). Several detachment methods are available and they can be classified by according to i) chemical, ii) mechanical, iii) enzymatic based methods. Furthermore, a combination of mechanical and enzymatic procedures is commonly used.
Various interactions of humic substances with microorganisms as well as the presence of soil minerals and the firm attachment to the biofilm matrix makes it difficult to obtain the organisms present in the soil samples.
As indicated before, the composition of the specific polysaccharides in the matrix of an environmental biofilm, is largely unidentified. Fortunately, different enzymes can degrade these polysaccharides. Therefore, a combination of enzymes is necessary for a proper detachment of the individual inhabitant of a microbial community.
Böckelmann et al. 2003 developed a new enzymatic method for the detachment of particle associated soil bacteria. In order to do so, the major fraction of polysaccharide compounds was detected and a minimal enzyme mixture sufficient for destabilization was designed. Total cell counts were determined by the use of DAPI staining (see chapter 0) and the cells were analysed by epifluorescence microscopy.
This new method showed a considerable increase in the total cell counts and is now commonly used at the Technische Universität Berlin.
Kallmeyer et al. 2008 developed a new method for cell extraction on deep surface sediments. In order to do so, different methods and reagents were tested and compared with available methods. Based on comparison with untreated sediments and pure culture organisms, it was concluded that the technique minimises cell lysis. They claimed that this new procedure enables the determination of cell abundances with high sensitivity and precision.
1.2.1.3 Extraction of nucleic acids from soils
The upcoming use of nucleic acid based techniques (see chapter 1.2.5) led to an increased interest in valuable DNA / RNA extraction methods. These methods are extremely important since the efficient extraction is a crucial first step in nucleic acid based analysis. Extraction methods can be divided in direct and indirect methods. In the first methods, nucleic acids are direct extracted after in situ lysis followed by DNA purification. The latter approach is based on a separation of the cells from the soil particles (see chapter 1.2.1.2), followed by lysis and purification. It must be mentioned that numerous commercial kits are available for the purification steps.
Robe et al. 2003 reviewed the different available nucleic acid extraction methods. Thereby three different types of cell lysis (physical, chemical and enzymatic disruption) are described. The most commonly used physical methods are freezing-thawing or boiling and bead-mill homogenization. It must be mentioned that physical methods have probed to be efficient for disruption of small cells and spores, but the often result in significant DNA shearing. Chemical lysis is often performed by the use of detergents such as sodium dodecyl sulphate (SDS) and those detergents are often used in combination with chelating agents, e.g. EDTA. A buffer has an effect on the quantity and

13
purity of DNA, so the choice of the buffer will be a compromise. Furthermore, lysozyme treatment is one of the most commonly used enzymatic methods.
In general direct extraction methods are less laborious, less biased and will result in higher nucleic acids yields. This method is preferred when large nucleic acid quantities are required and when the complete microbial community is analysed with a minimum bias. A drawback of this method is the contamination with humic acids and the unknown concentration of extracellular- or eukaryotic DNA in a purified sample. Indirect extraction methods are useful when high purity DNA is required. (Robe et al. 2003)
Williamson et al. 2010 conducted experiments in order to improve the indirect extraction of prokaryotic DNA from soils. They aimed to develop protocols to selectively extract nucleic acids representative for the whole microbial community. The protocols were tested based on 16S rRNA PCR-DGGE techniques (see chapter 1.2.5). It was concluded that mild detergents are essential for a complete dispersion of soils and for the detachment of prokaryotic cells. Sodium deoxycholate proved to be effective for a broad range of soils and repeated extractions are critical in order to maximize the cell yield.
It might be of interest to mention that Oliver Thronicker (PhD, Technische Universität Berlin, Umweltmikrobiologie) uses glass beads which are exposed in the area of interest for several weeks. After that, the biofilm is mechanically sheared from the bead a commercial kit for extraction of environmental DNA is applied (MP Biomedicals - Fast DNA Spin Kit for Soil) is used. For small grain size, it should be possible to apply this kit directly without the use of glass beads.
In conclusion, no ideal extraction method is available at the moment and the optimal strategy will depend on various factors.

14
1.2.2 Microscopic techniques
Ever since Antonie van Leeuwenhoek detected microorganisms with a microscope, the field of microscopy has been developed. Until today microscopy plays an important role in the study of microbial life. Only in recent years flow and solid phase cytometry have shown the potential to replace microscopic methods, especially for rapid assessment.
This chapter will give an overview of the use of different microscopic techniques and will focus on fluorescence microscopy. First, the background principles of fluorescence will be clarified, followed by different methods for fluorescent staining.
Furthermore, light microscopy will be shortly discussed and the principles of electron microscopy and atomic force microscopy will be highlighted.
1.2.2.1 Fluorescent microscopy
1.2.2.1.1 Background on fluorescent microscopy
Molecules in cells and tissues are often detected by fluorescent microscopy. This technique is widely used and very powerful when fluorescent dyes are coupled to antibody molecules which are highly specific. In order to detect molecules, they must be tagged by the use of a fluorescent dye, which is a molecule that absorbs light at one specific wavelength. (Alberts et al. 2002)
A. B.
Figure 8: A. Schematic overview of the optical system of a fluorescence microscope ; B. Different fluorescent dyes (Alberts et al. 2002)
If a fluorescent molecule is illuminated at a specific wavelength that can be absorbed by this molecule, it will emit another longer wavelength. When this emitted wavelength is passed through a filter that allows only this specific light, one can see it glow against a dark background. This dark surrounding makes it possible for you to detect even the slightest amount of light. In order to be able to see this light, a fluorescent microscope is necessary. Figure 8 gives an illustration of the system of such a microscope, which is similar to an ordinary light microscope except for the fact that the illuminating light is passed through a set of filters. The first filter let only the wavelengths pass that excite the
15
specific fluorescent dye. This light is blocked out by the second filter which only let the emitted wavelengths pass. The maximum excitation and emission wavelengths for specific dyes are shown in Figure 8 (Alberts et al. 2002).
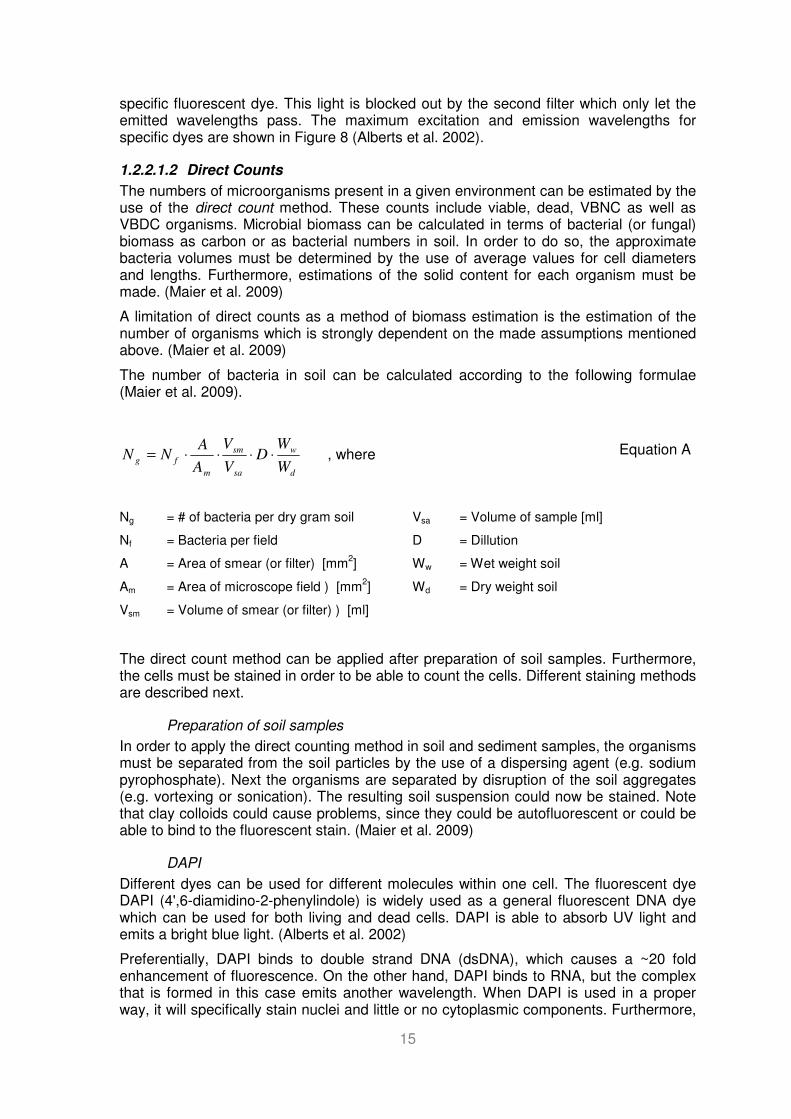
1.2.2.1.2 Direct Counts
The numbers of microorganisms present in a given environment can be estimated by the use of the direct count method. These counts include viable, dead, VBNC as well as VBDC organisms. Microbial biomass can be calculated in terms of bacterial (or fungal) biomass as carbon or as bacterial numbers in soil. In order to do so, the approximate bacteria volumes must be determined by the use of average values for cell diameters and lengths. Furthermore, estimations of the solid content for each organism must be made. (Maier et al. 2009)
A limitation of direct counts as a method of biomass estimation is the estimation of the number of organisms which is strongly dependent on the made assumptions mentioned above. (Maier et al. 2009)
The number of bacteria in soil can be calculated according to the following formulae (Maier et al. 2009).
d
w
sa
sm
m
fgW
WD
V
V
A
ANN ⋅⋅⋅⋅= , where
Equation A
Ng = # of bacteria per dry gram soil
Nf = Bacteria per field
A = Area of smear (or filter) [mm2]
Am = Area of microscope field ) [mm2]
Vsm = Volume of smear (or filter) ) [ml]
Vsa = Volume of sample [ml]
D = Dillution
Ww = Wet weight soil
Wd = Dry weight soil
The direct count method can be applied after preparation of soil samples. Furthermore, the cells must be stained in order to be able to count the cells. Different staining methods are described next.
Preparation of soil samples
In order to apply the direct counting method in soil and sediment samples, the organisms must be separated from the soil particles by the use of a dispersing agent (e.g. sodium pyrophosphate). Next the organisms are separated by disruption of the soil aggregates (e.g. vortexing or sonication). The resulting soil suspension could now be stained. Note that clay colloids could cause problems, since they could be autofluorescent or could be able to bind to the fluorescent stain. (Maier et al. 2009)
DAPI
Different dyes can be used for different molecules within one cell. The fluorescent dye DAPI (4',6-diamidino-2-phenylindole) is widely used as a general fluorescent DNA dye which can be used for both living and dead cells. DAPI is able to absorb UV light and emits a bright blue light. (Alberts et al. 2002)
Preferentially, DAPI binds to double strand DNA (dsDNA), which causes a ~20 fold enhancement of fluorescence. On the other hand, DAPI binds to RNA, but the complex that is formed in this case emits another wavelength. When DAPI is used in a proper way, it will specifically stain nuclei and little or no cytoplasmic components. Furthermore,

16
DAPI can be used for cell analysis in a flow cytometry experiment. Furthermore, there are different protocols for the use of DAPI.
AODC
Another widely used stain is Acridine Orange resulting in Acridine Orange Direct Counts (AODC). Like DAPI, this dye also binds to DNA and RNA, resulting in respectively orange or green stained bacteria.
CTC
CTC (5-cyano-2,3-ditolyl tetrazolium chloride) is a redox dye, which changes colour depending on the oxidative state. The reduced form, formazan (CTF), which is obtained by chemical or biological reduction, is fluorescent and can therefore be detected. Therefore, the dye will only give a fluorescent signal when it is in the reduced state.
This method will also be useful for activity estimations, since it provides information about the amount of respiration.
Life/ Dead staining
When specific probes are used, it is possible to distinguish between living and dead microorganisms based on their binding capacity for one of the two stains. The green-fluorescent nucleic acid stain SYTO9 has the ability to bind intact cell membranes as well as damaged ones. On the other hand, the red-fluorescent stain propidium iodide, can only bind to cells that are damaged. This will result in a decrease in green fluorescence when both probes bind to a damaged cell. Eventually, living cells will emit a green fluorescent light, whereas dead cells are coloured in red.
Despite, Life / Dead staining is always a bit problematic. In reality the red stain, which is supposed to stain only dead cells, also stains some living cells.
1.2.2.1.3 Fluorescent in situ hybridization (FISH)
Fluorescent in situ hybridization is a nucleic acid based technique and is therefore described in chapter 1.2.5.8. Thereby, a fluorescent signal is produced which is analysed by the use of a fluorescent microscope. Therefore, it is a combination of a microscopic- and nucleic acid based technique.
1.2.2.2 Visible light microscopy
Although the last couple of chapters focussed on the use of fluorescent based techniques, the field of visible light microscopy must not be unmentioned. This type of microscopy contains bright-field microscopy, which is most commonly used to examine morphology of organisms in an environmental sample.
It is important to notice that it is difficult to distinguish bacteria from their surroundings. Since microorganisms are small, visible light microscopy will result in low contrast and the colour of the organisms will be similar to the colour of the surrounding medium. (Maier et al. 2009)
Furthermore, quantification of microorganisms by the use of this type of microscopy is difficult due to interference with soil particles. Nevertheless, it is possible to analyse soil samples by the use of the buried slide technique, where a glass microscope slide is embedded in a soil or sediment sample. Since soil microorganisms grow in pores or aggregates, this flat area might not give a representative overview. Therefore, the pedoscope technique uses a capillary tube for the same purpose. (Maier et al. 2009)

17
Despite the flat surface, which differs from the rough structure of sand particles, the buried slide technique is very useful when performing sand filter studies (Prof. Dr. Ulrich Prof. Dr. Ulrich Szewzyk (Technische Universität Berlin, Umweltmikrobiologie) , personal communication). Langmark et al. 2001 studied the adequacy of in situ glass slides in sand filter columns. In this research, DAPI direct counts and FISH with rRNA-targeted probes were compared with a direct extraction method. Combination of FISH and the RNA-targeted probes will result in probe active counts (PAC, see chapter 1.2.7.4). Overall, considerable differences were observed. Nevertheless, neither of these methods is perfect: the glass slide method might have a bias toward selective colonization, whereas the direct extraction method has a bias toward the type of extraction. Therefore, it was concluded that both methods are important since they provide different views of the microbial life within the sand filters.
Although bright-field microscopy is a bit out dated in this research field, contrast microscopy is still a useful tool (Prof. Dr. Ulrich Prof. Dr. Ulrich Szewzyk (Technische Universität Berlin, Umweltmikrobiologie) , personal communication).
Phase-contrast microscopy makes it possible to investigate living organisms. Thereby the specimen is contrasted against a gray background. Furthermore, this is a excellent tool for investigation of internal cellular detail. Differential interference contrast microscopy, on the other hand, provides a highly contrasted, brightly coloured, three-dimensional image of living organisms. (Maier et al. 2009)
1.2.2.3 Electron microscopy
High resolution images of an environmental sample can be obtained by the use of electron microscopy (EM). In this case, light is replaced by electrons resulting in extremely short wavelengths. In order to increase the contrast, stains are often used in EM methods. The most EM methods are scanning- and transmission electron microscopy (SEM and TEM, respectively). Whereas electrons interact with the surface of the specimen in order to form an image in SEM, the latter makes use of electrons passing through the specimen. (Maier et al. 2009)
An advantage of EM is the ability to provide a fingerprint of the different elements in a sample. This technique is suitable for investigation of biological structures, but cannot be used for a general picture of the microbial population (H. Dizer, Umweltbundesamt Berlin, personal correspondence).
1.2.2.4 Atomic force microscopy
In atomic force microscopy (AFM) the contours of a surface are scanned by the use of a probe which is placed very close to the sample. Different than in the other methods, there are no lenses used. Therefore, the sensitivity of this technique depends on the probe tip. AFM is a scanning probe microscopic technique (SPM). Furthermore, this technique has been used to study the general structure of biofilms.

18
1.2.3 Laser Cytometry
During laser cytometry, similar to the flourecent microscopical methods it is necessary to label the targeted cells with a flourecent dye (see above for the different methods). A laser beam then detects the number and size of the cells automatically.
1.2.3.1 Flow cytometry
During flow cytometry it is possible to detect cells as they are passing through a laser detector. This technique makes it also possible to measure the fluorescent light emitted by a single particle. One can also detect specific wanted cells due to the ability to distinguish separate particles. (Maier et al. 2009)
Although flow cytometry is no microscopic method it yields similar results: A flow cytometer is similar to a microscope, except that, instead of producing an image of the cell, flow cytometry offers "high-throughput" (for a large number of cells) automated quantification of set parameters.
1.2.3.2 Solid phase cytometry
During solid phase cytometry cells are retained on a filter, dyed with a specific flourecent dye and then counted by an automatic Ar laser scanning device.
It must be mentioned that cytometry is less sensitive than fluorescent microscopy. Auto fluorescent particles can cause bias and the method might not distinguish between particles which are attached to each other. Therefore, it might be better to detect fluorescent particles with a human eye by the use of a fluorescent microscope. (H. Dizer, Umweltbundesamt Berlin, personal communication).

19
1.2.4 Cultural methods
A traditional method for analysis of microbial life in natural environments is the use of cultivation. Thereby it must be mentioned that less than 1% of the bacteria can be cultured mainly due to our ignorance of the conditions of the natural environments. (Muyzer 1999). Nevertheless, cultural methods are widely used by environmental microbiologists. Therefore, the most commonly used methods are described in this chapter.
Cultural techniques are useful when a specific genus or species within an environmental community is investigated. For example, when one wants to isolate methane reducing bacteria, the culture conditions must be favourable for these bacterial species and the other genera will be out competed. Important physiological processes are:
- Ammonification
- Nitrification
- Denitrification
- Desulfation
- Methanification
It must be noted that cultural techniques are not sufficient for investigation of a complete microbial community. Furthermore, this technique can only be used for bacterial isolates for which optimal cultivation criteria have been determined.
1.2.4.1 Extraction and plating of microorganisms from soil and sediments
In order to cultivate organisms, samples are needed. Chapter 1.2.1 focussed on sampling methods. In order to cultivate organisms it is important to extract the microorganisms from the soil or sediment sample. It was mentioned before, that an extracting solution (surfactant) can be used to separate organisms from the sediments and that a combination of enzymes will improve the extraction.
Besides this extraction, a dilution series must be prepared in order to separate the organisms into individual reproductive units. Sterile water is most commonly used to dilute the samples, but note that this not prevents osmotic shocks. (Maier et al. 2009)
1.2.4.1.1 Plating methods
Two plating methods can be distinguished: the spread plate- and the pour plate method. In both methods petri dishes with agar and selective nutrients are used. In the first methods, the sample is uniformly spread over the dish, whereas in the latter the sample is mixed with the agar. (Maier et al. 2009)
The next step is to incubate the plates so that colonies are formed. Those colonies could be expressed as colony-forming units (CFU´s). Note that it is assumed that each colony formed orginitates from a single bacterial cell. This can result in an underestimation of the total number of bacteria, since colonies may also arise from chains or clusters of bacteria. (Maier et al. 2009)
The number of CFU´s can be calculated according to equation A. Note that it might be of interest to calculate the number of CFU´s per gram of dry soil. In order to do so, equation B must be used to calculate the part of dry soil in the moisture content. (Maier et al. 2009)
Figure 9 The diversity of marine bacteria on an agar plate. (From: NIWA 2006)

20
colonies ofnumber factorDilution
1CFU ofNumber ⋅=
(D) dry weight
(D) dry weight-htmoist weigcontent Moisture =
Equation B
1.2.4.1.2 Most probable number
Another technique to estimate the number of bacteria in an environmental sample is the most probable number (MPN) method. In this case, the population is diluted to extinction and inoculated in tubes with specific liquid medium. Based on e.g. turbidity and the presence of a specific substrate, tubes containing grown organisms are marked as positive, while the others are negative. Based on the number of positive and negative tubes at each dilution, the number of organisms present in the original sample can be calculated. In order to obtain the MPN statistical tables and computer programs are necessary. Maier et al. 2009)
This method is useful when a specific group of organisms, e.g. nitrifying bacteria, is investigated. Nevertheless, it is very labour intensive and the results are less precise than direct plating methods. (Maier et al. 2009)
1.2.4.1.3 Heterotrophic plate count
When one wants to estimate the number of aerobe and facultative anaerobic bacteria in in- and effluents of soil columns, the heterotrophic plate count (HPC) method is useful. Those counts are commonly estimated by the spread plate method with R2A agar. (Maier et al. 2009).

21
1.2.5 Nucleic acid based techniques
This chapter will focus on different methods for the detection of microorganisms by the use of DNA or RNA technologies. A basic knowledge about nucleic acid structures is assumed or can be found in Alberts et al. 2002.
The last decade, researchers were able to obtain complete genome sequences of hundreds organisms, which resulted in a better understanding of microbial diversity and it’s role in an ecosystem. Modern techniques make it possible to classify organisms according to their genetic fingerprint, which reflects their evolutionary relationships. In order to get a genetic fingerprint of a microbial community, different steps must be taken. These steps consist of extraction of nucleic acids from a soil sample and amplification by PCR. Two examples of different methods for microbial community analysis are illustrated in Figure 10 and are described in more detail in the next sub-chapters. Furthermore, it is worth mentioning that Jacobsen et al. 2004 reviewed recent developments in soil and aquifer analysis based on nucleic acid based techniques.
A
B
Figure 10 Schematic overview of combination of nucleic acid techniques. A. 16S ribosomal RNA analysis of microbial communities (From: Green Tringe & Rubin 2005)). B. Flow diagram of the different steps in the analysis of microbial community structure (From: Muyzer 1999)

22
1.2.5.1 Preparation of soil samples
In order to apply the techniques described in this chapter, nucleic acids must be extracted from the sediment or soil samples (see chapter 1.2.1.3). This can be done by lysing the cells which will result in the release of the DNA of all organisms in a sample. Next, the cell debris and soil particles are removed and the extracted DNA can be further purified by the use of sorption onto a packed column and other extraction steps. Commercial kits are available for the direct extraction of environmental samples.
The amount of DNA in a sample can now be determined by UV spectroscopy (260 and 280 nm) or fluorometry. (Maier et al. 2009)
1.2.5.2 Polymerase chain reaction (PCR)
Knowledge about gene sequences and genome sequences of entire species makes it possible to amplify specific DNA regions. This polymerase chain reaction (PCR) technique is a rapid and widely-used cloning technique which makes it possible to amplify a selected DNA region a billion fold. Due to this amplification, the specific region can be easily separated from the remainder of the genome. (Alberts et al. 2002)
In order to amplify DNA, two sets of DNA oligonucleotides are nessecary. These nucleotides must be complementary to the target sequence and are used to prime DNA syntheses on single strand sequences generated by heating the DNA. (Alberts et al. 2002)
The PCR method consists of several amplification cycles; every cycle doubles the amount of DNA. For effective DNA amplification, 20-30 cycles (of 5 minutes each) are required. The method is illustrated in Figure 11 and consists of the following steps (Alberts et al. 2002):
Step 1: PCR starts with a double-stranded DNA. Furthermore, each cycle begins with a heat treatment to separate these two strands.
Step 2: The mixture is cooled in the presence of a large excess of the two primer DNA oligonucleotides. This allows hybridization of the primers to complementary sequences in the two DNA strands.
Step 3: This mixture is incubated with DNA polymerase and the four DNA bases resulting in DNA synthesis, starting from the two primers.
This amplification methods is extremely sensitive and can detect one single DNA molecule in a sample. Furthermore, the method makes it possible to trace amounts of RNA by first transcribing them into DNA (reverse transcriptase, see chapter 1.2.5.2.1). (Alberts et al. 2002)
It must be mentioned that the amplification of DNA by the PCR method has a exponential character. Nevertheless, on a certain point the reaction will be limited resulting in a decrease in amplification capacity. Therefore, three stages can be divided:
1. Exponential stage
2. Levelling off stage
3. Plateau
After DNA amplification, the presence of the target genes can be verified by the use of gel electrophoresis. Multiple PCR configurations are possible, containing different primers and process schemes. It goes behind the objective of this report to describe these configurations in detail.

23
Figure 11 The PCR technique (From : Alberts et al. 2002)
Although PCR provides the revolutionary ability to detect specific or universal sequences in environmental samples it is important to notice that there are drawbacks of this method for soil and sediment sample analysis. One of those drawbacks is inhibition of the PCR reaction by metals and humic substances. Furthermore, false positive results could be obtained due to contamination or nonspecific priming. (Maier et al. 2009)
1.2.5.2.1 Reverse transcriptase PCR (RT-PCR)
Besides amplification of DNA, PCR can be used to detect RNA and messenger RNA (mRNA) molecules in a sample. The enzyme reverse transcriptase, which is an RNA-dependent DNA polymerase, is able to transcribe singe-stranded RNA into DNA.
This transcription will result in a DNA fragment complementary to the mRNA strand, therefore it is known as complementary DNA (cDNA). In order to obtain this cDNA, a primer complementary to the RNA sequence is used. This cDNA molecule can be used as template in a second PCR reaction.
This technique provides information about the “activity of genes”, since mRNA is only present when a gene is transcribed or expressed.

24
1.2.5.3 Phylogenetic markers: the SSU rRNA genes
Obviously, not all changes in DNA sequences are equal. A change in a region coding for a protein without significant regulatory role is only limited by the frequency of random errors, whereas a gene coding for a highly optimized protein or molecule cannot change easily since the “faulting” cells will not survive. These latter genes are therefore highly conserved after billion years of evolution and are perfectly recognizable in all living species.
One group of highly conserved genes is coding for a part of the ribosomal RNA subunit; the particular small subunit (SSU) rRNA genes.
The 16S rRNA gene, coding for a part of the prokaryotic ribosomal RNA subunit, is highly conserved between different bacterial- and archaeal species. On the other hand is the 18S rRNA gene specific for Eukaryotic cells.
A considerable advantage of the use of 16S rRNA gene as phylogenetic marker is it’s existence in almost every cellular organism. Besides, the genes can be amplified with standard primers.
Although the highly conserved regions make it possible to use universal primers, the gene sequences contain hyper variable regions. These regions provide the possibility to identify specific species within a microbial community. (Green Tringe & Rubin 2005, Alberts et al. 2002)
1.2.5.4 Quantitative PCR (qPCR)
1.2.5.4.1 Background
As indicated before, PCR can be used to detect the presence of specific (groups of) organisms. Nevertheless, this technique does not supply information about the number of species and can therefore not be used for biomass quantification. Initially, quantification was obtained by addition of radio labelled nucleotides. This could give an inside in the global changes of the nucleic acid population, but was still not satisfactory for identification or quantification of specific genes. (Tevfik Dorak 2006)
A reliable method for detection and measurement of the DNA particles generated during PCR is real time quantitative PCR (qPCR). This method can directly proportionate the generated particles to the amount of template prior to the start of the amplification process.
Since the PCR reaction will be slowed down after e.g. nutrient limitation, some reaction will generated more products than others. In other words, end-point quantification of a PCR reaction is very unreliable. Nevertheless, it is possible to measure the PCR products while they are accumulated in the exponential phase. During this phase it is possible to back-extrapolate to determine the starting amount of the template (and therefore to determine the quantitative amount of microbial life). (Ginzinger 2002)
Figure 12 X-ray crystal structure of a 70S ribosome functional complex (Thermus thermophilus) at 3.7Å resolution.
The 30S subunit is shown on the left (16S rRNA in cyan; 30S proteins in dark blue). (From: The Advanced Light Source 2010)

25
Figure 13 Illustration plot of nomenclature generally used in qPCR (From: Ginzinger 2002)
Figure 13 illustrates the basics of this quantitative method. First of all, a fluorescence signal threshold is determined as a function of the background fluorescence. This threshold is used to compare results of different samples. Next, the threshold cycle (Ct) is calculated, and is equal to the number of PCR cycles required to generate enough fluorescent signal to reach the threshold. These Ct values are directly proportional to the amount of starting material. (Ginzinger 2002)
The efficiency of the PCR reaction can be obtained by the measurement of a 10-fold serial dilution of a positive control template. After these measurements, the Ct must be plotted as a function of log10 which makes it possible to calculate deviations from 100% efficiency. Meijerink et al. 2001 described these calculations in more detail.
In all qPCR methods, a fluorescent signal is generated during the PCR reaction. A real-time instrument then detects this signal. Different fluorescent methods can be used while performing qPCR; the most common among them are the TaqMan® probes and SYBR Green I ® intercalating dies. (Ginzinger 2002)
Fluorescent markers
The TaqMan® method is a 5´nuclease assay which generates a signal by cleavage of a fluorescent molecule (fluor) on the 5´end of the specific target sequence. Initially, the fluor is quenched by a second molecule at the 3´end site. After the fluor breaks from its quencher due to the polymerase enzyme, a signal can be detected (Figure 14). Furthermore, the TaqMan® method can detect even signal base mutation within the target sequence. (Ginzinger 2002 )
SYBR Green I binds to double-stranded DNA. During amplification multiple SYBR Green I molecules bind to the generated product resulting in an emission of a strong fliorescent signal. It must be noted that this dye is not sequence specific. Therefore it can be used for any reaction, but is not suitable for detection of mutations in a target. (VanGuilder et al. 2008)

26
(A)
(B)
Figure 14 Schematical overview of the (A)TaqMan® method and (B) the SYBR Green I ® method (From: Gene-quantification 2002)
Methods for analyses
Besides different signal methods, one can distinguish two types of qPCR analysis, which are briefly described below.
1. Relative quantification
This method is based on a comparison of the target gene with a control gene (within the same sample). Therefore, quantification is done relative to this control gene by subtracting the Ct of the target from those of the control, which results in a ∆Ct. It is important to realize that the assumption is made that both genes does not vary in copy number or expression level. Furthermore, PCR efficiencies must be similar for all genes. (Ginzinger 2002 )
2. Standard curve quantification
This method is most successful when a small number of genes is analyzed. The use of a control gene is not necessary. Furthermore, a standard curve of a known sample (for each gene) is used to determine the copy number. (Ginzinger 2002)
1.2.5.4.2 Advantages and Disadvantage for sediment analysis
Real time quantitative PCR provides the possibility to detect and quantify gene or mRNA transcripts in complex environmental samples. Nevertheless, the requirement for prior sequence data of the specific target gene is a major disadvantage. Due to this requirement, it is only possible to detect known genes. (Smith & Osborn 2009) This method is useful when one wants to quantify the number of specific species, but is not suitable to determine which organism is responsible for degradation of a specific compound.
Finally yet importantly, this technique must be optimized for every system, which can be laborious. Nevertheless, it is a useful method to compare samples run under the same conditions.

27
1.2.5.5 Temperature and Denaturing gradient gel electrophoresis (T/DGGE)
The abundance of species within microbial communities will vary due to external changes (e.g. lack of oxygen, temperature). Fortunately, it is possible to determine the diversity of organisms in a natural habit and follow changes in microbial community behaviour over time. This determination is possible by the use a genetic finger printing technique.
It is possible to distinguish between different community members based on the specific sequence of the hyper variable regions of the SSU rRNA genes. After amplification of these genes, the amplified DNA sequences of the different members can be separated by the use of Denaturing Gradient Gel Electrophoresis (DGGE). This separation is based on the decreased electrophoretic mobility of partially melted ds-DNA in a polyacrylamide gel. This gel contains a linear gradient of a mixture of urea and formamide, which denatures the DNA strands.
These two components can destabilize the hydrogen bonds between the nucleotides. It will be harder to break DNA strands with a higher G-C content, since this base pair consists of three hydrogen bonds (whereas A-T has two). Therefore, species with a higher C-G sequence in their hyper variable region will migrate further in the gel. Furthermore, smaller molecules will move faster through the gel. Therefore, DGGE can be seen as sequence and size dependent separation technique.
A linear temperature gradient can also be used to denaturize the DNA strands; this method is known as Temperature Gradient Gel Electrophoresis. (Muyzer 1999)
A schematic overview and an example of a T/DGGE gel can be found in Figure 15.
A B
Figure 15 Schematic overview and example of T/DGGE
A). Slot A , B and C show only one organism, while a mix of those three organisms can be found in slot M. R gives a reference pattern with a known CG content, while S is a unknown sample. (From: van Houtte et al. 2005), B). Example of a digitalized inverted picture of a stained DGGE gel
A strong advantage of the use of T/DGGE for analyses of microorganisms in natural environments, is the possibility to monitor changes due to external perturbations. This technique provides information about the number of species and the influence of environmental changes on the microbial community, but it does not provide information about the activity of the community inhabitants. On the other hand, the species can only

28
be indicated when further analysis is applied. Therefore, the individual bands are cut out of the gel and after incubation in buffer, the obtained solution is used as a template for reamplification of the species specific 16S rRNA gene. After purification the specific sequence can be sequenced and data can be analysed by sequence alignment databases. Furthermore, phylogenetic trees can be constructed based on the sequence data.
Prof. Dr. Ulrich Szewzyk (Technische Universität Berlin, Umweltmikrobiologie) indicated that more reliable data will be obtained when the separated band sequences are cloned in e.g. competent Escherichia coli cells prior to sequencing.
1.2.5.6 Clone libraries
Another technique to investigate the members of a microbial community is the construction of a clone library.
In order to make a clone library, the DNA sequences (e.g. 16S rRNA gene fragments of different species in a sample) are put in a vector. This vector is a plasmid: a circular DNA molecule that can replicate independently of genomic DNA and is present in bacteria. A plasmid carries useful genes for it host bacterium, such as genes responsible for resistance of antibiotics.
In general, cloning is a technique based on cutting specific genes from a genome and pasting them in a plasmid by the use of different enzymes. The plasmid contains restriction sites: specific DNA sequences which can be “cut open” by a restriction endonuclease enzyme. The wanted gene, for example the 16S rRNA gene, is multiplied during a PCR reaction where a specific nucleotide sequence was added at both sites of the gene. This specific sequence is complementary to the sequence on the plasmid that is cut open. DNA ligases are able to connect these complementary sequences, resulting in the insertion of the wanted gene into the plasmid.
Fortunately, a plasmid can be inserted into a bacteria. This re-introduction is called transformation and provides the possibility for the replication of the plasmid in a living organism. When cultivated on agar all bacteria will grow, therefore it is unknown if the plasmid was inserted in every organism. In order to over come this, a gene involved in resistance is present on the same plasmid. When, for example, penicillin is added to the cultivation plates, only the bacteria with the marker gene causing penicillin resistance will survive. This will result in bacteria with the wanted plasmid.
For analysis of microbial communities in soils and sediments, clone libraries can be created after replication of e.g. SSU rRNA genes by PCR (see 1.2.5.3 and 1.2.5.2). Note that in this case, a specific DNA sequence must be added before and after the gene in order to be able to paste the gene in a plasmid. After replication, a sample will contain species specific SSU rRNA gene sequences, which can be inserted into a plasmid. This will result in several plasmids, each containing one SSU rRNA gene specific for one single organism.
Gene of interest (e.g. SSU rRNA gene)
Addition of flanking sequences complementary to the ends of a gapped plasmid
The wanted sequence is added inserted in the plasmid to repair the gap created by endonucleases.
Figure 16 Cloning a gene into a plasmide

29
After the plasmid is inserted into a host bacterium (competent Escherichia coli cells are often used), bacterial colonies are grown. Each colony contains a plasmid with one gene. Now, one can pick colonies of the plate, the inserted genes can be re-isolated and the gene sequences can be determined. This method is illustrated in Figure 17.
Figure 17: Transformation of Plasmid-DNA into competent E. coli-cells (Wikipedia, 2011).
In general, clone library analyses can be laborious since in some cases 200 to 500 clones must be analyzed. Besides, it can be difficult to compare different libraries. Nevertheless, they are very useful when different species within an environmental sample (“Who are living there?”) are investigated.
1.2.5.7 Sequence analysis
The order of a DNA sequence can be determined, which is known as sequencing. Numerous commercial companies provide sequencing services. For example, the Technische Universität Berlin sends their samples to Korea for analyzing. After sequencing, it is of importance to analyse the data.
One of the most commonly used programs for sequence analysis is the Basic Local Alignment Search Tool (BLAST) of The National Centre for Biotechnology Information (NCBI).
BLAST consist of a collection of tools for searching regions of local similarity between sequences. The method was first described by Altschul et al. 1990) and is based on the optimization of the maximal segment pair (MSP) score, a measure of local similarity.
The BLAST program can be used online on the NCBI home page (http://www.ncbi.nlm.nih.gov), but can also be run locally for analyses against private databases. Different BLAST programs are summarized in Table 2, for more information, see NCBI website.
In summary, BLAST can be used to search for sequence matches with sequences of known organisms.

30
As indicated before (chapter 1.1.2), phylogenetic analysis provides the possibility to see the relatedness between species. Based on (16S rRNA) gene sequences phylogenetic tree can be built to analyse the members of a microbial community. In order to do so software packages, such as ARB, are necessary. ARB can be used to analyse nucleic acid (and amino acid) sequences resulting in a visualized tree.
Table 2 Different basic BLAST programs Program
Nucleotide blast
Search a nucleotide database using a nucleotide query
Protein blast
Search a protein database using a protein query
Blastx Search a protein database using a translated nucleotide query
tblastn Search translated nucleotide using a protein query
tblastx Search translated nucleotide database using a translated nucleotide query.
Figure 18: Different hybridization conditions allow less than perfect DNA matching. (Alberts et al. 2002 )
1.2.5.8 Fluorescent in situ hybridization (FISH) NOTE THAT THIS METHOD IS A COMBINATION OF A MICROSCOPIC- & NUCLEIC ACID BASED TECHNIQUE. FURTERMORE, IT CAN BE USED IN COMBINATION WITH PHYSIOLOGICAL METHODS E.G. MAR and PAC (see chapter 1.2.6.6 and 1.2.7.4)
Another method for the quantification of cells is the use of fluorescent hybridization techniques. Nucleic acid hybridization is a sensitive method for the detection of specific nucleotide sequences.
Double stranded DNA (dsDNA) will be separated under influence of a temperature of 100°C, which is called denaturation (see chapter 1.2.5.2). Fortunately, this process is reversible; single strands can rapidly reform double helices, also known as hybridization or renaturation. It must be mentioned that complementary nucleotides are necessary in order to obtain a double helix. Figure 18 gives an overview of the hybridization reactions. Specific hybridrization reaction are used to detect and characterize specific sequences in DNA as well as in RNA molecules. (Alberts et al. 2002)
Probes are single stranded DNA molecules which are used to detect complementary DNA sequences in a sample. These probes can be marked with a fluorescent tag in order to make them visible. FISH is an example of a widely used hybridization technique with fluorescent probes. Since hybridization reactions have a very high selectivity and sensitivity, complementary sequences can be detected at a concentration as low as one molecule per cell. (Alberts et al. 2002)

31
FISH provides the possibility to detect a great amount of bacterial species by the use of a universal probe (e.g. 16S rRNA gene sequences, see chapter 1.2.5.3). But on the other hand, genus-specific or strain specific probes can be used to detect a genus or a single population of cells.
An advantage of the use of FISH for biomass detection is the possibility to detect uncultivable bacteria. Nevertheless, sensitivity can be a problem since if cells are not actively growing. In other words, low levels of metabolic activity will result in a low FISH signal. (Maier et al. 2009)
Last but not least, the different process steps necessary for obtaining the final fluorescent image are illustrated in Figure 19.
Figure 19: Process steps for the application of FISH microscopy (From: BioVisible Microbial Diagnostics 2008)
1.2.5.9 Restriction Fragment Length Polymorphism analysis (RFLP)
When one wants to distinguish between whole genomes or specific PCR products from bacterial isolates, restriction fragment length polymorphism (RFLP) is a good technique. RFLP is commonly used in combination with cloning (see chapter 1.2.5.6), whereby the generated clones are used for further analysis. (Maier et al. 2009 )
It is possible to identify or confirm sequences specific to a microbial species. First, restriction enzymes are used to cut the DNA sequences in smaller fragments. These small fragments will be species specific and therefore RFLP will result in a fingerprints of the various members of the microbial community. (Maier et al. 2009 )
It must be mentioned that the choice of restriction enzymes is empirical and a combination of enzymes is necessary. (Maier et al. 2009 )

32
1.2.6 Physiological methods
The last couple of chapters focused on the questions `who is living there?´ and `how many are there?´. Yet the last question, `How active are they?´ or `What are they doing there?´, is unanswered. Therefore, this chapter will focus on different techniques for activity assessments of microorganisms in environmental habitats.
Note that since environmental samples contain mixed cultures of microorganisms, activity analysis is more complicated than those of pure cultures.
1.2.6.1 Assimilable organic carbon (AOC) removal
Like every living organism, microorganisms will convert organic material in order to obtain energy. When natural occurring organisms in a bank filtration site are exposed to organic material in water, one will observe a decrease in organic components due to biodegradation.
Not all carbon sources are degradable and only a small part of the total organic carbon (TOC) is used for microbial growth. The part of the TOC that is actually assimilated by microorganisms is known as assimilable organic carbon (AOC). In sediments, microorganisms which are in contact with nutrients (and thus with carbon sources) will react different than microorganisms which have less nutrient availability. Therefore, it can be assumed that concentration gradients allow different physiological groups of organisms adapted to the different nutrient concentrations (Lutz-Arend & Meyer-Reil 1994). The availability of AOC would therefore provide a good estimation of the distribution of organisms in soil or sediments. Nevertheless, this fraction cannot be determined by the use of conventional equipment due to the complexity and amount of different carbon compounds and our ignorance of the biodegradability. Furthermore, microbial growth on complex media, such as growth in sediments, is different than growth on single substrates. This resulted in the design of different biological growth assays for the AOC estimation. A comparison of different methods for AOC determination is given in Hammes (2008). The AOC content in an environmental sample can be determined in several ways by the use of bioassays. During conventional AOC analysis, bacterial growth (CFU´s) is determined by plate count, direct cell count, ATP measurements or turbidity measurements. Test organisms in pure culture are used as comparison for the degradation of different nutrients. Maier et al. 2009
Hammes & Egli 2005 tested a new method for AOC analysis based on flow-cytometric (FC) enumeration combined with a natural microbial consortium instead of pure culture test organisms. This method could be used to establish complete growth curves of the natural microorganisms on AOC. An advantage of this “new” method, compared with the conventional method based on plating, is the possibility to detect inactive and/or unculturable organisms. It must be mentioned that plating is relatively easy and does not require specific equipment, but on the other hand is FC more reproducible and faster.
The AOC for a test organisms can be calculated as illustrated in Equation C. (Maier et al. 2009 ).
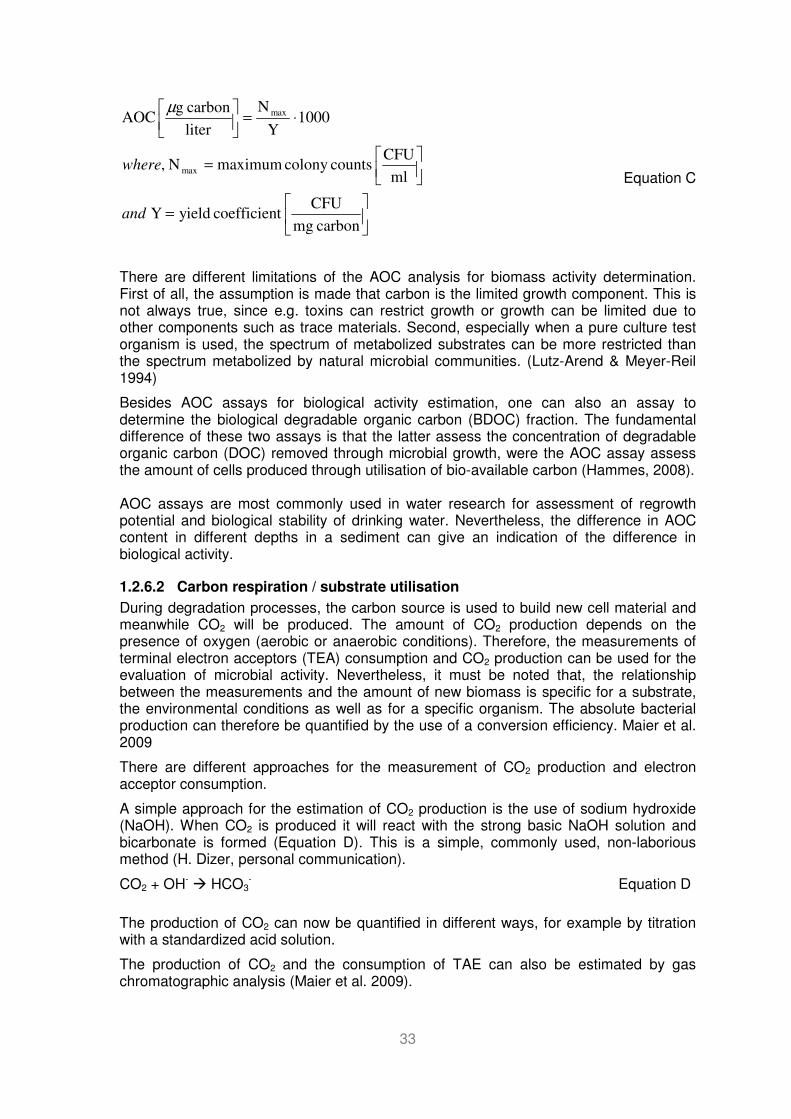
33
carbon mg
CFUt coefficien yield Y
ml
CFU countscolony maximumN ,
1000Y
N
liter
carbon g AOC
max
max
=
=
⋅=
and
where
µ
Equation C
There are different limitations of the AOC analysis for biomass activity determination. First of all, the assumption is made that carbon is the limited growth component. This is not always true, since e.g. toxins can restrict growth or growth can be limited due to other components such as trace materials. Second, especially when a pure culture test organism is used, the spectrum of metabolized substrates can be more restricted than the spectrum metabolized by natural microbial communities. (Lutz-Arend & Meyer-Reil 1994)
Besides AOC assays for biological activity estimation, one can also an assay to determine the biological degradable organic carbon (BDOC) fraction. The fundamental difference of these two assays is that the latter assess the concentration of degradable organic carbon (DOC) removed through microbial growth, were the AOC assay assess the amount of cells produced through utilisation of bio-available carbon (Hammes, 2008). AOC assays are most commonly used in water research for assessment of regrowth potential and biological stability of drinking water. Nevertheless, the difference in AOC content in different depths in a sediment can give an indication of the difference in biological activity.
1.2.6.2 Carbon respiration / substrate utilisation
During degradation processes, the carbon source is used to build new cell material and meanwhile CO2 will be produced. The amount of CO2 production depends on the presence of oxygen (aerobic or anaerobic conditions). Therefore, the measurements of terminal electron acceptors (TEA) consumption and CO2 production can be used for the evaluation of microbial activity. Nevertheless, it must be noted that, the relationship between the measurements and the amount of new biomass is specific for a substrate, the environmental conditions as well as for a specific organism. The absolute bacterial production can therefore be quantified by the use of a conversion efficiency. Maier et al. 2009
There are different approaches for the measurement of CO2 production and electron acceptor consumption.
A simple approach for the estimation of CO2 production is the use of sodium hydroxide (NaOH). When CO2 is produced it will react with the strong basic NaOH solution and bicarbonate is formed (Equation D). This is a simple, commonly used, non-laborious method (H. Dizer, personal communication).
CO2 + OH- � HCO3- Equation D
The production of CO2 can now be quantified in different ways, for example by titration with a standardized acid solution.
The production of CO2 and the consumption of TAE can also be estimated by gas chromatographic analysis (Maier et al. 2009).

34
Since the presence of CO2 can also originate from non-biological sources, therefore it is important to correct the measurements when determining the microbial activity in soil. This is especially a problem for soils which contain high amounts of calcium carbonate (CaCO3). On the other hand, non-biological oxygen consumption can occur during spontaneous oxidation of e.g. iron or copper. Corrections of these biases can be calculated by comparison with serial controls. (Maier et al. 2009 )
1.2.6.3 ATP measurements
As indicated before, organic carbon sources are used for growth and energy production. In organisms, energy “is stored” in the molecule adenosine triphosphate (ATP). This molecule consists of three phosphate groups (Pi) which are energy containing bonds. When one of these phosphates is removed from the molecule, energy is released and the molecule consists now of two phosphate groups and is called adenosine diphosphate (ADP) (Equation E).
ii PAMPPADPATP +↔+↔
Equation E
A second precursor of ATP is adenosine monophosphate (AMP). Measurements of all three adenylates can provide a better indicator for biomass than ATP analysis by itself, since no strong correlation between ATP content and microbial biomass may gold under conditions of environmental stress. Maier et al. 2009
The activity of a microbial community can be estimated based on adenylates measurements, since the relative abundance of ATP is an indicator for how rapidly the highest energy state is formed. The rated ratio of cellular adenylates is known as the adenylate energy charge (AEC) and can be determined according to Equation F. (Maier et al. 2009).
AMPADPATP
ADPATP
AEC++
+
=2
1
Equation F
ATP is quantified based on the energy transfer to a liciferin-lusiferase substrate-enzyme system. This system is the cause of the light emitting capacity of several bioluminescent organisms, such as fireflies. In order to emit light, luciferin forms a complex with the enzyme luciferase. Next, oxygen reacts with this complex and oxidizes luciferin. This brings luciferase in an excited state, when the enzyme decays back to its base energy level, energy will be emitted in the form of light.
Figure 20 Adenosine triphosphate (from:Astrobiology Magazine 2010. Image Credit: Nanyang Technological University)

35
lightAMPinoxyluciferOadenylateLuciferyl
PPadenylateluciferylATPLuciferin i
++→+−
+−→+
2
Equation G
When environmental soil or sediment samples are analysed on the ATP content, different steps must be taken. It must be mentioned that in order to perform ATP analysis on environmental sample’s, such as soils and sediments, an extraction procedure is necessary. Since, besides enzymatic degradation, ATP can be adsorbed during extraction, a correction is necessary to obtain a reliable estimation of the amount of ATP in a soil sample. This can be done by determining the ATP extractant efficiency by spiking an ATP sample with a known concentration as described by Jenkinson & Oades 1979.
The ATP methods can only be reliable for biomass quantification when the ratio of the carbon content of biomass (biomass C) and the measured ATP (the so-called biomass C-ATP ratio) is fairly constant for different soils under different conditions. However, there are methodological problems when this technique is applied in different laboratories. Therefore, Martens 2001, investigated the reliability and validity of extraction efficiencies of added chemical ATP standards to correct for incomplete extraction of native ATP. In order to do so, he compared the obtained correction factors of the Jenkinson method with the efficiency of multiple extraction steps. These multiple steps were used under the assumption that adding fresh extraction buffer for several times would result in the total extraction and would reduce the adsorption. Therefore, fresh extraction medium was used until the ATP content of the extractant was under detection limit. ATP contents of the latter method were proved to be 2 to 9 times higher than calculated based on the Jenkinson method. This indicates an underestimation of the ATP content when applying this last method. (Martens 2001 )
Despite these results, Contin et al. 2002 performed a similar test with samples with a different clay content (26 -29% instead of 5 – 51%) and different measurement equipment. They did not find significant differences between the obtained results, which indicate that the criticism of Martins is not valid.
These two articles again pointed out that different methodologies will result in different results and that ATP measurement might not result in the measurement of all ATP present in a soil or sediment sample.
On the other hand, an advantage of the AEC method for microbial community activity assessment is that the introduction of substrate is not required and incubation of the sample is unnecessary. Furthermore, ATP analysis provides the possibility to measure the presence of metabolically active microorganisms in an environmental sample. Despite these advantages, no specific population can be selected since ATP is present in all living organisms. (Maier et al. 2009 )
The use of ATP measurements for determination of biological activity in soil is strongly discouraged by Prof. Dr. Ulrich Szewzyk (Technische Universität Berlin, Umweltmikrobiologie). Higher organisms, present in natural soil environments, consume high amounts of ATP. The presence so-called ATP bombs will result in highly unreliable microbial activity estimations. In this field ATP measurements are useless and more a gambling number (Prof. Dr. Ulrich Prof. Dr. Ulrich Szewzyk (Technische Universität Berlin, Umweltmikrobiologie) , personal correspondence).
1.2.6.4 Enzyme activity assays
As ATP is an important molecule for all living organisms, energy conversion cannot take place without the presence of enzymes. When organisms degrade compounds, which is
36
one of the basic concepts of artificial recharge, in order to obtain energy, various enzymes are involved in the conversion of substrates.
When one is interested in the biological conversion of a specific component into a product, it might be useful to monitor the enzymatic reactions involved. In order to do so, a bioassay procedure for the specific substrate must be performed. Since this assay can detect specific biological activity, it can be directly related to actively growing organisms.
A drawback of the use of enzyme assay for the estimation of the activity of microorganisms is that the enzymatic activity in an organism can not be easily separated from i) activity of extracellular enzymes that are stabilized in the soil environment and/or ii) enzymes associated with decaying cells. Since the assays are often coupled to a surrogate substrate, the actual enzyme of a sample cannot be obtained and one determines the potential enzymatic activity of the sample. Furthermore, the overall activity of all types of microorganisms in a sample might not be reflected since enzyme assays are specific for a particular substrate-enzyme combination. (Maier et al. 2009 )
Despite these drawbacks, many different enzyme assays are developed to detect specific or general microbial activity in environmental samples such as soils and sediments. (Maier et al. 2009 )
The general microbial activity assays can be interesting for the estimation of biological activity in e.g. artificial recharge ponds. One of these assays measures the activity of the intracellular dehydrogenases enzymes. These enzymes are only active inside cells, which overcomes the overestimation of enzyme activity due to extracellular enzymes.
The group of dehydrogenase enzymes are involved in the respiration of organic compounds by the catalyses of the oxidation – reduction reaction. In this assay, triphenyltetrazolium is used as a substrate. The dehydrogenases will convert this to triphenylformazan, which gives a reddish colour and can be detected by e.g. spectrophotometrical or microscopic techniques. (Maier et al. 2009 )
1.2.6.5 Stable isotope probing
The fate conversion of a substrate within a microorganism can be followed when this substrate is labelled with a stable isotope such as 13C. When this stable isotope is feed to a microbial community, this compound will only be detected in the organisms converting this compound.
Stable isoptope labelling (SIP) is a cultivation independent technique which provides the possibility to link specific microorganisms with their function in an environmental habitat. After introduction of a labelled substrate the 13C molecules are incorporated into the biomass of the organisms converting this specific substrate. Now, different compounds can be analysed in order to real the specific organisms.
The first option is the analysis of polar lipid derived fatty acids (PLFAs); the building blocks of cell membranes (see chapter 1.2.7.2). This biomarker has the greatest sensitivity and can be used to determine the relative abundance of bacteria versus fungi. On the other hand, this technique is limited by the low phylogenetic resolution of PLFAs. (Uhlík et al. 2009 )
A more sensible method, is the use of DNA as biomarker (DNA-SIP). In this case, 12C and 13C DNA molecules can be separated by the use of an isopycnic (equilibrium) density gradient. Separation will result in a light (12C) and a heavy (13C) band. The latter can be used for 16S rRNA gene analysis, which enalble indentification and classification of the specific organisms. (Uhlík et al. 2009 )
The last possibility is analyses of RNA, whereby the stable isotopes are separated by the use of an isopycnic density-gradient in caesium trifluoroacetate is applied. After

37
separation, RT-PCR (see chapter 1.2.5.2.1) and DGGE can be performed. This is the most sensitive technique. Besides, it is faster than DNA-SIP. (Uhlík et al. 2009 )
Overall, the DNA-SIP technique is most often used but is labour intensive and requires careful attention in order to avoid misinterpretation of the results. (Uhlík et al. 2009 )
An interesting aspect of artificial recharge, is the question if biodegradation is occurring at site, or that concentrations of pollutants are lowered due to sorption. This question, “is biodegradation occurring at the site?” can be answered by the use of stable isotope probing. Microbial Insights Inc. (MI) developed an application for assessing monitored natural attenuation (MNA) for in situ biodegradation studies. Figure 21 illustrates this method, which is based on a bio-trap containing 13C labelled substrate placed in a site monitoring well. Often used carbon sources include benzene, toluene, MTBE and TBA, but any compound that is used as a substrate by microorganisms can be used. (Microbial Insights Inc. (MI) 2009)
Figure 21 Bio-trap method (From: Microbial Insights Inc. (MI) 2009)
1.2.6.6 Incorporation of radio labelled tracers / Microautoradiography (MAR)
Heterotrophic bacteria (see chapter 1.1.3) are able to incorporate pre-formed molecules from their environment (e.g. amino acids and nucleotides) into their cellular constituents. The rate of this incorporation gives an indication of microbial growth and therefore of biological activity. This rate can be determined when those pre-formed molecules are radio labelled and are thus used as radio labelled tracers. (Maier et al. 2009 )
This method requires a short incubation period which reduces artefacts due to extended incubation of environmental samples. On the other hand, not all bacteria are able to assimilate tracers into macromolecules. Another drawback of this method is that the extent of isotope dilution can very within a sampling site. (Maier et al. 2009 )
Two tracers that are commonly used are the nucleoside thymidine labelled with tritium (3H labelled) and the amino acid leucine (with 3H or 14C labelling). The first one will be intergraded into DNA where the latter can be traced back in proteins. (Maier et al. 2009 )
Based on radio-labelled substrates, microautoradiography (MAR) provides the possibility to visualise active cells without prior enrichment or cultivation. This is ideal when one wants to predict ecological functions of individual cells or wants to enumerate the fraction of active cells. (Nielsen et al. 2003 )

38
The radio-labelled tracers are visualised by a radiation-sensitive silver halide emulsion. The labelled organisms are covered with this emulsion. When processed by standard photographic procedures, the silver ions will precipitate as metallic silver and are visualised as black grains. (Nielsen et al. 2003 )
When MAR is combined with FISH (see chapter 1.2.5.8), physiology and identity of specific bacteria can be linked. Figure 22 gives a schematic overview of the different steps for the combination of MAR and FISH. (Nielsen et al. 2003 )
A disadvantage of FISH-MAR is that only a limited amount of seven different species can be detected within one FISH experiment, something that is overcome by SIP (see chapter 1.2.6.5). (Wagner et al. 2006 )
In summary, FISH-MAR can be used to detect and quantify organisms responsible for a certain physiological process within a given environment. More detailed information according to the use of this technique in environmental studies can be found in the review of Wagner et al. 2006.
Figure 22 : Visualization of the Micro-FISH method (http://www.hpl.umces.edu/faculty/bcrump/Micro-FISH.pdf)

39
1.2.7 Other methods
1.2.7.1 Functional genomics and proteomics based methods
In the last decade, complete genome sequences of various species became available and the number of completely sequenced species is still increasing. All high-trough put methods using these genome sequences fall within the realm of functional genomics, a field that is promising for studying microbial physiology relevant to environmental microbiology. Maier et al. 2009
Microarray´s (chips containing DNA gene sequences) can be used to determine which genes are present and which genes are expressed. This technique can therefore provide knowledge about the biodegradative potential of an environmental sample.
Another emerging field for analysis of microbial communities in the environment is proteomics, which focuses on proteins and their functions. Proteomic techniques will provide information about the effects of external factors on the mechanisms inside the cell.
In order to study the influences of these environmental effects, microorganisms must first be exposed to a specific condition. Then the proteins must be isolated, which is relatively easy. Unfortunately, separation of these proteins is a complex and challenging step which can be obtained by the use of either 2D-PAGE (two-dimensional polyacrylamide gel electrophoresis) or HPLC (high pressure liquid chromatography). Maier et al. 2009
After separation, the proteins must be identified by e.g. mass spectrometry (MS). One of the most commonly used methods for this indentification is the use of MALDI-TOF-MS (matrix-assisted laser desorption ionization time of flight MS). Maier et al. 2009
1.2.7.2 Phospolipid analysis
Phospolipids are the major lipid molecules used for the construction of biological membranes. These membranes are crucial to the life of the cells, and therefore to the life of microorganisms. In nature, there is a big variety of cell functions. Despite these differences, all biological membranes have a general structure (Figure 24). This structure can be seen as a very thin bi-layer film consisting of lipids and protein molecules. A lipid is an organic molecule which cannot dissolve in water, but tends to dissolve in nonpolar organic solvents. Alberts et al. 2002
The main category of lipids molecules are phospholipids. These molecules are composed of two fatty acid tails linked to one of a variety of polar group through glycerol phosphate (illustrated in Figure 23 ).
The phospholipid tails are hydrophobic. In other words, they will be packet together in an aqueous environment in order to exclude water. This results in the formation of a bi-layer. Alberts et al. 2002
As indicated before, phospholipids are the main component of cell membranes. Therefore, quantification of these molecules will give an estimation of the amount of cell membranes and therefore of the amount of biomass.
Figure 23 Phospholipid structure and the orientation of phospholipids in membranes (Alberts et al. 2002 ).
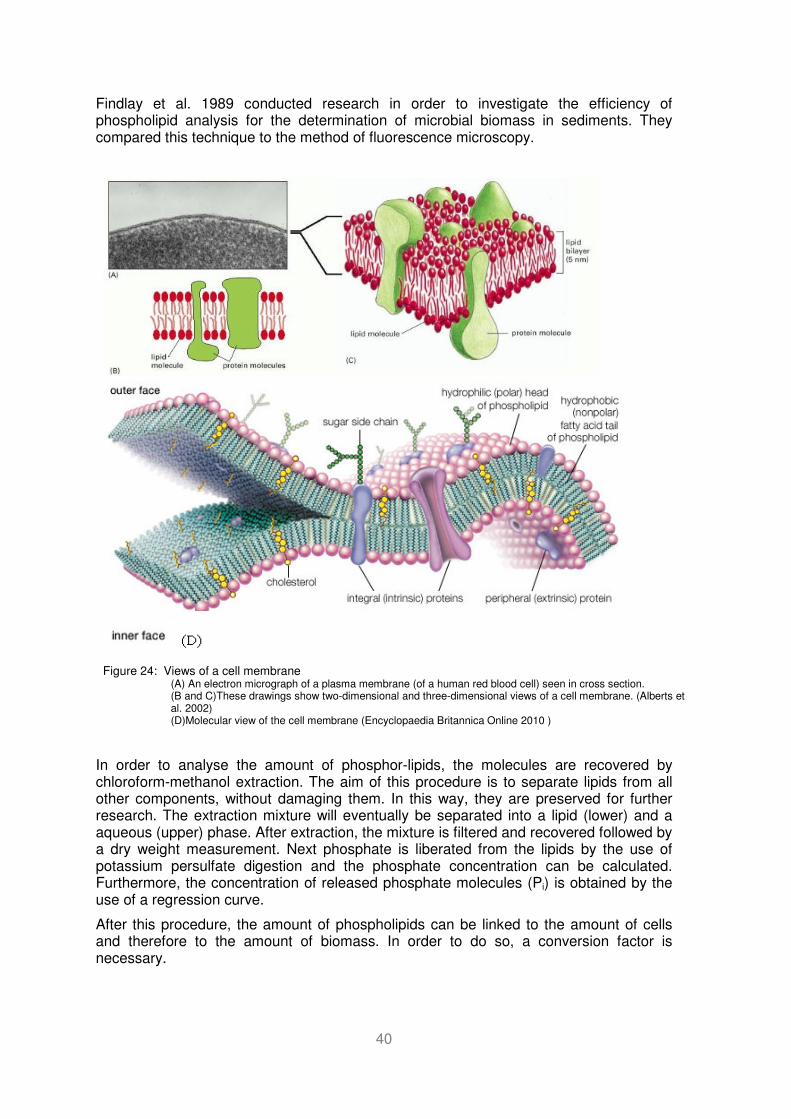
40
Findlay et al. 1989 conducted research in order to investigate the efficiency of phospholipid analysis for the determination of microbial biomass in sediments. They compared this technique to the method of fluorescence microscopy.
Figure 24: Views of a cell membrane (A) An electron micrograph of a plasma membrane (of a human red blood cell) seen in cross section. (B and C)These drawings show two-dimensional and three-dimensional views of a cell membrane. (Alberts et al. 2002) (D)Molecular view of the cell membrane (Encyclopaedia Britannica Online 2010 )
In order to analyse the amount of phosphor-lipids, the molecules are recovered by chloroform-methanol extraction. The aim of this procedure is to separate lipids from all other components, without damaging them. In this way, they are preserved for further research. The extraction mixture will eventually be separated into a lipid (lower) and a aqueous (upper) phase. After extraction, the mixture is filtered and recovered followed by a dry weight measurement. Next phosphate is liberated from the lipids by the use of potassium persulfate digestion and the phosphate concentration can be calculated. Furthermore, the concentration of released phosphate molecules (Pi) is obtained by the use of a regression curve.
After this procedure, the amount of phospholipids can be linked to the amount of cells and therefore to the amount of biomass. In order to do so, a conversion factor is necessary.

41
The use of phosphor-lipids as a measurement of biomass is relatively simple, accurate and precise. Furthermore, it is more rapid and less tedious than fluorescence microscopy.
It must be mentioned that this method was developed parallel to DNA based techniques. Nevertheless, in current research it is over taken by nucleic acid based methods described in chapter 1.2.5. (Prof. Dr. Ulrich Szewzyk (Technische Universität Berlin, Umweltmikrobiologie) , personal communication).
1.2.7.3 Immunological methods
When your immune system is triggered, antibodies against the foreign material (also known as an antigen) are produced. These molecules can be used for the study of microorganisms in natural environments. It goes behind this report to describe antibodies into detail, but it is worth mentioning that there are different classes which differ in many ways. Furthermore, the IgG antibody is most commonly used in environmental antibody assays. Since antibodies have a high specificity for an antigen, immunology-based techniques are valuable. (Maier et al. 2009)
Antigens can be detected and quantified by the use of immunoassays. In order to do so, antibody-antigen interactions must be visualized by the use of a special signal molecule. Furthermore, one can distinguish between direct and indirect labeling. The first one is based on a signal molecule which is attached to an antibody, whereas the latter makes use of two steps. First, a primary antibody will attach to the target antigen. Next, a second antibody, containing a signal molecule, will bind to the primary antibody. (Maier et al. 2009)
There are different types of immunoassays such as fluorescent immunolabelling, enzyme-linked immunosorbent assays (ELISA) and Western Immunoblotting assays. (Maier et al. 2009)
It must be mentioned that the acceptance of this technology in the field of environmental analysis has been very slow. Besides, this technique will be a useful tool when one wants to detect specific organisms (e.g. pathogens), but is not sufficient for a complete analysis of the members of a microbial community.
1.2.7.4 Probe active counts (PAC)
It was mentioned before that low levels of metabolic activity will result in a low signal when FISH is applied. Fortunately, this can be overcome by the use of probe active counts (PAC). Thereby, microorganisms are incubated in the presence of an enrichment medium. Furthermore, antibiotics are present in order to prevent cell division. This PAC-FISH method will result in an increase in countable organisms. (Langmark et al. 2004) The PAC method was first described by Kogure et al. 1979 and later modified by Kalmbach et al. 1997. The PAC method relies on the fact that those organisms with a sufficient ribosome content to yield a clear fluorescent signal (after FISH) are counted. Besides, control experiments for the evaluation of autofluorescence or unspecific probe binding can be performed. This method is also known as direct viable counts (DVC). (Langmark et al. 2004)
1.2.7.5 Combinations of methods in soil column investigations
Producing microbiologically safe drinking water with a minimal use of chemical treatment is challenge for the water industry. Therefore, various research groups investigated the microbial processes within soil column systems. It goes behind the purpose of this report to give an extensive overview of the research performed with soil column. Nevertheless, it will be useful to give a few examples.
42
Langmark et al. 2004 performed column studies in order to get a better insight in the artificial ground water treatment in Sweden. In this study, biofilm activity and organic carbon removal performance was investigated in order to gain an appreciation of the impact that aquifer microbiotica and biofilms play in the artificial recharge of source waters. First, the total organic carbon (TOC) and assimilable organic carbon (AOC) where monitored. Furthermore, microorganisms were extracted from their biofilms and glass slides were used as a comparison. Heterotrophic plate counts (HPC) and direct total counts (DTC) with DAPI staining, were analysed for the column in- and effluents. FISH analysis with 16S rRNA probes was applied on the glass slides and biofilm extractants. Besides, DAPI staining was used for DTC analysis. Furthermore, the metabolic activity was monitored by PAC-FISH. This last analysis was performed by the use of duplicate glass slides; one un-activated slide, which was immediately fixed, and an active one. It was shown that more PAC bacteria (as a percentage of the total number of bacteria) were found within the sand matrices compared to those on the glass slides.
Szewzyk et al. (1998) determined the phylogentic diversity in a pilot sand filter. FISH was used in combination with probes specific for α-, β- and γ-subclasses of the proteobacteria. In this research, cultivation techniques were combined with molecular detection and identification methods. Bacteria from the sand filter columns were isolated using R2A agar plates and isolates were chosen and further characterised. Also in this research, glass slides were used. The biofilms on those slides were examined by DAPI staining and PAC. Furthermore, different agar media were used to obtain pure cultures of as many organisms as possible. The DNA of the isolates was amplified and sequenced in order to perform phylogenetic analysis with ARB software.
Rauch-Williams & Drewes (2006) studied the relationship between soil biomass and organic carbon removal during aquifer infiltration. Thereby a dehydrogenase assay as well as phospholipids analysis and a substrate utilisation assay to examine substrate induced respiration (SIR) were used. These techniques were chosen based on the assumption that bioavailable organic carbon in the effluents is a limiting factor for biomass growth. Therefore, the microorganisms will maintain in a steady state. First, they determined how the soil biomass relates to the organic carbon removal. Furthermore, it was investigated to what extent BOC concentrations in the effluents could serve as an indicator for the soil biomass. Besides, the contribution of sorption in the removal of organic carbon was examined. During this study a strong positive correlation between the total viable biomass and organic carbon attenuation was found.

43
1.3 Summary of the different approaches
This report focussed on different methods for biomass detection, quantification and approached for activity assessment. Thereby, the last chapters provided descriptions of these different methods divided in microscopic techniques, cultivation- and nucleic acid based methods, physiological methods and some techniques that did not fit in those classes.
Besides these descriptions, advantages and drawbacks of the specific techniques were described. This chapter provides a summary of usefulness of the techniques of the four method groups for the application in soil and sediment research.
First of all, it is important to notice that external factors will influence the presence of organisms in a given environment. This means that sufficient sampling methods are necessary in order to get a reliable overview of microbial life, and that it is very important to prevent contamination. In general, sampling is a sophisticated engineering field which requires a specific strategy depending on the field site that is been researched. Another important aspect of microbial investigations, is the detachment of organisms form biofilms. Enzymatic based methods have proved to be very useful.
In general, soils and sediments contain great numbers of microorganisms. Whereas in surface soils concentrations of culturable microorganisms can be found in the range of 108 per gram of dry soil, the number of culturable organisms in the subsurface are dependent on depth and are generally lower.
Cultivation
Traditional cultivation methods, such as plating, can be used to express the amount of biomass in as CFUs. Thereby it is assumed that each colony originates from one single microorganism, which can result in an underestimation of the total number of bacteria.
A more laborious cultivation technique is the MPN method, were the population is diluted and inoculated in specific liquid medium in order to estimate the number of organisms in the original sample. Despite the labour intensity, this method is useful when a specific physiological group of organisms is investigated.
In general, cultural techniques are useful when a specific genus or species within an environmental community is investigated, but since less than 1% of the microorganisms in natural environments can be cultured they will not be useful when one aims to get more inside in the microbial community.
Microscopic techniques
Direct counts will result in higher cell numbers due to the presence of VBNC and VBDC organisms in the environmental samples. By the use of various staining methods, e.g. DAPI and AODC, the microbial biomass can be calculated in terms of bacterial (or fungal) biomass as carbon or as bacterial numbers in soil. The estimated amount of organisms is strongly dependent on various assumptions, which is a drawback of this DC method. Furthermore, it is possible to distinguish between living and dead organisms or to stain respiration cells (LIFE/DEAD staining and CTC respectively).
Samples used for microscopic analysis can be obtained by direct extraction or by the use of the buried slide technique. Neither of these methods is perfect: the glass slide method has a bias toward selective colonization, whereas the direct extraction method will be strongly dependent on the type of extraction. Therefore, both methods are important since they provide different views of microbial life within the sand filters.

44
Epifluorescense microscopy is most commonly used for the investigation of microorganisms, but EM and AFM will be useful when one wants to get more inside in the structure of biofilms on grain or sand particles.
FISH provides the possibility to detect a great amount of bacterial species by the use of a probe RNA or DNA binding probes. An advantage of the this method is the possibility to detect uncultivable bacteria. Nevertheless, sensitivity can be a problem since if cells are not actively growing.
Nucleic acid based techniques
Nucleic acid based techniques make is possible to investigate non-culturable organisms. Whereas DNA based primers can be used to detect specific species, general primers can be used to get a broad overview of the microbial life within a sample. Furthermore, active organisms can be detected by the use of RNA based primers.
On the other hand, quantitative PCR will be very useful for the estimation of the amount of DNA in a sample, but it is not suitable for the determination of the function of microorganisms. Furthermore, this technique must be optimized for every system, which can be laborious. Nevertheless, it is a useful method to compare samples run under the same conditions.
A strong advantage of the use of T/DGGE for analyses of microorganisms in natural environments, is the possibility to monitor changes due to external perturbations. This technique provides information about the number of species and the influence of environmental changes on the microbial community. The species within a sample can only be identified when further analysis, such as the construction of clone libraries, is accomplished. In general, clone library analysis can be laborious and difficult to compare. Nevertheless, they are very useful when different species within an environmental sample are investigated.
Physiological techniques
The microbial activity can be estimated based on their physiological capacities. When specific physiological groups, e.g. denitrifiers, are investigated this is relatively simple. Microbial activity can indirectly be estimated based on AOC or BDOC measurements. Furthermore, respiration measurements can be very useful when combined with CTC Direct counts.
The use of ATP measurements was strongly discouraged by Prof. Dr. Ulrich Prof. Dr. Ulrich Szewzyk (Technische Universität Berlin, Umweltmikrobiologie) (Technische Universität Berlin, Umweltmikrobiologie) due to unreliable results caused by higher organisms, present in natural soil environments, who consume high amounts of ATP.
Many different enzyme assays are available for the detection of specific or general microbial activity in environmental samples. The general microbial activity assays can be interesting for the estimation of biological activity in e.g. artificial recharge ponds. One of assays measures the activity of the intracellular dehydrogenases enzymes. These enzymes are only active inside cells, which overcomes the overestimation of enzyme activity due to extracellular enzymes.
Stable isotope probing can be used to follow internal degradation processes. The rate of this incorporation of radio-labelled substances provide an indication of microbial growth and therefore of biological activity. This method will be very useful, but not all substrates of interest are available in a labelled form.
When the interest is on a more specific investigation of the occurring microbial processes, microarray’s and proteomic based techniques are useful.
45
Biomass quantification based on the amount of phospholipids is relatively simple. This method was developed parallel to DNA based techniques. Nevertheless, in current research it is over taken by nucleic acid based methods.
In conclusion, cultivation methods will not be sufficient for the analysis of the microbial community, but the development of molecular methods led to powerful techniques for the investigation of both culturable and uncultivable members of microbial communities. Although these techniques were developed at the same time as biomass quantification based on phospholipids, currently they are more commonly used.
The most important thing it is to realise that all described techniques have their own drawbacks and biases. Therefore, a combination of methods is necessary in order to get a better inside in the biodegradation processes occurring at specific artificial recharge sites.

46
1.4 Conclusion / Overview
While most of this report contained technical descriptions of possible methods for detection, quantification and activity assessments, this last chapter will focus on methods most suitable for laboratory scale soil column experiments conducted by the KWB. Based on literature and interviews with experts2 various methods are recommended for microbial analyses in those soil column studies. Besides, an overview of the previously described methods can be found in Table 3.
1. How many? Total number of organisms in the columns
a. Extraction of microorganisms
In order to estimate the amount of organisms per gram of (dry) soil, microorganisms need to be detached from the biofilm (see chapter 1.2.1.2). This can be done directly or by the use of the buried slide technique. The latter is recommended by Prof. Dr. Ulrich Szewzyk (Technische Universität Berlin, Umweltmikrobiologie), since it will give another picture of the inhabitants of the microbial community. Nevertheless, when one wants a quick overview of the amount of organisms in soil columns, it is recommended to use the direct technique.
b. Direct counts
Fluorescent microscopy with DAPI or Acridine Orange, is useful for the direct count technique. This will result in the count of the total (alive and dead) organisms per gram of dry soil.
c. Relative abundance of organisms
DGGE with universal primers (SUU rRNA genes) is recommended to get a quick overview of the abundance of microorganisms in different parts of the column, but note that this is not quantitative. Therefore, qPCR (with the same primers) can be used to compare the total amount of DNA.
DGGE will also be extremely useful when one investigates the influence of external factors (e.g. columns run under different temperatures) on the number of different species within the microbial community.
2. How active are they? Activity assessments
Most physiological methods are useful for analysis of organisms with a specific physiological function. Those organisms can be cultured under specific conditions. Nevertheless, this would not be useful for column studies where the amount of organisms in a certain depth in the column will be coupled to the attenuation of organic compounds on the same position.
Furthermore, it would be too detailed to couple specific species to the degradation of specific substrates. Therefore, it is recommended to describe activity of the microbial community inhabitants in the number of living and dead organisms by LIFE/DEAD
2 Oliver Thronicker & Prof. Dr. Ulrich Szewzyk (Technische Universität Berlin, Umweltmikrobiologie) and H. Dizer, Umweltbundesamt Berlin

47
staining (see chapter 0). In combination with substrate degradation assessments by BDOC (or AOC) measurements and direct counts of organisms stained with the CTC redox dye this will be enough to compare activity on certain column depths.
3. Who is living there?
When the other questions (how many organisms are there and are they active?) are answered, it might be of interest to see which organisms are present. In order to keep the whole microbial analyses as simple as possible, it is recommended to use bands from the DGGE gels for sequence analysis. The best results will be obtained when clone libraries are constructed from those bands.
In summary, the following methods are recommended:
o Substrate degradation assessments by BDOC (or AOC) measurements (normally done in column studies)
o Direct counts (DAPI/ Acridine Orange) of direct extracted organisms and organisms present on buried slides.
o DGGE with universal primers
o qPCR
o Direct counts with LIFE/DEAD staining and CTC redox dye
o Clone libraries constructed from DGGE bands

48
Table 3 Overview of methods for detection, quantification and activity assessments of microbial communities in soils and sediments. Recommended methods for soil column studies are highlighted in green.
How many..? How
active
are
they?
Who
is
living
there?
Technique Description Cells
/
area
Active
cells
different
species
specific
species
Visible light microscopy Phase contrast micr. is useful for the
investigation of intercellular detail.
Bright contrast is a bit outdated.
Difficult due to interference with soil
particles
X
Electron microscopy Useful for investigation of biological
structures.
No general picture of the microbial
population.
Atomic force microscopy Useful for general biofilm structure
Plating methods
I. Colony forming units Only cultivable organisms X
II. Most probable number Only cultivable organisms X
III. Heterotrophic plate
count
Detection of heterotrophic aerobe
or facultative anaerobic organisms
in water. Useful for analysis of
column in- and effluents
aDirect counts
A. Fluorescent microscopy Molecules are tagged with fluorescent dyes (I – IV) and examined under a fluorescent
microscope
Impossible to delineate cellular structures than those that are stained.
Presence of autofluorescent particles can be problematic
B. Flow cytometry Stained cells (I-IV) are passing through a laser detector. Measurement of emission by single
particles.
Not always possible to distinguish between single cells and groups of attached cells.
I. DAPI RNA and dsDNA binding dye; emits a
bright blue light when exited;
staining of life and fixed cells
X
II. Acridine orange RNA and dsDNA binding dye; will
result in orange or green stained
bacteria
X
III. CTC Redox dye; colour depends on
oxidative state; useful for activity
estimations
X X X
IV. LIFE / DEAD Two different dyes: one binds to
intact and damaged cell
membranes, the other only to the
latter.
X X X
Nucleic acid based
techniques
FISH with universal probe Sensitive method for the detection
of nucleic acid sequences. Specific
probes are used for hybridization.
Probes complementary to the highly
X X

49
How many..? How
active
are
they?
Who
is
living
there?
Technique Description Cells
/
area
Active
cells
different
species
specific
species
conserved SSU gene sequences are
commonly used.
FISH with specific probe See above X X
Antibody probing Detection of specific organisms by
antibody-antigen interactions.
Insufficient for a complete analysis
of the microbial community.
X
Clone Libraries +
Sequence analysis
Separation of specific DNA
sequences by the use of e.g.
competent E. coli cells. This
technique can be laborious but
will be useful for the
investigation different species in
environmental samples.
X X X X
T/DGGE DNA is separated based on size and
nucleotide sequence. This will result
in a banding pattern which gives an
overview of the number of different
organisms.
X X
RFLP Species specific DNA sequences are
estimated by the use of restriction
enzymes. Based on this, different
species can be identified.
X
qPCR The amount of DNA in a sample can
be estimated based on the a
fluorescent signal produced during a
PCR reaction. Note that the amount
of DNA can only be estimated
relative to other samples.
RT-PCR Since mRNA is unstable and only
present in active organisms, analysis
of the amount of this compound will
provide information about active
organisms.
X X
Physiological methods
I. AOC / BDOC removal Measurement of substrate
utilization.
X
II. Carbon respiration Measurement of CO2 production or
TEA consumption; provides an
indication of the overall metabolic
activity.
Reflection of microbial metabolism
of organic substrates present in the
environment
X
III. ATP measurements Quantification of energy
consumption by a substrate-enzyme
complex,
Possible to distinguish between an
X

50
How many..? How
active
are
they?
Who
is
living
there?
Technique Description Cells
/
area
Active
cells
different
species
specific
species
active microbial community and a
community with a lot of dead cells.
Not reliable for soil columns!
IV. Dehydrogenase assays Estimation of the rate of oxidation-
reduction reactions.
Strongly depend on incubation
conditions.
X
V. Stable isotope probing Measurement of the distribution of
isotopically labeled substrates (e.g. 13
C); identification of populations
that are actively metabolizing this
substrate.
Phylogeny can be linked with
function. Labelled substrates are
expensive and not always available.
X
VI. MAR (incorporation of
radiolabelled tracers)
Scavenge of labeled DNA
precursors; measure the rate of
incorporation into DNA.
X
Various
Functional genomics /
Proteomics
e.g. Analysis of protein expression
under prescribed conditions ;
information about microbial
responses to environmental
conditions.
Expensive, difficult and time
consuming. Nevertheless, it
provides the best available
information for describing a
microbial response to an external
signal.
X X
PAC-FISH Organisms with a sufficient
ribosome content to yield a clear
FISH signal are detected. This will
result in direct viable counts
(DVC).
X
Phospholipid analysis The amount of phospholipids can
be used to estimate the amount
of biomass in a sample. Method
was developed parallel to DNA
based techniques, but the latter
is currently more common.
a. For the direct count methods different stains (I-IV) are available. Furthermore, the fluorescent stained particle’s can be detected by either
A or B.

51
Bibliography
Alberts, B., A. Johnson, et al. (2002). Molecular Biology of the Cell. New York, Garland Science: 1616.
Altschul, S. F., W. Gish, et al. (1990). "Basic Local Alignment Search Tool." Journal of Molecular Biology 215(3): 403-410.
ASTM E 1391-03 (2008). Standard Guide for Collection, Storage, Characterization and Manipulation of Sediments for Toxicological Testing for Selection of Samplers used to collect Benthic Invertebrates. E1391-03.
Astrobiology Magazine. (2010). "Origin & Evolution of Life." Retrieved 10/11, 2010, from http://astrobio.net/pressrelease/3508/natures-batteries#.
Bach, H. J., Tomanova J., et al. (2002). "Enumeration of total bacteria and bacteria with genes for proteolytic activity in pure cultures and in environmental samples by quantitative PCR mediated amplification." Journal of Microbiological Methods 49(3): 235-245.
Banfield, J., B. Baker, et al. (2007). "Adaptation to salinity in microbial communities." Annual report 2007 Retrieved 13/10/2010, 2010, from http://astrobiology.nasa.gov/nai/library-of-resources/annual-reports/2007/cal/projects/adaptation-to-salinity-in-microbial-communities/.
Battin, T. J., W. T. Slaon, et al. (2007). "Microbial landscapes: new paths to biofilm research." Nature Reviews Microbiology 5: 76-81.
BioVisible Microbial Diagnostics. (2008). "Gut microflora analysis services of BioVisible - Fish workflow." Retrieved 10/11/2010, 2010, from http://biovisible.com/indexRD.php?page=fish.
Böckelmann, U., U. Prof. Dr. Ulrich Szewzyk (Technische Universität Berlin, Umweltmikrobiologie) , et al. (2003). "A new enzymatic method for the detachment of particle associated soil bacteria." Journal of Microbiological Methods 55(1): 201-211.
Contin, M., D. S. Jenkinson, et al. (2002). "Measurement of ATP in soil: correcting for incomplete recovery." Soil Biology and Biochemistry 34: 1381-1383.
Dalke, K. (2002). Fighting bacteria with inside information. Genome News Network. Donlan, R. M. (2002). "Biofilms: Microbial life on surfaces." Emerging Infectious Diseases
8(9): 881-890. Encyclopaedia Britannica Online. (2010). "Cell membrane." Retrieved 30/11, 2010, from
http://www.britannica.com/EBchecked/topic-art/463558/45550/A-molecular-view-of-the-cell-membrane-Intrinsic-proteins-penetrate.
Fierer, N., M. A. Bradford, et al. (2007). "Toward an ecological classification of soil bacteria." Ecology 6: 1354-1364.
Findlay, R. H., G. M. King, et al. (1989). "Efficacy of Phospholipid Analysis in Determining Microbial Biomass in Sediments." Applied Environmental Microbiology 55(11): 2888-2893.
Gene-quantification. (2002). "The Reference in qPCR - Academic & Industrial Information Platform." Retrieved 6/10/2010, 2010, from www.Gene-Quantification.info.
Ginzinger, D. G. (2002). "Gene quantification using real-time quantitative PCR: An emerging technology hits the mainstream." Experimental Hematology 30: 503-512.
Green Tringe, S. and E. M. Rubin (2005). "Metagenomics: DNA sequencing of environmental samples." Nature reviews genetics 6: 805-814.
Hammes, F. and T. Egli (2005). "New method for assimilable Organic Carbon determination using flow-cytometric enumeration and a natural microbial consortium as inoculum." Environmental Science and Technology 39(9): 3289–3294.

52
Hammes, F. (2008). A comparison of AOC methods used by the different TECHNEAU partners: 17.
ISO 10381-2 (2002). Soil quality - sampling - part 2: Guidance on sampling techniques. ISO 10381-2. I. O. f. Standardization.
Jacobsen, C. S., J. R. de Lipthay, et al. (2004). Direct analysis of microbial populations in soil and freshwater aquifers using nucleic acid based techniques. Review of Survey activities 2003. GEUS. Copenhagen, Geological Survey of Denmark and Greenland Bulletin. 4: 33-36.
Jenkinson, D. S. and J. M. Oades (1979). "A method measuring adenosine triphosphate in soil." Soil Biology and Biochemistry 11: 193-199.
Kallmeyer, J., D. C. Smith, et al. (2008). "New cell extraction procedure applied to deep subsurface sediments." Limnology and Oceanography: Methods 6: 236-245.
Kalmbach, S., W. Manz, et al. (1997). "Dynamics of biofilm formation in drinking water: phylogenetic affiliation and metabolic potential of single cells assessed by formazan and in situ hybridization." FEMS Microbiology Ecology 22: 265-279.
Kogure, K., U. Simidu, et al. (1979). "A tentative direct microscopic method for counting living marine bacteria." Canadian Journal of Microbiology 25(3): 415-420.
Langmark, J., N. J. Ashbolt, et al. (2001). "Adequacy of in situ glass slides and direct sand extraction to assess the microbiota within sand columns used for drinking water treatment." Canadian Journal of Microbiology 47(7): 601-607.
Langmark, J., M. V. Storey, et al. (2004). "Artificial groundwater treatment: biofilm activity and organic carbon removal performance." Water Research 38(2004): 740–748.
Lutz-Arend and Meyer-Reil (1994). "Microbial life in sedimentary biofilms - the challenge to microbial ecologists." Marine Ecology Progress Series 112: 303-311.
Madigan, M. and J. Martinko (2005). Brock Biology of Microorganisms, Prentice Hall. Maier, R. M., I. L. Pepper, et al. (2009). Environmental Microbiology, Elsevier Inc. Martens, R. (2001). "Estimation of ATP in soil: extraction methods and calculation of
extraction efficiency." Soil Biology and Biochemistry 33: 973-982. Meijerink, J., C. Mandigers, et al. (2001). "A Novel Method to Compensate for Different
Amplification Efficiencies between Patient DNA Samples in Quantitative Real-Time PCR." Journal of Molecular Diagnostics 3(2): 55-61.
Microbial Insights Inc. (MI). (2009). "The Source for Molecular Biological Tools." Retrieved 2/11, 2010, from http://www.microbe.com/about-mi.html.
Muyzer, G. (1999). "DGGE/TGGE a method for identifying genes from natural ecosystems." Current Opinion in Microbiology 2: 317-322.
Nielsen, J. L., M. Wagner, et al. (2003). "Use of microautoradiography to study in situ physiology of bacteria in biofilms." Reviews in Environmental Science and Bio/Techbology 2: 261-268.
NIWA (2006) "Tapping into the power of marine bacteria." Water & Atmosphere 2. Rauch-Williams, T., Drewes, J.E. (2006). "Using soil biomass as an indicator for the
biological removal of effluent-derived organic carbon during soil infiltration." Water Research 40: 7.
Robe, P., R. Nalin, et al. (2003). "Extraction of DNA from soil." European Journal of Soil Biology 39(4): 183-190.
Sigee, D. C. (2005). Freshwater Microbiology, John Wiley & Sons, Ltd.: 524. Smith, C. J. and A. M. Osborn (2009). "Advantages and limitations of quantitative
PCR(Q-PCR)-based approaches in microbial ecology." FEMS Microbiololgy Ecology 67: 6-20.
Stars and Seas.com. (2010). "Nutrient Cycles." Retrieved 10/11/2010, 2010. Szewzyk, U., Kalmbach, S., Manz, W., Langmark, J. Sentröm, T.-A. (1998). Artificial
Groundwater as the future water supply of greater Stockholm, IV Phylogenetic diversity of the unsaturated zones of experimental sand filter columns. Artificial Recharge of Groundwater. J. H. Peters. Amsterdam, A.A. Balkema, Rotterdam, Brookfield: 3.
Tevfik Dorak, M. (2006). Real-Time PCR, Taylor & Francis Group.

53
The Advanced Light Source. (2010). "Structure of the complete 70S Ribosome at 3.7 A Resolution." Retrieved 08/10/2010, 2010, from http://www-als.lbl.gov/index.php/research-areas/213-structure-of-the-complete-70s-ribosome-at-37-a-resolution.html.
Uhlík, O., K. Jecná, et al. (2009). "DNA-based stable isotope probing: a link between community structure and function." Science of the Total Environment 407: 3611-3619.
van Houtte, T., G. Huys, et al. (2005) "Exploring microbial ecosystems with Denaturing Gradient Gel Electrophoresis (DGGE)." Belgian Co-ordinated collections of micro-organisms (BCCM) - Newsletter Volume, DOI:
VanGuilder, H. D., K. E. Vrana, et al. (2008). "Twenty-five years of quantitative PCR for gene expression analysis." BioTechniques 44(25th Anniversary Issue): 619-626.
Wagner, M., P. H. Nielsen, et al. (2006). "Linking microbial community structure with function: fluorescence in situ hybridization-microautoradiography and isotope arrays." Current Opinion in Microbiology 17: 83-91.
Williamson, K. E., J. Kan, et al. (2010). "Optimizing the indirect extraction of prokaryotic DNA from soils." Soil Biology and Biochemistry: 1-13.