OXIDATION OF ADVANCED STEAM TURBINE ALLOYS
15
OXIDATION OF ADVANCED STEAM TURBINE ALLOYS Gordon R. Holcomb, Bernard S. Covino, Jr., Sophie J. Bullard, Malgorzata Ziomek-Moroz and David E. Alman Albany Research Center, U. S. Department of Energy 1450 Queen Ave SW, Albany, OR 97321 [email protected] ABSTRACT Advanced or ultra supercritical (USC) steam power plants offer the promise of higher efficiencies and lower emissions. Current goals of the U.S. Department of Energy’s Advanced Power Systems Initiatives include coal generation at 60% efficiency, which would require steam temperatures of up to 760°C. This research examines the steamside oxidation of advanced alloys for use in USC systems, with emphasis placed on alloys for high- and intermediate-pressure turbine sections. INTRODUCTION For many years the temperatures and pressures of steam boilers and turbines were intentionally increased. These increases allowed for greater efficiencies in steam and power production, and were enabled by improvements in materials properties such as high temperature strength, creep resistance, and oxidation resistance. From 1910 to 1960, there was an average increase in steam temperature of 10°C per year, with a corresponding increase in plant thermal efficiency from less than 10% to 40%. 1 The first commercial boiler with a steam pressure above the critical value of 22.1 MPa (3208 psi) was the 125 MW Babcock & Wilcox (B&W) Universal Pressure steam generator in 1957—located at the Ohio Power Company’s Philo 6 plant. 2 Since 1960 in the United States, the overall trend of increasing temperatures and pressures has stopped and stabilized at about 538°C and 24.1 MPa. 3 In Europe and Japan, where fuel costs are a higher fraction of the cost of electricity, temperatures and pressures continued to rise. An example of a state of the art power plant in Europe is the Westfalen (2004) plant, with steam conditions of 31.0 MPa/593°C/621°C. 4 It has a net plant efficiency of 43.5%, compared to 37% for a typical subcritical 16.5 MPa/538°C/ 538°C plant. 4 Today there is again interest in the United States for advanced supercritical power plants. Large increases in the cost of natural gas have led to the re-examination of coal
Transcript of OXIDATION OF ADVANCED STEAM TURBINE ALLOYS
OXIDATION OF ADVANCED STEAM TURBINE ALLOYS
Gordon R. Holcomb, Bernard S. Covino, Jr., Sophie J. Bullard,
Malgorzata Ziomek-Moroz and David E. Alman Albany Research Center, U. S. Department of Energy
1450 Queen Ave SW, Albany, OR 97321 [email protected]
ABSTRACT
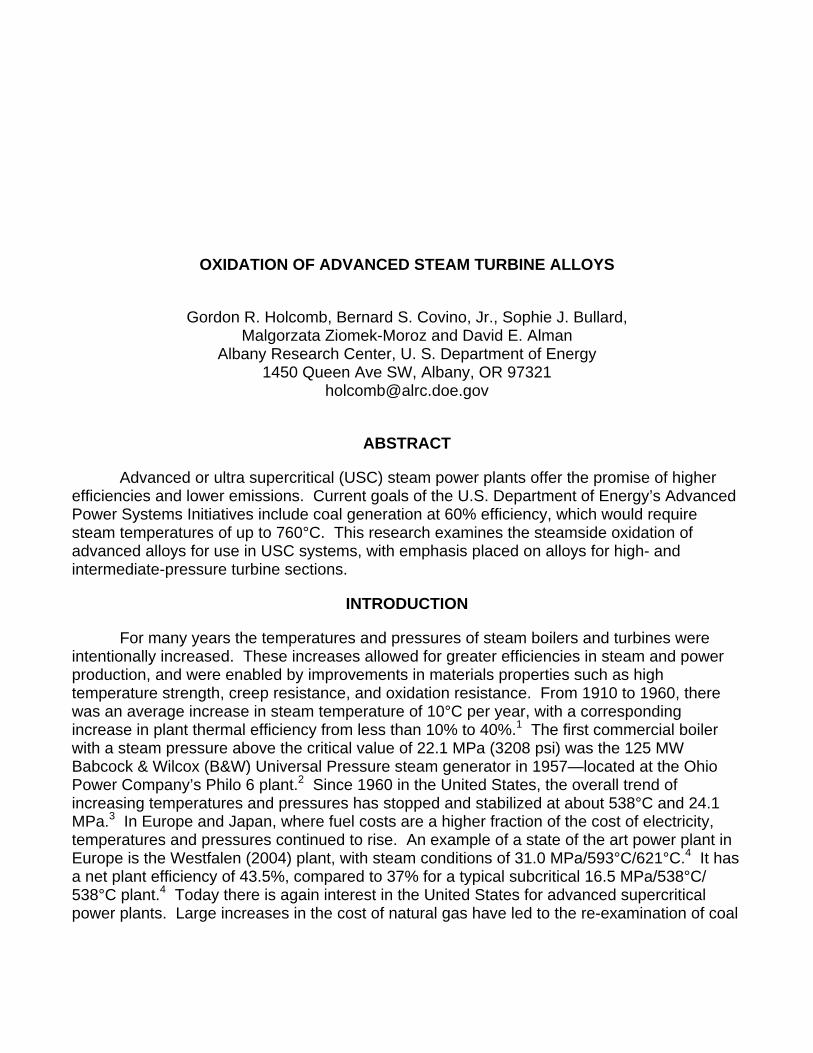
Advanced or ultra supercritical (USC) steam power plants offer the promise of higher efficiencies and lower emissions. Current goals of the U.S. Department of Energy’s Advanced Power Systems Initiatives include coal generation at 60% efficiency, which would require steam temperatures of up to 760°C. This research examines the steamside oxidation of advanced alloys for use in USC systems, with emphasis placed on alloys for high- and intermediate-pressure turbine sections.
INTRODUCTION
For many years the temperatures and pressures of steam boilers and turbines were intentionally increased. These increases allowed for greater efficiencies in steam and power production, and were enabled by improvements in materials properties such as high temperature strength, creep resistance, and oxidation resistance. From 1910 to 1960, there was an average increase in steam temperature of 10°C per year, with a corresponding increase in plant thermal efficiency from less than 10% to 40%.1 The first commercial boiler with a steam pressure above the critical value of 22.1 MPa (3208 psi) was the 125 MW Babcock & Wilcox (B&W) Universal Pressure steam generator in 1957—located at the Ohio Power Company’s Philo 6 plant.2 Since 1960 in the United States, the overall trend of increasing temperatures and pressures has stopped and stabilized at about 538°C and 24.1 MPa.3 In Europe and Japan, where fuel costs are a higher fraction of the cost of electricity, temperatures and pressures continued to rise. An example of a state of the art power plant in Europe is the Westfalen (2004) plant, with steam conditions of 31.0 MPa/593°C/621°C.4 It has a net plant efficiency of 43.5%, compared to 37% for a typical subcritical 16.5 MPa/538°C/ 538°C plant.4 Today there is again interest in the United States for advanced supercritical power plants. Large increases in the cost of natural gas have led to the re-examination of coal
cwright
Text Box
DOE/NETL-IR-2006-061

power plants, and advanced supercritical plants offer advantages in lower fuel costs and lower emissions of SOX, NOX, and CO2.5 Table 1 shows four new advanced supercritical power stations at three sites that are either being proposed or constructed in the United States.6 The steam conditions of the Council Bluffs plant is to be 25.4 MPa/566°C/593°C using a Babcock-Hitachi supercritical sliding pressure Benson boiler.7
Table 1 New Advanced Supercritical Power Plant Starts in the United States.6
Location Size Status In Service Cost Fuel Council Bluffs Iowa
790 MW Construction started 8/2004
2007 1.2 B$ Coal
Trimble County Kentucky
750 MW Proposed 11/2004
2010 1.2 B$ Illinois Basin Coal
Oak Creek Wisconsin
600 MW (two)
In Development 12/2004
2009-2010 2.5 B$ Powder River Basin Sub-Bituminous
Current U.S. Department of Energy research programs are aimed at 60% efficiency
from coal generation, which would require increasing the operating conditions to as high as 760°C and 37.9 MPa. In general terms, plants operating above 24 MPa/593°C are regarded as ultra supercritical (USC), those operating below 24 MPa as subcritical, and those at or above 24 MPa as supercritical (SC).3
In the past thirty years, advances in the high temperature strength of ferritic steels have allowed for the increase of operating temperatures and pressures, but without the thermal fatigue issues of the austenitic steels that had to be used to obtain the required high temperature strengths in the early 1960s. Ferritic steels, as used here, refers to the equilibrium structure. In practice, a martensitic or partially martensitic structure is obtained from heat-treating. The upper temperature for use of ferritic steels appears to be limited to about 620 to 630°C. For temperatures above 630°C, the most promising candidate alloys are nickel-base superalloys.
The purpose here is to report on research that examines the steamside oxidation of advanced alloys for use in supercritical turbine systems. Low-pressure turbine sections of USC systems would not be expected to differ from current designs, so emphasis is placed on alloys for high- and intermediate-pressure turbine sections. Initial results are presented. Benefits
The driving force for increased operating temperatures and pressures has been increased efficiency in power generation. An additional recognized benefit is decreased CO2 emissions. Estimates of the cost effectiveness of various ways to improve the efficiency of power plants are shown in Table 2. Table 2 shows that increasing the steam temperature is one of the more cost effective ways of increasing efficiency, while increasing the steam pressure is less effective.
For reduced CO2 emissions, calculations by Booras et al.8 indicate that a subcritical 37% efficient plant 500 MW plant burning Pittsburgh #8 coal would produce about 850 tons of CO2 per kWh. Ultra supercritical plants at 43% and 48% efficiency would respectively produce about 750 and 650 tons of CO2 per kWh.

Table 2
Cost effectiveness of methods to improve fossil fuel power plant efficiency.3 Cost is in terms of millions of U.S. Dollars per net percent increase in lower heating value (LHV) efficiency.
Rank Method Cost 1 Reducing condenser back pressure 3.1 2 Increase to 8th extraction point feed water heater,
raising feed water temperature 3.8
3 Raising live steam and reheat temperatures 8.3 4 Raising live steam temperature 8.6 5 Using separate boiler feed pump turbine (BFPT)
instead of main turbine driven pump 9.6
6 Raising live steam pressure 25.1 7 Change from single to double reheat 38.2 8 Using separate BFPT condenser 41
OBJECTIVES
The objectives of this project are to: • Assist in the development of high strength steels or nickel-base superalloys for
use in USC steam turbines by conducting steam-side corrosion tests on candidate materials.
• Determine the effect of pressure on the corrosion process. • Examine curvature effects on spallation.
The research aims to bridge the gap in information between the various steam conditions to study the resistance of target alloys and the role of pressure in the corrosion mechanisms. The experimental work consisted of four types of tests:
• Supercritical Steam: Long-term tests at the supercritical steam temperatures and pressures. Test durations of 3000 hours with three 1000 hr segments. Conditions as high as 760°C (1400°F) and 37.9 MPa (5500 psi).
• TGA in Steam: Experiments using thermal gravimetric analysis (TGA) with steam and argon at atmospheric pressure. This will test alloys for susceptibility to steam oxidation using relatively short test durations (~300 hr) and obtain kinetics parameters.
• Cyclic Oxidation: Experiments using cyclic oxidation tests in air in the presence of water vapor. This will test the adhesion and spallation behavior of the protective oxides that form on the test alloys. The effect of sample curvature will be examined in selected systems.
• Furnace Exposure: Experiments that expose alloys in moist air (3% H2O) for long exposure times at temperatures from 650 to 800 °C. These are economical tests that bridge the gap between exposure in air and exposure in steam.

TECHNICAL PROGRESS
Alloys
The nominal compositions of alloys selected for testing are given in Table 3. These include a subset of the alloys examined by the Advanced Power System Initiative on USC boilers,9 which are the ferritic alloy SAVE12(1), the high Cr and high Ni alloy HR6W(1), and three nickel-base superalloys Inconel 617(1), Haynes 230(1), and Inconel 740(1). These are henceforth referred to as 12, 6W, 617, 230, and 740, respectively. All represent the highest high-temperature strength alloys in their respective alloy classes. Also included are two superalloys identified10-11 as candidates for blade materials for USC conditions: Nimonic 90(1) and Inconel 718(1), which are henceforth referred to as 90 and 718, respectively. The last two alloys listed in Table 3, J1 and J5, were produced for alloy development into solid oxide fuel cells.12 However, J1 is an equivalent composition to Mitsubishi alloy LTES700(1), a low coefficient of thermal expansion nickel-base alloy developed for use as fasteners and blades in both current and USC steam turbines.13 Alloy J5 is a modified version of J1.
Table 3 Nominal compositions of alloys of interest for USC turbine applications. Reference numbers follow the alloy
name. Alloy Fe Cr Ni Co Mo Nb C Si Mn Ti Al Other 1214 Bal 11 3 0.07 0.1 0.3 0.2 3 W
0.2 V 0.04 Nd0.04 N
6W14 23 43 0.18 0.08 0.4 1.2 0.08 6 W 0.003 B
61715 ASME Code
1956
22 55 12.5 9 0.07 1
23015 ASME Code
2063 UNS N06230
<3 22 55 <5 2 0.1 0.35 14 W <0.015B0.02 La
7409 1 24 49 20 0.5 1.8 0.5 1.6 0.75 9015
UNS N07090 1.5 19.5 55.5 18 0.06 2.4 1.4
71815 UNS N07718
18.5 19.0 52.5 3 5.1 0.08 max
0.9 0.5 0.15 Cu max
J112 12.1 Bal 18 1 0.8 J513 12.5 Bal 22 0.5 1 0.04 Y
There are two versions of the 12 alloy (nominally 11Cr) that were examined: a version
that is corrosion resistant to higher temperatures (10.5Cr), and a higher strength version (9.5Cr). The surface on all samples (except where noted) was a polish to 600 grit. Curvature effects were examined on 12 (10.5Cr) and 6W by machining samples from thick walled pipe. Each of the curvature samples have one curved surface, representing either the inside
1 Trademark

(concave) or outside (convex) surface of the pipe, Fig. 1. The curved surfaces were machined from as-received pipe (to remove mill-scale) and not subsequently polished to 600 grit.
Supercritical Steam
A test loop in supercritical steam with temperatures and pressures up to 760°C (1400°F) and 37.9 MPa (5500 psi) was planned as shown in Fig. 2. The feed water system, shown in Fig. 3, allows for measurement and some control of water chemistry (pH, dissolved oxygen (DO), and conductivity). Tests would be done to represent an oxygenated system with 150-200 ppb DO and a pH of 9.2 to 9.6.
Procurement problems have caused delays and there are no results at this time.
Figure 2 – Supercritical test loop for exposures in supercritical steam with temperatures and pressures up to 760°C (1400°F) and 37.9 MPa (5500 psi). Autoclave size of 1 liter.
Figure 1 – Section of 12 (10.5Cr) pipe (2-in O.D.) and curvature samples cut from pipe. All but one side of the curvature samples are flat. Samples:
concave (left) and convex (right).
Distilled Water
Syringe Pump
Bleed Valve
Control Valve
Autoclave
Relief Valve
Check Valve
Radiant Cooler
CoolingWater
Hea
ter
20 C
550 C
Controlinlet pressure
Controloutlet flow
760C (1400F)37.9 MPa (5500 psi)
Feed water DO and Conductivity measurement
Distilled Water
Syringe Pump
Bleed Valve
Control Valve
Autoclave
Relief Valve
Check Valve
Radiant Cooler
CoolingWater
Hea
ter
20 C
550 C
Controlinlet pressure
Controloutlet flow
760C (1400F)37.9 MPa (5500 psi)
Distilled Water
Syringe Pump
Bleed Valve
Control Valve
Autoclave
Relief Valve
Check Valve
Radiant Cooler
CoolingWater
Hea
ter
20 C
550 C
Controlinlet pressure
Controloutlet flow
760C (1400F)37.9 MPa (5500 psi)
Feed water DO and Conductivity measurement
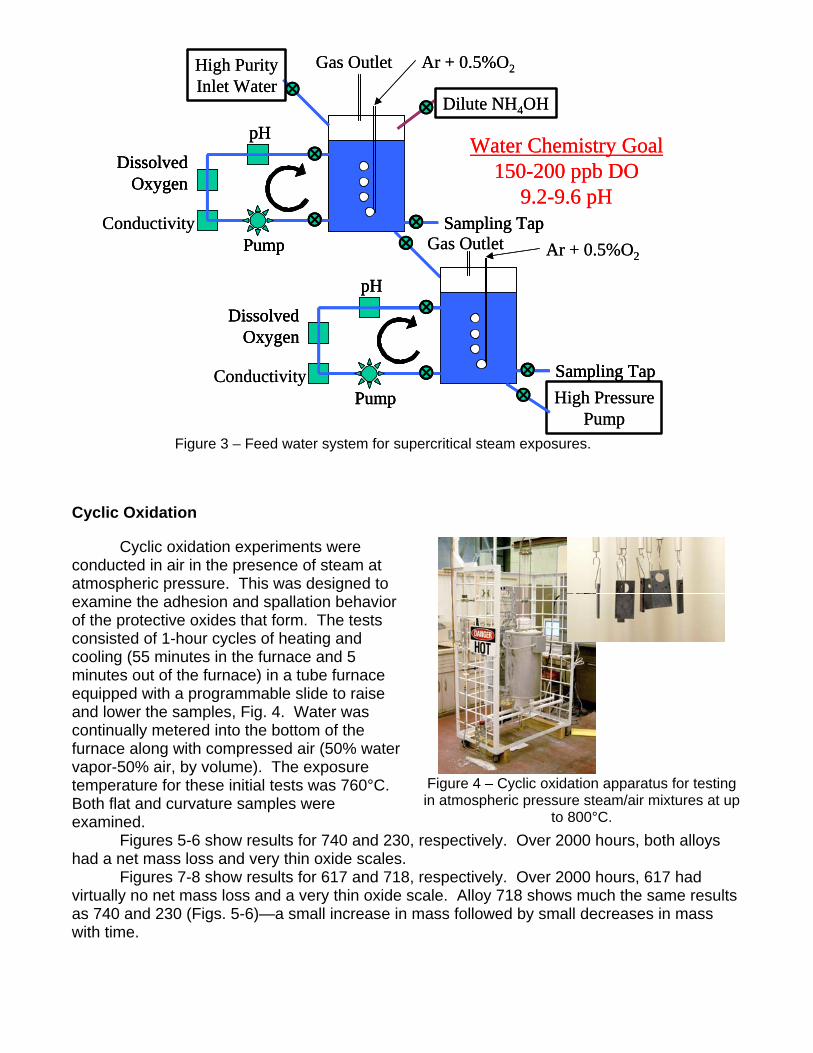
Figure 3 – Feed water system for supercritical steam exposures.
Cyclic Oxidation
Cyclic oxidation experiments were conducted in air in the presence of steam at atmospheric pressure. This was designed to examine the adhesion and spallation behavior of the protective oxides that form. The tests consisted of 1-hour cycles of heating and cooling (55 minutes in the furnace and 5 minutes out of the furnace) in a tube furnace equipped with a programmable slide to raise and lower the samples, Fig. 4. Water was continually metered into the bottom of the furnace along with compressed air (50% water vapor-50% air, by volume). The exposure temperature for these initial tests was 760°C. Both flat and curvature samples were examined.
Figures 5-6 show results for 740 and 230, respectively. Over 2000 hours, both alloys had a net mass loss and very thin oxide scales.
Figures 7-8 show results for 617 and 718, respectively. Over 2000 hours, 617 had virtually no net mass loss and a very thin oxide scale. Alloy 718 shows much the same results as 740 and 230 (Figs. 5-6)—a small increase in mass followed by small decreases in mass with time.
Figure 4 – Cyclic oxidation apparatus for testing in atmospheric pressure steam/air mixtures at up
to 800°C.
High PressurePump
Conductivity
Conductivity
High PurityInlet Water
Ar + 0.5%O2
Ar + 0.5%O2Gas Outlet
Gas Outlet
Dilute NH4OH
Water Chemistry Goal150-200 ppb DO
9.2-9.6 pH
pH
Pump
DissolvedOxygen
pH
Pump
DissolvedOxygen
Sampling Tap
Sampling TapHigh Pressure
Pump
Conductivity
Conductivity
High PurityInlet Water
Ar + 0.5%O2
Ar + 0.5%O2Gas Outlet
Gas Outlet
Dilute NH4OH
Water Chemistry Goal150-200 ppb DO
9.2-9.6 pH
pH
Pump
DissolvedOxygen
pH
Pump
DissolvedOxygen
pH
Pump
DissolvedOxygen
pH
Pump
DissolvedOxygen
Sampling TapSampling Tap
Sampling TapSampling Tap

A A
B B
C C
Figure 5 – A) Cyclic oxidation results for 740 at 760°C in 50% H2O-50% air with hourly cycles.
B) Light microscopy after 2000 hr. C) Light microscopy cross-section after 2000 hr
(etched).
Figure 6 – A) Cyclic oxidation results for 230 at 760°C in 50% H2O-50% air with hourly cycles.
B) Light microscopy after 2000 hr. C) Light microscopy cross-section after 2000 hr
(etched).
-0.3
-0.1
0.1
0.3
0.5
0 500 1000 1500 2000
Number of Cycles (Hours)
74050% H2O-50% Air760C
-0.3
-0.1
0.1
0.3
0.5
0 500 1000 1500 2000
Number of Cycles (Hours)
23050% H2O-50% Air760C

A A
B B
C
Figure 7 – A) Cyclic oxidation results for 617 at 760°C in 50% H2O-50% air with hourly cycles.
B) Light microscopy after 2000 hr. C) Light microscopy cross-section after 2000 hr
(etched).
Figure 8 – A) Cyclic oxidation results for 718 at 760°C in 50% H2O-50% air with hourly cycles.
B) Light microscopy after 2000 hr.
Figures 9-10 show results for 90 and 6W, respectively. Over 2000 hours, 90 has shown
more mass gain than other materials (Figs. 5-8). Over 2000 hours, 6W has shown a net mass increase. The curvature sample curves in Fig. 10 are closely following the flat sample trends.
-0.3
-0.1
0.1
0.3
0.5
0 500 1000 1500 2000
Number of Cycles (Hours)
617
50% H2O-50% Air760C
-0.3
-0.1
0.1
0.3
0.5
0 500 1000 1500 2000
Number of Cycles (Hours)
50% H2O-50% Air760C
718

A A
B B
Figure 9 – A) Cyclic oxidation results for 90 at 760°C in 50% H2O-50% air with hourly cycles.
B) Light microscopy after 2000 hr.
Figure 10 – A) Cyclic oxidation results for 6W at 760°C in 50% H2O-50% air with hourly cycles. B) Light microscopy after 2000 hr.
Figures 11-12 are for 12. Figure 11A compares the 9.5 Cr and 10.5 Cr versions of 12.
The test temperature of 760°C is far above the use temperature of 12, as indicated by the large oxidation rates (as well as being at a temperature where 12 lacks sufficient creep strength). Under these unprotective conditions, the 9.5 Cr version shows slightly less mass gain than the 10.5 Cr version. The lack of reproducibility in the initial oxidation behavior is also shown in Fig. 11. Figure 11C shows that the scale is much thicker than in the nickel base alloys (that also have higher Cr levels).
Figure 12 shows the results for curvature samples. The higher mass gain of the 2000 cycle convex sample is probably due to the lack of reproducibility in initial oxidation. The slopes are similar after 600 cycles. Figures 12B and 12C show spallation of the curvature samples in a greater degree than for the flat sample in Fig. 11B.
-0.3
-0.1
0.1
0.3
0.5
0 500 1000 1500 2000
Number of Cycles (Hours)
50% H2O-50% Air760C
90
-0.30
-0.10
0.10
0.30
0.50
0 500 1000 1500 2000
Number of Cycles (Hours)
50% H2O-50% Air760C
6W6W Concave6W Convex
X
+

A A
B B
C C
Figure 11 – A) Cyclic oxidation results for 12 at 760°C in 50% H2O-50% air with hourly cycles. B) Light microscopy for 10.5 Cr after 2000 hr. C) Light microscopy cross-section for 10.5 Cr
after 2000 hr (etched).
Figure 12 – A) Cyclic oxidation results for concave and convex 12 (10.5 Cr) at 760°C in 50% H2O-50% air with hourly cycles. B) Light microscopy for concave 10.5 Cr after 2000 hr. B) Light microscopy for convex 10.5 Cr after
2000 hr.
-200
20406080
100
0 500 1000 1500 2000
Number of Cycles (Hours)
12
10.5 Cr9.5 Cr
50% H2O-50% Air760C
X
-200
204060
80100
0 500 1000 1500 2000
Number of Cycles (Hours)
1250% H2O-50% Air760C
10.5 Cr Convex10.5 Cr Concave
+

Thermogravimetric Analysis (TGA)
Experiments were conducted using thermogravimetric analysis (TGA) with steam at atmospheric pressure. This was designed to obtain information on oxidation kinetics using relatively short (300 hr) test durations. The TGA tests consist of suspending a sample from a Cahn D-101 microbalance in flowing steam for 300 hours at a constant elevated temperature (650-800°C), Fig. 13. Steam is generated by injecting a metered amount of O2-saturated water into heated tubing to supply a minimum flow rate of 2 mm/s of steam in the reaction chamber. Initial experiments used pure steam. More recent tests used a carrier gas of 60% Ar along with the steam.
Table 4 summarizes the results of the 300 hr TGA tests in O2-saturated steam plus 60%Ar at 800°C. The reaction order and parabolic R2 are measures of how well the data fit parabolic kinetics of
Mass change = kpt1/n (1)
where kp is the parabolic rate constant, t is time, and n is the reaction order (n = 1 for linear kinetics and n = 2 for parabolic kinetics). The parabolic R2 measures how well the data correlate with parabolic behavior using the calculated kp (with 1 being exact correlation and 0 being no correlation). The parabolic R2 values for 12 and one of the 617 tests were quite close to 1, showing excellent correlation with parabolic kinetics and with relatively little noise in the data. The oxidation rates of 230, 6W, 740, and one of the 617 tests were lower, and with more noise in the mass change data, which resulted in lower parabolic R2 values.
Table 4 Thermogravimetric analysis (TGA) for 300 hr tests in O2-saturated steam plus
60%Ar at 800°C
Alloy %Cr Reaction Order, n
ParabolicR2
Parabolic Rate Constant, kp mg2cm-4s-1
12 (9.5Cr) 9.5 1.78 1.000 1.4 × 10⁻³ 12 (10.5Cr) 10.5 1.70 1.000 1.9 × 10⁻³ 12 (10.5Cr) 10.5 1.76 0.995 2.0 × 10⁻³
J1 12.1 1.73 0.990 3.8 × 10⁻⁷ J5 12.5 1.91 0.990 1.7 × 10⁻⁷
617 22 1.62 0.960 1.4 × 10⁻⁷ 617 22 2.63 0.585 3.9 × 10⁻⁸ 230 22 1.78 0.878 6.9 × 10⁻⁸ 230 22 1.79 0.645 3.7 × 10⁻⁸ 6W 23 1.87 0.524 3.8 × 10⁻⁸ 740 24 2.20 0.527 2.0 × 10⁻⁷
Figure 13 – TGA apparatus for testing in atmospheric pressure steam at up to
800°C.

Furnace Exposures
Experiments were added that exposed samples to moist air at atmospheric pressure. These tests consisted of exposing the samples to air that was bubbled through water, resulting in up to 3% water vapor in the atmosphere. Samples were periodically removed from the furnace for mass measurements, and then replaced in the furnace for further exposure. More recent tests have attempted improve the procedures by ensuring that the input air is water saturated and that the temperature cycles are more tightly controlled (100 hr cycles with 200 °C/hr ramp rates).
The results for furnace exposures in moist (3% H2O) air are shown in Fig. 14. All of the nickel base alloys had modest mass gains at 650 and 700°C. Alloy 90 (at 760°C) and 6W (at 800°C) had higher mass gains than the other nickel alloys. To a lesser extent, 617 (at 800°C) also had higher mass gains and trends than 740 or 230. Overall, the best alloys in this test were 230 and 740.
The oxidation rates for the ferritic steel 12 at 800°C (Figs. 14G and 14H) were quite high, with 10.5Cr having slightly higher rates than 9.5Cr. At 700°C the oxidation rates of 12 were much lower; with 10.5Cr showing less mass increase than 9.5Cr (after 200 hours the mass gains were 0.16 mg/cm2 for the 10.5Cr version and 0.41 mg/cm2 for the 9.5Cr version). This is similar to the reported difference between 9% Cr and 12% Cr steels becoming significant at 650°C.16-17
Furnace exposure results for J1 and J5 are shown in Fig. 15. These nickel base alloys with relatively low Cr contents of 12.1 and 12.5 Cr have oxidation rates considerably less than the Fe base 12 (10.5Cr) alloy, Fig. 16H. At 800°C J1 had a decrease in mass from 250 to 500 hr, that may have been from spallation of an outer scale.
SUMMARY
The status of research to examine the steamside oxidation of advanced alloys for use in supercritical systems was presented. The initial results from cyclic oxidation in moist air at 760°C, TGA in steam plus 60% Ar at 800°C, and furnace exposures in moist air at 700°C and 800°C were described:
• Cyclic oxidation of nickel-base superalloys indicated a relatively steady rate of oxide scale loss after an initial mass gain.
• Cyclic oxidation of the ferritic 12 alloys resulted in high oxidation rates with linear kinetics after an initially higher oxidation rate.
• Cyclical oxidation of convex and concave 12 (10.5Cr) and 6W need further examination. Based on oxidation rates, curvature effects were inconclusive.
• TGA tests resulted in measured parabolic rate constants on the order of 10-3 mg2cm-4s-1 for the 12 alloys, and 10-7 to 10-8 mg2cm-4s-1 for 617, 230, 740 and 6W.
• Furnace exposures gave quite high oxidation rates for the ferritic steel 12 at 800°C, with 10.5Cr having slightly higher rates than 9.5Cr. At 700°C, the oxidation rates of 12 are much lower; with 10.5Cr showing much less mass increase than 9.5Cr.

A B
C D
E F
G H
Figure 14 – Furnace exposure results for A) 740, B) 230, C) 617, D) 718, E) 90, F) 6W, G) 12
(9.5Cr), and H) 12 (10.5Cr) in air with 3% water vapor.
0.0
0.1
0.2
0.3
0.4
0.5
0.6
0 500 1000 1500 2000 2500 3000
Time, Hours
718 3% H2O-Air
X
+800C760C700C650C
0.0
0.1
0.2
0.3
0.4
0.5
0.6
0 500 1000 1500 2000 2500 3000
Time, Hours
617 3% H2O-Air
X
+800C760C700C650C
0.0
0.1
0.2
0.3
0.4
0.5
0.6
0 500 1000 1500 2000 2500 3000
Time, Hours
740 3% H2O-Air
X
+800C760C700C650C
0.0
0.1
0.2
0.3
0.4
0.5
0.6
0 500 1000 1500 2000 2500 3000
Time, Hours
6W 3% H2O-Air
X
+800C760C700C650C
0.0
0.1
0.2
0.3
0.4
0.5
0.6
0 500 1000 1500 2000 2500 3000
Time, Hours
90 3% H2O-Air
X
+800C760C700C650C
-100
1020304050607080
0 500 1000 1500 2000 2500 3000
Time, Hours
12 (9.5Cr) 3% H2O-Air
X
+800C760C700C650C
-100
1020304050607080
0 500 1000 1500 2000 2500 3000
Time, Hours
12 (10.5Cr) 3% H2O-Air
X
+800C760C700C650C
0.0
0.1
0.2
0.3
0.4
0.5
0.6
0 500 1000 1500 2000 2500 3000
Time, Hours
230 3% H2O-Air
X
+800C760C700C650C

A B
Figure 15 – Furnace exposure results for A) J1 and B) J5 in air with 3% water vapor.
REFERENCES
1. B.B. Seth, “US Developments in Advanced Steam Turbine Materials,” Advanced Heat Resistance Steels for Power Generation, Electric Power Research Institute, 1999, pp. 519-542.
2. Steam, 40th ed., Eds. S.C. Stultz and J.B. Kitto, Babcock & Wilcox, 1992, p. 9. 3. R. Viswanathan, A.F. Armor, and G. Booras, “Supercritical Steam Power Plants—An
Overview,” Best Practices and Future Technologies, October 2003, Proceedings (New Delhi, India), National Thermal Power Corporation's Center for Power Efficiency and Environmental Protection and the US Agency for International Development (USAID), 2003.
4. R. Swanekamp, Power, 146 (4), 2002, pp. 32-40. 5. R. Viswanathan, A.F. Armor, and G. Booras, Power, 148 (4), 2004, pp. 42-49. 6. S. Klara and E. Shuster, “Tracking New Coal-Fired Power Plants—Coal’s Resurgence in
Electric Power Generation,” 12/22/2004, www.netl.doe.gov/coal/. 7. M. Richardson, Y. Kidera, and Y. Shimogori, “Supercritical Boiler Technology Matures,”
www.hitachi.us/supportingdocs/ forbus/powerindustrial/CG2004.pdf 8. G.S. Booras, R. Viswanathan, P. Weitzel, and A. Bennett, “Economic Analysis of Ultra
Supercritical PC Plants,” Pittsburgh Coal Conference, September 2003, Proceedings, (Pittsburgh, PA), University of Pittsburgh, 2003, paper 55.1.
9. J. M. Sarver and J. M. Tanzosh, “Steamside Oxidation Behavior of Candidate USC Materials at 650°C and 800°C,” presented at the 8th Ultra-Steel Workshop, Tsukuba, Japan (July 2004).
10. Y. Tamada, A. M. Beltran, and G. P. Wozney, EPRI Report TR-100979, Electric Power Research Institute, Palo Alto, CA, 1992.
11. R. Viswanathan and W. Bakker, J. of Materials Eng. and Performance, 10, 2001, pp. 96-101.
12. D.E. Alman and P.D. Jablonski, “Low Coefficient of Thermal Expansion (CTE) Nickel-Base Superalloys for Interconnect Applications in Intermediate Temperature Solid Oxide Fuel Cells (SOFC),” Superalloys 2004, TMS, 2004, pp. 617-622.
13. R. Yamamoto, Y. Kadoya, H. Kawai, R. Magoshi, T. Noda, S. Hamano, S. Ueta, and S. Isobe, “New Wrought Ni-Based Superalloys with Low Thermal Expansion for 700C Steam Turbines,” Materials of Advanced Power Engineering—2002, Proc. 7th Liege Conf., Sept 30-Oct 3, 2002, Energy and Technology Vol. 21, Forschungszentium Julich Gmbh Inst. Fur Wekstoffe und Verfahren der Energietechnik.
14. R. Viswanathan and W. Bakker, J. of Materials Eng. and Performance, 10, 2001, pp. 81-95.
0.0
0.2
0.4
0.6
0.8
1.0
1.2
0 500 1000 1500 2000 2500 3000
Time, Hours
J1 3% H2O-Air
X
+800C760C700C650C
0.0
0.2
0.4
0.6
0.8
1.0
1.2
0 500 1000 1500 2000 2500 3000
Time, Hours
J5 3% H2O-Air
X
+800C760C700C650C

15. M. J. Donachie and S. J. Donachie, Superalloys: A Technical Guide, ASM International, Materials Park, OH, 2002, p. 4.
16. F. Eberle and J. H. Kitterman, Behavior of Superheater Alloys, High Temperature, High Pressure Steam, ASME, 1968, p 67.
17. P. Ennis, Y. Wouters, and W. J. Quaddakers, “The Effect of Oxidation on the Service Life of 9-12% Cr Steels,” Advanced Heat Resistant Steels for Power Generation, Book 798, R. Viswanathan, J. W. Nutting, Eds., IOM Communications, 1999, p 457-467.