Overview of Toxicology and Study Design for Juvenile Toxicity · Hematology, Serum Ig, PBL...
42
© 2015 Envigo envigo.com Robert M. Parker, PhD, DABT Director of Developmental and Reproductive Toxicology 1 Overview of Toxicology and Study Design for Juvenile Toxicity IATP Session on Juvenile Toxicity with Emphasis on Adverse and Non-adverse Findings Tuesday, 20th September 2016; 8.00
Transcript of Overview of Toxicology and Study Design for Juvenile Toxicity · Hematology, Serum Ig, PBL...
© 2015 Envigo envigo.com
Robert M. Parker, PhD, DABT
Director of Developmental and Reproductive Toxicology
1
Overview of Toxicology and
Study Design for Juvenile
Toxicity
IATP Session on Juvenile Toxicity with Emphasis on
Adverse and Non-adverse Findings
Tuesday, 20th September 2016; 8.00

Juvenile Animal
Toxicology Studies • Juvenile animal studies are not new
and have been performed in the past
for classes with pediatric use (e.g.,
antibiotics)
• Not every pediatric drug development
requires juvenile animal studies!
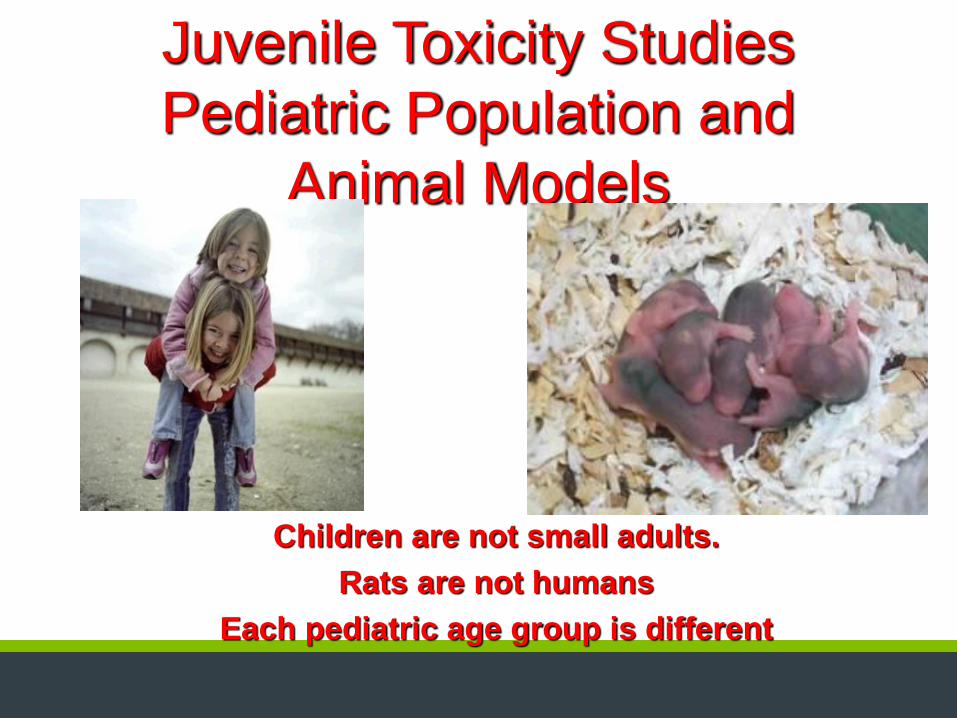
Juvenile Toxicity Studies
Pediatric Population and
Animal Models
Children are not small adults.
Rats are not humans
Each pediatric age group is different

4
Bridging the GAP
Juvenile Toxicity Studies
“the bridge”
Repeat dose studies Repro studies
Birth
Weaning
“Young Adult”
The GAP
Juvenile Toxicity Studies aim at bridging
potential data-gaps between the pre- & postnatal
toxicity studies (Seg III; offspring potentially
exposed until weaning) and the repeat-dose
toxicity studies (in young adult animals).

• Yes, even more complicated than adult Reproductive Toxicology
• Conceptually
– Dynamic Anatomy & Physiology
– Interdependence of endpoints
– Statistics
• Litter based
• Historical Control Data is important
– Neurobehavior (potential for latency)
– Myriad modes of action
Juvenile Toxicology Is Complicated
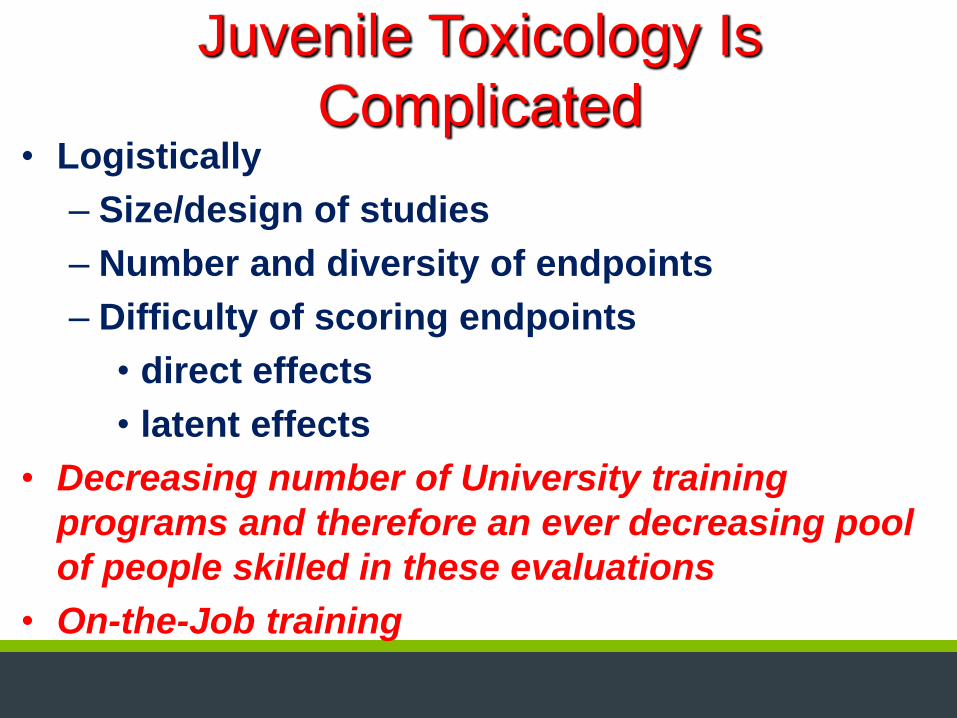
• Logistically
– Size/design of studies
– Number and diversity of endpoints
– Difficulty of scoring endpoints
• direct effects
• latent effects
• Decreasing number of University training
programs and therefore an ever decreasing pool
of people skilled in these evaluations
• On-the-Job training
Juvenile Toxicology Is
Complicated
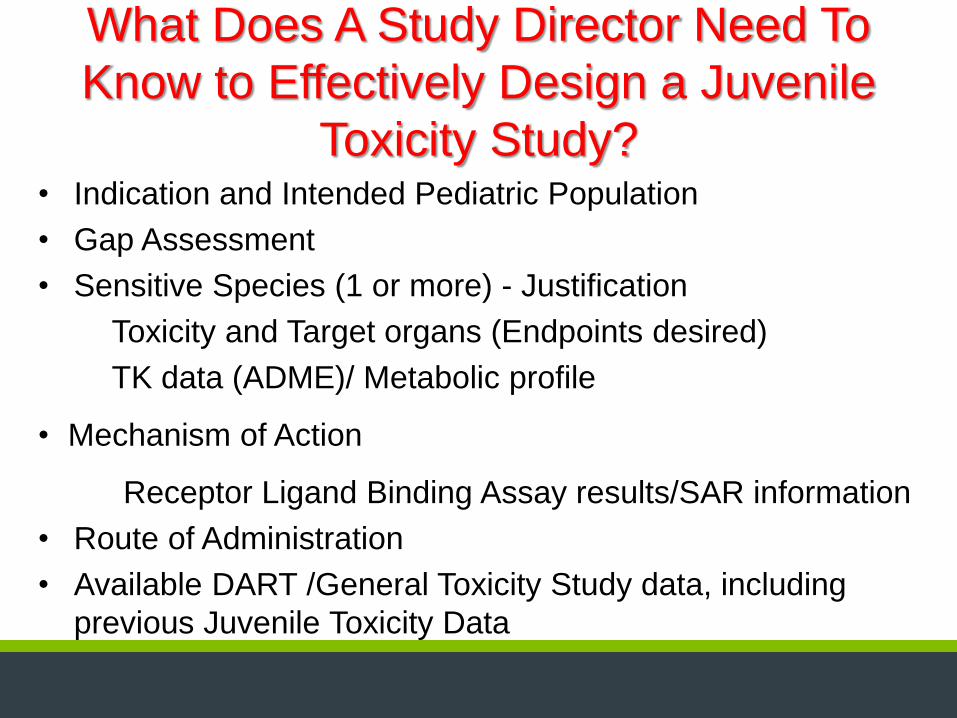
What Does A Study Director Need To
Know to Effectively Design a Juvenile
Toxicity Study? • Indication and Intended Pediatric Population
• Gap Assessment
• Sensitive Species (1 or more) - Justification
Toxicity and Target organs (Endpoints desired)
TK data (ADME)/ Metabolic profile
• Mechanism of Action
Receptor Ligand Binding Assay results/SAR information
• Route of Administration
• Available DART /General Toxicity Study data, including
previous Juvenile Toxicity Data

Drug Effects on Growth &
Development • Development is a continuous process
• Structural/functional maturational differences
affect drug safety
• Postnatal toxicity more likely in tissues
undergoing postnatal development
Organ System Maturation
• Neurologic Adolescent-Adult
• Reproductive Adolescent/puberty
• Pulmonary (alveoli) Infant (1-2 years)
• Renal (function) Infant (1 year)
• Skeletal Adolescent-Adult
• Immune (IgG, IgA) Infant-Child (5, 12 years)
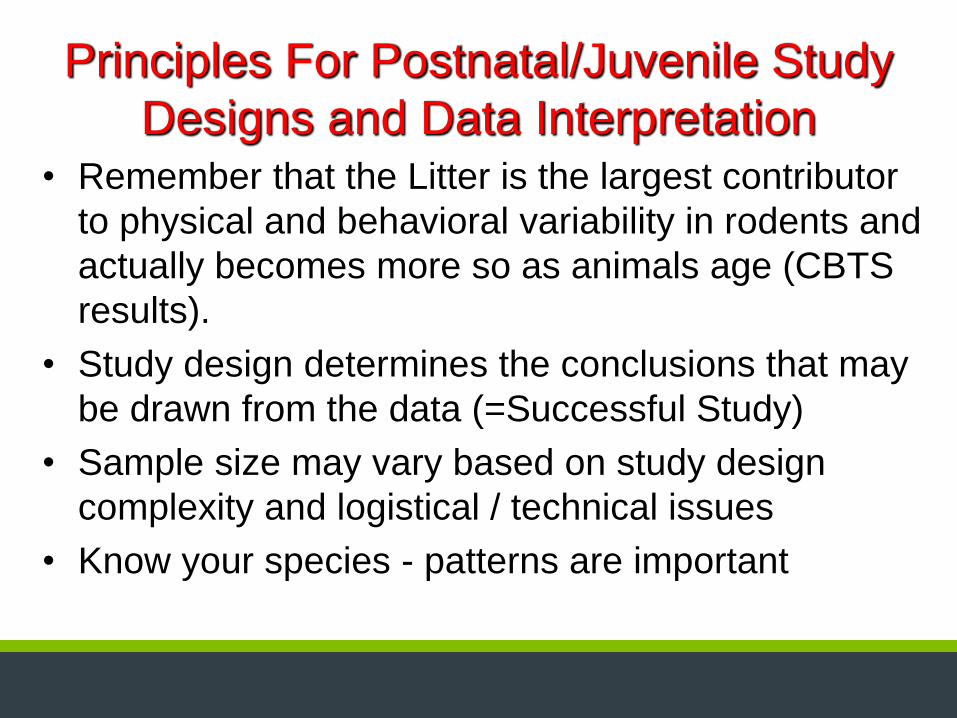
Principles For Postnatal/Juvenile Study
Designs and Data Interpretation • Remember that the Litter is the largest contributor
to physical and behavioral variability in rodents and
actually becomes more so as animals age (CBTS
results).
• Study design determines the conclusions that may
be drawn from the data (=Successful Study)
• Sample size may vary based on study design
complexity and logistical / technical issues
• Know your species - patterns are important

Litter Composition
• Within-Litter Design - Each litter has all Treatment Groups
• Split Litter Design - Each litter has some of the Treatment
Groups
• Between-Litter Design - Each litter has the same Treatment
Group
• Fostering Design
• Each litter is composed of pups from other litters without using
any siblings
• All pups within new litter receive the same treatment
• One Pup per Sex per Litter Design
Each Method has its advantages and disadvantages (logistically,
cross-contamination possibility, IACUC issues, and statistically)

Comparative Age Categories based on Overall
CNS and Reproductive Development
Years
Days
Months
Weeks
Weeks
Pre-Term
Neonate
Term
Neonate Infant/Toddler Child Adolescent
16 12 2 0.08 B
48 36 6 0.5 B
48 20 6 3 0.5 B
26 14 4 2 B
90 45 21 10 < 9 B
Ontogeny
Minipig
Rat
Dog
Nonhuman
Primate
Human
Buelke-Sam, 2011
Buelke-Sam, 2011

Rodents • Advantages
– Most frequently used for juvenile testing
– Extensive experience/historical data across labs
– Can test full span of postnatal development
– Ability to procure appropriate numbers of animals, even for early age assessments
– Wide range of tests available
• Neurobehavioral
• Disadvantages – May not be pharmacologically relevant
– small size limits routes of administration
– Potential immunogenic response
– Small size limits ability to collect multiple biologic specimens

Earliest Starting Day
Based on Dosing Routes Rat Mice Rabbit Dog Minipig
Oral gavage PND 1 PND 4 PND 14 PND 1 PND 1
Subcutaneous PND 1 PND 1 PND 6 PND 1 PND 1
Intramuscular PND 1 PND 1 PND 6 PND 1 PND 1
IV bolus (repeated) PND 4 PND 7 PND 6 PND 1 PND 7†
IV infusion PND 21 PND 21 PND 28 PND 56 PND 7†
Inhalation (Whole Body) PND 4 PND 4 PND 6 PND 10 PND 2-7
Inhalation (Nose only) PND 21 PND 21 PND 28 PND 4** PND 4**
Dermal * PND 21 PND 21 PND 28 PND 42 PND 28
†= difficult because there are no easily accessible veins (Vascular implant port can be
surgically installed after PND 7)
• = not recommended in pre-weaning animals
• ** = masks can be fit as young as PND 4 but restraint issues arise
Parker (2014),
Hoberman and Lewis (2010)
Luc De Schaepdrijver (2009)
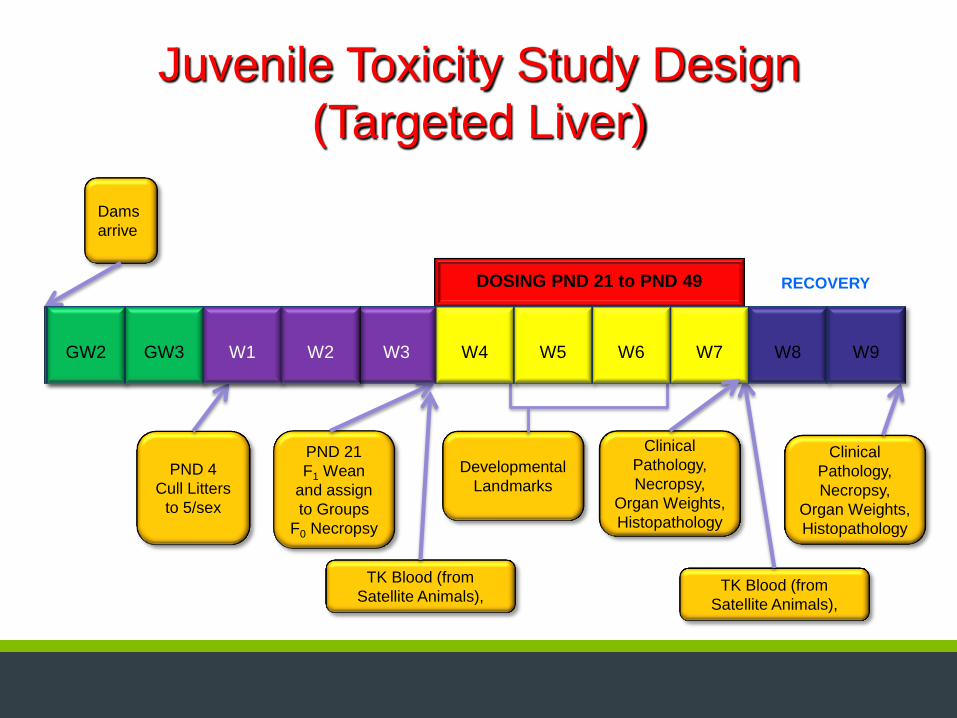
Juvenile Toxicity Study Design
(Targeted Liver)
DOSING PND 21 to PND 49
Dams
arrive
PND 4
Cull Litters
to 5/sex
PND 21
F1 Wean
and assign
to Groups
F0 Necropsy
Developmental
Landmarks
Clinical
Pathology,
Necropsy,
Organ Weights,
Histopathology
TK Blood (from
Satellite Animals),
Clinical
Pathology,
Necropsy,
Organ Weights,
Histopathology
TK Blood (from
Satellite Animals),
GW2 GW3 W1 W2 W3 W4 W5 W6 W7 W8 W9 GW2 GW3 W1 W2
RECOVERY

Juvenile Toxicity Study Design
(General Toxicity)
GW
2
GW
3 W1 W2 W3 W4 W5 W6 W7 W8 W9 W10 W11 W12 W13 W14
DOSING PND 7 to PND 63
Dams
arrive
PND 1
Litters
assigned to
Groups
PND 1
Litters
assigned to
Groups
PND 21
F1 Wean
F0 Necropsy
PND 21
F1 Wean
F0 Necropsy
Developmental
Landmarks
Ophthalmic
Examination
Clinical
Pathology,
Necropsy,
Organ Weights,
Histopathology
TK Blood (from
Satellite Animals),
Final Necropsy,
Clinical
Pathology,
Organ Weights,
Histopathology
TK Blood (from
Satellite Animals),
Dams
arrive
TK Blood (from
Satellite Animals),

Juvenile Toxicity Study Design
(General Toxicity with
Reproductive Evaluation)
DOSING PND 7 to PND 63
Dams
arrive
Developmental
Landmarks
Ophthalmic
Examination
Clinical
Pathology,
Necropsy,
Organ Weights,
Histopathology
TK Blood (from
Satellite Animals)
Male Necropsy,
Clinical
Pathology,
Organ Weights,
Histopathology
TK Blood (from
Satellite Animals)
GW
2
GW
3 W1 W2 W3 W4 W5 W6 W7 W8 W9 W10 W11 W12 W13 W14 W15 W16
PND 1
Litters
assigned to
Groups
Optional
Cohabitation
GD 14 C-Section,
Clinical Pathology,
Organ Weights,
Histopathology
PND 21
F1 Wean
F0 Necropsy

Juvenile Toxicity Study Design (Targeted
CNS and Reproductive Evaluation)
DOSING PND 7 to PND 63
Dams
arrive
Developmental
Landmarks
Ophthalmic
Examination
Clinical
Pathology,
Necropsy,
Organ Weights,
Histopathology
TK Blood (from
Satellite Animals)
Male Necropsy,
Clinical
Pathology,
Organ Weights,
Histopathology
TK Blood (from
Satellite Animals)
GW
2
GW
3 W1 W2 W3 W4 W5 W6 W7 W8 W9 W10 W11 W12 W13 W14 W15 W16
PND 1
Litters
assigned to
Groups
Optional
Cohabitation
GD 14 C-Section,
Clinical Pathology,
Organ Weights,
Histopathology
PND 21
F1 Wean
F0 Necropsy
Behavioral Testing
May require satellite groups for Brain Perfusion and Neurohistopathology
Juvenile Toxicity Study Design (Targeted
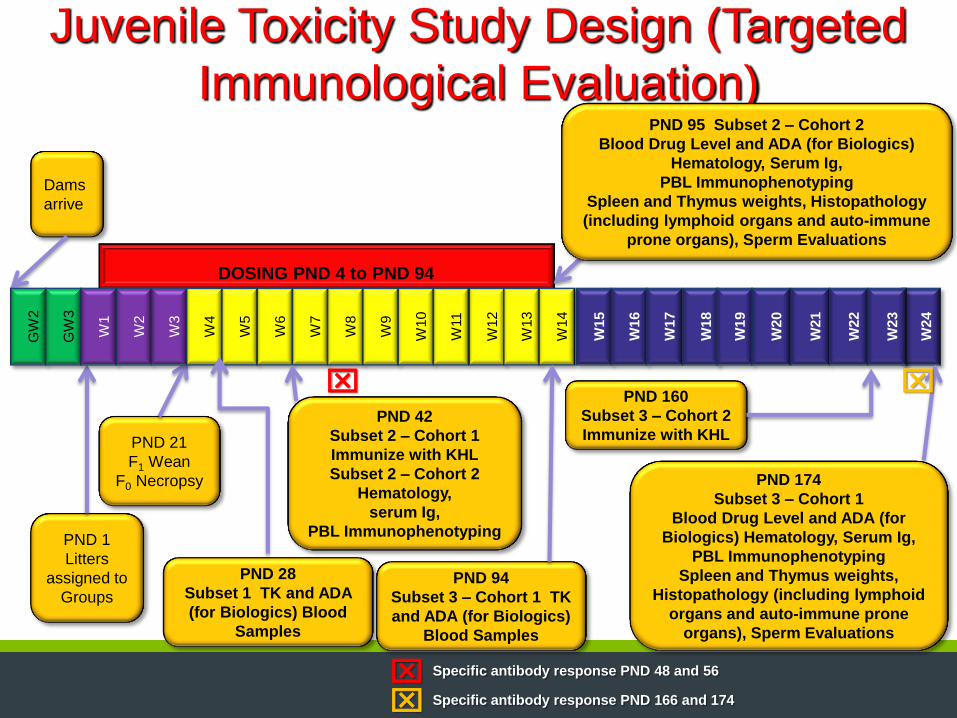
Immunological Evaluation)
DOSING PND 4 to PND 94
Dams
arrive
PND 28
Subset 1 TK and ADA
(for Biologics) Blood
Samples
PND 1
Litters
assigned to
Groups
PND 21
F1 Wean
F0 Necropsy
GW
2
GW
3
W1
W2
W3
W4
W5
W6
W7
W8
W9
W10
W11
W12
W13
W14
W15
W16
W17
W18
W19
W20
W21
W22
W24
W23
PND 42
Subset 2 – Cohort 1
Immunize with KHL
Subset 2 – Cohort 2
Hematology,
serum Ig,
PBL Immunophenotyping
PND 94
Subset 3 – Cohort 1 TK
and ADA (for Biologics)
Blood Samples
PND 95 Subset 2 – Cohort 2
Blood Drug Level and ADA (for Biologics)
Hematology, Serum Ig,
PBL Immunophenotyping
Spleen and Thymus weights, Histopathology
(including lymphoid organs and auto-immune
prone organs), Sperm Evaluations
PND 174
Subset 3 – Cohort 1
Blood Drug Level and ADA (for
Biologics) Hematology, Serum Ig,
PBL Immunophenotyping
Spleen and Thymus weights,
Histopathology (including lymphoid
organs and auto-immune prone
organs), Sperm Evaluations
PND 160
Subset 3 – Cohort 2
Immunize with KHL
Specific antibody response PND 48 and 56
Specific antibody response PND 166 and 174

Body Weight Intervals and Dosing PND 7 8 9 10 11 12 13 14 15 16 17 18 19 20 21 22
Males 16.8 19.1 21.5 23.8 26.2 28.9 31.6 34 36.6 39 41.5 43.9 46.7 50.7 54.9 57.8
Females 15.8 18 20.2 22.6 25 27.6 30.1 32.5 34.9 37.2 39.4 41.8 44.6 48.2 52.6 55.1
Weight every 2nd day (males) 100.0% 88.0% 100.0% 90.3% 100.0% 90.7% 100.0% 92.9% 100.0% 93.8% 100.0% 94.5% 100.0% 92.1% 100.0% 95.0%
Weight every 2nd day (females) 87.8% 87.8% 100.0% 89.4% 100.0% 90.6% 100.0% 92.6% 100.0% 93.8% 100.0% 94.3% 100.0% 92.5% 100.0% 95.5%
Weight every 3rd day (males) 100.0% 88.0% 78.1% 100.0% 90.8% 82.4% 100.0% 92.9% 86.3% 100.0% 94.0% 88.8% 100.0% 92.1% 85.1% 100.0%
Weight every 3rd day (males) 100.0% 87.8% 78.2% 100.0% 90.4% 81.9% 100.0% 92.6% 86.2% 100.0% 94.4% 89.0% 100.0% 92.5% 84.8% 100.0%
weight twice per week (males) 100.0% 88.0% 78.1% 70.6% 100.0% 90.7% 82.9% 100.0% 92.9% 87.2% 81.9% 100.0% 94.0% 86.6% 100.0% 95.0%
weight twice per week (females) 100.0% 87.8% 78.2% 69.9% 100.0% 90.6% 83.1% 100.0% 93.1% 87.4% 82.5% 100.0% 93.7% 86.7% 100.0% 95.5%
Weight weekly (males) 100.0% 88.0% 78.1% 70.6% 64.1% 58.1% 53.2% 100.0% 92.9% 87.2% 81.9% 77.4% 72.8% 67.1% 100.0% 95.0%
Weight weekly (males) 100.0% 87.8% 78.2% 69.9% 63.2% 57.2% 52.5% 100.0% 93.1% 87.4% 82.5% 77.8% 72.9% 67.4% 100.0% 95.5%
PND 23 24 25 26 27 28 29 30 31 32 33 34 35 36 37 38
Males 62.5 67.4 73 79.3 85.7 92.6 99.8 107.5 115.7 124 132.6 140.9 150.8 159.1 167.8 177.4
Females 59.7 64.2 69.5 74.9 80.6 86.2 92.1 98.2 104.7 111.1 117.9 124.5 131 136.5 142.4 148.2
Weight every 2nd day (males) 100.0% 92.7% 100.0% 92.1% 100.0% 92.5% 100.0% 92.8% 100.0% 93.3% 100.0% 94.1% 100.0% 94.8% 100.0% 94.6%
Weight every 2nd day (females) 100.0% 93.0% 100.0% 92.8% 100.0% 93.5% 100.0% 93.8% 100.0% 94.2% 100.0% 94.7% 100.0% 96.0% 100.0% 96.1%
Weight every 3rd day (males) 92.5% 85.8% 100.0% 92.1% 85.2% 100.0% 92.8% 86.1% 100.0% 93.3% 87.3% 100.0% 93.4% 88.6% 100.0% 94.6%
Weight every 3rd day (males) 92.3% 85.8% 100.0% 92.8% 86.2% 100.0% 93.6% 87.8% 100.0% 94.2% 88.8% 100.0% 95.0% 91.2% 100.0% 96.1%
weight twice per week (males) 87.8% 81.5% 100.0% 92.1% 85.2% 100.0% 92.8% 86.1% 80.0% 100.0% 93.5% 88.0% 100.0% 94.8% 89.9% 85.0%
weight twice per week (females) 88.1% 81.9% 100.0% 92.8% 86.2% 100.0% 93.6% 87.8% 82.3% 100.0% 94.2% 89.2% 100.0% 96.0% 92.0% 88.4%
Weight weekly (males) 87.8% 81.5% 75.2% 69.2% 64.1% 100.0% 92.8% 86.1% 80.0% 74.7% 69.8% 65.7% 100.0% 94.8% 89.9% 85.0%
Weight weekly (males) 88.1% 81.9% 75.7% 70.2% 65.3% 100.0% 93.6% 87.8% 82.3% 77.6% 73.1% 69.2% 100.0% 96.0% 92.0% 88.4%
PND 39 40 41 42 43 44 45 46 47 48 49 50 51 52 53 54
Males 185.8 194.5 203.5 212.9 220.6 229.3 238.2 246.5 255.3 263.7 273.5 281.5 290.4 300.4 307.2 316.7
Females 153.8 159.5 164.4 169.1 172.7 177.4 181 185.2 188.6 192.7 196.5 200.7 204.6 208.2 211.3 214.5
Weight every 2nd day (males) 100.0% 95.5% 100.0% 95.6% 100.0% 96.2% 100.0% 96.6% 100.0% 96.8% 100.0% 97.2% 100.0% 96.7% 100.0% 97.0%
Weight every 2nd day (females) 100.0% 96.4% 100.0% 97.2% 100.0% 97.4% 100.0% 97.7% 100.0% 97.9% 100.0% 97.9% 100.0% 98.3% 100.0% 98.5%
Weight every 3rd day (males) 90.3% 100.0% 95.6% 91.4% 100.0% 96.2% 92.6% 100.0% 96.6% 93.5% 100.0% 97.2% 94.2% 100.0% 97.8% 94.9%
Weight every 3rd day (males) 92.6% 100.0% 97.0% 94.3% 100.0% 97.4% 95.4% 100.0% 98.2% 96.1% 100.0% 97.9% 96.0% 100.0% 98.5% 97.1%
weight twice per week (males) 100.0% 95.5% 91.3% 100.0% 96.5% 92.8% 89.4% 100.0% 96.6% 93.5% 100.0% 97.2% 94.2% 91.0% 100.0% 97.0%
weight twice per week (females) 100.0% 96.4% 93.6% 100.0% 97.9% 95.3% 93.4% 100.0% 98.2% 96.1% 100.0% 97.9% 96.0% 94.4% 100.0% 98.5%
Weight weekly (males) 81.2% 77.5% 74.1% 100.0% 96.5% 92.8% 89.4% 86.4% 83.4% 80.7% 100.0% 97.2% 94.2% 91.0% 89.0% 86.4%
Weight weekly (males) 85.2% 82.1% 79.7% 100.0% 97.9% 95.3% 93.4% 91.3% 89.7% 87.8% 100.0% 97.9% 96.0% 94.4% 93.0% 91.6%
PND
55 56 57 58 59 60 61 62 63 64 65 66 67 68 69 70 % of correct
dose
Males 324.1 329.4 339.1 345.6 353.7 360.2 367.3 372.3 379.5 385.7 393 399.5 406 411.9 418 424.6
Females 218.6 222 224.9 227.5 231.2 234 236.2 238.7 242.3 245.1 248.3 250 253.7 256.4 258.5 260.9
Weight every 2nd day (males) 100.0% 98.4% 100.0% 98.1% 100.0% 98.2% 100.0% 98.7% 100.0% 98.4% 100.0% 98.4% 100.0% 98.6% 100.0% 98.4% 97.5%
Weight every 2nd day (females) 100.0% 98.5% 100.0% 98.9% 100.0% 98.8% 100.0% 99.0% 100.0% 98.9% 100.0% 99.3% 100.0% 98.9% 100.0% 99.1% 97.9%
Weight every 3rd day (males) 100.0% 98.4% 95.6% 100.0% 97.7% 95.9% 100.0% 98.7% 96.8% 100.0% 98.1% 96.5% 100.0% 98.6% 97.1% 100.0% 95.1%
Weight every 3rd day (males) 100.0% 98.5% 97.2% 100.0% 98.4% 97.2% 100.0% 99.0% 97.5% 100.0% 98.7% 98.0% 100.0% 98.9% 98.1% 100.0% 95.7%
weight twice per week (males) 94.8% 100.0% 97.1% 95.3% 93.1% 100.0% 98.1% 96.7% 100.0% 98.4% 96.6% 95.0% 100.0% 98.6% 97.1% 100.0% 93.8%
weight twice per week (females) 96.7% 100.0% 98.7% 97.6% 96.0% 100.0% 99.1% 98.0% 100.0% 98.9% 97.6% 96.9% 100.0% 98.9% 98.1% 100.0% 94.6%
Weight weekly (males) 84.4% 100.0% 97.1% 95.3% 93.1% 91.4% 89.7% 88.5% 100.0% 98.4% 96.6% 95.0% 93.5% 92.1% 90.8% 100.0% 86.4%
Weight weekly (males) 89.9% 100.0% 98.7% 97.6% 96.0% 94.9% 94.0% 93.0% 100.0% 98.9% 97.6% 96.9% 95.5% 94.5% 93.7% 100.0% 88.2%
PND
% of correct
dose
Males
Females
Weight every 2nd day (males) 97.5%
Weight every 2nd day (females) 97.9%
Weight every 3rd day (males) 95.1%
Weight every 3rd day (males) 95.7%
weight twice per week (males) 93.8%
weight twice per week (females) 94.6%
Weight weekly (males) 86.4%
Weight weekly (males) 88.2%
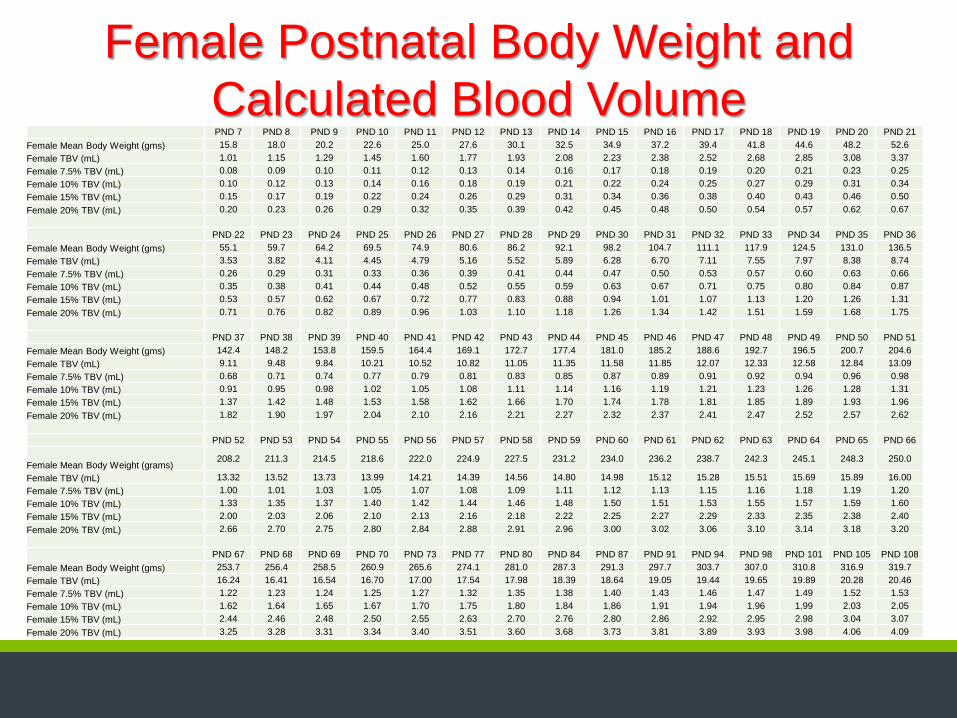
Female Postnatal Body Weight and
Calculated Blood Volume PND 7 PND 8 PND 9 PND 10 PND 11 PND 12 PND 13 PND 14 PND 15 PND 16 PND 17 PND 18 PND 19 PND 20 PND 21
Female Mean Body Weight (gms) 15.8 18.0 20.2 22.6 25.0 27.6 30.1 32.5 34.9 37.2 39.4 41.8 44.6 48.2 52.6
Female TBV (mL) 1.01 1.15 1.29 1.45 1.60 1.77 1.93 2.08 2.23 2.38 2.52 2.68 2.85 3.08 3.37
Female 7.5% TBV (mL) 0.08 0.09 0.10 0.11 0.12 0.13 0.14 0.16 0.17 0.18 0.19 0.20 0.21 0.23 0.25
Female 10% TBV (mL) 0.10 0.12 0.13 0.14 0.16 0.18 0.19 0.21 0.22 0.24 0.25 0.27 0.29 0.31 0.34
Female 15% TBV (mL) 0.15 0.17 0.19 0.22 0.24 0.26 0.29 0.31 0.34 0.36 0.38 0.40 0.43 0.46 0.50
Female 20% TBV (mL) 0.20 0.23 0.26 0.29 0.32 0.35 0.39 0.42 0.45 0.48 0.50 0.54 0.57 0.62 0.67
PND 22 PND 23 PND 24 PND 25 PND 26 PND 27 PND 28 PND 29 PND 30 PND 31 PND 32 PND 33 PND 34 PND 35 PND 36
Female Mean Body Weight (gms) 55.1 59.7 64.2 69.5 74.9 80.6 86.2 92.1 98.2 104.7 111.1 117.9 124.5 131.0 136.5
Female TBV (mL) 3.53 3.82 4.11 4.45 4.79 5.16 5.52 5.89 6.28 6.70 7.11 7.55 7.97 8.38 8.74
Female 7.5% TBV (mL) 0.26 0.29 0.31 0.33 0.36 0.39 0.41 0.44 0.47 0.50 0.53 0.57 0.60 0.63 0.66
Female 10% TBV (mL) 0.35 0.38 0.41 0.44 0.48 0.52 0.55 0.59 0.63 0.67 0.71 0.75 0.80 0.84 0.87
Female 15% TBV (mL) 0.53 0.57 0.62 0.67 0.72 0.77 0.83 0.88 0.94 1.01 1.07 1.13 1.20 1.26 1.31
Female 20% TBV (mL) 0.71 0.76 0.82 0.89 0.96 1.03 1.10 1.18 1.26 1.34 1.42 1.51 1.59 1.68 1.75
PND 37 PND 38 PND 39 PND 40 PND 41 PND 42 PND 43 PND 44 PND 45 PND 46 PND 47 PND 48 PND 49 PND 50 PND 51
Female Mean Body Weight (gms) 142.4 148.2 153.8 159.5 164.4 169.1 172.7 177.4 181.0 185.2 188.6 192.7 196.5 200.7 204.6
Female TBV (mL) 9.11 9.48 9.84 10.21 10.52 10.82 11.05 11.35 11.58 11.85 12.07 12.33 12.58 12.84 13.09
Female 7.5% TBV (mL) 0.68 0.71 0.74 0.77 0.79 0.81 0.83 0.85 0.87 0.89 0.91 0.92 0.94 0.96 0.98
Female 10% TBV (mL) 0.91 0.95 0.98 1.02 1.05 1.08 1.11 1.14 1.16 1.19 1.21 1.23 1.26 1.28 1.31
Female 15% TBV (mL) 1.37 1.42 1.48 1.53 1.58 1.62 1.66 1.70 1.74 1.78 1.81 1.85 1.89 1.93 1.96
Female 20% TBV (mL) 1.82 1.90 1.97 2.04 2.10 2.16 2.21 2.27 2.32 2.37 2.41 2.47 2.52 2.57 2.62
PND 52 PND 53 PND 54 PND 55 PND 56 PND 57 PND 58 PND 59 PND 60 PND 61 PND 62 PND 63 PND 64 PND 65 PND 66
Female Mean Body Weight (grams) 208.2 211.3 214.5 218.6 222.0 224.9 227.5 231.2 234.0 236.2 238.7 242.3 245.1 248.3 250.0
Female TBV (mL) 13.32 13.52 13.73 13.99 14.21 14.39 14.56 14.80 14.98 15.12 15.28 15.51 15.69 15.89 16.00
Female 7.5% TBV (mL) 1.00 1.01 1.03 1.05 1.07 1.08 1.09 1.11 1.12 1.13 1.15 1.16 1.18 1.19 1.20
Female 10% TBV (mL) 1.33 1.35 1.37 1.40 1.42 1.44 1.46 1.48 1.50 1.51 1.53 1.55 1.57 1.59 1.60
Female 15% TBV (mL) 2.00 2.03 2.06 2.10 2.13 2.16 2.18 2.22 2.25 2.27 2.29 2.33 2.35 2.38 2.40
Female 20% TBV (mL) 2.66 2.70 2.75 2.80 2.84 2.88 2.91 2.96 3.00 3.02 3.06 3.10 3.14 3.18 3.20
PND 67 PND 68 PND 69 PND 70 PND 73 PND 77 PND 80 PND 84 PND 87 PND 91 PND 94 PND 98 PND 101 PND 105 PND 108
Female Mean Body Weight (gms) 253.7 256.4 258.5 260.9 265.6 274.1 281.0 287.3 291.3 297.7 303.7 307.0 310.8 316.9 319.7
Female TBV (mL) 16.24 16.41 16.54 16.70 17.00 17.54 17.98 18.39 18.64 19.05 19.44 19.65 19.89 20.28 20.46
Female 7.5% TBV (mL) 1.22 1.23 1.24 1.25 1.27 1.32 1.35 1.38 1.40 1.43 1.46 1.47 1.49 1.52 1.53
Female 10% TBV (mL) 1.62 1.64 1.65 1.67 1.70 1.75 1.80 1.84 1.86 1.91 1.94 1.96 1.99 2.03 2.05
Female 15% TBV (mL) 2.44 2.46 2.48 2.50 2.55 2.63 2.70 2.76 2.80 2.86 2.92 2.95 2.98 3.04 3.07
Female 20% TBV (mL) 3.25 3.28 3.31 3.34 3.40 3.51 3.60 3.68 3.73 3.81 3.89 3.93 3.98 4.06 4.09
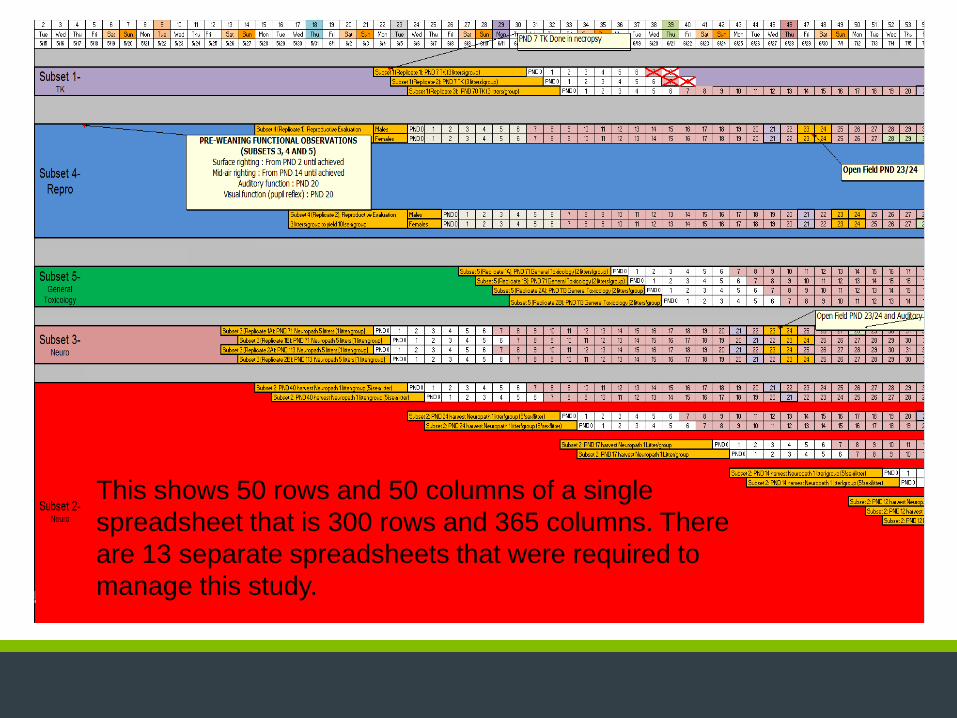
This shows 50 rows and 50 columns of a single
spreadsheet that is 300 rows and 365 columns. There
are 13 separate spreadsheets that were required to
manage this study.

Example: Comparative Development
of the Kidney Timing of Nephrogenesis Completion for Various Species
Species Nephrogenesis Completion
Man 35 weeks gestation
Sheep Before birth
Guinea Pig Before birth
Dog Postnatal week 2
Pig Postnatal week 3
Mouse Before birth
Rat Postnatal week 4-6
Critical period not
covered with standard
studies
Data from T. Zoetis, M.E. Hurtt. Species comparison of anatomical
and functional renal development Birth Defects Research (Part B)
68:111-120 (2003)

Ontogeny and Pharmacology
• Excretory organ (liver and kidneys) development has the greatest impact on drug disposition (pharmacokinetics)
• The most dramatic changes occur during the first days to months of life
• Anticipate age-related differences in drug disposition based on knowledge of ontogeny
• Effect of ontogeny on tissue/organ sensitivity to drugs (pharmacodynamics) is poorly studied
• Disease states may alter a drug’s PK/PD
Alcott, 2008

Trends in TK Function by Age Groups
Compared with Adults Clearance Pathway
Function
Premature
Neonates
Neonatal
<1 month
Early Infant
1-5 months
Late Infant
6-11 months
Toddler
1-2 years
Older
Children
Oral Absorption
Dermal Absorption
Lung Absorption
Renal Clearance NA /
CYP1A2 / Scale:BW3/4 Scale:BW3/4 Scale:BW3/4
CYP2E1 / Scale:BW3/4 Scale:BW3/4 Scale:BW3/4
CYP3A family
(except 3A7) / Scale:BW3/4 Scale:BW3/4 Scale:BW3/4
CYP3A7 = = =
Other CYPs / Scale:BW3/4 Scale:BW3/4 Scale:BW3/4
Glucuronidation /
N-Acetylation
Glutathione transferases Uncertain Uncertain Uncertain
Epoxide hydrolase /
Alcohol Dehydrogenase / Scale:BW3/4 Scale:BW3/4 Scale:BW3/4
Adapted from Ginsberg et al, 2004
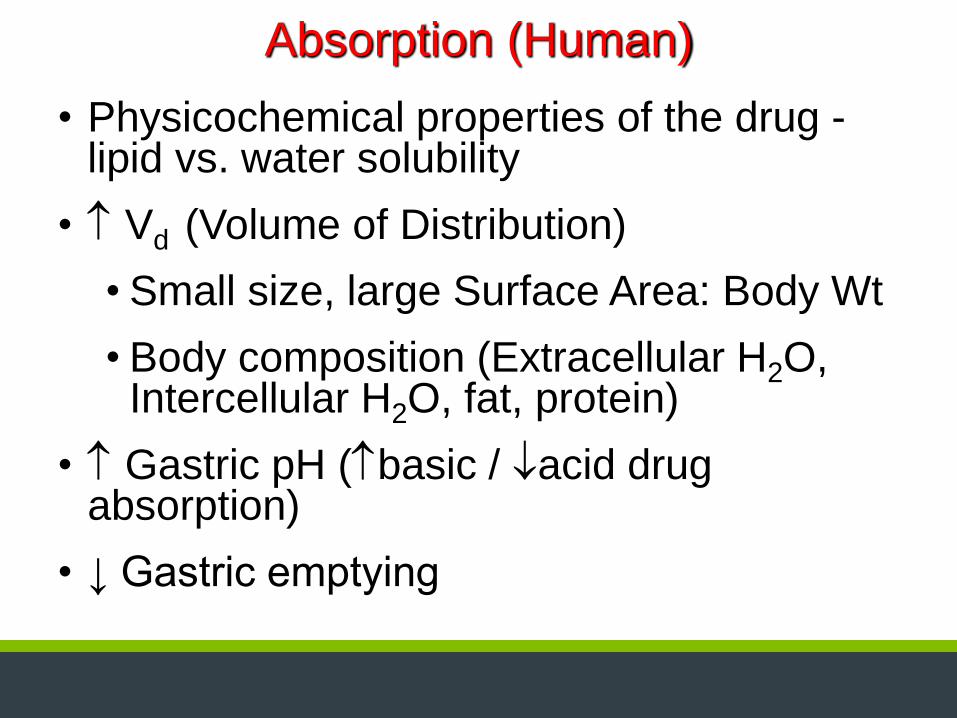
Absorption (Human)
• Physicochemical properties of the drug - lipid vs. water solubility
• Vd (Volume of Distribution)
• Small size, large Surface Area: Body Wt
• Body composition (Extracellular H2O, Intercellular H2O, fat, protein)
• Gastric pH (basic / acid drug absorption)
• ↓ Gastric emptying

www.huntingdon.com
Ontogeny of Body Composition
Adapted from Kaufman, Pediatric Pharmacology (Yaffe & Aranda, eds) pp. 212-9, 1992

Absorption (Human) • Variable GI motility
• Infant/neonate (Low)
• Child (High)
• Bioavailability unpredictable
• Topical effect is increased in neonates
• IM absorption is faster
• Inhalation absorption is increased
• Gastrointestinal
• Passive diffusion
• Transporters
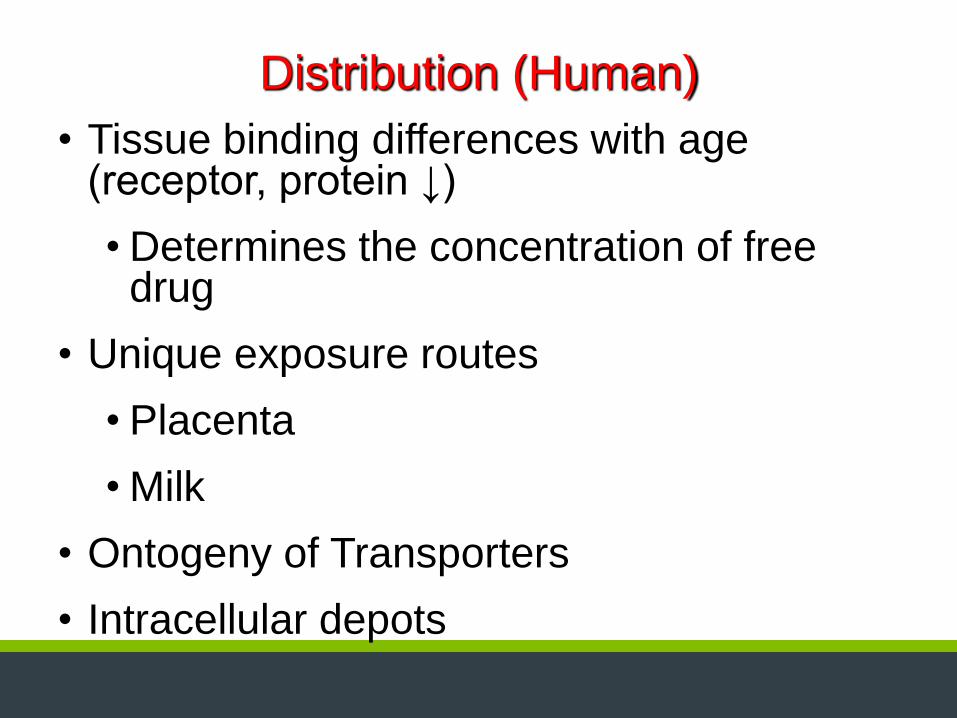
Distribution (Human)
• Tissue binding differences with age (receptor, protein ↓)
• Determines the concentration of free drug
• Unique exposure routes
• Placenta
• Milk
• Ontogeny of Transporters
• Intracellular depots

29
Distribution (Human)
• More drugs enter the immature blood brain barrier (neonatal)
• Not likely to be Zona Occludens (Tight Junctions) related • Ontogeny of Transporters – most likely cause
Molecular
Weight
Hydrogen
Binding
Plasma
Protein
Binding
Lipid-
Mediated
Transport
Drug
Transport
at the
Blood
Brain
Barrier
(BBB)
Large
Molecules
Endogenous
BBB
Transporters
Small
Molecules
Carrier
Mediated
Transport (CMT)
Receptor
Mediated
Transport (RMT)
Active
Efflux
Transport (AET)
GLUT1 (Glucose)
LAT1 (Neutral amino
acids)
CNT1 (Adrenaline)
MCT1 (monocarboxylic
acids
Insulin
Receptor
Transferrin
Receptor
BSAT1
Catp2
P-gp
Adapted from numerous sources
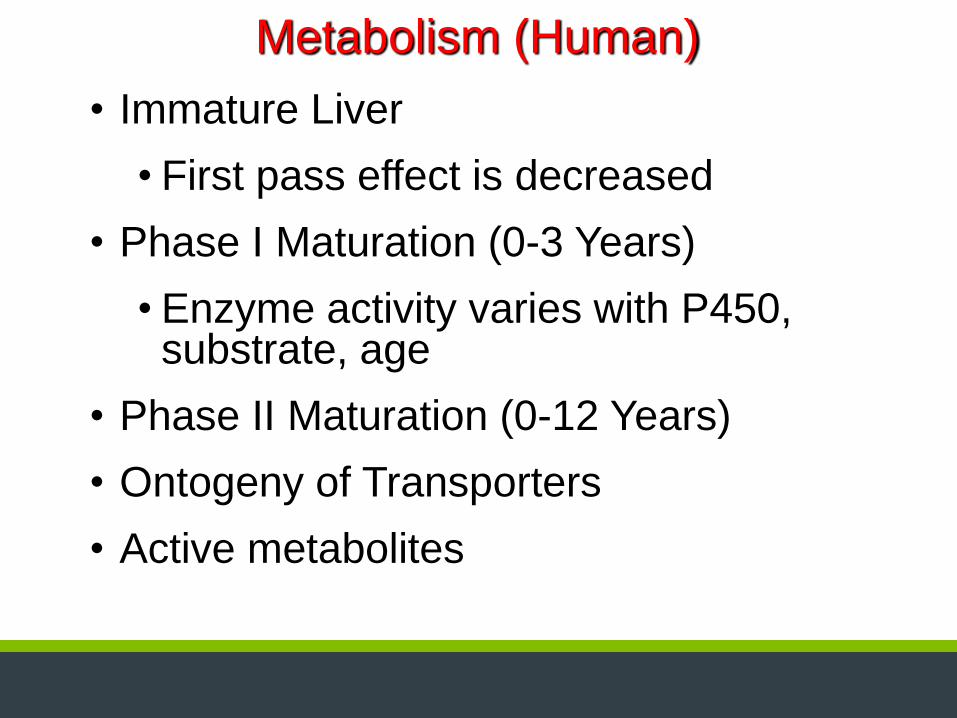
Metabolism (Human)
• Immature Liver
• First pass effect is decreased
• Phase I Maturation (0-3 Years)
• Enzyme activity varies with P450, substrate, age
• Phase II Maturation (0-12 Years)
• Ontogeny of Transporters
• Active metabolites

Excretion (Human)
• Generally depend on Transporters
• Immature Kidneys (full kidney function at 2-3 years)
• GFR
• tubular secretion/reabsorption
• Perfusion to the kidneys may be
• Infant/Neonate: slower CL, longer T1/2
• Child: rapid CL, shorter T1/2
• Biliary
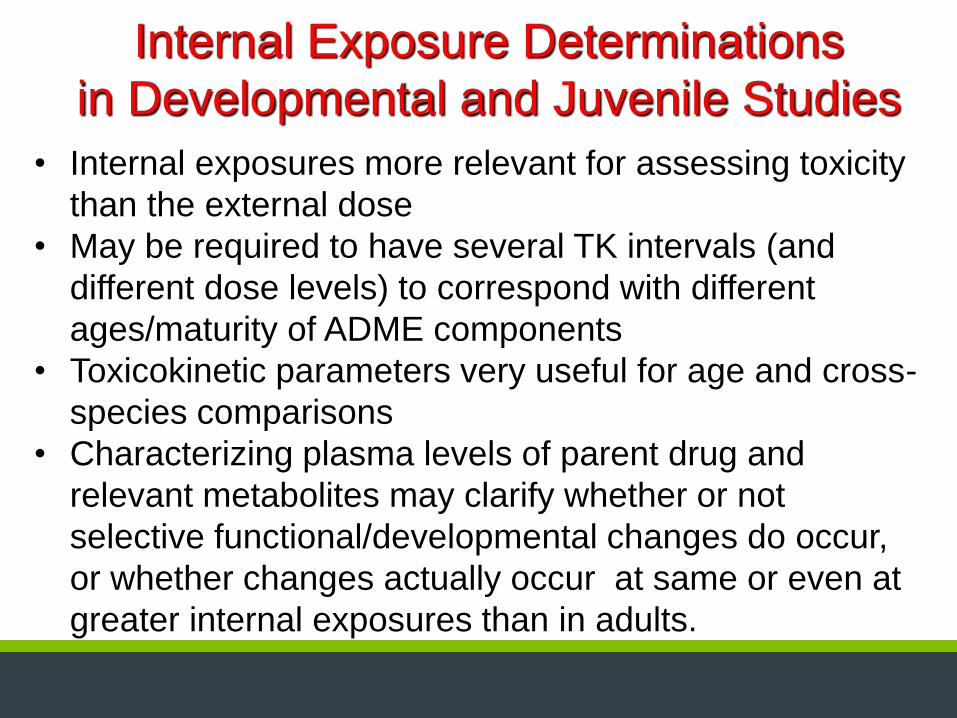
Internal Exposure Determinations
in Developmental and Juvenile Studies
• Internal exposures more relevant for assessing toxicity
than the external dose
• May be required to have several TK intervals (and
different dose levels) to correspond with different
ages/maturity of ADME components
• Toxicokinetic parameters very useful for age and cross-
species comparisons
• Characterizing plasma levels of parent drug and
relevant metabolites may clarify whether or not
selective functional/developmental changes do occur,
or whether changes actually occur at same or even at
greater internal exposures than in adults.

Postnatal tissue development during study • Absence of concurrent controls for unscheduled
deaths
• Causes of histologic alteration in unscheduled deaths:
• Direct effect of test article
• Indirect effect of test article [inappetance, stress
(immune system)]
• Delayed development (e.g. endocrine disruption)
• Normal postnatal histogenesis
• Presence of intercurrent disease
Pathology Evaluation:
Major Challenges in Juvenile Studies

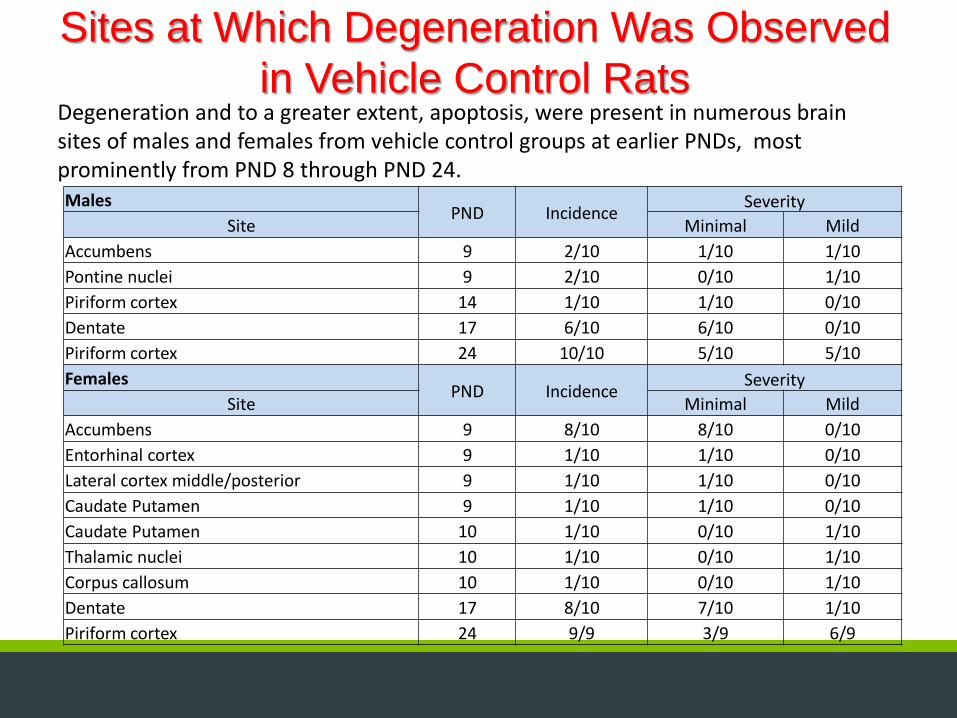
Sites at Which Degeneration Was Observed
in Vehicle Control Rats Degeneration and to a greater extent, apoptosis, were present in numerous brain sites of males and females from vehicle control groups at earlier PNDs, most prominently from PND 8 through PND 24. Males
PND Incidence Severity
Site Minimal Mild
Accumbens 9 2/10 1/10 1/10
Pontine nuclei 9 2/10 0/10 1/10
Piriform cortex 14 1/10 1/10 0/10
Dentate 17 6/10 6/10 0/10
Piriform cortex 24 10/10 5/10 5/10
Females PND Incidence
Severity
Site Minimal Mild
Accumbens 9 8/10 8/10 0/10
Entorhinal cortex 9 1/10 1/10 0/10
Lateral cortex middle/posterior 9 1/10 1/10 0/10
Caudate Putamen 9 1/10 1/10 0/10
Caudate Putamen 10 1/10 0/10 1/10
Thalamic nuclei 10 1/10 0/10 1/10
Corpus callosum 10 1/10 0/10 1/10
Dentate 17 8/10 7/10 1/10
Piriform cortex 24 9/9 3/9 6/9

•‘Juvenile Toxicity Studies are designed & performed on
a case-by-case basis (no standardized study protocols).
•Study design of Juvenile Toxicity Studies needs to
cover phases of growth & development of organ
systems at risk in the pediatric population.
•Rat is 1st choice species and will involve direct dosing
of pups. Pathologists must understand ‘normal’ organ
development.
•Do your homework. Each study is unique and requires
intellectual participation of numerous technical and
scientific personnel.
Take Away Message

About the Speaker Name: Robert M. Parker, PhD, DABT
Education: BS: Zoology (San Diego State University, San Diego CA)
MS: Anatomy (School of Veterinary Medicine, University of California, Davis CA)
PhD: Anatomy (School of Medicine, University of California, Davis CA)
Interests: Developmental and Reproductive Toxicology, Neurotoxicology,
Neurobehavior, Juvenile animal studies, Football, Baseball and Golf
Career Path: Assistant Professor of Anatomy (College of Osteopathic Medicine of the Pacific)
Study Director and Head, DART Section (Pathology Associates, Inc., National
Center for Toxicological Research)
Manager of Toxicology and Study Director (Transgenic Sciences Inc., Redfield
Laboratories)
Associate Director of Neurotoxicology (Primedica Argus Research Laboratories)
Director, Developmental, Reproductive and Neurological Toxicology (DuPont
Haskell Laboratory for Toxicology and Industrial Medicine)
Research Leader, Toxicologist (Hoffmann-LaRoche, Inc.)
Director, Developmental and Reproductive Toxicology (Huntingdon Life
Sciences)

Any Burning Questions?
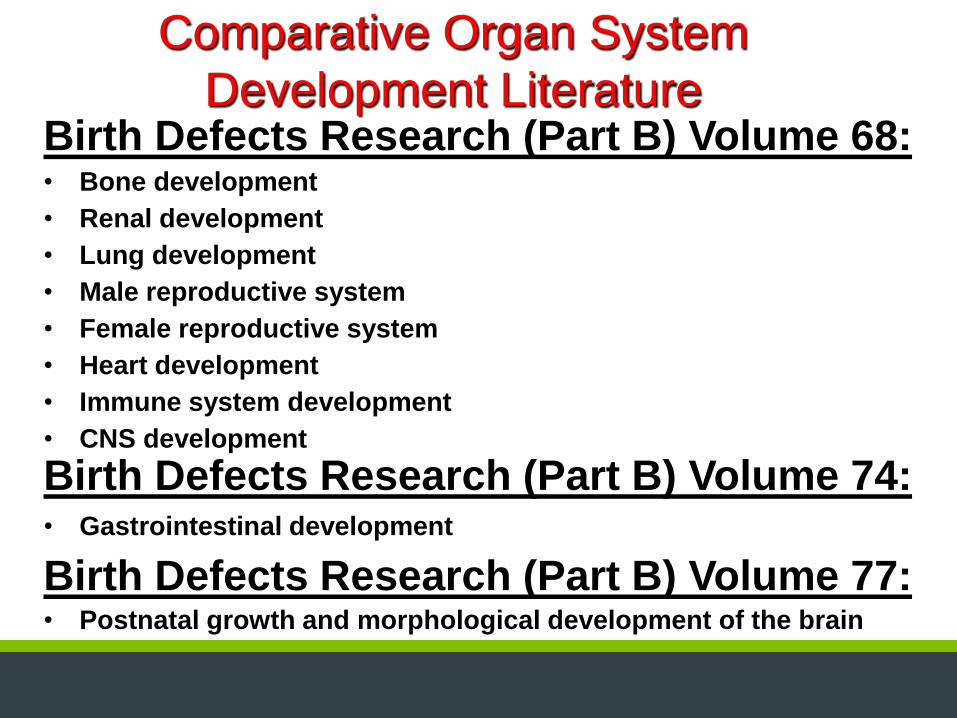
Comparative Organ System
Development Literature Birth Defects Research (Part B) Volume 68: • Bone development
• Renal development
• Lung development
• Male reproductive system
• Female reproductive system
• Heart development
• Immune system development
• CNS development
Birth Defects Research (Part B) Volume 74: • Gastrointestinal development
Birth Defects Research (Part B) Volume 77: • Postnatal growth and morphological development of the brain
Sites at Which Degeneration Was Observed
in Vehicle Control Rats Degeneration and to a greater extent, apoptosis, were present in numerous brain sites of males and females from vehicle control groups at earlier PNDs, most prominently from PND 8 through PND 24. Males
PND Incidence Severity
Site Minimal Mild
Accumbens 9 2/10 1/10 1/10
Pontine nuclei 9 2/10 0/10 1/10
Piriform cortex 14 1/10 1/10 0/10
Dentate 17 6/10 6/10 0/10
Piriform cortex 24 10/10 5/10 5/10
Females PND Incidence
Severity
Site Minimal Mild
Accumbens 9 8/10 8/10 0/10
Entorhinal cortex 9 1/10 1/10 0/10
Lateral cortex middle/posterior 9 1/10 1/10 0/10
Caudate Putamen 9 1/10 1/10 0/10
Caudate Putamen 10 1/10 0/10 1/10
Thalamic nuclei 10 1/10 0/10 1/10
Corpus callosum 10 1/10 0/10 1/10
Dentate 17 8/10 7/10 1/10
Piriform cortex 24 9/9 3/9 6/9
Juvenile Toxicology Literature Birth Defects Research (Part B) Volume 92:
• Introduction to special issue on the value of juvenile animal studies
• The value of juvenile animal studies: a pediatric clinical perspective
• Juvenile animal studies and pediatric drug development: a European regulatory perspective
• Juvenile animal studies and pediatric drug development retrospective review: use in regulatory decisions and labeling
• The value of juvenile animal studies: a Japanese industry perspective
• Nonclinical support of pediatric drug development in a global context: an industry perspective
• The value of juvenile animal studies “What have we learned from preclinical juvenile toxicity studies? II”
• Value of juvenile animal studies

DART and Juvenile Toxicology • Parker RM. Juvenile Toxicity Studies. In: Handbook of Toxicology, 3rd Edition. Derelanko, M.
and Auletta, C. (eds), Taylor & Francis Group, Boca Raton, Florida, 2014.
• AM Hoberman and EM Lewis, Pediatric Non-Clinical Drug Testing: Principles, Requirements
and Practices. John Wiley and Sons, Inc. 2012.
• York RG and Parker RM. Test Methods for Assessing Female Reproductive and Developmental
Toxicology. In: Principles and Methods of Toxicology, 6th Edition, Hayes, AW (ed). Informa
Healthcare, London, 2013.
• Parker RM. Developmental and Reproductive Toxicology. In: Handbook of Toxicology, 3rd
Edition. Derelanko, M. and Auletta, C. (eds), Taylor & Francis Group, Boca Raton, Florida,
2014.
• Ronald D. Hood and Robert M. Parker, “Reproductive and Developmental Toxicology” In:
Preclinical Development Handbook, S. Gad, editor, John Wiley Press, 2008.
• Parker RM. “Reproductive Toxicity Testing - Methodology. In: Developmental and
Reproductive Toxicology, A Practical Approach, 3rd Edition, R. Hood, editor, Informa
Healthcare, New York, 2012.
• Parker RM and York RG. Developmental and Reproductive Toxicology. In: Nonclinical Safety
Assessment: A Guide to International Pharmaceutical Regulations. Brock W and Hastings K
(eds), John Wiley and Sons, Inc., 2013.
• Haschek and Rousseaux's Handbook of Toxicologic Pathology. 2013 Wanda M. Haschek, Colin
G. Rousseaux, Matthew A. Wallig (Eds.), Elsevier, San Diego, CA.
• Histopathology of Preclinical Toxicity Studies: Interpretation and Relevance in Drug Safety
Evaluation. Fourth Edition, 2012 Peter Greaves (Ed.), Academic Press, Elsevier, San Diego,
CA

Developmental and Reproductive
Toxicology Literature
Birth Defects Research (Part B) Volume 86:
• The Nonclinical Fertility Study Design for Pharmaceuticals.
• Embryo-Fetal Developmental Toxicity Study Design for Pharmaceuticals.
• Pre- and Postnatal Developmental Toxicity Study ; Design for Pharmaceuticals.
• Juvenile Animal Toxicity Study Designs to Support Pediatric Drug Development.