Overview of the risk assessment process - unece.org · Overview of the risk assessment process ....
34
www.jrc.ec.europa.eu Serving society Stimulating innovation Supporting legislation 1 Overview of the risk assessment process
Transcript of Overview of the risk assessment process - unece.org · Overview of the risk assessment process ....

www.jrc.ec.europa.eu
Serving society
Stimulating innovation
Supporting legislation
1
Overview of the risk assessment process

Content
• Overview of Risk Analysis
• The Quantitative Risk Analysis Process
• Different Approaches
• Frequency and Consequence Assessment
• Sources of Uncertainties
• General Conclusions
RISK ANALYSIS, RISK ASSESSMENT, RISK MANAGEMENT
IEC 300-3-9 (1995)
Risk analysis
Hazard identification Risk estimation
Risk evaluation
Risk tolerability Analysis of options
Risk reduction
Decision making Implementation/monitoring
Risk
assessment
Risk
management
IEC Guide 73 (2002)

Objectives
• To provide a general overview of quantitative risk analysis for industrial establishments
• To be able to understand the key elements of the quantitative risk analysis process
• To understand and make familiar the main approaches and techniques for quantitative risk analysis

What is Risk?
Risk = set of <scenario, frequency, consequence>
What may go wrong?
How frequently could it occur?
How dangerous is it?
Risk = hazard / safeguards

What is Quantitative Risk Analysis?
complex, but well structured process, to provide a measure of the risks associated with the process, storage and transport of hazardous substances
Identify Hazards
Estimate the Risks associated to possible accidents scenarios leading to damage
Determine components, safety measures, and/or human actions necessary for plant safety
Final objective

Who are the main players?
Plant Operator Competent Authority
Risk Analysis
Chemical establishment Public

Risk assessment is a complex process
• It requires specific expertise in risk analysis itself
• It requires specialised knowledge about the object being analysed (e.g., chemical process safety)
PERFORMING A RISK ANALYSIS

• Evaluators should understand the fundamentals of risk assessment
• It is recommended there is access to an expert with specialized knowledge of industrial risk assessment
EVALUATE A RISK ANALYSIS
Competent Authority

In the Safety Report …
• to demonstrate that a particular scenario no longer presents a major-accident hazard due to the measures in place
• to demonstrate that the extent of the effects of a particular scenario have been limited
• to demonstrate the efficiency and the effectiveness of mitigation measures put in place
• to establish whether the activity is acceptable or not
• to establish whether further mitigating measures are necessary
• to provide information for competent authority obligations (e.g., emergency plans, land-use planning)

OUTCOME OF A RISK ANALYSIS
AN ESTIMATE OF THE RISK
RISK =
FREQUENCY X SEVERITY
How many and how often?

RISK ESTIMATE: A FAMILIAR EXAMPLE
From 2002 INTERNATIONAL ACCIDENT FACTS (Second Edition). Published by the National Safety Council (NSC) using WHO statistics
www.nsc.org
TEN COUNTRIES WITH THE HIGHEST
ANNUAL MOTOR VEHICLE DEATH RATES, MID-1990s
COUNTRY DEATHS PER
100,000
(1) Portugal 24.9
(2) Greece 23.3
(3) Venezuela 22.3
(4) Russian Federation 22.3
(5) Slovenia 14.3
(6) Cuba 18.3
(7) Poland 18.3
(8) Mauritius 17.8
(9) Colombia 17.4
(10) Hungary 17.0

HAZARDOUS INSTALLATION HYPOTHETICAL EXAMPLE
For example, for the atmospheric tank, you might have the following (hypothetical, not a real situation)
10-3 (1/1000) = Small fire, 1 tank destroyed Risk of 1 tank destroyed = 0.01% = 1/1000 = 10-3
Acceptable or unacceptable? 10-5 (1/100,000) = Explosion, 2 workers injured = Risk of 2 workers injured = .002% = 2/100,000 = 2 * 10-5
Acceptable or unacceptable? 10-6 (1/1,000,000) = Major fire, > 5 people killed = Risk of 5 people killed = .0005% = 5 *10-6
Acceptable or unacceptable?

STARTING POINT
Initiating event (undesired)= loss of containment (LOC)
• e.g., vessel rupture or leak, pipe rupture, the developing event:
• fire, explosion, release of toxics
Accident Scenario

GENERAL “BOW-TIE” APPROACH
•The centre of the diagram is the loss of containment event (LOC)
•The bow-tie left side depicts the overall possible causes.
•The left-side vertical bars refer to the measures (barriers) in place to prevent the release of dangerous substances and control escalation.
•The bow-tie right side describes possible accidental scenarios
•The right-side vertical bars in the bow-tie right side refer to the measures to mitigate consequences.
bow-tie diagram
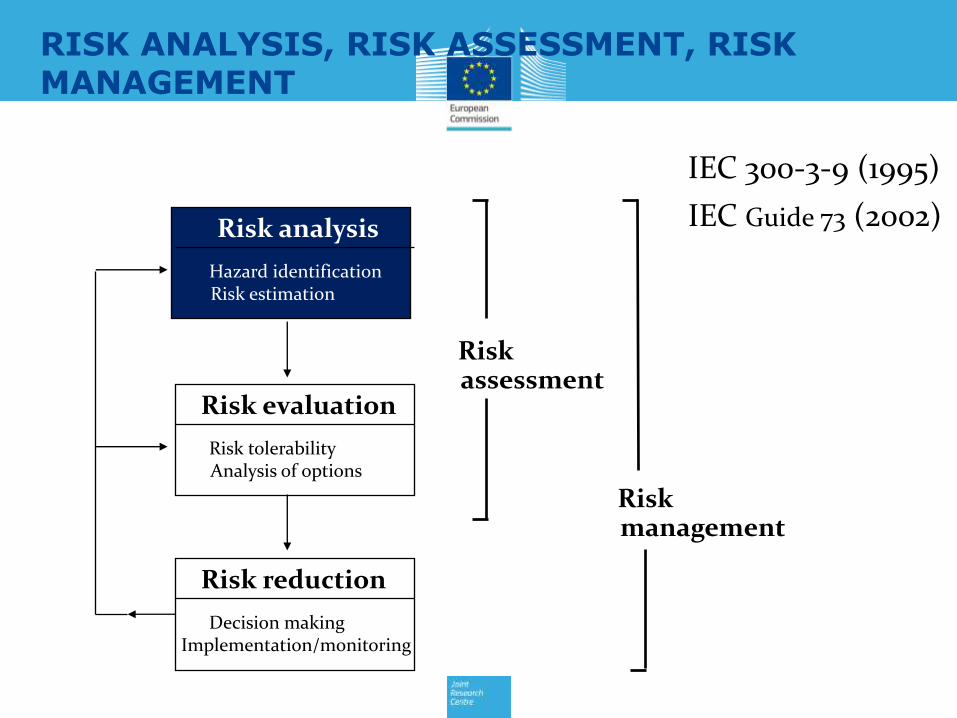
TYPICAL CONSEQUENCES
Fire Explosion Toxic release
Damage

HAZARD IDENTIFICATION
ACCIDENT
CONSEQUENCE
ANALYSIS
ACCIDENT
FREQUENCY
ANALYSIS
RISK CALCULATION &
REPRESENTATION
Plants data Accident database
Hazard identification models
FMEA HAZOP Accidents DBs
Plant data Plant layout
Substances data Meteorological data
Accident effect models
Fires Explosion Dispersion
Plant data Reliability database
Human factor database Reliability models
Fault tree Event tree Markov
Site map Population distribution
Vulnerability data Risk calculation models
Input Data and Models

IMPROVEMENT
PREVENTION & MITIGATION frequency
Prevention
R2
R1
Mitigation
R3
Consequence
Accident scenario
x
x
R = f C

Frequency and Consequence Assessment

Frequency Assessment
Expert judgement
Use of databases
Other Methods
• Fault-Tree Analysis
• Event-Tree Analysis
• Markov
Basic events
Different Scenarios associated with
the same LOC
How frequent is it?

CONSEQUENCE ASSESSMENT
How dangerous is it?
Used to estimate:
• the extent to which damage may occur as a consequence of an accident

TOXIC RELEASE
LIQUID PHASE
GAS, VAPOUR PHASE
ON GROUND IN WATER
SOLUBLE FLUID
INSOLUBLE FLUID
HIGH VELOCITY
LOW VELOCITY
LESS DENSE THAN AIR
MORE DENSE THAN AIR
Pool formation and evaporation
Liquid/liquid dispersion
Pool formation
Dispersion for Turbulence (Buoyant)
Dispersion for gravity
Toxic release

EXPLOSION
CONFINED UNCONFINED
PARTIALLY UNCONFINED
POWDERS UNSTABLE REACTIONS
FLAMABLE GAS AND VAPOURS
FLAMABLE GAS AND VAPOURS
CRYOGENIC LIQUIDS
Explosion

FIRE
POOL FIRE FLASH FIRE FIREBALL JET FIRE
Fire

From Damage to Consequences
VULNERABILITY
POPULATION INFRASTRUCTURE
DAMAGE CRITERIA PROBIT MODELS
PHYSICAL DAMAGE

Consequence Assessment in practice
• It is an expert activity (often conducted by external consultants) and expensive
• It is not only conducted for risk assessment purposes (e.g. emergency planning, LUP)
• Sophisticated software tools are very expensive although some freeware is available (ALHOA, etc)
• Input and output data are not reported in a standardised way, which makes interoperability amongst different packages very difficult

Risk Calculation & representation
consequence
fre
qu
en
cy
Unacceptable
ALARA
Acceptable

Frequency Scale
Severity
Category
Qualitative Definition Quantitative Definition
injury
1 catastrophic multiple fatalities
2 major single fatality, multiple injuries
3 very serious permanent disabling injury
4 serious serious injury, full recovery
5 minor lost-time injury, short absence from
work
Severity Category Qualitative Definition Quantitative Definition
(p.a.)
Cont. Continuous Weighting factor
A likely once in next year 1
B possible but not likely 0.1
C unlikely 0.01
D very unlikely 0.001
E remote 0.0001
Risk matrix
Consequence Severity Category
Freq. 5 4 3 2 1
A
B
C
D
E
Not Acceptable
Acceptable
ALARP

Individual Risk annual frequency of occurrence of the reference damage (e.g., the death), in any point of the geographical area, for a person present This is a useful figure to characterise the risk in a given location.
Residential area
10-4 10-5 10-6 10-7
Risk source
Sea
Risk indicators

Risk Acceptance Criteria
What is acceptable depend upon current societal tolerance
• What is tolerable today may not be considered as tolerable
tomorrow
• What is tolerable somewhere may not be tolerable somewhere
else

Risk Criteria
Individual Risk Societal Risk
10-5
10-5 10-6
10-7
10-8 10-7
10-9
RISK UNACCEPTABLE
RISK ACCEPTABLE
RISK REDUCTION

Uncertainty: example
BEQUAR Benchmark
Fabbri et al., J Hazard Mater. 2009 Mar 15;162(2-3):1465-76

KEY CONCEPTS TO REMEMBER
• Analysis completeness can never be assured
• Uncertainty on the estimated risk figure cannot be avoided, however sensitivity studies can help filling the gap
• Transparency in the process is essential (hypothesis, data and modelling)
Risk Analysis is not necessarily important to get the exact (absolute) figure of risk. The overall process of risk analysis helps improving awareness of the critical aspects of the plant

57
Training Workshop on Chemical Accident Prevention Program
Thank you