Overview of the Long-Term Care Health Workforce in Colorado€¦ · Overview of the Long-Term Care...
14
Overview of the Long-Term Care Health Workforce in Colorado July 17, 2009 FOR MORE INFORMATION, PLEASE CONTACT: Amy Downs, MPP Director for Policy and Research Colorado Health Institute 303.831.4200 x221 [email protected]
-
Upload
truonghanh -
Category
Documents
-
view
220 -
download
0
Transcript of Overview of the Long-Term Care Health Workforce in Colorado€¦ · Overview of the Long-Term Care...
Overview of the Long-Term Care
Health Workforce in Colorado
July 17, 2009
FOR MORE INFORMATION, PLEASE CONTACT:
Amy Downs, MPP
Director for Policy and Research
Colorado Health Institute
303.831.4200 x221
Colorado Health Institute 2 July 2009
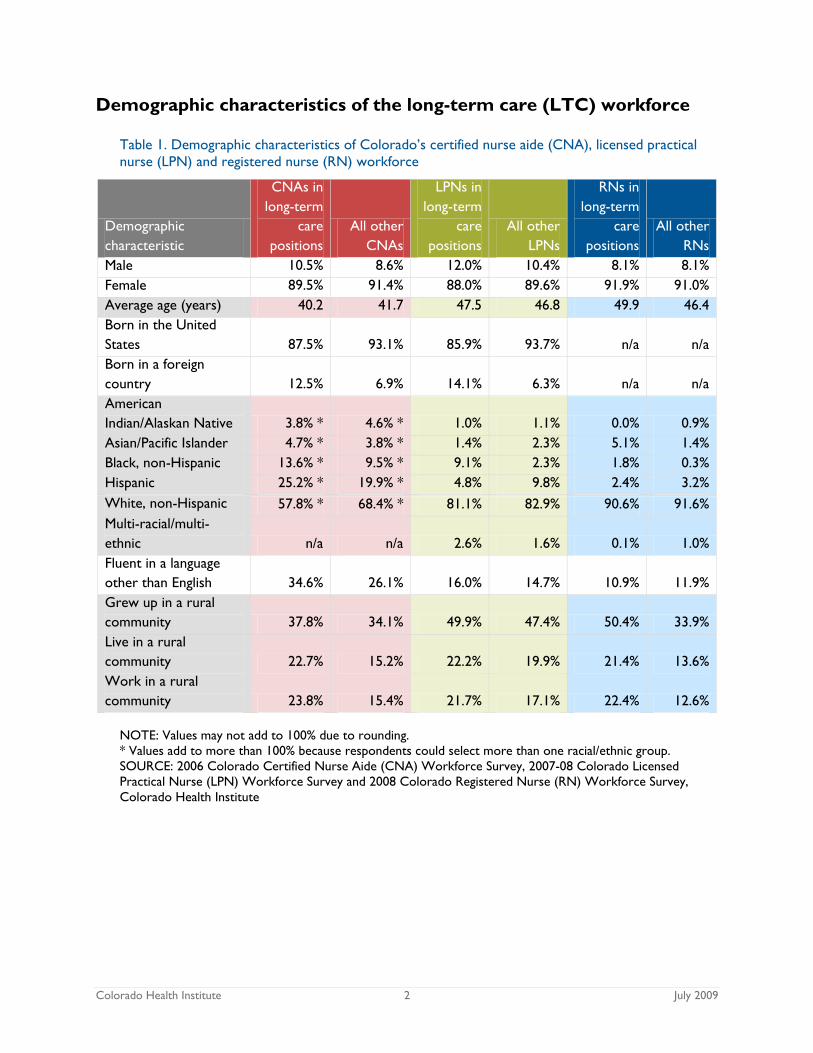
Demographic characteristics of the long-term care (LTC) workforce
Table 1. Demographic characteristics of Colorado’s certified nurse aide (CNA), licensed practical
nurse (LPN) and registered nurse (RN) workforce
Demographic
characteristic
CNAs in
long-term
care
positions
All other
CNAs
LPNs in
long-term
care
positions
All other
LPNs
RNs in
long-term
care
positions
All other
RNs
Male 10.5% 8.6% 12.0% 10.4% 8.1% 8.1%
Female 89.5% 91.4% 88.0% 89.6% 91.9% 91.0%
Average age (years) 40.2 41.7 47.5 46.8 49.9 46.4
Born in the United
States 87.5% 93.1% 85.9% 93.7% n/a n/a
Born in a foreign
country 12.5% 6.9% 14.1% 6.3% n/a n/a
American
Indian/Alaskan Native 3.8% * 4.6% * 1.0% 1.1% 0.0% 0.9%
Asian/Pacific Islander 4.7% * 3.8% * 1.4% 2.3% 5.1% 1.4%
Black, non-Hispanic 13.6% * 9.5% * 9.1% 2.3% 1.8% 0.3%
Hispanic 25.2% * 19.9% * 4.8% 9.8% 2.4% 3.2%
White, non-Hispanic 57.8% * 68.4% * 81.1% 82.9% 90.6% 91.6%
Multi-racial/multi-
ethnic n/a n/a 2.6% 1.6% 0.1% 1.0%
Fluent in a language
other than English 34.6% 26.1% 16.0% 14.7% 10.9% 11.9%
Grew up in a rural
community 37.8% 34.1% 49.9% 47.4% 50.4% 33.9%
Live in a rural
community 22.7% 15.2% 22.2% 19.9% 21.4% 13.6%
Work in a rural
community 23.8% 15.4% 21.7% 17.1% 22.4% 12.6%
NOTE: Values may not add to 100% due to rounding.
* Values add to more than 100% because respondents could select more than one racial/ethnic group.
SOURCE: 2006 Colorado Certified Nurse Aide (CNA) Workforce Survey, 2007-08 Colorado Licensed
Practical Nurse (LPN) Workforce Survey and 2008 Colorado Registered Nurse (RN) Workforce Survey,
Colorado Health Institute
Colorado Health Institute 3 July 2009
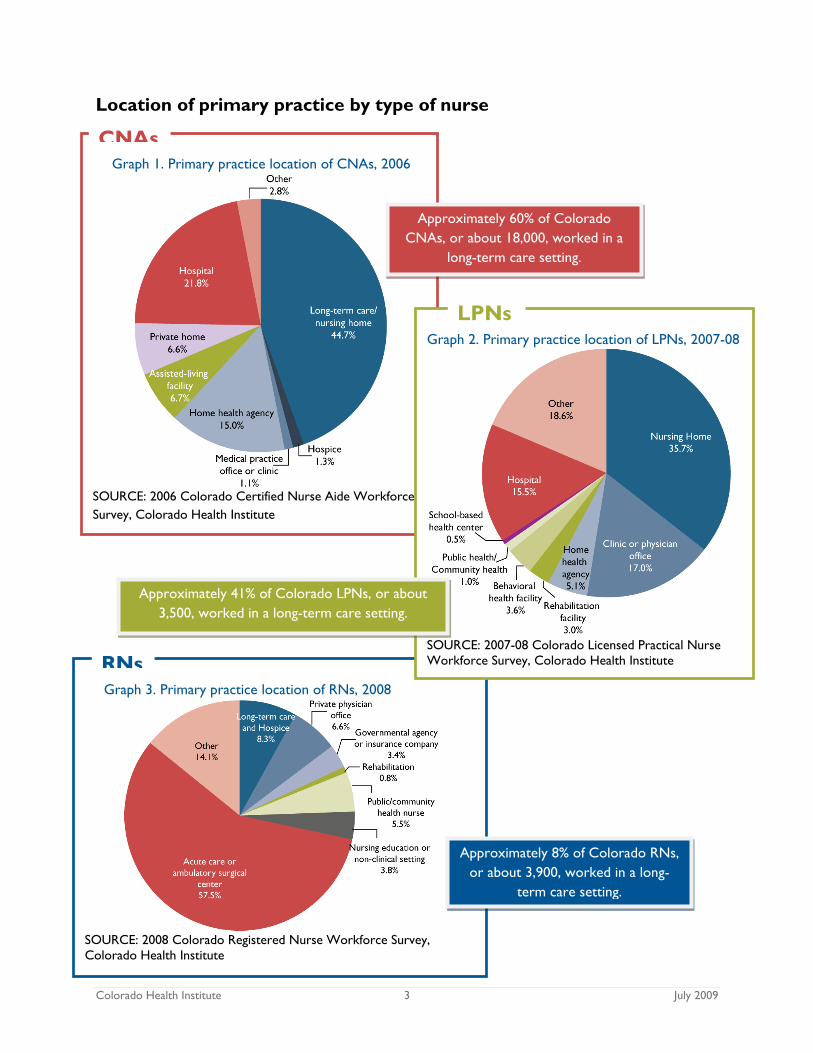
Location of primary practice by type of nurse
Graph 1. Primary practice location of CNAs, 2006
SOURCE: 2006 Colorado Certified Nurse Aide Workforce
Survey, Colorado Health Institute
Graph 3. Primary practice location of RNs, 2008
SOURCE: 2008 Colorado Registered Nurse Workforce Survey,
Colorado Health Institute
Graph 2. Primary practice location of LPNs, 2007-08
SOURCE: 2007-08 Colorado Licensed Practical Nurse
Workforce Survey, Colorado Health Institute
Approximately 60% of Colorado
CNAs, or about 18,000, worked in a
long-term care setting.
Approximately 41% of Colorado LPNs, or about
3,500, worked in a long-term care setting.
Approximately 8% of Colorado RNs,
or about 3,900, worked in a long-
term care setting.
CNAs
RNs
LPNs
Colorado Health Institute 4 July 2009
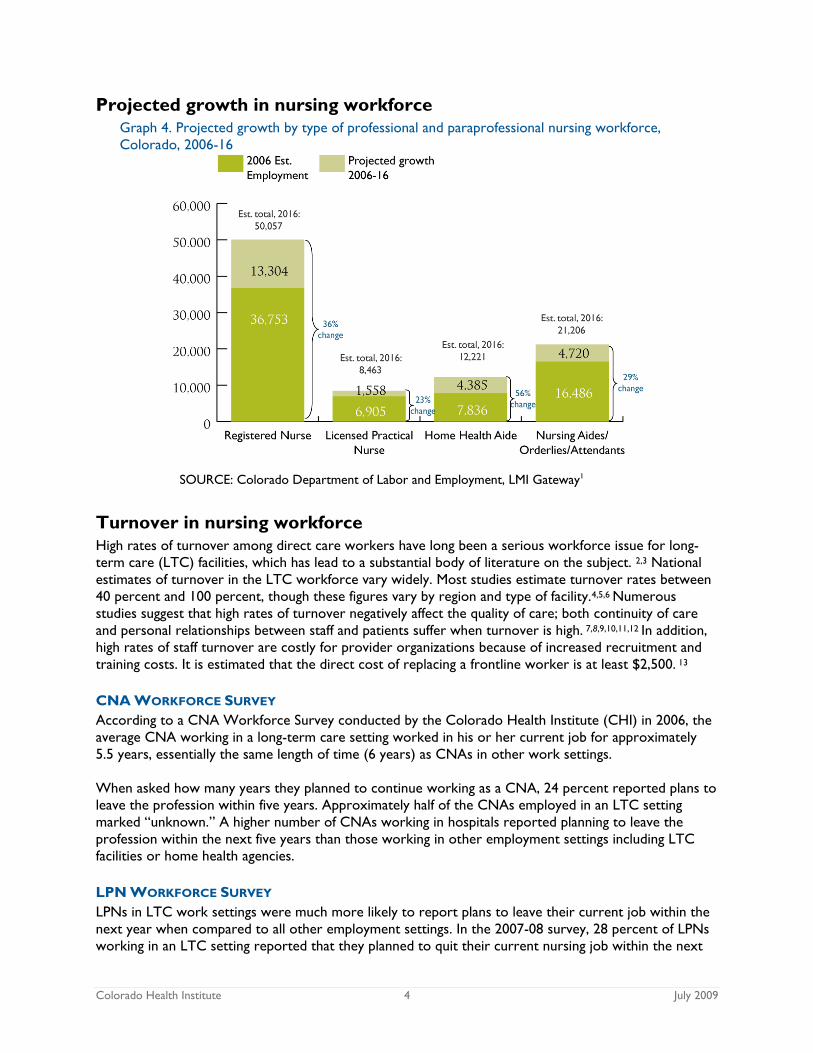
Projected growth in nursing workforce
Graph 4. Projected growth by type of professional and paraprofessional nursing workforce,
Colorado, 2006-16
SOURCE: Colorado Department of Labor and Employment, LMI Gateway1
Turnover in nursing workforce
High rates of turnover among direct care workers have long been a serious workforce issue for long-
term care (LTC) facilities, which has lead to a substantial body of literature on the subject. 2,3 National
estimates of turnover in the LTC workforce vary widely. Most studies estimate turnover rates between
40 percent and 100 percent, though these figures vary by region and type of facility.4,5,6 Numerous
studies suggest that high rates of turnover negatively affect the quality of care; both continuity of care
and personal relationships between staff and patients suffer when turnover is high. 7,8,9,10,11,12 In addition,
high rates of staff turnover are costly for provider organizations because of increased recruitment and
training costs. It is estimated that the direct cost of replacing a frontline worker is at least $2,500. 13
CNA WORKFORCE SURVEY
According to a CNA Workforce Survey conducted by the Colorado Health Institute (CHI) in 2006, the
average CNA working in a long-term care setting worked in his or her current job for approximately
5.5 years, essentially the same length of time (6 years) as CNAs in other work settings.
When asked how many years they planned to continue working as a CNA, 24 percent reported plans to
leave the profession within five years. Approximately half of the CNAs employed in an LTC setting
marked ―unknown.‖ A higher number of CNAs working in hospitals reported planning to leave the
profession within the next five years than those working in other employment settings including LTC
facilities or home health agencies.
LPN WORKFORCE SURVEY
LPNs in LTC work settings were much more likely to report plans to leave their current job within the
next year when compared to all other employment settings. In the 2007-08 survey, 28 percent of LPNs
working in an LTC setting reported that they planned to quit their current nursing job within the next
Colorado Health Institute 5 July 2009
12 months. Only 16 percent of LPNs working in other settings reported that they planned to leave
within 12 months.
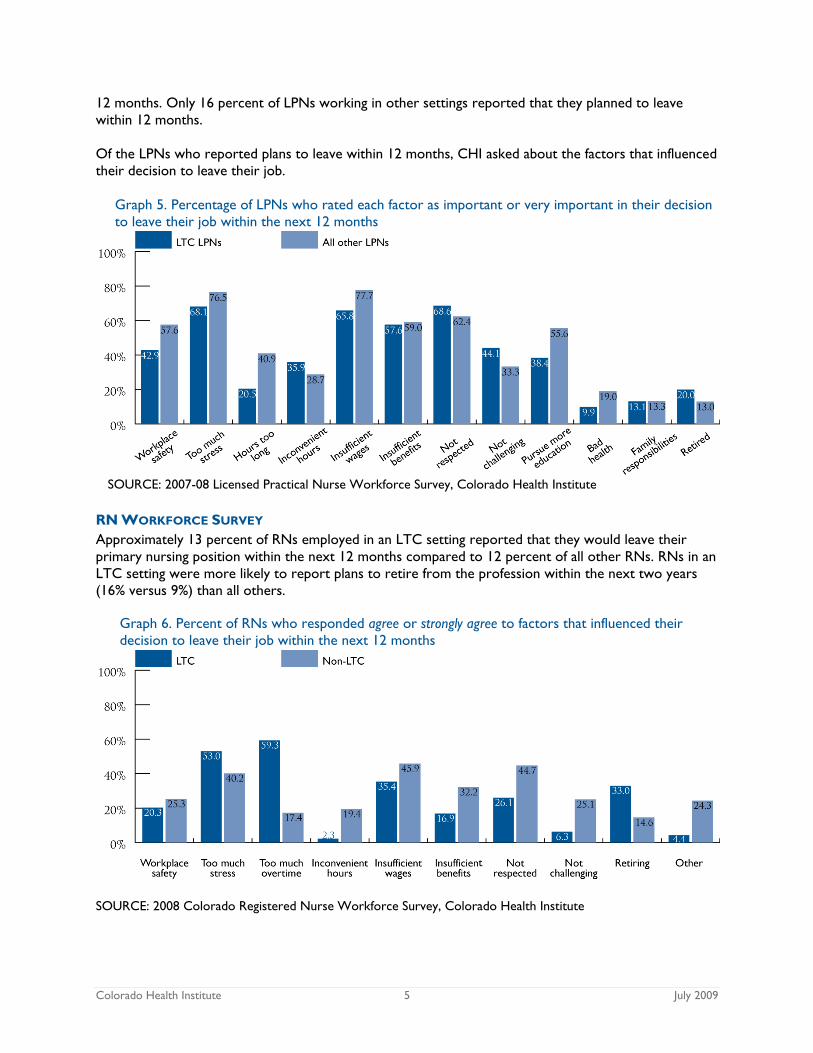
Of the LPNs who reported plans to leave within 12 months, CHI asked about the factors that influenced
their decision to leave their job.
Graph 5. Percentage of LPNs who rated each factor as important or very important in their decision
to leave their job within the next 12 months
SOURCE: 2007-08 Licensed Practical Nurse Workforce Survey, Colorado Health Institute
RN WORKFORCE SURVEY
Approximately 13 percent of RNs employed in an LTC setting reported that they would leave their
primary nursing position within the next 12 months compared to 12 percent of all other RNs. RNs in an
LTC setting were more likely to report plans to retire from the profession within the next two years
(16% versus 9%) than all others.
Graph 6. Percent of RNs who responded agree or strongly agree to factors that influenced their
decision to leave their job within the next 12 months
SOURCE: 2008 Colorado Registered Nurse Workforce Survey, Colorado Health Institute
t
Colorado Health Institute 6 July 2009
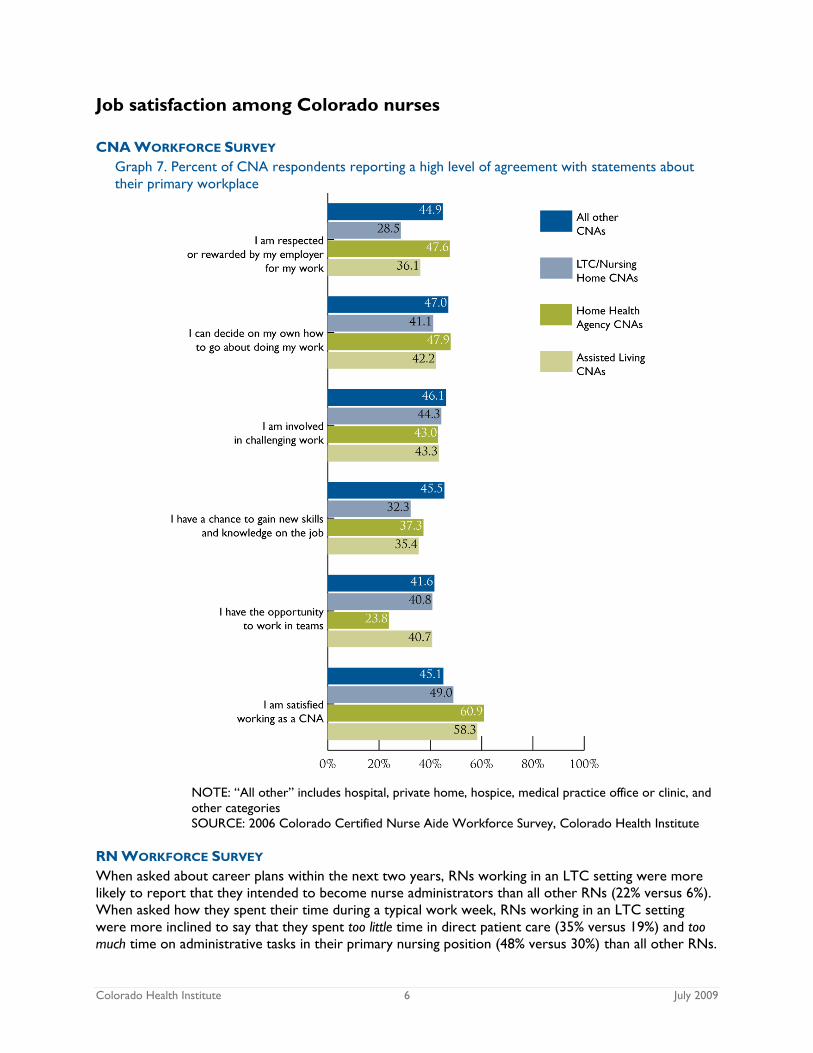
Job satisfaction among Colorado nurses
CNA WORKFORCE SURVEY
Graph 7. Percent of CNA respondents reporting a high level of agreement with statements about
their primary workplace
NOTE: ―All other‖ includes hospital, private home, hospice, medical practice office or clinic, and
other categories
SOURCE: 2006 Colorado Certified Nurse Aide Workforce Survey, Colorado Health Institute
RN WORKFORCE SURVEY
When asked about career plans within the next two years, RNs working in an LTC setting were more
likely to report that they intended to become nurse administrators than all other RNs (22% versus 6%).
When asked how they spent their time during a typical work week, RNs working in an LTC setting
were more inclined to say that they spent too little time in direct patient care (35% versus 19%) and too
much time on administrative tasks in their primary nursing position (48% versus 30%) than all other RNs.
Colorado Health Institute 7 July 2009
In addition, RNs working in LTC reported having much more supervisor support as well as spending
much more time in daily meetings regarding quality improvement or patient safety.
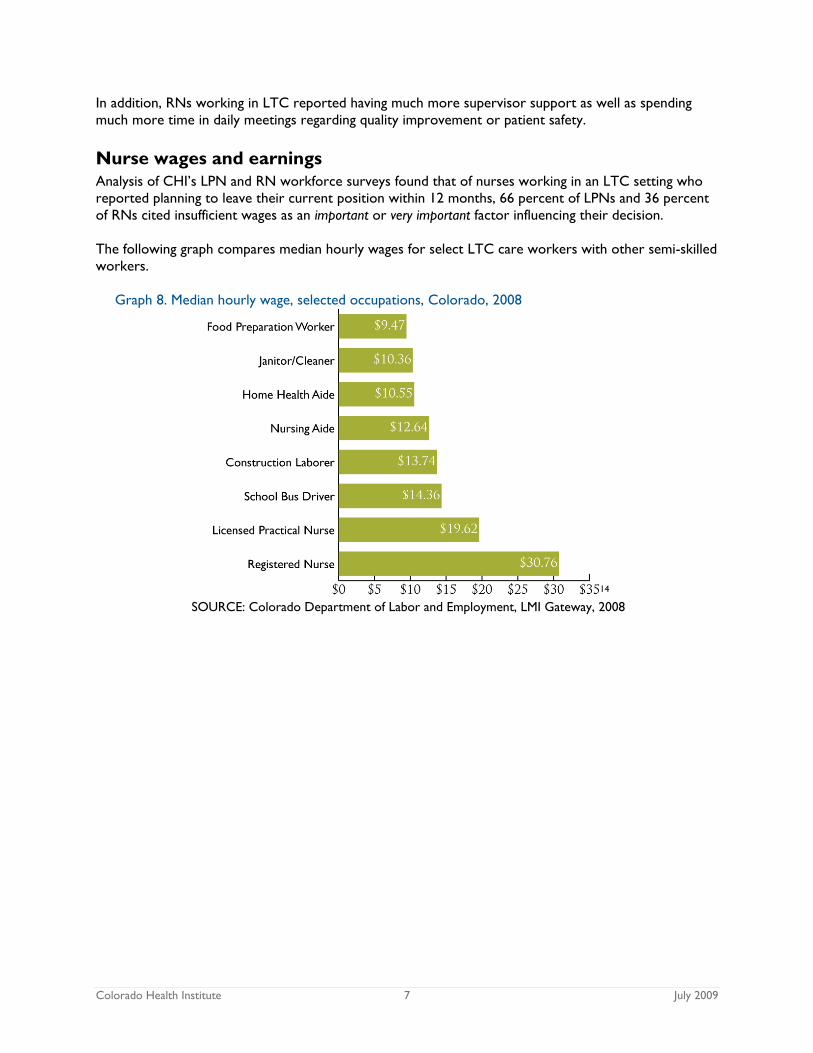
Nurse wages and earnings
Analysis of CHI’s LPN and RN workforce surveys found that of nurses working in an LTC setting who
reported planning to leave their current position within 12 months, 66 percent of LPNs and 36 percent
of RNs cited insufficient wages as an important or very important factor influencing their decision.
The following graph compares median hourly wages for select LTC care workers with other semi-skilled
workers.
Graph 8. Median hourly wage, selected occupations, Colorado, 2008
14 SOURCE: Colorado Department of Labor and Employment, LMI Gateway, 2008
Colorado Health Institute 8 July 2009
CNA WORKFORCE SURVEY
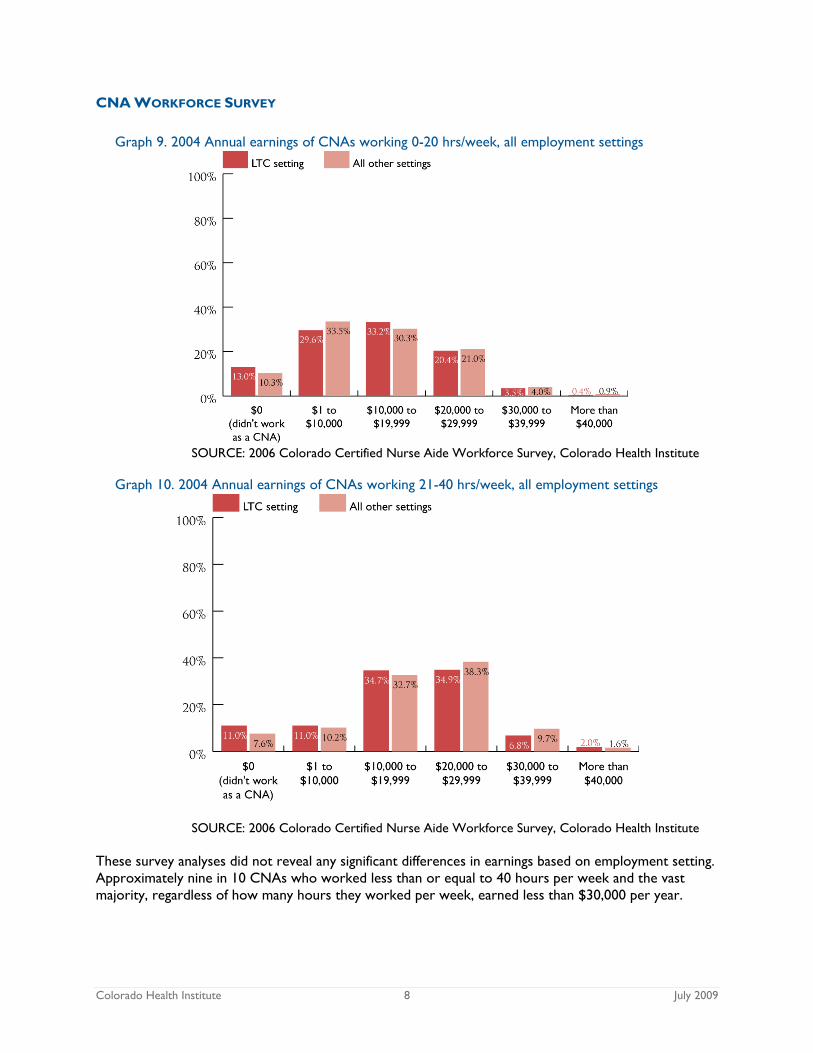
Graph 9. 2004 Annual earnings of CNAs working 0-20 hrs/week, all employment settings
SOURCE: 2006 Colorado Certified Nurse Aide Workforce Survey, Colorado Health Institute
Graph 10. 2004 Annual earnings of CNAs working 21-40 hrs/week, all employment settings
SOURCE: 2006 Colorado Certified Nurse Aide Workforce Survey, Colorado Health Institute
These survey analyses did not reveal any significant differences in earnings based on employment setting.
Approximately nine in 10 CNAs who worked less than or equal to 40 hours per week and the vast
majority, regardless of how many hours they worked per week, earned less than $30,000 per year.
Colorado Health Institute 9 July 2009
LPN WORKFORCE SURVEY
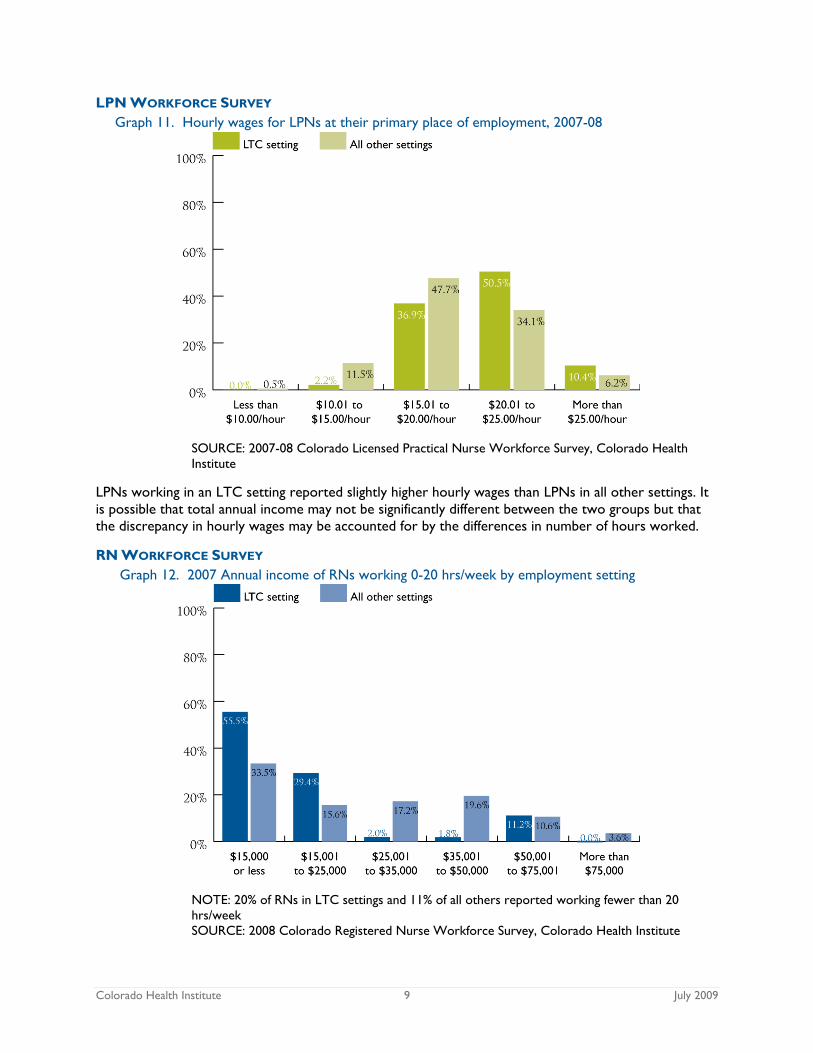
Graph 11. Hourly wages for LPNs at their primary place of employment, 2007-08
SOURCE: 2007-08 Colorado Licensed Practical Nurse Workforce Survey, Colorado Health
Institute
LPNs working in an LTC setting reported slightly higher hourly wages than LPNs in all other settings. It
is possible that total annual income may not be significantly different between the two groups but that
the discrepancy in hourly wages may be accounted for by the differences in number of hours worked.
RN WORKFORCE SURVEY
Graph 12. 2007 Annual income of RNs working 0-20 hrs/week by employment setting
NOTE: 20% of RNs in LTC settings and 11% of all others reported working fewer than 20
hrs/week
SOURCE: 2008 Colorado Registered Nurse Workforce Survey, Colorado Health Institute
Colorado Health Institute 10 July 2009
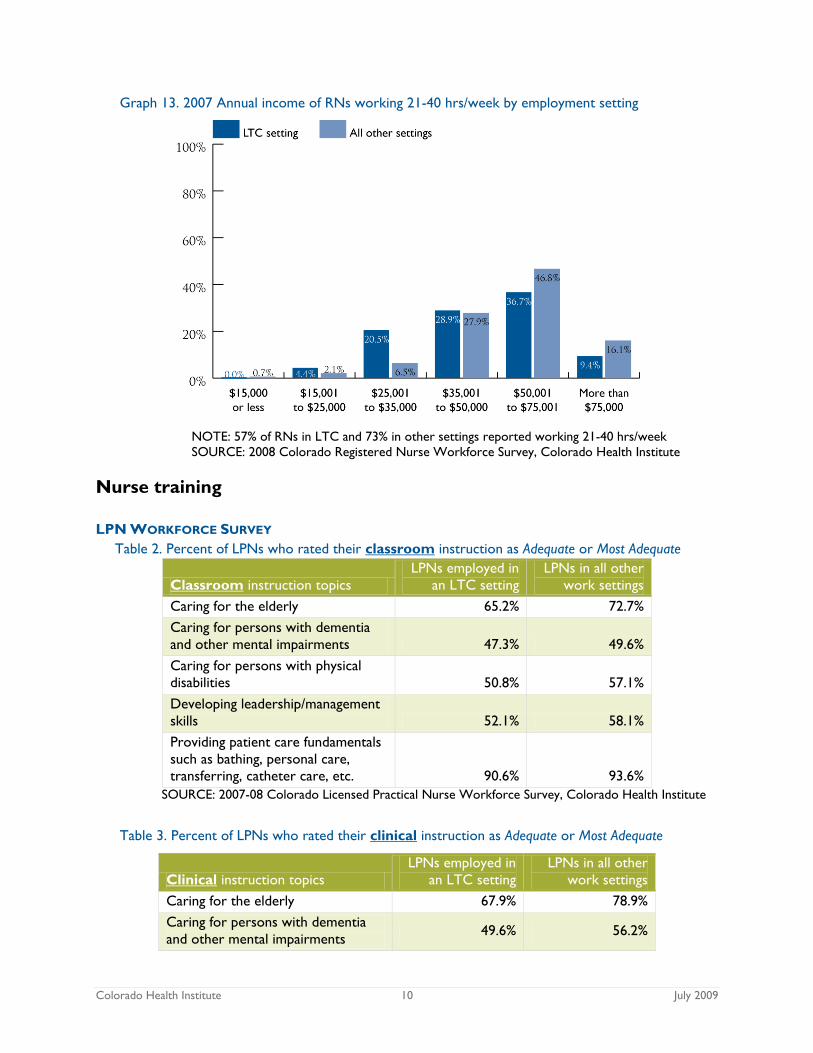
Graph 13. 2007 Annual income of RNs working 21-40 hrs/week by employment setting
NOTE: 57% of RNs in LTC and 73% in other settings reported working 21-40 hrs/week
SOURCE: 2008 Colorado Registered Nurse Workforce Survey, Colorado Health Institute
Nurse training
LPN WORKFORCE SURVEY
Table 2. Percent of LPNs who rated their classroom instruction as Adequate or Most Adequate
Classroom instruction topics
LPNs employed in
an LTC setting
LPNs in all other
work settings
Caring for the elderly 65.2% 72.7%
Caring for persons with dementia
and other mental impairments 47.3% 49.6%
Caring for persons with physical
disabilities 50.8% 57.1%
Developing leadership/management
skills 52.1% 58.1%
Providing patient care fundamentals
such as bathing, personal care,
transferring, catheter care, etc. 90.6% 93.6%
SOURCE: 2007-08 Colorado Licensed Practical Nurse Workforce Survey, Colorado Health Institute
Table 3. Percent of LPNs who rated their clinical instruction as Adequate or Most Adequate
Clinical instruction topics
LPNs employed in
an LTC setting
LPNs in all other
work settings
Caring for the elderly 67.9% 78.9%
Caring for persons with dementia
and other mental impairments 49.6% 56.2%

Colorado Health Institute 11 July 2009
Caring for persons with physical
disabilities 53.3% 58.9%
Developing leadership/management
skills 51.4% 59.8%
Providing patient care fundamentals
such as bathing, personal care,
transferring, catheter care, etc.
87.3% 94.7%
SOURCE: 2007-08 Colorado Licensed Practical Nurse Workforce Survey, Colorado Health Institute
LPNs employed in an LTC setting were more likely to report being interested in additional on-the-job
training resulting in a certificate of program completion than LPNs in other work settings—79 percent
expressed interest in additional training in geriatrics and 77 percent in training about Alzheimer’s disease
and/or other types of mental disorders. In contrast, slightly more than half of LPNs working in other
settings reported an interest in additional training in geriatrics and Alzheimer’s disease.
RN WORKFORCE SURVEY
Table 4 . Percent of RNs who reported their classroom instruction as Good or Excellent
Classroom instruction topics
RNs employed in
an LTC setting
RNs employed
in all other
settings
Caring for the elderly 55.4% 63.0%
Caring for persons with dementia and other mental
impairments 52.9% 50.4%
Caring for persons with physical disabilities 51.4% 45.5%
Caring for persons with behavioral problems 48.4% 51.3%
Administration of meds/treatments 94.6% 88.6%
Developing patient assessment skills 81.9% 85.9%
Using critical thinking/problem solving skills 82.6% 79.6%
SOURCE: 2008 Colorado Registered Nurse Workforce Survey, Colorado Health Institute
Table 5. Percent of RNs who reported their clinical instruction as Good or Excellent
Clinical instruction topics
RNs employed in
an LTC setting
RNs employed
in all other
settings
Clinical rotation in a nursing home 37.5% 40.3%
Clinical rotation in a psych/behavioral health setting 67.5% 69.1%
Understanding the RN role on interdisciplinary care team 70.0% 66.8%
SOURCE: 2008 Colorado Registered Nurse Workforce Survey, Colorado Health Institute
Colorado Health Institute 12 July 2009
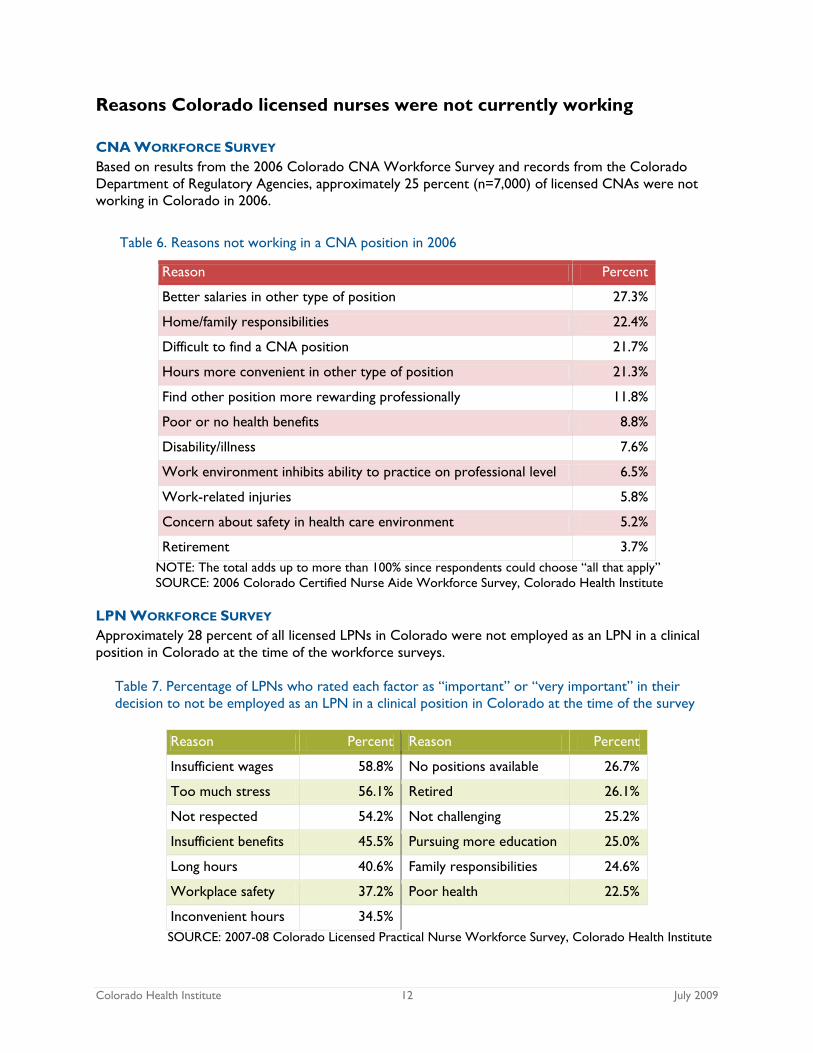
Reasons Colorado licensed nurses were not currently working
CNA WORKFORCE SURVEY
Based on results from the 2006 Colorado CNA Workforce Survey and records from the Colorado
Department of Regulatory Agencies, approximately 25 percent (n=7,000) of licensed CNAs were not
working in Colorado in 2006.
Table 6. Reasons not working in a CNA position in 2006
Reason Percent
Better salaries in other type of position 27.3%
Home/family responsibilities 22.4%
Difficult to find a CNA position 21.7%
Hours more convenient in other type of position 21.3%
Find other position more rewarding professionally 11.8%
Poor or no health benefits 8.8%
Disability/illness 7.6%
Work environment inhibits ability to practice on professional level 6.5%
Work-related injuries 5.8%
Concern about safety in health care environment 5.2%
Retirement 3.7%
NOTE: The total adds up to more than 100% since respondents could choose ―all that apply‖
SOURCE: 2006 Colorado Certified Nurse Aide Workforce Survey, Colorado Health Institute
LPN WORKFORCE SURVEY
Approximately 28 percent of all licensed LPNs in Colorado were not employed as an LPN in a clinical
position in Colorado at the time of the workforce surveys.
Table 7. Percentage of LPNs who rated each factor as ―important‖ or ―very important‖ in their
decision to not be employed as an LPN in a clinical position in Colorado at the time of the survey
Reason Percent Reason Percent
Insufficient wages 58.8% No positions available 26.7%
Too much stress 56.1% Retired 26.1%
Not respected 54.2% Not challenging 25.2%
Insufficient benefits 45.5% Pursuing more education 25.0%
Long hours 40.6% Family responsibilities 24.6%
Workplace safety 37.2% Poor health 22.5%
Inconvenient hours 34.5%
SOURCE: 2007-08 Colorado Licensed Practical Nurse Workforce Survey, Colorado Health Institute
Colorado Health Institute 13 July 2009
About the data used in this chart pack
CHI’s Health Professions Database Project is an initiative designed to help address Colorado’s health
care workforce shortages by collecting, analyzing and disseminating workforce data. To that end, CHI
has conducted a series of workforce surveys of various health professionals. Unless otherwise stated,
data used in this section come from the results of these surveys.
CNA WORKFORCE SURVEY
CHI conducted a survey of certified nursing assistants (CNAs) in January 2006 by including a
questionnaire with certification renewal forms sent to more than 29,000 CNAs in Colorado. The survey
response rate of 35 percent represented more than 10,000 completed surveys. For results of the CNA
survey, please see the findings at:
http://www.coloradohealthinstitute.org/Documents/workforce/2006_CNAfindings.pdf.
LPN WORKFORCE SURVEY
In 2007-08, CHI surveyed a random, stratified sample of 2,500 licensed practical nurses (LPNs) in
Colorado to create a baseline of information about the state’s LPN workforce. Approximately 40
percent (n=1,002) completed the survey. For results, please see the survey findings at:
http://www.coloradohealthinstitute.org/Documents/workforce/2007_LPN_findings.pdf.
RN WORKFORCE SURVEY
In 2008, CHI surveyed registered nurses (RNs) in Colorado about practice and training issues related to
the nursing workforce. Out of an eligible sample of 2,835 who received the survey, 1,457 (51%)
responded. The 2008 survey is a follow-up to CHI’s 2005 survey of RNs whose license was subject to
renewal. For results of the RN survey, please visit:
http://www.coloradohealthinstitute.org/resourceHotissues/workforce_RN.htm.
Additional information about the Health Professions Workforce Project is available at:
www.coloradohealthinstitute.org/workforce.
1 Colorado Department of Labor and Employment. LMI Gateway: Occupational Employment & Projections. Retrieved
June 18, 2009, from http://lmigateway.coworkforce.com/lmigateway/default.asp. 2 Castle, N. (2006). ―Measuring staff turnover in nursing homes.‖ The Gerontologist, 46(2): 210–219. 3 Cohen-Mansfield, J. (1997). ―Management of verbally disruptive behaviors in nursing home residents.‖ Journal of
Gerontology: Medical Sciences, 52(A): M369–M377. 4 Harrington, C., et al. (2000). ―Experts recommend minimum nurse staffing standards for nursing facilities in the
United States.‖ The Gerontologist, 40(1): 5–16. 5 Stone, R., and J. Weiner. (2001). Who Will Care for Us? Addressing the Long-term Care Workforce Crisis. Retrieved
June 29, 2009 from http://www.urban.org/UploadedPDF/Who_will_Care_for_Us.pdf. 6 No recent Colorado-specific data on turnover in the direct-care workforce were available at this time. 7 Stone, R., and J. Weiner. 8 Cohen-Mansfield, J. (1997). ―Turnover among nursing home staff: A review.‖ Nursing Management, 28(5): 59-64. 9 Stone, R. et al. (2003). Why Workforce Development Should Be Part of the Long-term Care Quality Debate.
Washington, DC: American Association of Homes and Services for the Aging. 10 Dawson, S., and R. Surpin. (2001). ―Direct-care health workers: You get what you pay for.‖ Generations, 25(1):
Spring 23–28. 11 Barry, T., et al. (2008). ―Measuring worker turnover in long-term care: Lessons from the Better Jobs Better Care
Demonstration.‖ The Gerontologist, 48(3): 394-400. 12 Bowers, B., et al. (2003). ―Turnover reinterpreted: CNAs talk about why they leave.‖ Journal of Gerontological
Nursing, 29(3): 36–43.

Colorado Health Institute 14 July 2009
13 Seavey, D. (2004). The Cost of Frontline Turnover in Long-term Care. Washington, DC: American Association of
Homes and Services for the Aging. 14 Colorado Department of Labor and Employment. LMI Gateway: Occupational Employment Statistics Survey.
Retrieved June 18, 2009, from http://lmigateway.coworkforce.com/lmigateway/default.asp.