Overview of The CMO Survey · 2019-02-26 · Founded in August 2008, The CMO Survey is administered...
56
Transcript of Overview of The CMO Survey · 2019-02-26 · Founded in August 2008, The CMO Survey is administered...


Overview of The CMO Survey®
About The CMO Survey
Mission
To collect and disseminate the opinions of top marketers in order to predict the future of markets,
track marketing excellence, and improve the value of marketing in firms and society. The survey
is an objective source of information about marketing and a non-commercial service dedicated to
improving the field of marketing.
Administration
Founded in August 2008, The CMO Survey is administered twice a year. Questions repeat to
observe trends over time and new questions are added to tap into marketing trends. The February
2019 survey is the 22st administration of The CMO Survey.
Sponsors
CMO Survey Sponsors include the American Marketing Association, Deloitte LLP, and Duke
University’s Fuqua School of Business. Sponsors support The CMO Survey with intellectual and
financial resources. Survey data and participant lists are held in confidence and not provided to
survey sponsors or any other parties.
The February 2019 CMO Survey
Survey sample
The sample of 2556 top marketers at U.S. for-profit companies: 323 responded for a 12.6%
response rate; 97% of respondents were VP-level or above.
Survey administration
The survey was in field from January 8-29, 2019. It was administered via email with four follow-
up reminders.
Available reports
This Topline Report offers an aggregate view of survey results. Two other reports are available at
cmosurvey.org/results.
Highlights and Insights Report shares key metrics over time
Report of Results by Firm and Industry Characteristics offers results by sectors, size, and
Internet sales

Table of Contents
Topic 1: Marketplace Dynamics
Overall Economy
1 Are you more or less optimistic about the U.S. economy compared to last quarter?
2 Rate your optimism about the U.S. economy on a scale from 0-100 with 0 being the least optimistic.
Customers
3 Rank your customers’ top three priorities (1, 2, 3) over the next 12 months.
4 Do you expect the following customer outcomes to change in the next 12 months?
Partners
5 Does your firm use channel partners or go directly to market?
6 Do you expect the following partner outcomes to change in the next 12 months?
Topic 2: Firm Growth Strategies 7 Allocate 100 points to reflect your firm’s spending on growth strategies during the prior 12 months.
8 What percent of your marketing budget do you spend on domestic markets?
9 What percentage of your firm’s sales is domestic?
10 Which international market is currently your largest (in terms of sales)?
11 Which international market that you are currently not in is your biggest opportunity for the future?
12 What percentage of your firm’s sales is through the internet?
Topic 3: Marketing Spending
13 By what percent has your overall marketing spending changed in the prior 12 months?
14 What is your company’s percentage change in marketing spending during the next 12 months?
15 What is your company's percentage change in spending during the next 12 months in each specific
marketing area?
16 By what percent has your spending on each type of marketing knowledge changed in the prior 12 months?
17 What percent of your marketing budget is currently devoted to training and development?
Topic 4: Firm Performance
18 Rate your firm's financial and market performance during the last 12 months.
19 Overall, how would you rate your company’s marketing excellence?
Topic 5: Social Media Marketing
20 What percent of your marketing budget do you spend on social media?
21 What percent of social media activities are performed by outside agencies?
22 To what degree has the use of social media contributed to your company’s performance?
23 How does your firm use social media?
24 How is your paid digital media allocation across the following channels?
Topic 6: Mobile Marketing
25 What percent of your marketing budget do you spend on mobile activities?
26 To what degree has the use of mobile marketing contributed to your company’s performance?
Topic 7: Marketing Jobs
27 By what percentage will your firm’s marketing hires change in the next year?
28 For your marketing hiring, what types of employees do you plan to hire in the next year?
29 How often will you acquire marketing talent from these sources?
30 By what percentage will your firm’s outsourcing of marketing activities change in the next year?
31 How many employees/marketing employees are in your company?

Topic 8: Marketing Organization 32 Rate the quality of your company’s marketing knowledge resources
Topic 9: Marketing Leadership
33 What is marketing primarily responsible for in your firm? 34 What are your top challenges as a marketing leader? 35 How well is your role as a marketing leader defined in your company? 36 Most companies have their own “language of the C-suite” that is vital to driving business results.
Considering the language of your own company’s C-suite, which of the following marketing leadership
activities do you find challenging to implement on a regular basis?
37 Does your current CEO have experience as a marketer? 38 How likely is a marketer to become a CEO in your company? 39 How does your marketing leader’s compensation breakdown across the following categories? 40 Do you believe it is appropriate for your brand to take a stance on politically-charged issues?
Topic 10: Marketing Analytics
41 What percent of your marketing budget do you spend on marketing analytics?
42 In what percent of projects does your company use marketing analytics before a decision is made?
43 To what degree has the use of marketing analytics contributed to your company’s performance?
44 Which best describes how your company shows the long-term impact of marketing spend on your
business?
45 In what percent of the time do you perform experiments to understand the impact of your marketing
actions on customers?
46 To what extent is your company implementing artificial intelligence or machine learning into its
marketing toolkit?
47 How is your company using artificial intelligence in its marketing activities?
Topic 11: The CMO Survey Award for Marketing Excellence
48 Which company across all industries sets the standard for excellence in marketing? Overall Winner
49 Which company in your industry sets the standard for excellence in marketing? Industry Winners
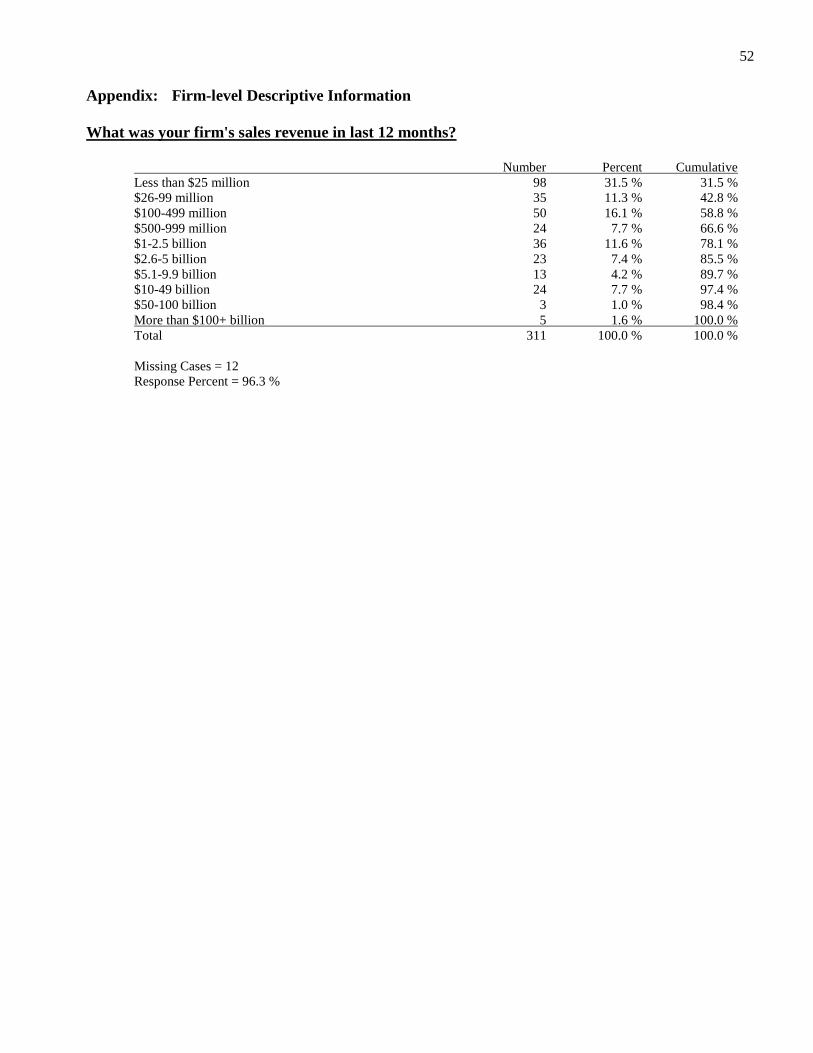
Appendix: Firm-level Descriptive Information
50 Which is your firm’s primary economic sector?
51 What is your firm’s primary industry sector?
52 What was your firm's sales revenue in last 12 months?

1
Topic 1: Marketplace Dynamics - Overall Economy
Are you more or less optimistic about the U.S. economy compared to last quarter?
Number Percent 95% CI
3=More 34 20.1 % ± 3.4 %
2=No Change 40 23.7 % ± 3.6 %
1=Less 95 56.2 % ± 5.0 %
Total 169 100.0 %
Mean = 1.64
SD = 0.80
Missing Cases = 154
Response Percent = 52.3 %

2
Topic 1: Marketplace Dynamics - Overall Economy
Rate your optimism about the U.S. economy on a scale from 0-100 with 0 being the least
optimistic.
Minimum = 16.38
Maximum = 97.12
Mean = 57.00
Median = 60
Standard Deviation (Unbiased Estimate) = 19.86
95 Percent Confidence Interval Around the Mean = 53.98 - 60.02
Valid Cases = 166
Missing Cases = 157
Response Percent = 51.4%

3
Topic 1: Marketplace Dynamics - Customers
For this market, rank your customers' top three priorities (1, 2, 3) over the next 12 months, where
1 is most important.
(N=164)
Mean & SD 1st Priority 2nd Priority 3rd Priority Total
1.95 35 15 31 81
Low price 0.91 21.3% 9.1% 18.9% 49.4%
2.04 36 33 40 109
Superior product quality 0.84 22.0% 20.1% 24.4% 66.5%
1.77 24 17 12 53
Superior innovation 0.80 14.6% 10.4% 7.3% 32.3%
1.98 34 60 31 125
Excellent service 0.72 20.7% 36.6% 18.9% 76.2%
2.12 35 39 50 124
Trusting relationship 0.82 21.3% 23.8% 30.5% 75.6%

4
Topic 1: Marketplace Dynamics - Customers
Do you expect the following customer outcomes in the next 12 months?
(N=323)
Mean
SD
Increase
+1
No
Change
0
Decrease
-1
Total
Customer’s purchase volume
0.59
0.64
107
67.3%
39
24.5%
13
8.2%
159
100.0%
Customer’s price per unit
0.29
0.72
72
45.0%
63
39.4%
25
15.6%
160
100.0%
Customer will buy related
products/services from my firm
0.67
0.50
111
68.5%
49
30.2%
2
1.2%
162
100.0%
My firm’s ability to retain
current customers
0.40
0.70
84
52.2%
57
35.4%
20
12.4%
161
100.0%
The entry of new customers into
this market
0.32
0.66
68
42.2%
76
47.2%
17
10.6%
161
100.0%
My firm’s ability to acquire new
customers
0.66
0.58
115
71.9%
36
22.5%
9
5.6%
160
100.0%

5
Topic 1: Marketplace Dynamics - Partners
Will you use a channel or go directly to market?
Number Percent 95% CI
Uses channel partners 239 74.0 % ± 4.8 %
Does not use channel partners 84 26.0 % ± 4.8 %
Total 323 100.0 %
Missing Cases = 0
Response Percent = 100.0 %

6
Topic 1: Marketplace Dynamics - Partners
Do you expect the following channel partner outcomes for your firm to increase, decrease, or have
no change in the next 12 months?
(N=239)
Mean
SD
Increase
+1
No
Change
0
Decrease
-1
Total
Partner’s purchase volume
0.61
0.66
52
70.3%
15
20.3%
7
9.5%
74
100.0%
Partner will buy related products/services
from my firm
0.48
0.60
39
53.4%
30
41.1%
4
5.5%
73
100.0%
Partner’s price per unit
0.26
0.66
28
37.8%
37
50.0%
9
12.2%
74
100.0%
My firm will sell directly to end
customers, not through channel partners
0.25
0.70
30
40.0%
34
45.3%
11
14.7%
75
100.0%
Partner’s level of power in our
relationship
0.04
0.62
16
21.3%
46
61.3%
13
17.3%
75
100.0%

7
Topic 2: Firm Growth Strategies
Allocate 100 points to reflect your firm's spending in each of the four growth strategies during the
prior 12 months.
Mean SD 95% CI Median Minimum Maximum Total
Existing products/services in existing markets 55.1 31.1 50.3 - 59.9 65 0 100 158
New products/services in existing markets 21.8 21.1 18.5 - 25.1 20 0 100 158
Existing products/services in new markets 13.5 15.3 11.1 - 15.9 10 0 75 158
New products/services in new markets 9.6 14.2 7.4 - 11.8 5 0 100 158

8
Topic 2: Firm Growth Strategies
What percent of your marketing budget do you spend on domestic markets?
Minimum = 36.41
Maximum = 100
Mean = 86.99
Median = 99
Standard Deviation (Unbiased Estimate) = 19.98
95 Percent Confidence Interval Around the Mean = 83.93 - 90.05
Valid Cases = 164
Missing Cases = 159
Response Percent = 50.8%

9
Topic 2: Firm Growth Strategies
What percentage of your firm's sales is domestic?
Minimum = 32.07
Maximum = 100
Mean = 83.91
Median = 95
Standard Deviation (Unbiased Estimate) = 21.87
95 Percent Confidence Interval Around the Mean = 80.55 - 87.26
Valid Cases = 163
Missing Cases = 160
Response Percent = 50.5%

10
Topic 2: Firm Growth Strategies
Which international market is currently your largest (in terms of sales)?*
Number Percent 95% CI
Western Europe 27 34.6 % ± 10.6 %
Canada 15 19.2 % ± 8.8 %
China 10 12.8 % ± 7.4 %
Middle East 4 5.1 % ± 4.9 %
South American countries besides Brazil 4 5.1 % ± 4.9 %
Australia/New Zealand 4 5.1 % ± 4.9 %
Mexico 3 3.8 % ± 4.3 %
Northern Europe 3 3.8 % ± 4.3 %
Japan 2 2.6 % ± 3.5 %
Indonesia and Southeast Asia 2 2.6 % ± 3.5 %
Central America 2 2.6 % ± 3.5 %
Russia 1 1.3 % ± 2.5 %
Brazil 1 1.3 % ± 2.5 %
Total 78 100.0 %
Missing Cases = 2
Response Percent = 97.5 %
* Responses from firms that have at least 1% of total sales from international markets and allocate at least 1% of
total marketing budgets to international markets.

11
Topic 2: Firm Growth Strategies
Which international market that you are currently not in is your biggest opportunity for the
future?*
Number Percent 95% CI
China 18 21.7 % ± 8.0 %
Western Europe 12 14.5 % ± 6.8 %
Brazil 8 9.6 % ± 5.7 %
India 7 8.4 % ± 5.4 %
Northern Europe 5 6.0 % ± 4.6 %
Middle East 5 6.0 % ± 4.6 %
Mexico 5 6.0 % ± 4.6 %
Indonesia and Southeast Asia 4 4.8 % ± 4.1 %
South American countries besides Brazil 4 4.8 % ± 4.1 %
Korea 4 4.8 % ± 4.1 %
Central America 3 3.6 % ± 3.6 %
South Africa 2 2.4 % ± 3.0 %
Australia/New Zealand 1 1.2 % ± 2.1 %
Russia 1 1.2 % ± 2.1 %
Eastern Europe 1 1.2 % ± 2.1 %
Canada 1 1.2 % ± 2.1 %
Taiwan 1 1.2 % ± 2.1 %
Japan 1 1.2 % ± 2.1 %
Total 83 100.0 %
Missing Cases = 12
Response Percent = 87.4 %
* Responses from firms allocate at least 1% of total marketing budgets to international markets.

12
Topic 2: Firm Growth Strategies
What percentage of your firm's sales are through the internet?
Minimum = 0
Maximum = 56.63
Mean = 9.93
Median = 1
Standard Deviation (Unbiased Estimate) = 17.17
95 Percent Confidence Interval Around the Mean = 8.01 - 11.85
Valid Cases = 307
Missing Cases = 16
Response Percent = 95.0%

13
Topic 3: Marketing Spending
By what percent has your overall marketing spending changed in the prior 12 months?
Minimum = -43.08
Maximum = 54.90
Mean = 4.99
Median = 1
Standard Deviation (Unbiased Estimate) = 17.01
95 Percent Confidence Interval Around the Mean = 2.53 - 7.46
Valid Cases = 183
Missing Cases = 140
Response Percent = 56.7%

14
Topic 3: Marketing Spending
Relative to the prior 12 months, note your company's percentage change in marketing spending
during the next 12 months in each area.
Minimum = -31.16
Maximum = 49.26
Mean = 8.32
Median = 5
Standard Deviation (Unbiased Estimate) = 14.90
95 Percent Confidence Interval Around the Mean = 6.12 - 10.52
Valid Cases = 176
Missing Cases = 147
Response Percent = 54.5%

15
Topic 3: Marketing Spending
Relative to the prior 12 months, note your company's percentage change in spending during the
next 12 months in each marketing specific area.
Mean SD 95% CI Median Minimum Maximum Total
Digital marketing spending 14.3 17.9 11.5 - 17.0 10 -31.7 62.3 163
Traditional advertising spending -1.8 14.3 -4.0 - 0.4 0 -44.9 42.1 159
Brand building 9.3 15.6 6.8 - 11.7 5 -34.8 54.9 158
Customer relationship management 9.2 12.5 7.3 - 11.2 5 -15 45.5 155
New product introductions 7.7 13.4 5.6 - 9.8 5 -32.7 49.4 158
New service introductions 6.6 12.2 4.7 - 8.5 0.5 -32.1 47 157

16
Topic 3: Marketing Spending
By what percent has your spending on each type of marketing knowledge changed in the prior 12
months? Be sure to report the level and direction of the change. (e.g., 10%, 0%, -5%)
Minimum Maximum Mean Median SD 95% CI
Marketing training -25.5% 32.9% 3.44% 0 8.41 2.08 - 4.80
Marketing research and intelligence -32.2% 49.7% 7.71% 2.50 14.91 5.33-10.09
Marketing consulting services -39.1% 60.3% 8.67% 3 18.28 5.78-11.56
Developing new marketing knowledge and
capabilities
-15 51.1% 10.36% 5 14.50 8.06-12.67

17
Topic 3: Marketing Spending
What percent of your marketing budget is currently devoted to training and development?
Minimum = 0
Maximum = 23.06
Mean = 4.74
Median = 3
Standard Deviation (Unbiased Estimate) = 5.28
95 Percent Confidence Interval Around the Mean = 3.95 - 5.53
Valid Cases = 171
Missing Cases = 152
Response Percent = 52.9%

18
Topic 4: Firm Performance
Rate your firm's performance during the last 12 months
Mean SD 95% CI Median Total
Market share 3.0 4.4 2.3 - 3.7 3 164
Sales revenue 4.5 5.8 3.6 - 5.4 5 161
Marketing ROI 3.7 4.6 3.0 - 4.4 3 158
Profits 4.2 5.5 3.3 - 5.0 5 158
Customer acquisition 3.8 4.7 3.0 - 4.5 3 156
Customer retention 2.1 4.5 1.4 - 2.8 1 158
Brand value 3.8 4.2 3.1 - 4.4 3 156

19
Topic 4: Firm Performance
Overall, how would you rate your company's marketing excellence?
Number Percent 95% CI
7=Excellent - one of the best in the world 16 9.1 % ± 2.4 %
6=A leader but not one of the best 31 17.6 % ± 3.2 %
5=Strong 49 27.8 % ± 3.9 %
4=Good 45 25.6 % ± 3.8 %
3=Fair 23 13.1 % ± 2.8 %
2=Weak 8 4.5 % ± 1.7 %
1=Very weak 4 2.3 % ± 1.2 %
Total 176 100.0 %
Mean = 4.61
SD = 1.40
Missing Cases = 147
Response Percent = 54.5 %

20
Topic 5: Social Media
What percent of your marketing budget do you spend on social media?
Mean SD 95% CI Median Total
...of your marketing budget do you currently spend on social media? 11.4 11.8 9.9 - 13.0 5.5 227
...will you spend in the next 12 months? 13.6 13.3 11.9 - 15.4 10 226
...do you predict you will spend in five years? 19.7 16.6 17.5 - 21.9 15 225

21
Topic 5: Social Media
What percent of your company's social media activities are currently performed by outside
agencies?
Minimum = 0
Maximum = 87.23
Mean = 23.00
Median = 5
Standard Deviation (Unbiased Estimate) = 30.42
95 Percent Confidence Interval Around the Mean = 19.06 - 26.94
Valid Cases = 229
Missing Cases = 94
Response Percent = 70.9%

22
Topic 5: Social Media
To what degree has the use of social media contributed to your company's performance?
Number Percent 95% CI
1=Not At All 41 16.6 % ± 3.7 %
2= 56 22.7 % ± 4.2 %
3= 37 15.0 % ± 3.5 %
4= 48 19.4 % ± 3.9 %
5= 43 17.4 % ± 3.7 %
6= 17 6.9 % ± 2.5 %
7=Very Highly 5 2.0 % ± 1.4 %
Total 247 100.0 %
Mean = 3.27
SD = 1.63
Missing Cases = 76
Response Percent = 76.5 %

23
Topic 5: Social Media
How does your firm use social media? (Check all that apply)
Number Percent 95% CI
Brand awareness and brand-building 210 88.2 % ± 4.1 %
Introducing new products and services 154 64.7 % ± 6.1 %
Acquiring new customers 143 60.1 % ± 6.3 %
Brand promotions, such as contests, coupons 141 59.2 % ± 6.3 %
Retaining current customers 132 55.5 % ± 6.4 %
Improving customer service 97 40.8 % ± 6.3 %
Improving employee engagement 84 35.3 % ± 6.1 %
Marketing research 80 33.6 % ± 6.0 %
Identifying new customer groups we currently don't target 61 25.6 % ± 5.6 %
Identifying new product and service opportunities 41 17.2 % ± 4.8 %
Improving current products or services 33 13.9 % ± 4.4 %
Total 1176
Number of Cases = 238
Number of Responses = 1176
Average Number of Responses Per Case = 4.9

24
Topic 5: Social Media
How is your paid digital media allocated across the following channels?
Mean SD 95%CI Median Min Max
Paid other 31.4 37.9 23.6 - 39.2 10 0 100
Paid search (all engines) 27.6 27.6 22.0 - 33.3 21 0 100
Paid display (including
programmatic) 16.4 20.4 12.3 - 20.6 10 0 100
Paid social 14.0 17.2 10.5 - 17.5 10 0 100
Paid video (including
programmatic, full episode players 7.2 9.7 5.2 - 9.2 4 0 50

25
Topic 6: Mobile Marketing
What percent of your marketing budget do you spend on mobile activities?
Mean SD 95% CI Median Minimum Maximum
What percent of your marketing budget do you
currently spend on mobile activities? 11.2 14.1 9.4 - 13.0 5 0 46.5
What percent will you spend on mobile activities
in five years? 19.1 18.9 16.6 - 21.6 10 0 62.1

26
Topic 6: Mobile Marketing
To what degree has the use of mobile marketing contributed to your company's performance?
Number Percent 95% CI
1=Not At All 76 31.9 % ± 4.7 %
2= 36 15.1 % ± 3.5 %
3= 32 13.4 % ± 3.3 %
4= 36 15.1 % ± 3.5 %
5= 35 14.7 % ± 3.4 %
6= 17 7.1 % ± 2.5 %
7=Very Highly 6 2.5 % ± 1.5 %
Total 238 100.0 %
Mean = 2.97
SD = 1.80
Missing Cases = 85
Response Percent = 73.7 %

27
Topic 7: Marketing Jobs
Compared to the number of marketing hires last year, by what percentage will your firm’s
marketing hires change in the next year?
Minimum = -35.53
Maximum = 48.67
Mean = 5.12
Median = 0
Standard Deviation (Unbiased Estimate) = 14.32
95 Percent Confidence Interval Around the Mean = 2.92 - 7.31
Valid Cases = 163
Missing Cases = 160
Response Percent = 50.5%

28
Topic 7: Marketing Jobs
For your marketing hiring, distribute 100 points across these different types of employees you
plan to hire in the next year.
Mean SD 95% CI Median Minimum Maximum
Full-time employees 80.0 27.0 73.4 - 86.6 90 0 100
Part-time independent subcontractors 8.7 20.6 3.7 - 13.7 0 0 100
Full-time independent subcontractors 5.2 10.6 2.6 - 7.8 0 0 50
Part-time employees 3.0 6.5 1.5 - 4.6 0 0 30

29
Topic 7: Marketing Jobs
Distributing 100 points, how often will you acquire marketing talent from these sources?
Mean SD 95% CI Median Minimum Maximum
From companies in other industries 34.9 31.8 27.3 - 42.4 30 0 100
From competitors in your industry 26.9 30.0 19.8 - 34.1 20 0 100
From within your company 23.4 29.6 16.3 - 30.4 10 0 100
From undergraduate programs in universities 7.8 16.9 3.8 - 11.9 0 0 100
From Master's or above programs in universities 5.6 11.1 3.0 - 8.2 0 0 60

30
Topic 7: Marketing Jobs
By what percentage will your firm's outsourcing of marketing activities change in the next year?
Minimum = -31.23
Maximum = 38.62
Mean = 3.87
Median = 0
Standard Deviation (Unbiased Estimate) = 12.12
95 Percent Confidence Interval Around the Mean = 2.00 - 5.73
Valid Cases = 162
Missing Cases = 161
Response Percent = 50.2%

31
Topic 7: Marketing Jobs
How many employees/marketing employees are in your company?
Mean SD 95% CI Median Minimum Maximum Total
Number of employees 4022 9751 2502 - 5543 500 0 55921 158
Number of marketing employees 65 193 35 - 95 10 0 1465 159

32
Topic 8: Marketing Organization
Rate the quality of your company’s marketing knowledge resources:
(N=323)
Mean Poor Excellent Total
SD 1 2 3 4 5 6 7
4.72 11 5 21 35 44 38 24 178
Customer insights 1.61 6.2% 2.8% 11.8% 19.7% 24.7% 21.3% 13.5% 100.0%
4.41 7 14 22 44 51 30 11 179
Competitive intelligence 1.46 3.9% 7.8% 12.3% 24.6% 28.5% 16.8% 6.1% 100.0%
3.20 34 28 30 50 28 7 1 178
Marketing training 1.50 19.1% 15.7% 16.9% 28.1% 15.7% 3.9% 0.6% 100.0%
4.02 12 20 29 52 34 19 12 178
Marketing research 1.57 6.7% 11.2% 16.3% 29.2% 19.1% 10.7% 6.7% 100.0%
4.04 15 23 25 45 31 27 13 179
Marketing analytics 1.69 8.4% 12.8% 14.0% 25.1% 17.3% 15.1% 7.3% 100.0%
4.81 6 7 19 34 43 55 14 178
Marketing capabilities 1.45 3.4% 3.9% 10.7% 19.1% 24.2% 30.9% 7.9% 100.0%

33
Topic 9: Marketing Leadership
What is marketing primarily responsible for in your firm?
Number Percent 95% CI
Brand 180 90.9 % ± 4.0 %
Digital marketing 165 83.3 % ± 5.2 %
Advertising 159 80.3 % ± 5.6 %
Social media 153 77.3 % ± 5.9 %
Positioning 142 71.7 % ± 6.3 %
Promotion 142 71.7 % ± 6.3 %
Marketing analytics 142 71.7 % ± 6.3 %
Marketing research 138 69.7 % ± 6.5 %
Lead generation 129 65.2 % ± 6.7 %
Public relations 120 60.6 % ± 6.9 %
Insight 107 54.0 % ± 7.0 %
Competitive intelligence 103 52.0 % ± 7.0 %
Revenue growth 86 43.4 % ± 7.0 %
Customer experience 84 42.4 % ± 6.9 %
Innovation 65 32.8 % ± 6.6 %
Market entry strategies 64 32.3 % ± 6.6 %
e-commerce 63 31.8 % ± 6.5 %
New products 62 31.3 % ± 6.5 %
Customer relationship management 62 31.3 % ± 6.5 %
Market selection 53 26.8 % ± 6.2 %
Pricing 51 25.8 % ± 6.1 %
Sales 49 24.7 % ± 6.1 %
Customer service 31 15.7 % ± 5.1 %
Distribution 14 7.1 % ± 3.6 %
Stock market performance 6 3.0 % ± 2.4 %
Total 2370
Number of Cases = 198
Number of Responses = 2370
Average Number of Responses Per Case = 12.0
Number 0f Cases with at least one Response = 198
Response Percent = 100.0 %

34
Topic 9: Marketing Leadership
What are your top challenges as a marketing leader? (Select top 3 where 1 is most important)
(N=277)
Mean &
SD 1 2 3 Total
Driving Growth
1.62
0.78
105
37.9%
46
16.6%
34
12.3%
185
66.8%
Securing marketing budget
1.80
0.88
37
13.4%
15
5.4%
22
7.9%
74
26.7%
Hiring top talent
1.96
0.82
27
9.7%
26
9.4%
24
8.7%
77
27.8%
Finding sponsorship/support
from the executive level
2.03
0.82
9
3.2%
10
3.6%
10
3.6%
29
10.5%
Delivering a powerful brand
that breaks through the clutter
2.06
0.78
38
13.7%
56
20.2%
46
16.6%
140
50.5%
Providing ROI of marketing
activities
2.09
0.75
30
10.8%
55
19.9%
41
14.8%
126
45.5%
Generating customer insight
2.19
0.77
14
5.1%
24
8.7%
26
9.4%
64
23.1%
Managing our online presence
2.39
0.79
7
2.5%
9
3.2%
22
7.9%
38
13.7%
Identifying the right
technologies to meet our needs
2.42
0.70
8
2.9%
22
7.9%
35
12.6%
65
23.5%
Training our team
2.45
0.62
2
0.7%
13
4.7%
16
5.8%
31
11.2%

35
Topic 9: Marketing Leadership
How well is your role as a marketing leader defined in your company?
Number Percent 95% CI
Ambiguous 41 14.2 % ± 3.7 %
Reasonably defined 141 48.8 % ± 5.4 %
Very clear 107 37.0 % ± 5.2 %
Total 289 100.0 %
Missing Cases = 34
Response Percent = 89.5 %

36
Topic 9: Marketing Leadership
Most companies have their own “language of the C-suite” that is vital to driving business results.
Considering the language of your own company’s C-suite, which of the following marketing
leadership activities do you find challenging to implement on a regular basis? (Check all that you
find challenging)
Number Percent 95% CI
Demonstrating the impact of marketing actions on
financial outcomes 176 63.8 % ± 5.7 %
Infusing the customer's point of view in business
decisions 109 39.5 % ± 5.8 %
Communicating the role of the brand in business
decisions 103 37.3 % ± 5.7 %
Linking marketing investments to important business
objectives 99 35.9 % ± 5.7 %
Securing cross-functional support for new marketing
investments 96 34.8 % ± 5.7 %
Using business terminology that resonates outside of the
marketing function 35 12.7 % ± 4.0 %
Total 618
Number of Cases = 276
Number of Responses = 618
Average Number of Responses Per Case = 2.2
Number of Cases with at least one Response = 276
Response Percent = 100.0 %

37
Topic 9: Marketing Leadership
Does your current CEO have experience as a marketer?
Number Percent 95% CI
Yes 70 35.9 % ± 4.5 %
No 125 64.1 % ± 5.4 %
Total 195 100.0 %
Missing Cases = 128
Response Percent = 60.4 %

38
Topic 9: Marketing Leadership
How likely is a marketer to become a CEO in your company?
Number Percent 95% CI
Never 29 14.9 % ± 3.1 %
Unlikely 94 48.2 % ± 5.0 %
Likely 48 24.6 % ± 3.9 %
Very Likely 24 12.3 % ± 2.9 %
Total 195 100.0 %
Missing Cases = 128
Response Percent = 60.4 %

39
Topic 9: Marketing Leadership
How does your marketing leader's total compensation breakdown across the following categories
(Sum to 100%):
Mean SD 95% CI Median Minimum Maximum
Salary 70.9% 20.2 67.6 - 74.1 75 0 100
Perfrormance Bonus 18.9% 14.3 16.6 - 21.2 20 0 100
Company Equity 8.2% 12.0 6.3 - 10.2 0 0 60
Other 2.0% 11.8 0.1 - 4.0 0 0 100

40
Topic 9: Marketing Leadership
Do you believe it is appropriate for your brand to take a stance on politically-charged issues?
Number Percent 95% CI
Yes 55 19.2 % ± 4.1 %
No 232 80.8 % ± 4.9 %
Total 287 100.0 %
Missing Cases = 36
Response Percent = 88.9 %

41
Topic 10: Marketing Analytics
What percent of your marketing budget do you spend on marketing analytics?
Mean SD 95% CI Median Minimum Maximum
...Do you currently spend on marketing analytics? 6.6 6.7 5.7 - 7.6 5 0 24.7
...Will you spend in on marketing analytics the next
three years? 11.3 10.5 9.9 - 12.8 10 0 41

42
Topic 10: Marketing Analytics
In what percent of projects does your company use available or requested marketing analytics
before a decision is made?
Minimum = 0
Maximum = 100
Mean = 43.45
Median = 50
Standard Deviation (Unbiased Estimate) = 34.95
95 Percent Confidence Interval Around the Mean = 38.65 - 48.24
Valid Cases = 204
Missing Cases = 119
Response Percent = 63.2%

43
Topic 10: Marketing Analytics
To what degree has the use of marketing analytics contributed to your company's performance?
Number Percent 95% CI
1=Not At All 27 12.9 % ± 3.0 %
2=2 28 13.4 % ± 3.1 %
3=3 23 11.0 % ± 2.8 %
4=4 35 16.7 % ± 3.4 %
5=5 43 20.6 % ± 3.7 %
6=6 32 15.3 % ± 3.3 %
7=Very Highly 21 10.0 % ± 2.7 %
Total 209 100.0 %
Mean = 4.05
SD = 1.88
Missing Cases = 114
Response Percent = 64.7 %

44
Topic 10: Marketing Analytics
Which best describes how your company shows the long-term impact of marketing spend on your
business?
Number Percent 95% CI
We prove the impact quantitatively 76 36.4 % ± 4.7 %
We have a good qualitative sense of the impact, but not a
quantitative impact 106 50.7 % ± 5.2 %
We haven't been able to show the impact yet 27 12.9 % ± 3.0 %
Total 209 100.0 %
Missing Cases = 114
Response Percent = 64.7 %

45
Topic 10: Marketing Analytics
In what percent of the time do you perform experiments to understand the impact of your
marketing actions on customers?
Minimum = 0
Maximum = 100
Mean = 31.93
Median = 25
Standard Deviation (Unbiased Estimate) = 26.78
95 Percent Confidence Interval Around the Mean = 28.22 - 35.63
Valid Cases = 201
Missing Cases = 122
Response Percent = 62.2%

46
Topic 10: Marketing Analytics
To what extent is your company implementing artificial intelligence or machine learning into its
marketing toolkit?
(N=323)
1=Not at 7=Very
Mean & SD all 2 3 4 5 6 Important Total
1 2 3 4 5 6 7
1.93 126 36 18 11 8 3 7 209
Currently 1.52 60.3% 17.2% 8.6% 5.3% 3.8% 1.4% 3.3% 100.0%
3.48 45 27 41 28 24 18 21 204
Next three years 1.96 22.1% 13.2% 20.1% 13.7% 11.8% 8.8% 10.3% 100.0%

47
Topic 10: Marketing Analytics
How is your company using artificial intelligence in its marketing activities? (Check all that apply)
Number Percent 95% CI
Content personalization 65 56.5 % ± 9.2 %
Predictive analytics for customer insights 65 56.5 % ± 9.2 %
Targeting decisions 57 49.6 % ± 9.3 %
Customer segmentation 47 40.9 % ± 9.1 %
Programmatic advertising and media buying (i.e., AI buys
ad space to target customer in real-time) 44 38.3 % ± 9.0 %
Improving marketing ROI by optimizing marketing
content and timing 39 33.9 % ± 8.8 %
Conversational AI for customer service (i.e., chatbots,
virtual assistants) 29 25.2 % ± 8.1 %
Next best offer 17 14.8 % ± 6.6 %
Augmented and virtual reality 12 10.4 % ± 5.7 %
Autonomous objects/systems (i.e., personal assistance
robots, delivery drones, self-driving cars) 3 2.6 % ± 3.0 %
Facial recognition and visual search 2 1.7 % ± 2.4 %
Biometrics also known as chipping (i.e., body or hand implants) 0 0.0 % ± 0.0 %
Total 380
Number of Cases = 115
Number of Responses = 380
Average Number of Responses Per Case = 3.3
Number 0f Cases with at least one Response = 115
Response Percent = 100.0 %

48
Topic 11: The CMO Survey Award for Marketing Excellence
Which company in your industry sets the standard for excellence in marketing? - Overall Winner
Apple, Inc.

49
Topic 11: The CMO Survey Award for Marketing Excellence
Which company across all industries sets the standard for excellence in marketing? - Industry-
Specific Winners
Retail: Amazon
Technology:
Microsoft, Adobe, and Salesforce
Consumer Packaged Goods:
Nike, Coca-Cola, Inc, and Proctor & Gamble

50
Appendix: Firm-level Descriptive Information
Which economic sector accounts for the majority of your company revenues?
Number Percent 95% CI
B2B - Product 116 36.1 % ± 5.3 %
B2B - Services 103 32.1 % ± 5.1 %
B2C - Product 48 15.0 % ± 3.9 %
B2C - Services 54 16.8 % ± 4.1 %
Total 321 100.0 %
Missing Cases = 2
Response Percent = 99.4 %

51
Appendix: Firm-level Descriptive Information
Which industry sector best describes your company? (Sorted by highest to lowest response)
Number Percent 95% CI
Technology [Software/Biotech] 48 14.9 % ± 3.9 %
Professional Services/Consulting 47 14.6 % ± 3.9 %
Manufacturing 37 11.5 % ± 3.5 %
Healthcare 32 9.9 % ± 3.3 %
Retail/Wholesale 32 9.9 % ± 3.3 %
Banking/Finance/Insurance 30 9.3 % ± 3.2 %
Consumer Packaged Goods 25 7.8 % ± 2.9 %
Communications/Media 23 7.1 % ± 2.8 %
Consumer Services 16 5.0 % ± 2.4 %
Transportation 11 3.4 % ± 2.0 %
Education 9 2.8 % ± 1.8 %
Mining/Construction 8 2.5 % ± 1.7 %
Energy 4 1.2 % ± 1.2 %
Total 322 100.0 %
Missing Cases = 1
Response Percent = 99.7 %
52
Appendix: Firm-level Descriptive Information
What was your firm's sales revenue in last 12 months?
Number Percent Cumulative
Less than $25 million 98 31.5 % 31.5 %
$26-99 million 35 11.3 % 42.8 %
$100-499 million 50 16.1 % 58.8 %
$500-999 million 24 7.7 % 66.6 %
$1-2.5 billion 36 11.6 % 78.1 %
$2.6-5 billion 23 7.4 % 85.5 %
$5.1-9.9 billion 13 4.2 % 89.7 %
$10-49 billion 24 7.7 % 97.4 %
$50-100 billion 3 1.0 % 98.4 %
More than $100+ billion 5 1.6 % 100.0 %
Total 311 100.0 % 100.0 %
Missing Cases = 12
Response Percent = 96.3 %