Overview of the AHRQ QI Toolkit for Hospitals Courtney Gidengil, MD MPH Peter Hussey, PhD RAND...
40
Overview of the AHRQ QI Toolkit for Hospitals Courtney Gidengil, MD MPH Peter Hussey, PhD RAND Corporation
-
Upload
bethany-lamb -
Category
Documents
-
view
221 -
download
2
Transcript of Overview of the AHRQ QI Toolkit for Hospitals Courtney Gidengil, MD MPH Peter Hussey, PhD RAND...

Overview of the AHRQ QI Toolkit for Hospitals
Courtney Gidengil, MD MPHPeter Hussey, PhDRAND Corporation

2
Overview
What is the toolkit? How was the toolkit developed? What tools are in the toolkit? how can
they be used for quality improvement at my hospital?

3
Set of tools that hospitals can use to help improve performance in quality and patient safety
The AHRQ Quality Indicators (QIs) – Inpatient Quality Indicators (IQIs)– Patient Safety Indicators (PSIs)
Targeted to wide range of hospitals– Independent or system-affiliated– Varying quality improvement experience
What Is the Toolkit?
4
Toolkit Development
Developed through the AHRQ ACTION program
RAND partnered with UHC to develop and test the toolkit
Applicable for hospitals with differing knowledge, skills, and needs
Serves as a “resource inventory” from which hospitals can select tools
Different audiences for each tool (e.g., quality officer, finance officer, programmer)
How Hospitals Can Use the Toolkit
5

6
What Are the Quality Indicators?
Inpatient Quality Indicators – 28 indicators of quality in four sets– Volume, counts (6)– Mortality for conditions, rates (7)– Mortality for procedures, rates (8)– Utilization, rates (7)
Patient Safety Indicators – – 17 indicators and a composite indicator– Screen for adverse events for inpatients– Expressed as rates
The Development Process
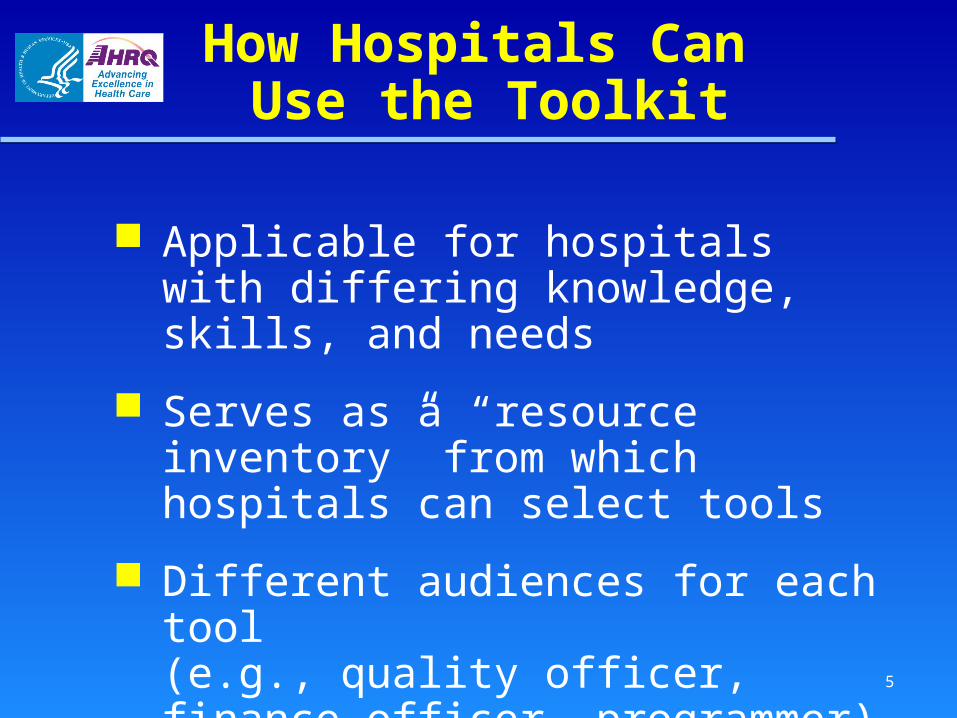
Toolkit version 1 – released in 2011– Developed “alpha” toolkit– Field tested and evaluated– Revised and published the toolkit
Toolkit version 2 – released in 2014– Added best practice forms for additional
indicators– Brought all tools up to date
7

Established principles to guide toolkit development
Reviewed literature to guide design Developed outline of toolkit based on
steps of a quality improvement process
Identified and developed specific tools for each step
Tool Development Steps
8

Technical Advisory Panel
9
Various skills and perspectives– Hospital experience– Quality improvement– Relevant research skills
Providing guidance throughout toolkit development– Toolkit design principles– Content of the tools

Parsimony in tool choice and design Target the most important factors
for implementation Provide tools that offer most value
for a range of hospitals Readily accessible content Enable hospitals to assess
effectiveness of their actions
Principles Guiding Toolkit Development
10
11
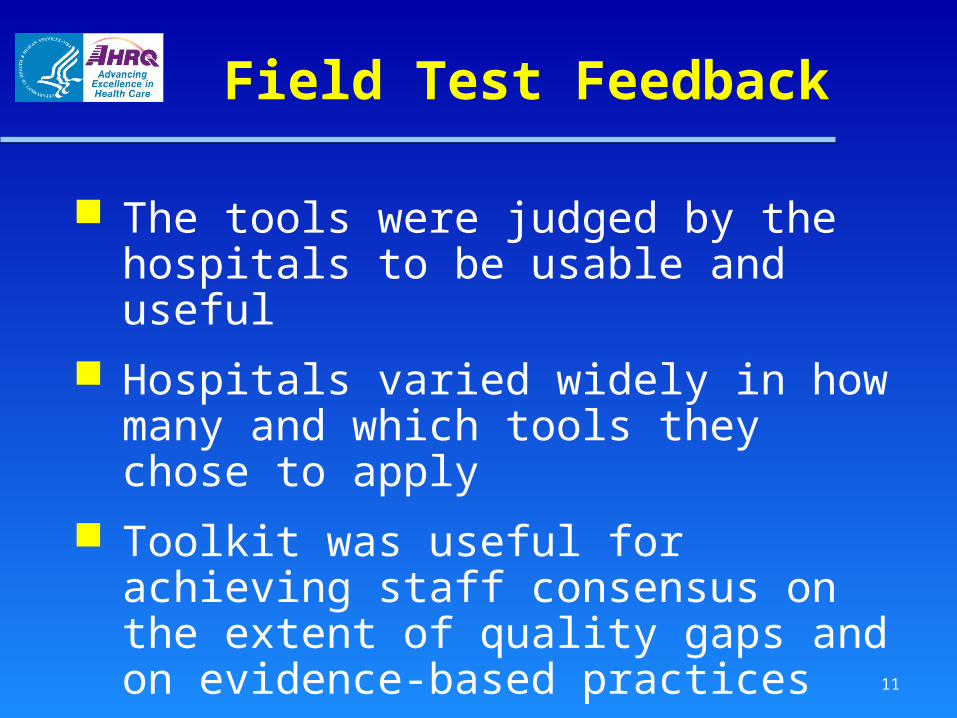
Field Test Feedback
The tools were judged by the hospitals to be usable and useful
Hospitals varied widely in how many and which tools they chose to apply
Toolkit was useful for achieving staff consensus on the extent of quality gaps and on evidence-based practices
12
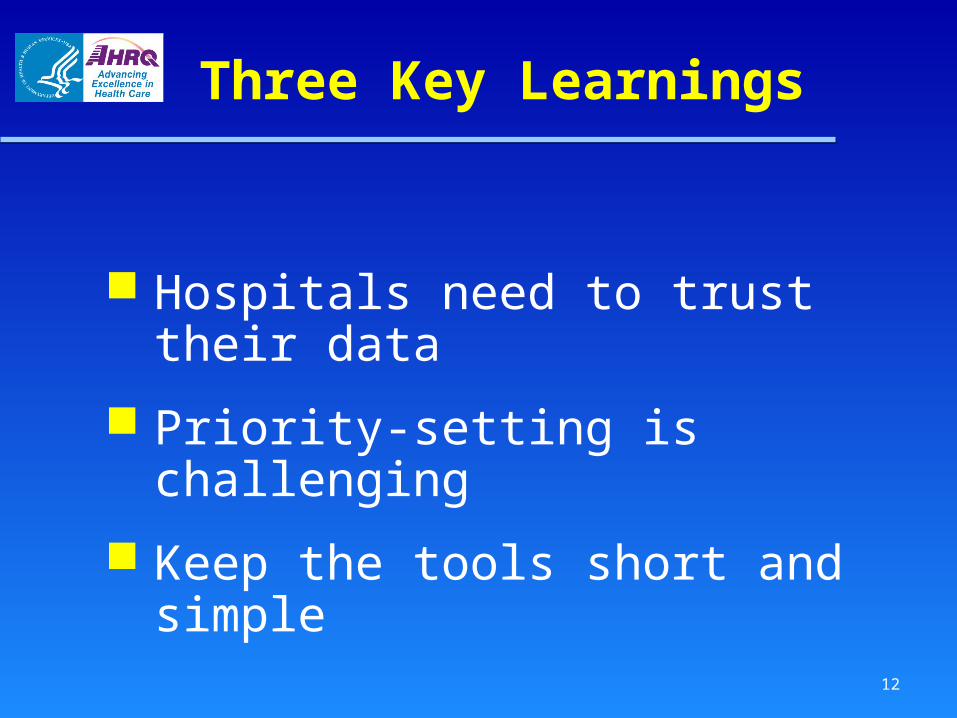
Three Key Learnings
Hospitals need to trust their data
Priority-setting is challenging
Keep the tools short and simple

13
Revised Toolkit To Address These Issues
Added a documentation and coding tool to improve PSI validity
Made prioritization matrix tools flexible so a hospital can tailor it with factors it considers in priority-setting
Simplified tools and instructions to increase usability

14
Next Steps
Developing a pediatric toolkit– Following similar development process,
with field test and evaluation Release planned in spring 2016

Structure of the Toolkit
Introduction and RoadmapA. Readiness to ChangeB. Applying QIs to the Hospital DataC. Identifying Priorities for Quality ImprovementD. Implementation MethodsE. Monitoring Progress and Sustainability
of ImprovementsF. Return-on-Investment AnalysisG. Existing Quality Improvement Resources
15

The Roadmap
A navigational guide through the toolkit
For each tool, it summarizes:– Action step being taken– Brief description of the tool– Key audience(s) to use the tool– Position with lead role responsibility
16
17
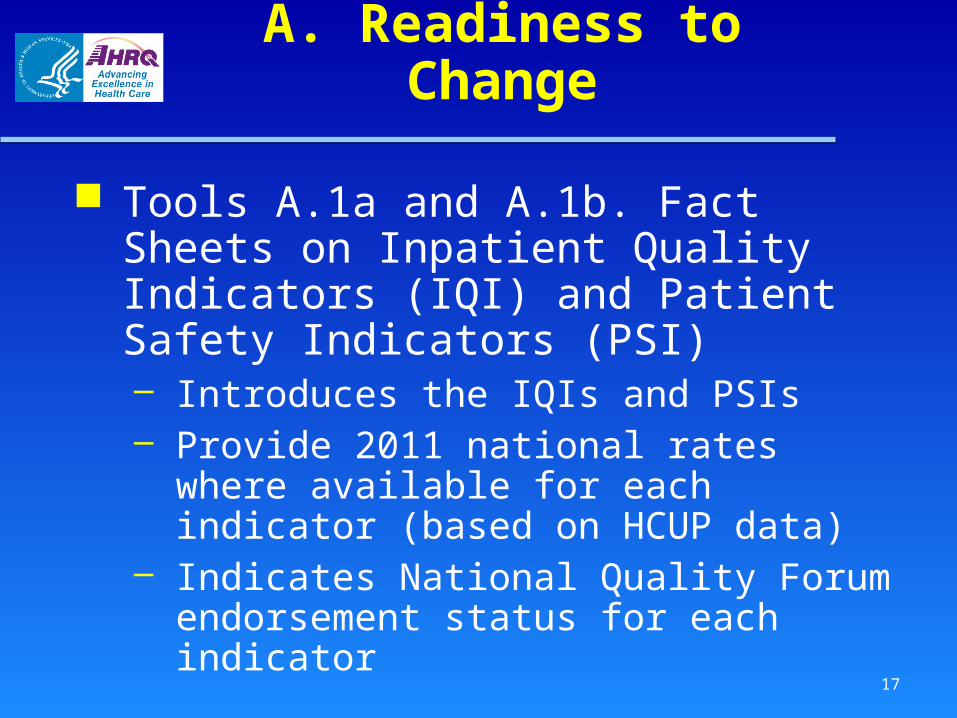
A. Readiness to Change
Tools A.1a and A.1b. Fact Sheets on Inpatient Quality Indicators (IQI) and Patient Safety Indicators (PSI)– Introduces the IQIs and PSIs– Provide 2011 national rates where
available for each indicator (based on HCUP data)
– Indicates National Quality Forum endorsement status for each indicator
18
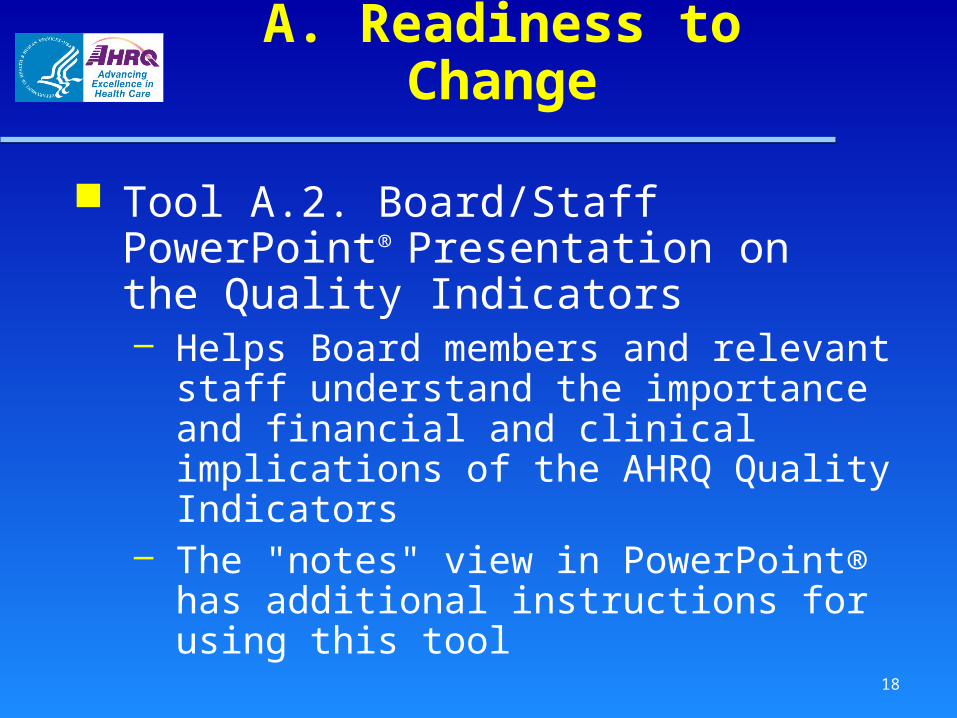
A. Readiness to Change
Tool A.2. Board/Staff PowerPoint®
Presentation on the Quality Indicators– Helps Board members and relevant staff
understand the importance and financial and clinical implications of the AHRQ Quality Indicators
– The "notes" view in PowerPoint® has additional instructions for using this tool

19
Tool A.2 Board/Staff PowerPoint® Presentation
20
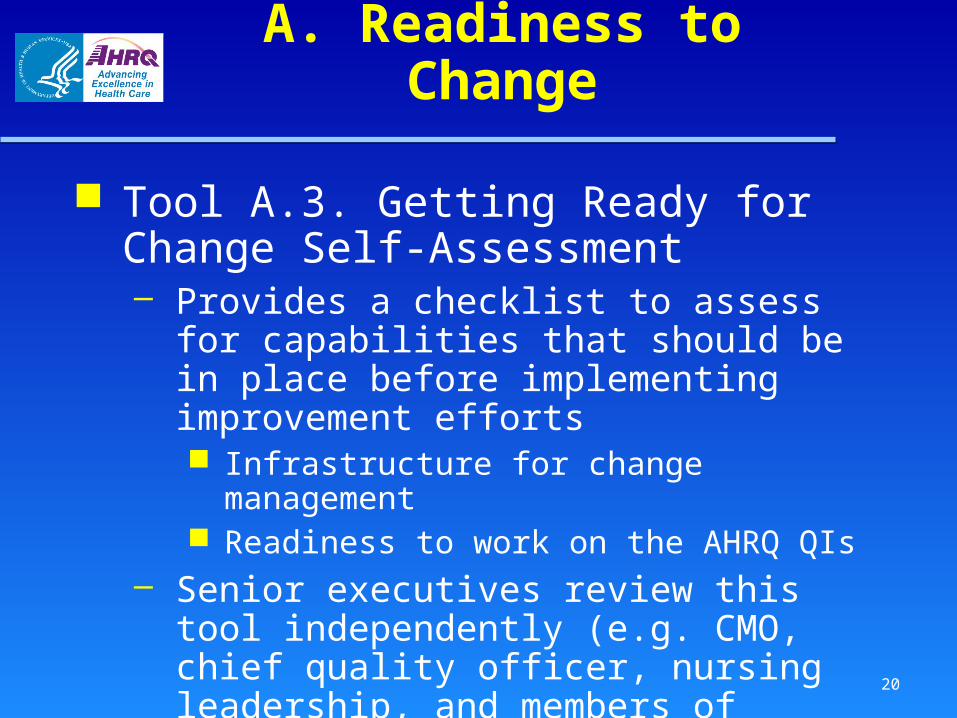
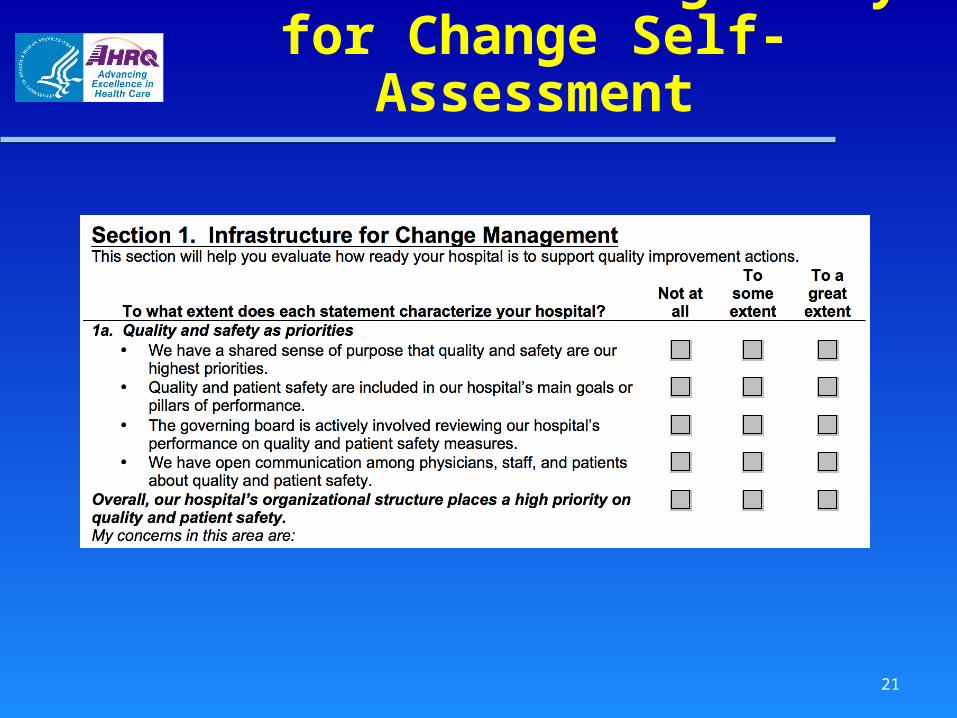
A. Readiness to Change
Tool A.3. Getting Ready for Change Self-Assessment– Provides a checklist to assess for
capabilities that should be in place before implementing improvement efforts Infrastructure for change management Readiness to work on the AHRQ QIs
– Senior executives review this tool independently (e.g. CMO, chief quality officer, nursing leadership, and members of hospital’s quality committee), then meet to discuss
21
Tool A.3. Getting Ready for Change Self-Assessment
22
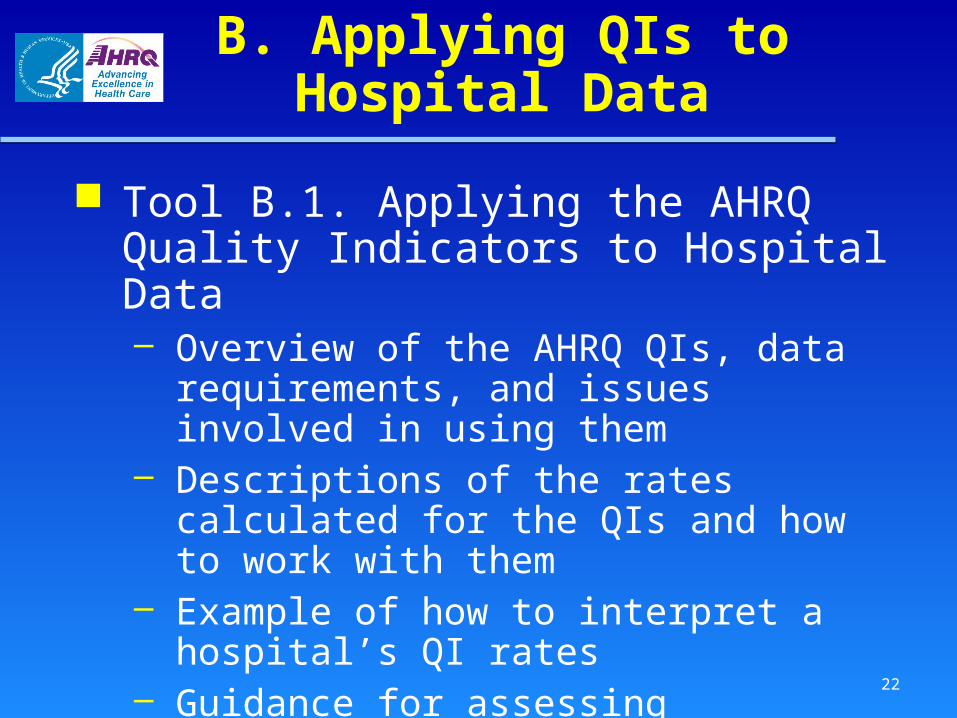
B. Applying QIs to Hospital Data
Tool B.1. Applying the AHRQ Quality Indicators to Hospital Data– Overview of the AHRQ QIs, data
requirements, and issues involved in using them
– Descriptions of the rates calculated for the QIs and how to work with them
– Example of how to interpret a hospital’s QI rates
– Guidance for assessing performance on the QIs (trends and benchmarking)
23
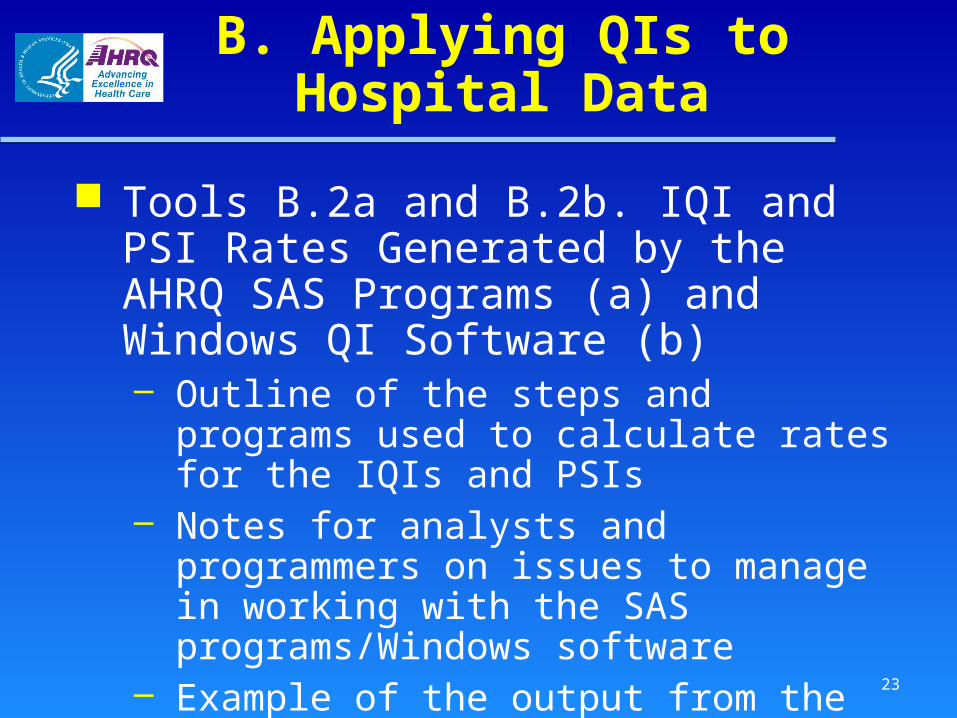
Tools B.2a and B.2b. IQI and PSI Rates Generated by the AHRQ SAS Programs (a) and Windows QI Software (b)– Outline of the steps and programs used to
calculate rates for the IQIs and PSIs – Notes for analysts and programmers on
issues to manage in working with the SAS programs/Windows software
– Example of the output from the SAS programs/Windows software for one hospital
B. Applying QIs to Hospital Data

24
Tool B.3a. Excel® Worksheets for Charts on Data, Trends, and Rates To Populate the PowerPoint® Presentation– Takes the rates for your hospital’s
performance on the AHRQ Quality Indicators (QIs) and displays them graphically
Tool B.3b. PowerPoint® Presentation: The AHRQ Quality Indicators, Results, and Discussion of Data Analysis– Provides a PowerPoint template for
presenting the results of your analysis
B. Applying QIs to Hospital Data
25
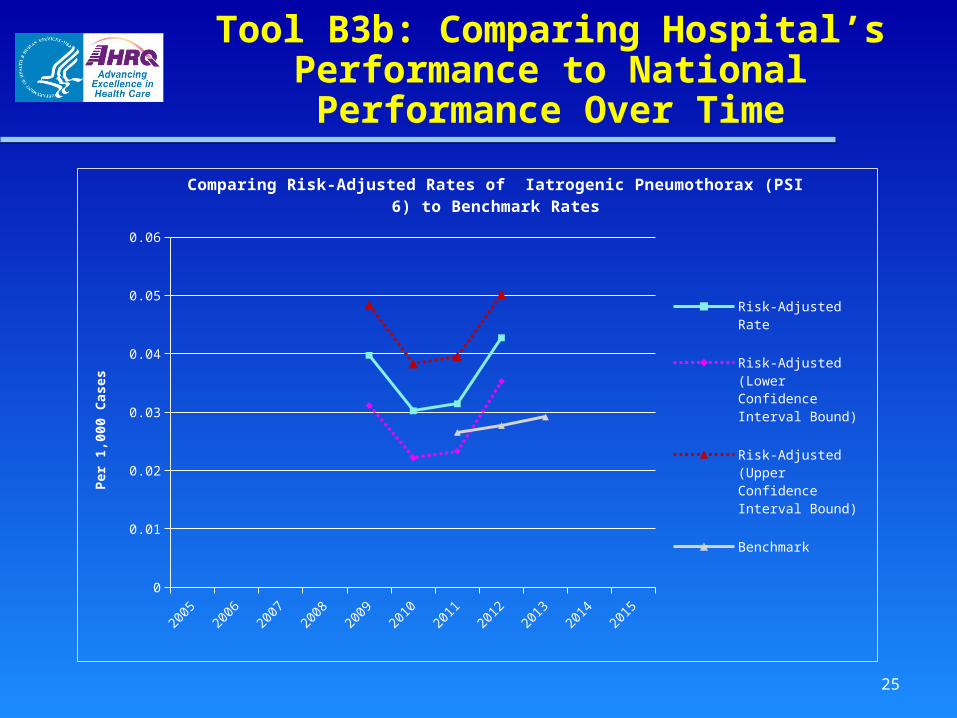
Tool B3b: Comparing Hospital’s Performance to National Performance
Over Time
2005
2006
2007
2008
2009
2010
2011
2012
2013
2014
2015
0
0.01
0.02
0.03
0.04
0.05
0.06
Comparing Risk-Adjusted Rates of Iatrogenic Pneumothorax (PSI 6) to Benchmark Rates
Risk-Adjusted Rate
Risk-Adjusted (Lower Confidence Interval Bound)
Risk-Adjusted (Upper Confidence Interval Bound)
Benchmark
Per
1,0
00 C
ases

26
Tool B.4. Documentation and Coding for Patient Safety Indicators– Designed to facilitate improvements to
documentation and coding processes to ensure that PSI rates are accurate Describes procedures to address problems
with documentation and coding practices Illustrates issues that can arise when
documenting and coding each PSI
B. Applying QIs to Hospital Data
27
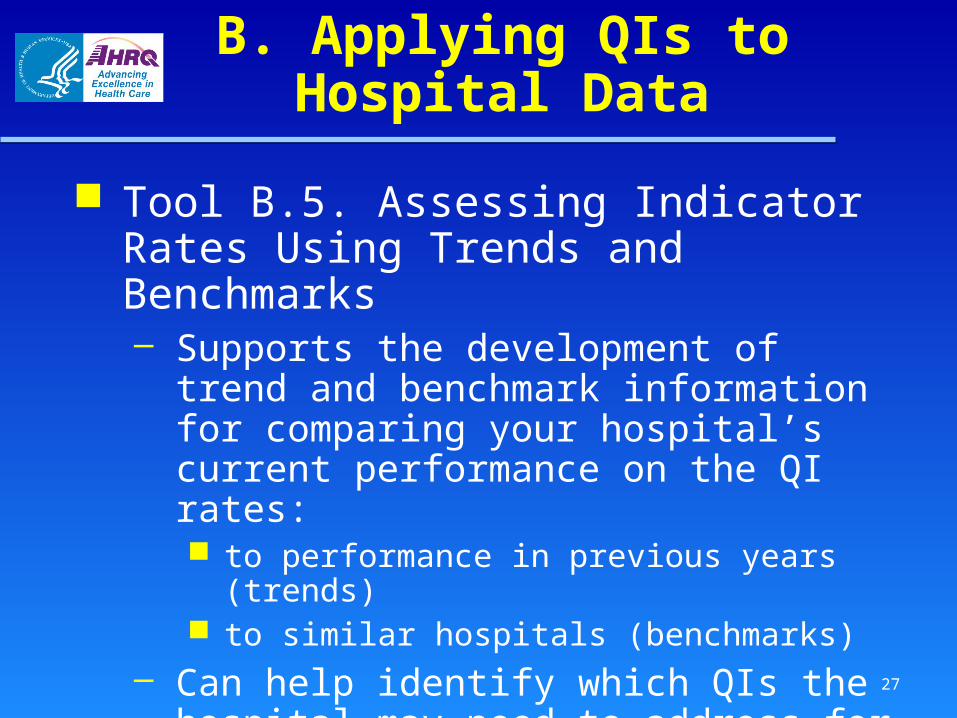
Tool B.5. Assessing Indicator Rates Using Trends and Benchmarks– Supports the development of trend and
benchmark information for comparing your hospital’s current performance on the QI rates: to performance in previous years (trends) to similar hospitals (benchmarks)
– Can help identify which QIs the hospital may need to address for quality improvement
B. Applying QIs to Hospital Data

C. Identifying Priorities for Quality Improvement
Tool C.1. Prioritization Matrix Tool C.2. Prioritization Matrix Example
28
29
D. Implementation Methods
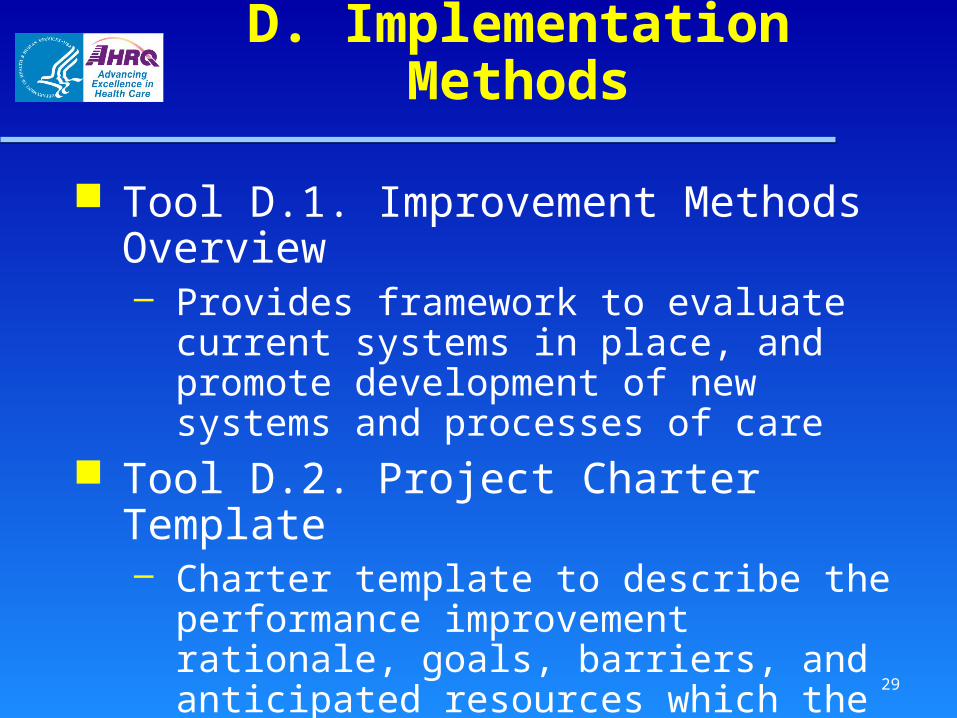
Tool D.1. Improvement Methods Overview– Provides framework to evaluate current
systems in place, and promote development of new systems and processes of care
Tool D.2. Project Charter Template– Charter template to describe the
performance improvement rationale, goals, barriers, and anticipated resources which the team will commit
30
D. Implementation Methods
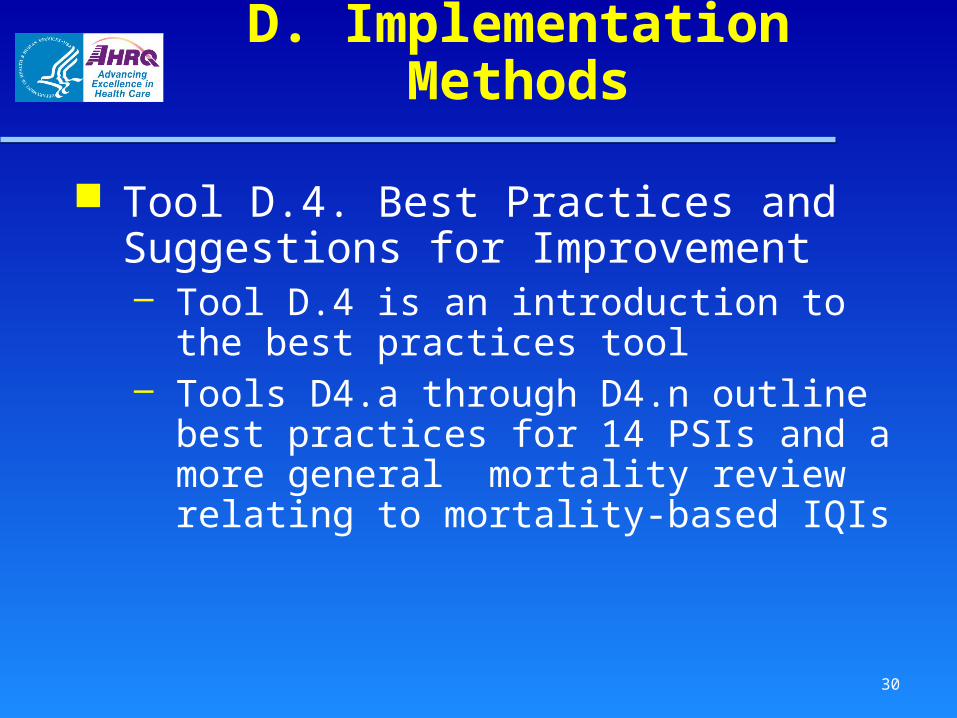
Tool D.4. Best Practices and Suggestions for Improvement– Tool D.4 is an introduction to the best
practices tool– Tools D4.a through D4.n outline best
practices for 14 PSIs and a more general mortality review relating to mortality-based IQIs

31
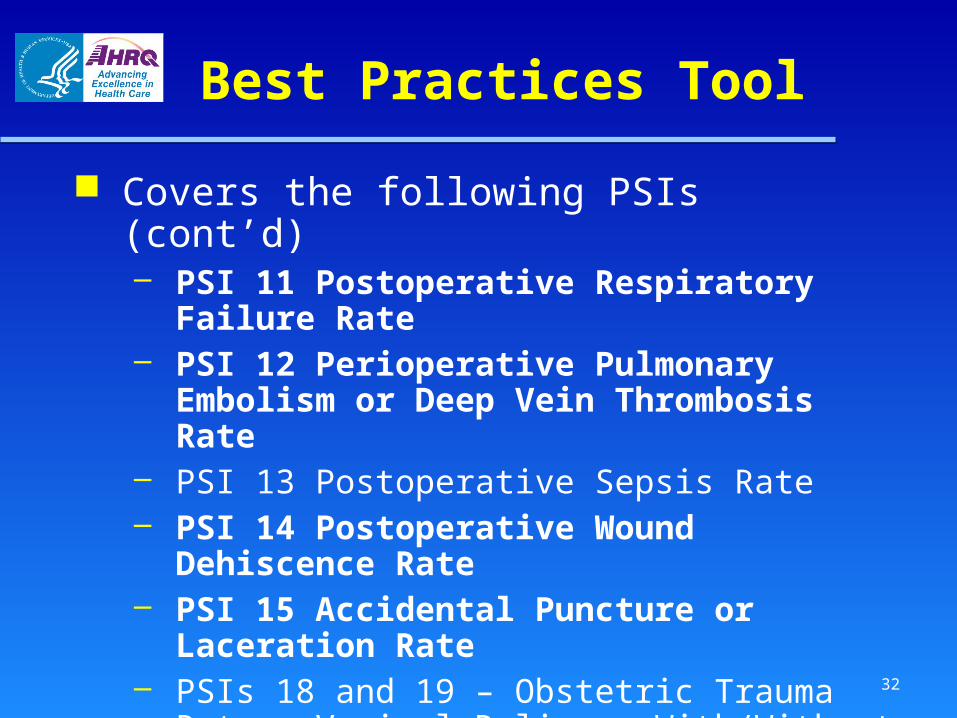
Best Practices Tool
Covers the following PSIs– PSI 03 Pressure Ulcer Rate – PSI 05 Retained Surgical Item or Unretrieved
Device Fragment Count – PSI 06 Iatrogenic Pneumothorax Rate – PSI 07 Central Venous Catheter-Related Blood
Stream Infection Rate – PSI 08 Postoperative Hip Fracture Rate – PSI 09 Perioperative Hemorrhage or Hematoma
Rate – PSI 10 Postoperative Physiologic and Metabolic
Derangement Rate
32
Best Practices Tool
Covers the following PSIs (cont’d)– PSI 11 Postoperative Respiratory Failure Rate – PSI 12 Perioperative Pulmonary Embolism or
Deep Vein Thrombosis Rate – PSI 13 Postoperative Sepsis Rate – PSI 14 Postoperative Wound Dehiscence Rate
– PSI 15 Accidental Puncture or Laceration Rate – PSIs 18 and 19 – Obstetric Trauma Rate –
Vaginal Delivery With/Without Instrument Does not include PSI 4 (Death Rate Among
Surgical Inpatients With Serious Treatable Conditions)
33
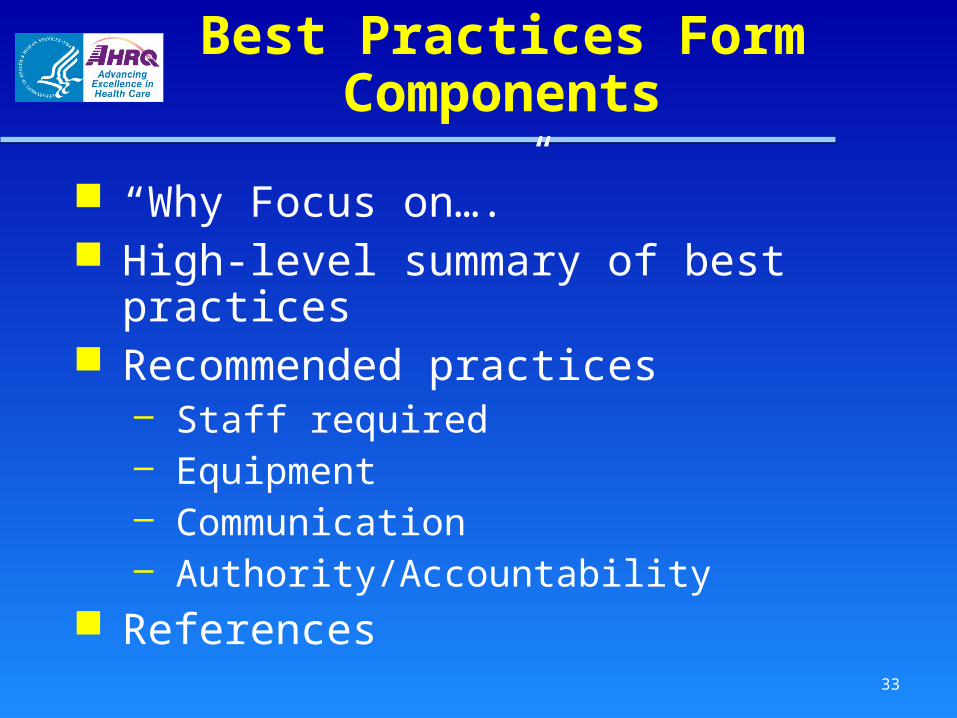
Best Practices Form Components
“Why Focus on….” High-level summary of best practices Recommended practices
– Staff required– Equipment– Communication– Authority/Accountability
References
34
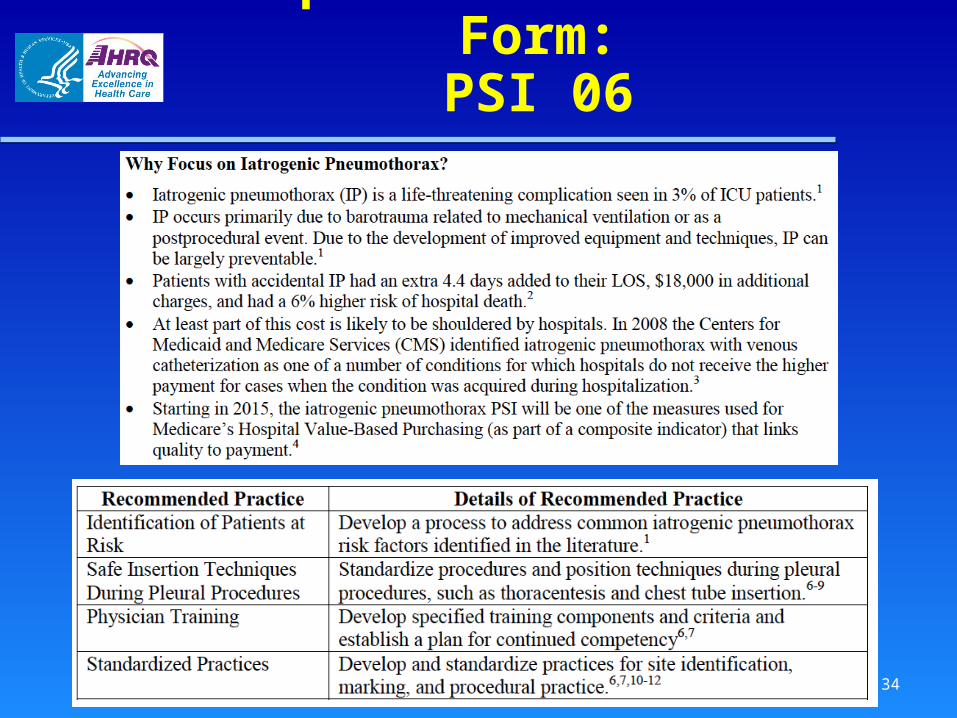
Sample Best Practices Form:PSI 06
35
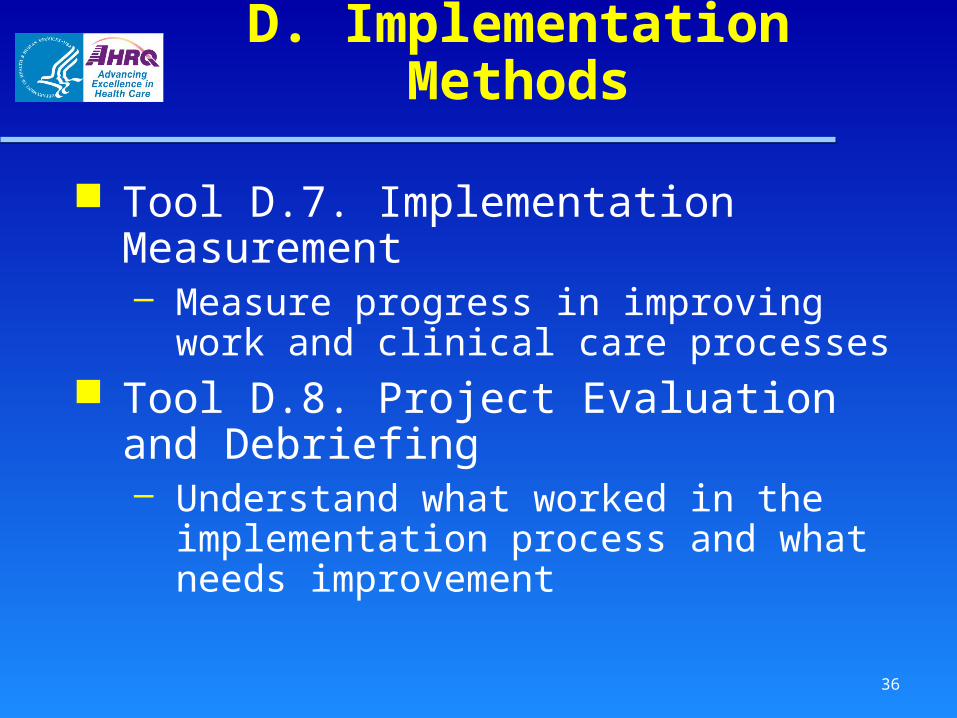
D. Implementation Methods
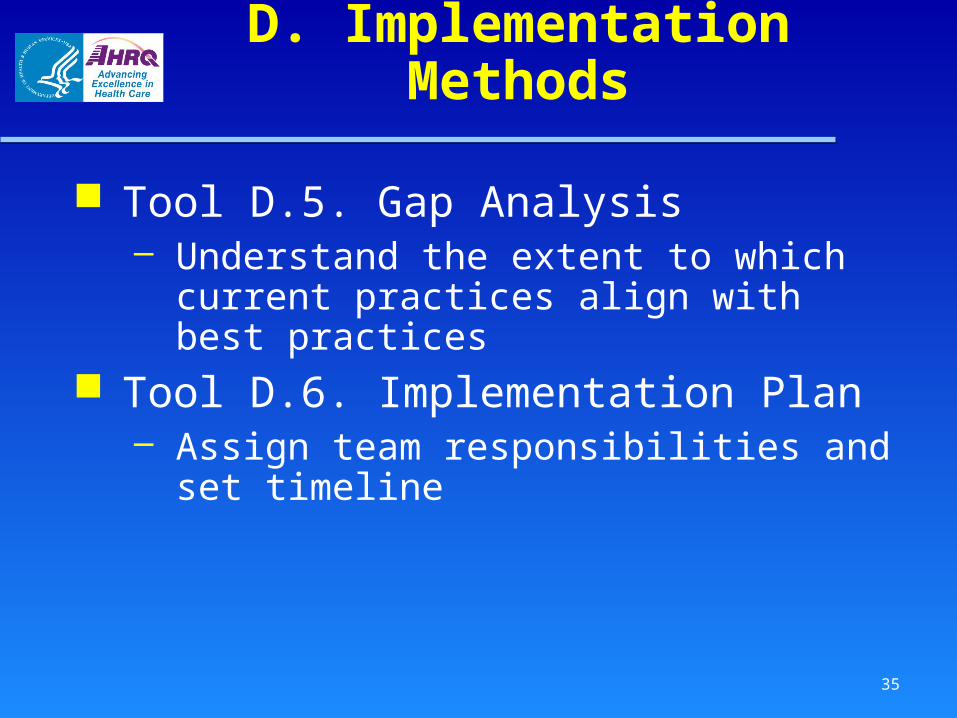
Tool D.5. Gap Analysis– Understand the extent to which current
practices align with best practices Tool D.6. Implementation Plan
– Assign team responsibilities and set timeline
36
Tool D.7. Implementation Measurement– Measure progress in improving work and
clinical care processes Tool D.8. Project Evaluation and
Debriefing– Understand what worked in the
implementation process and what needs improvement
D. Implementation Methods
37
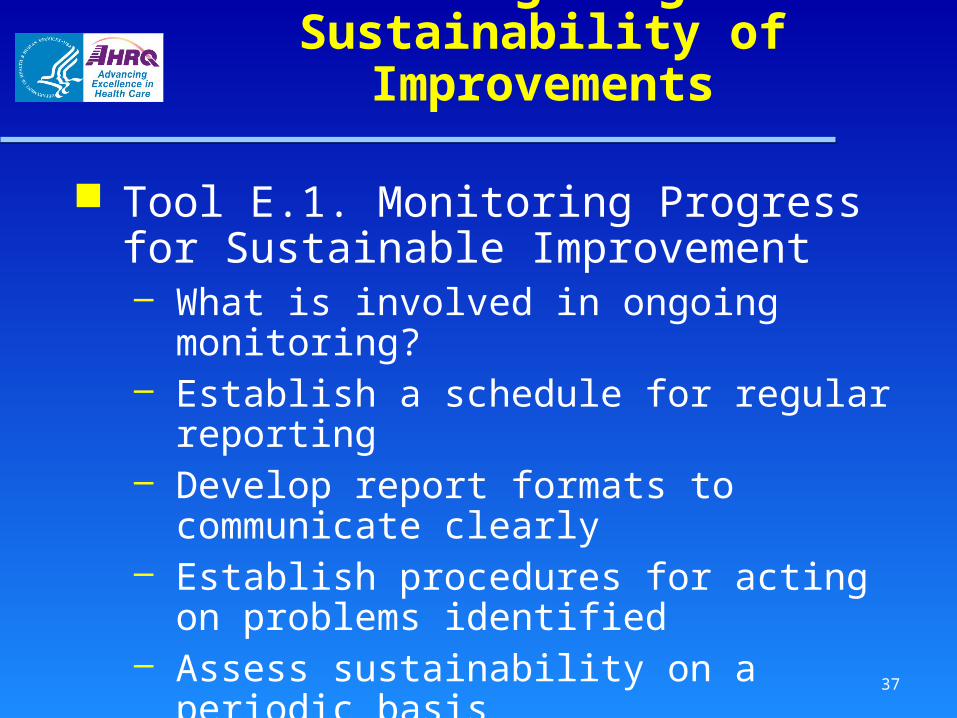
E. Monitoring Progress and Sustainability of Improvements
Tool E.1. Monitoring Progress for Sustainable Improvement– What is involved in ongoing monitoring?– Establish a schedule for regular reporting– Develop report formats to communicate
clearly– Establish procedures for acting on
problems identified – Assess sustainability on a periodic basis

38
F. Return-on-Investment Analysis
Tool F.1. Return on Investment Estimation– Step-by-step guide to calculating ROI– Worksheets for calculating net costs and
returns– Case study for ROI calculation– Additional guidance for effective ROI
calculation– Resources and information sources

39
G. Existing Quality Improvement Resources
Tool G.1. Available Comprehensive Quality Improvement Guides– Obtain further guidance for conducting
effective quality improvements Tool G.2. Specific Tools To Support
Change– Identify specific analytic or action tools to
use in improvement processes Tool G.3. Case Study of PSI
Improvement Implementation

40
Summary
The QI Toolkit supports hospitals that want to improve performance
Addresses all stages of improvement, from self-assessment to ongoing monitoring
The tools are practical, easy to use, and designed to meet a variety of needs
QI Toolkit available at: http://www.ahrq.gov/professionals/systems/hospital/qitoolkit/index.html


![Review_Barnes, Jonathan_The Presocratic Philosophers_[Edward Hussey]]](https://static.fdocuments.net/doc/165x107/577cd7cf1a28ab9e789fc56d/reviewbarnes-jonathanthe-presocratic-philosophersedward-hussey.jpg)