Overview of potential indicators for financing ... · Overview of potential indicators for...
17
The European Topic Centre on Biological Diversity (ETC/BD) is a consortium of nine organisations under a Framework Partnership Agreement with the European Environment Agency for the period 2009-2013 AOPK-CR ECNC GDNAP TK Turkey ILE-SAS ISPRA JNCC MNHN SLU UBA European Environment Agency European Topic Centre on Biological Diversity Working paper N° D/2013 Overview of potential indicators for financing biodiversity management Veronika Mikos, Andrew Schrauwen, Ben Delbaere and Sophie Condé 17 September 2013
Transcript of Overview of potential indicators for financing ... · Overview of potential indicators for...
The European Topic Centre on Biological Diversity (ETC/BD) is a consortium of nine organisations under a Framework Partnership Agreement with the European Environment Agency for the period 2009-2013
AOPK-CR ECNC GDNAP TK Turkey ILE-SAS ISPRA JNCC MNHN SLU UBA
European Environment Agency
European Topic Centre on Biological Diversity
Working paper N° D/2013
Overview of potential indicators
for financing biodiversity management
Veronika Mikos, Andrew Schrauwen, Ben Delbaere
and Sophie Condé
17 September 2013

Overview of potential indicators for financing biodiversity management 2
Authors’ affiliation:
Veronika Mikos, European Centre for Nature Conservation (NL)
Andrew Schrauwen, European Centre for Nature Conservation (NL)
Ben Delbaere, European Centre for Nature Conservation (NL)
Sophie Condé, Muséum national d’Histoire naturelle (FR)
EEA project manager:
Katarzyna Biala, European Environment Agency (DK)
ETC/BD production support:
Muriel Vincent, Muséum national d’Histoire naturelle (FR)
Context:
The Topic Centre has prepared this Working paper in collaboration with the European
Environment Agency (EEA) under its 2013 work programmes as a contribution to the EEA’s
work on indicators in support to the 2020 target.
Citation:
Please cite this report as
Mikos, V., Schrauwen, A., Delbaere, B. and Condé, S., 2013. Overview of potential
indicators for financing biodiversity management. ETC/BD report to the EEA.
Disclaimer:
This European Topic Centre on Biological Diversity (ETC/BD) Working Paper has not been
subject to a European Environment Agency (EEA) member country review. The content of
this publication does not necessarily reflect the official opinions of the EEA. Neither the
ETC/BD nor any person or company acting on behalf of the ETC/BD is responsible for the
use that may be made of the information contained in this report.
©ETC/BD 2013
ETC/BD Working paper N° D/2013
European Topic Centre on Biological Diversity
c/o Muséum national d’Histoire naturelle
57 rue Cuvier
75231 Paris cedex, France
Phone: + 33 1 40 79 38 70
E-mail: [email protected]
Website: http://bd.eionet.europa.eu/

Overview of potential indicators for financing biodiversity management 3
Contents
1. PURPOSE OF THIS DOCUMENT ......................................................................................... 4
2. INTRODUCTION .................................................................................................................... 4
3. METHOD ................................................................................................................................. 5
4. REVIEW OF THE CURRENT FINANCE INDICATOR ...................................................... 5
5. POSSIBLE RELEVANT INDICATORS ................................................................................. 7
I. THE LIFE PROGRAMME ................................................................................................................... 7 II. THE COMMON AGRICULTURAL POLICY.............................................................................................. 9 III. PRIVATE FUNDING........................................................................................................................ 14 IV. WIDER CONSERVATION INVESTMENT............................................................................................... 15 V. INDEX ON FINANCING BIODIVERSITY ................................................................................................. 16
6. CONCLUSIONS AND RECOMMENDATIONS .................................................................. 16
7. LITERATURE CITED........................................................................................................... 16
Overview of potential indicators for financing biodiversity management 4
1. Purpose of this document The purpose of this document is to provide an overview of potential indicators on financing biodiversity management, based on the SEBI25 indicator and how it can be updated and improved, or if any additional indicator can be suggested. The scope is limited to the EU budget and the selected indicator(s) should support the assessment of the EU Biodiversity Strategy.
2. Introduction In the process of Streamlining European Biodiversity Indicators (SEBI) an indicator on ‘Financing biodiversity management’ was included in the final set of 26 indicators (referred to as indicator SEBI25; European Environment Agency, 2009). The indicator responded to the key policy question ‘How much public funds are being committed to conservation of biodiversity?’ Already at that time it was recognized that the indicator had a number of limitations (see section 4). Since the publication of the SEBI indicators the policy framework has been moving on. At the global level in the framework of the Convention on Biological Diversity a Strategic Plan for Biodiversity 2011-20201 was agreed, which includes 20 specific targets (the Aichi targets). On the basis of the global strategy and targets, the European Commission adopted the EU Biodiversity Strategy to 2020 in 20112. Both policy documents provided the framework for reviewing the set of SEBI indicators and matching the indicators to the new targets (European Environment Agency, 2012). More specifically in connection to the biodiversity financing indicator it is worth mentioning that the Commission Proposal for a General Union Environment Action Programme to 2020 ‘Living well, within the limits of the planet’3 refers to the difficulty to trace biodiversity expenditure and it expresses the need to establish a tracking and reporting system for that purpose (based on the OECD methodology on Rio Markers (see below)). Also, this 7th EAP in the making includes a financing-related target, which says ‘to double biodiversity-related funding to developing countries by 2015 and maintain this level until 2020’, echoing the CBD Decision XI/4 on this matter. This target does call for an EU-level indicator to measure progress in achieving it. Already in 2007 some improvements were suggested for the finance indicator to become more relevant (European Environment Agency, 2007). These improvements (detailed in section 4) are still relevant today. They form the basis for the current attempt to provide an overview of potential indicators on financing biodiversity management.
1 UNEP/CBD/COP/DEC/X/9 2 COM(2011) 244 3 COM(2012) 710 final

Overview of potential indicators for financing biodiversity management 5
3. Method The methodology used in this report is based on document analysis, our own expertise and knowledge and targeted internet searches. Starting from the currently available facts sheet on the SEBI25 indicator, an assessment has been made about the strengths and weaknesses, room for improvement and overall usability. As a basis for the investigation we looked at the policy relevance by listing those targets and actions in the EU Biodiversity Strategy to 2020 that could be matched by an indicator on financing. A short overview was then created of possible relevant funding sources that contain at least an element of biodiversity in them, which might be used as a possible indicator. Furthermore a short side-step was made to explore the possibility to include sources of private funding, the latter with no avail. On the basis of the gathered information an assessment has been made of the possible funding sources to explore their suitability to contribute to the finance indicator, and as a comparison to the current indicator and possibilities to improve and elaborate it. The results and conclusions are described further on in this report.
4. Review of the current finance indicator The current Financing biodiversity management (SEBI 025) indicator can be found here: http://www.eea.europa.eu/data-and-maps/indicators/financing-biodiversity-management/financing-biodiversity-management-assessment-published. As recognized in its fact sheet, this indicator has a limited scope and only contains information from EU funding of projects using the LIFE financial instrument for the environment. The amount of the EU contribution per LIFE project varies significantly among Member States. Newer Member States tend to spend less money through the LIFE Nature programme (with a small number of notable exceptions). Further detail is required (e.g. on project size) in order to interpret these figures. The LIFE Nature project represents a very small proportion of the total EU budget. European funding benefiting biodiversity may also be 'hidden' in budget lines within other policy areas, such as agriculture, rural development and research. Finally, the indicator currently does not show national funding for biodiversity. Suggestions for improvement were provided by the EEA (European Environment Agency, 2007) and included:
Include national and private spending.
Refine accounting categories.
Expand beyond EU.

Overview of potential indicators for financing biodiversity management 6
A review on how the SEBI indicators match the targets and actions of the EU Biodiversity Strategy to 2020 revealed that SEBI25 did not match any of the actions fully (European Environment Agency, 2012). The same review also considered the Aichi targets and identified that SEBI25 responded to Aichi target 20: ‘By 2020, at the latest, the mobilization of financial resources for effectively implementing the Strategic Plan for Biodiversity 2011–2020 from all sources and in accordance with the consolidated and agreed process in the Strategy for Resource Mobilization should increase substantially from the current levels.’ An additional review, carried out for the current report, reveals that a possible finance indicator could to a certain extent support the monitoring of the following relevant actions in the EU Biodiversity Strategy to 2020:
Action 2: Ensure adequate financing of Natura 2000 sites
2) The Commission and Member States will provide the necessary funds and incentives for Natura 2000, including through EU funding instruments, under the next multiannual financial framework. The Commission will set out its views in 2011 on how Natura 2000 will be financed under the next multi-annual financial framework.
Action 18: Mobilise additional resources for global biodiversity conservation
18a) The Commission and Member States will contribute their fair share to international efforts to significantly increase resources for global biodiversity as part of the international process aimed at estimating biodiversity funding needs and adopting resource mobilisation targets for biodiversity at CBD CoP11 in 2012.
18b) The Commission will improve the effectiveness of EU funding for global biodiversity inter alia by supporting natural capital assessments in recipient countries and the development and/or updating of National Biodiversity Strategies and Action Plans, and by improving coordination within the EU and with key non-EU donors in implementing biodiversity assistance/projects.
Table 1: Relevant actions EU Biodiversity Strategy 2020 Furthermore the indicator(s) could support the monitoring of the following relevant Aichi Biodiversity Targets:
Strategic Goal A: Address the underlying causes of biodiversity loss by mainstreaming biodiversity across government and society
Target 2: By 2020, at the latest, biodiversity values have been integrated into national and local development and poverty reduction strategies and planning processes and are being incorporated into national accounting, as appropriate, and reporting systems.

Overview of potential indicators for financing biodiversity management 7
Strategic Goal A: Address the underlying causes of biodiversity loss by mainstreaming biodiversity across government and society
Target 3: By 2020, at the latest, incentives, including subsidies, harmful to biodiversity are eliminated, phased out or reformed in order to minimize or avoid negative impacts, and positive incentives for the conservation and sustainable use of biodiversity are developed and applied, consistent and in harmony with the Convention and other relevant international obligations, taking into account national socio economic conditions.
Strategic Goal E: Enhance implementation through participatory planning, knowledge management and capacity building
Target 20: By 2020, at the latest, the mobilization of financial resources for effectively implementing the Strategic Plan for Biodiversity 2011-2020 from all sources, and in accordance with the consolidated and agreed process in the Strategy for Resource Mobilization, should increase substantially from the current levels. This target will be subject to changes contingent to resource needs assessments to be developed and reported by Parties.
Table 2: Relevant Aichi Biodiversity Targets
5. Possible relevant indicators In terms of public funding at the European level, the actions promoting conservation and sustainable use of biodiversity are supported by seven different Community funding instruments, including the European Agricultural Fund for Rural Development (EAFRD), European Fisheries Fund (EFF), the European Regional Development Fund (ERDF), European Social Fund (ESF), Cohesion Fund, LIFE+ and the 7th Framework Programme for Research and Development (WWF, 2009). This integrated funding model makes it difficult to identify which component of the funding exactly is dedicated to biodiversity. Also, most of the funds provide for co-financing, with further funding to be provided by Member States or others. Information or data on total amounts of financial support devoted to biodiversity management therefore is difficult, if not impossible, to collect and compare. Two of the most concrete and important public funding sources at EU level with regard to biodiversity management are LIFE+ and the Common Agricultural Policy, which are described below.
I. The LIFE Programme
(Source: http://ec.europa.eu/environment/life/about/index.htm) The LIFE programme is the EU’s funding instrument for the environment, including biodiversity issues. The general objective of LIFE is to contribute to the implementation, updating and development of EU environmental policy and legislation by co-financing pilot or demonstration projects with European added value.

Overview of potential indicators for financing biodiversity management 8
LIFE began in 1992 and to date there have been three complete phases of the programme (LIFE I: 1992-1995, LIFE II: 1996-1999 and LIFE III: 2000-2006). During this period, LIFE has co-financed some 3104 projects across the EU, contributing approximately €2.2 billion to the protection of the environment. The current phase of the programme, LIFE+, runs from 2007-2013 and has a budget of €2.143 billion. The legal basis for LIFE+ is the Regulation (EC) No 614/2007. The programme has three components: LIFE+ Nature and Biodiversity, LIFE+ Environment Policy and Governance, and LIFE+ Information and Communication. LIFE+ Nature & Biodiversity LIFE+ Nature projects contribute to the implementation of the Birds and/or Habitats Directives, including at local and regional level, and support the further development and implementation of the Natura 2000 network, including coastal and marine habitats and species. The focus is on long-term sustainable investments in Natura 2000 sites and on the conservation of species and habitats targeted by these Directives. LIFE+ Biodiversity projects contribute to achieving the 2020 biodiversity headline target through the implementation of the targets and actions of the EU Biodiversity Strategy to 2020.4 The total financial envelope for the LIFE Programme in the Multiannual Financial Framework for the period 2014-2020 expressed in current prices is €3,618 million. Of this amount €2,713.5 million is allocated to the sub-programme for Environment, of which half of the resources dedicated to projects financed by way of action grants shall be allocated to support the conservation of nature and biodiversity. €904.5 million is allocated to the sub-programme for Climate Action.5 Since the current phase of the LIFE programme is still on-going (2007-2013) there are no statistical data available yet about this period in terms of:
(1) Average amount spent per site from 2000 to 2005 (2) Average amount of Life funds per country per year from 2000 to 2005
4 Based on ‘LIFE+ Nature and Biodiversity – Guidelines for applicant 2013’ 5 COM(2011) 874 final, Proposal for a regulation of the European Parliament and of the Council on the establishment of a Programme for the Environment and Climate Action (LIFE)

Overview of potential indicators for financing biodiversity management 9
The latest reliable data are from 2006: Average amount spent per site from 2000 to 2005
Average amount of Life funds per country per year from 2000 to 2005
Furthermore, the LIFE Programme is covering broader aspects of environment and nature conservation, not only biodiversity, which also leads to limitations about the reliability of this indicator.
II. The Common Agricultural Policy
Europe's agricultural sector has received sustained EU financial support under the Common Agricultural Policy (CAP) over the last 50 years. This support has evolved alongside growing recognition and awareness of the strong links between agricultural activities and the environment, including biological diversity. The European Commission has recently highlighted the importance of using the CAP instruments in the fight to halt the decline of biodiversity, notably in the EU Biodiversity Strategy to 2020. At present, the CAP is currently divided into two main 'pillars', which differ in terms of financing, functioning and structure. Pillar 1 (financed fully from the EU budget) consists of direct payments (income support) to farmers and market interventions such as stock
Average per year
0.00
200,000.00
400,000.00
600,000.00
800,000.00
1,000,000.00
1,200,000.00
1,400,000.00
1,600,000.00
1,800,000.00
2,000,000.00
AT BE CY CZ DE DK EE ES FR FI GR HU IR IT LUX LT LV MT NL PL PT RO SE SI SK UK
Total average per year
ATBE
CY
CZ
DE
DK
EE
ESFRFI
GRHU
IR
IT
LUX
LTLVMTNL
PLPT
ROS
SI
SK
UK

Overview of potential indicators for financing biodiversity management 10
purchases aimed at price stabilisation. Pillar 2 — the rural development policy — is co-financed by Member States and regional administrations. Both pillars have the potential to contribute, both directly and indirectly, to biodiversity conservation and sustainable use. For example, the cross-compliance rules under Pillar 1 focus primarily on preventing environmental damage from farm operations. Under Pillar 2, biodiversity issues are addressed via instruments including agri-environmental measures. The future of the CAP For the period 2014–2020 the proposals for the CAP6 foresee the introduction of payments for agricultural practices that are beneficial for the climate and the environment (called greening) in addition to the continuation of cross-compliance. It is proposed that farmers will receive full payments only if the following three measures are implemented: crop diversification; maintenance of permanent grassland at farm level; and the establishment of ecological focus areas. The latter measure in particular offers opportunities for conserving biodiversity while at the same time strengthening ecosystem services that support sustainable agriculture. While there is no doubt that these measures can support biodiversity conservation, it is not at all certain that farmers who adopt this approach will take the specific local requirements of species sufficiently into account and look for win-win solutions. Besides these proposed mandatory greening measures, voluntary agri-environmental schemes as part of the Rural Development Programmes will remain in the future CAP. The proposal envisages enlarging their scope to cover climate as well as the possibility for group commitments in order to improve the effectiveness of these measures. By adopting voluntary environmental measures at farm level, farmers are compensated for the additional costs and/or income forgone. Agri-environmental measures can contribute positively to the protection of landscapes, soils, water and biodiversity. (ELN-FAB, 2012) Agri-environmental measures Agri-environmental measures are the most promising part of CAP which can have a positive impact on biodiversity conservation. However, there are limitations which prevent that this funding scheme can be used as an appropriate indicator on financing biodiversity management:
- Agri-environment measures may be designed at the national, regional, or local level so that they can be adapted to particular farming systems and specific environmental conditions. This makes agri-environment a targeted tool for achieving environmental goals.
- Agri-environment measures are co-financed by Member States. EU expenditure on agri-environment measures amounts for 2007 - 2013 to nearly 20 billion EUR or 22 % of the expenditure for rural development.
6 http://ec.europa.eu/agriculture/cap-post-2013/legal-proposals/index_en.htm
Overview of potential indicators for financing biodiversity management 11
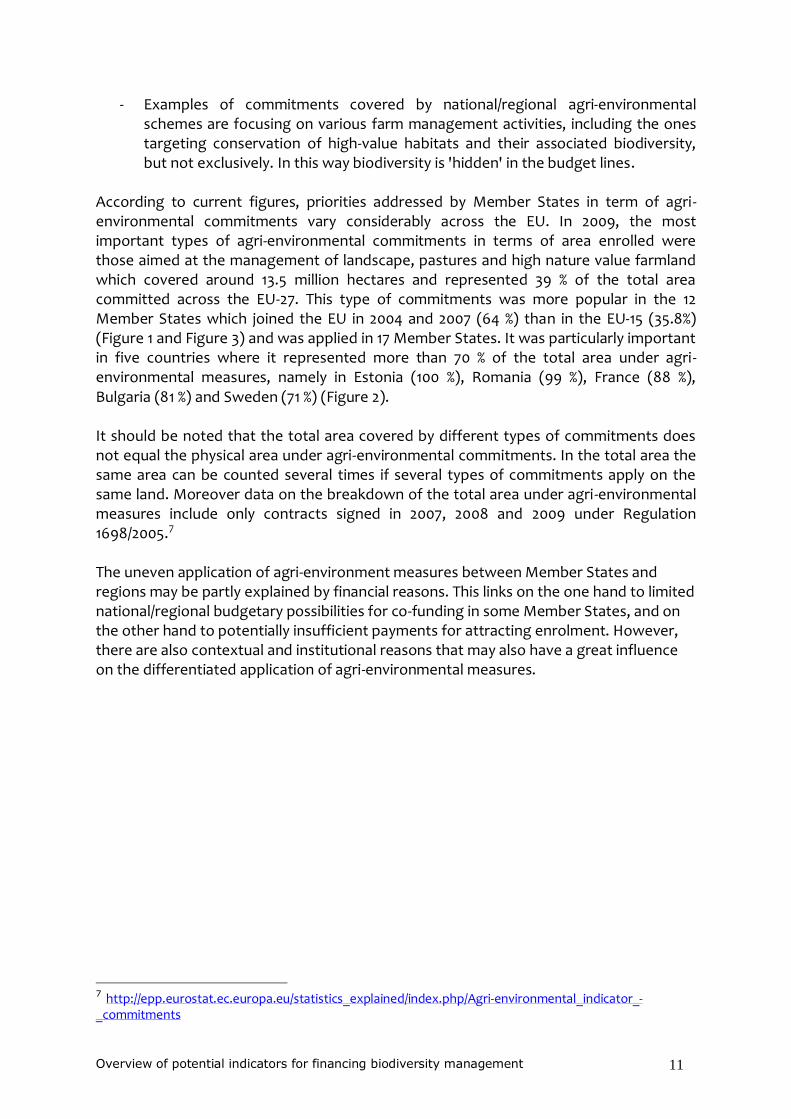
- Examples of commitments covered by national/regional agri-environmental schemes are focusing on various farm management activities, including the ones targeting conservation of high-value habitats and their associated biodiversity, but not exclusively. In this way biodiversity is 'hidden' in the budget lines.
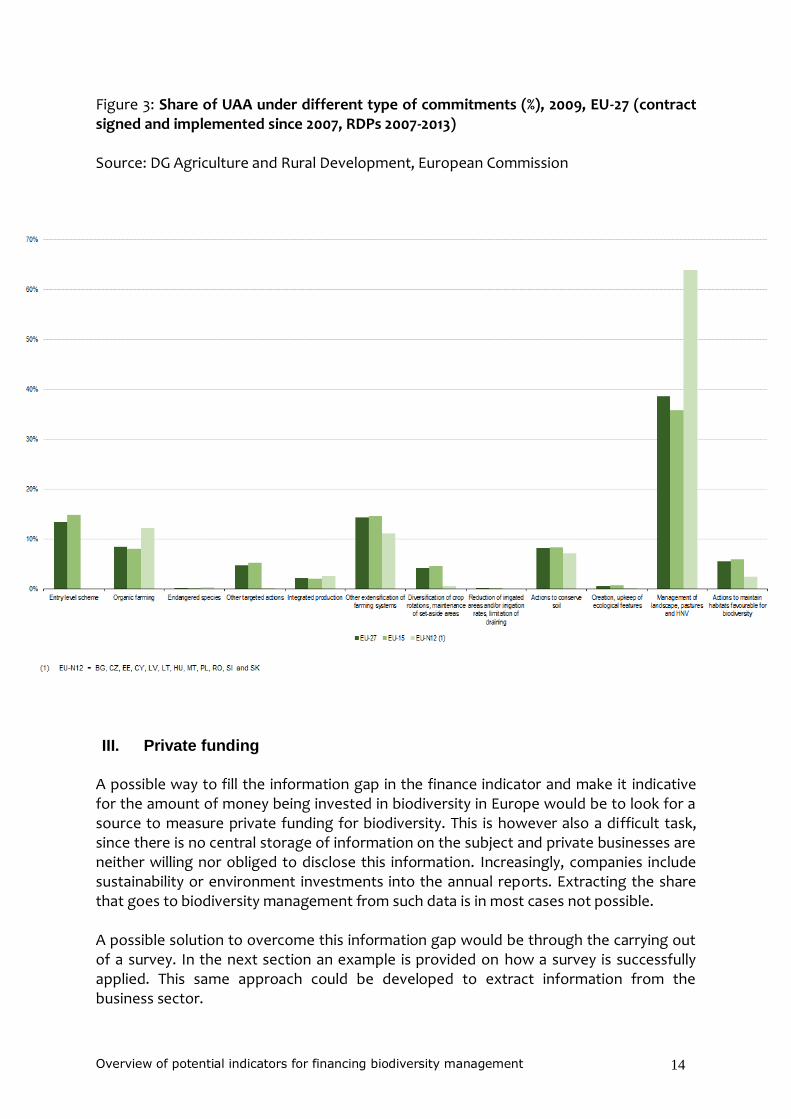
According to current figures, priorities addressed by Member States in term of agri-environmental commitments vary considerably across the EU. In 2009, the most important types of agri-environmental commitments in terms of area enrolled were those aimed at the management of landscape, pastures and high nature value farmland which covered around 13.5 million hectares and represented 39 % of the total area committed across the EU-27. This type of commitments was more popular in the 12 Member States which joined the EU in 2004 and 2007 (64 %) than in the EU-15 (35.8%) (Figure 1 and Figure 3) and was applied in 17 Member States. It was particularly important in five countries where it represented more than 70 % of the total area under agri-environmental measures, namely in Estonia (100 %), Romania (99 %), France (88 %), Bulgaria (81 %) and Sweden (71 %) (Figure 2). It should be noted that the total area covered by different types of commitments does not equal the physical area under agri-environmental commitments. In the total area the same area can be counted several times if several types of commitments apply on the same land. Moreover data on the breakdown of the total area under agri-environmental measures include only contracts signed in 2007, 2008 and 2009 under Regulation 1698/2005.7 The uneven application of agri-environment measures between Member States and regions may be partly explained by financial reasons. This links on the one hand to limited national/regional budgetary possibilities for co-funding in some Member States, and on the other hand to potentially insufficient payments for attracting enrolment. However, there are also contextual and institutional reasons that may also have a great influence on the differentiated application of agri-environmental measures.
7 http://epp.eurostat.ec.europa.eu/statistics_explained/index.php/Agri-environmental_indicator_-_commitments

Overview of potential indicators for financing biodiversity management 12
Figure 1: Breakdown of UAA under agri-environment measures by type of action (%), 2009, EU-27 (contract signed and implemented since 2007, RDPs 2007-2013) Source: DG Agriculture and Rural Development, European Commission

Overview of potential indicators for financing biodiversity management 13
Figure 2: Breakdown of UAA under agri-environment measures by type of action by countries (%), 2009, EU-27 (contract signed and implemented since 2007, RDPs 2007-2013) Source: DG Agriculture and Rural Development, European Commission
Overview of potential indicators for financing biodiversity management 14
Figure 3: Share of UAA under different type of commitments (%), 2009, EU-27 (contract signed and implemented since 2007, RDPs 2007-2013) Source: DG Agriculture and Rural Development, European Commission
III. Private funding
A possible way to fill the information gap in the finance indicator and make it indicative for the amount of money being invested in biodiversity in Europe would be to look for a source to measure private funding for biodiversity. This is however also a difficult task, since there is no central storage of information on the subject and private businesses are neither willing nor obliged to disclose this information. Increasingly, companies include sustainability or environment investments into the annual reports. Extracting the share that goes to biodiversity management from such data is in most cases not possible. A possible solution to overcome this information gap would be through the carrying out of a survey. In the next section an example is provided on how a survey is successfully applied. This same approach could be developed to extract information from the business sector.

Overview of potential indicators for financing biodiversity management 15
IV. Wider conservation investment
The World Resources Institute published a report on conservation Investments by private businesses in Latin America and the Caribbean (Castro & Locker, 2000). The method used to compile the data in that report was to send a survey to the businesses and ask them for relevant statistics. Despite some shortcomings (e.g. response rate, inconsistency in reporting, double-counting, funds allocated but not spent) this seems to be the only viable way to get sufficient and accurate data on private and public financing of biodiversity and conservation. This approach could be applied to projects funded by EU, Member States, businesses or other donors, but clear guidelines have to be provided to get the appropriate data. Questions that need to be answered are whether the provided figures should only apply to the European geographical region, whether only EU based donors should provide data, etc. In order for this approach to be useful to provide an indicator to measure progress, a standard methodology must be applied and repeated at regular intervals. A further example in this category is the indicator that is currently used at the global level to report on Aichi Target 20: Official Development Assistance Provided in Support of the Convention8. This indicator present the amounts (in USD) and percentages of official development assistance (ODA) targeting biodiversity as provided by 24 donor governments and the EC (members of the Development Assistance Committee) to developing countries. The connection with biodiversity is based on a labeling of ODA by way of ‘Rio markers’ which indicate to which CBD objective given assistance contributes. The indicator is collected since 1998 and provides proxy-information on funding for biodiversity. Marker data do not allow exact quantification of aid allocation or spending on biodiversity. They give an indication (best estimate) of biodiversity aid flows and describe the extent to which donors address the objectives of the CBD in their aid programme.
Biodiversity–focused aid (USD million, constant 2011 prices)
8 http://www.bipindicators.net/oda

Overview of potential indicators for financing biodiversity management 16
Biodiversity-focused aid is the total commitments from activities scored as principally or significantly targeting the objectives of the CBD. Principal policy objectives can be defined as being fundamental in the design and impact of the activity. Significant policy objectives are those which, although important, are not one of the principal reasons for undertaking the activity. Source: OECD
V. Index on financing biodiversity
A possible different approach could be to valuate sustainability indices on the stock markets (e.g. green GDP, Dow Jones, FTSE, Trucost). However, these only highlight stock market investments and next to that do not specifically target biodiversity but focus on sustainability as a whole. Another issue is that these indices (apart from green GDP) show which investments are made in which ‘green’ companies, but do not show any figure regarding the investments of businesses in mitigation of biodiversity impacts or direct biodiversity measures on site. Looking at the country level it could be argued that the amount of tax reductions based on Green Investments could be used as an indicator for private financing, but the same issue as with the sustainability indices applies here.
6. Conclusions and Recommendations The current overview indicates that it is difficult to recommend a single indicator on financing biodiversity management. Reasons for this include:
Wide interpretation of the term ‘biodiversity management’;
Biodiversity, and therefore funding for it, being integrated in a range of policy sectors and therefore hidden in budgets;
Lack of standardized approach to collect statistics on funding for biodiversity;
Variety of funding sources (public, private and other donors) At the level of the EU, reporting on annual amounts of LIFE+ funding for nature and biodiversity seems to provide the most feasible option for a continued indicative trend of biodiversity-related public funding. It is recommended to consider developing or including in existing processes a survey to a selected number of donors of different kinds based on a standard methodology and repeated at regular intervals.
7. Literature cited Castro, G. & I. Locker (2000) Mapping conservation investments: An assessment of biodiversity funding in Latin America and the Caribbean. Washington, D.C.: Biodiversity Support Program.

Overview of potential indicators for financing biodiversity management 17
ELN-FAB (2012) Functional agrobiodiversity: Nature serving Europe’s farmers. – Tilburg, the Netherlands: ECNC-European Centre for Nature Conservation. European Environment Agency (2007) Halting the loss of biodiversity by 2010: proposal for a first set of indicators to monitor progress in Europe. EEA Technical report No 11/2007. EEA, Copenhagen European Environment Agency (2009) Progress towards the European 2010 biodiversity target —indicator fact sheets. Compendium to EEA Report No 4/2009. EEA, Copenhagen European Environment Agency (2012) Streamlining European biodiversity indicators 2020: Building a future on lessons learnt from the SEBI 2010 process. EEA Technical report No 11/2012. EEA, Copenhagen WWF (2009) Biodiversity & the EU Budget: Making the case for conserving biodiversity in the context of the EU Budget Review. World Wide Fund for Nature, Brussels