
Overview of Indian Marine Fisheries and future... · SCENARIO OF INDIAN MARINE FISHERIES Dr. P.U....
51
PRESENT AND FUTURE SCENARIO OF INDIAN MARINE FISHERIES Dr. P.U. Zacharia Head, Demersal Fisheries Division CMFRI, Cochin
-
Upload
phungnguyet -
Category
Documents
-
view
217 -
download
1
Transcript of Overview of Indian Marine Fisheries and future... · SCENARIO OF INDIAN MARINE FISHERIES Dr. P.U....
PRESENT AND FUTURE SCENARIO OF INDIAN MARINE
FISHERIES
Dr. P.U. Zacharia
Head, Demersal Fisheries Division
CMFRI, Cochin
Outline
• Present status of Indian fisheries
• Description of different fisheries
• Marine fisheries mgmt in India
• Status of mariculture
• Issues faced
• Future plans for development

Length of coastline 8129 km
Exclusive economic zone 2.02 m km2
Continental shelf 0.50 million km2
Inshore area (< 50 m depth) 0.18 million km2
Fishing villages 3202
Human Component
Marine fishers population 3.5 million
Active fishers population 0.9 million [20% in mech., 20% moto., 60% in arti.]; 30% posses ownership of fishing vessels
Physical Component
Landing centers 1332
Major fishing harbours 6
Minor fishing harbours 27
Mechanised vessels 58,911
Motorised vessels 75,591
Non-motorised vessels 104,270
Infrastructure Component
Component Profile
Profile of Indian Marine Fisheries
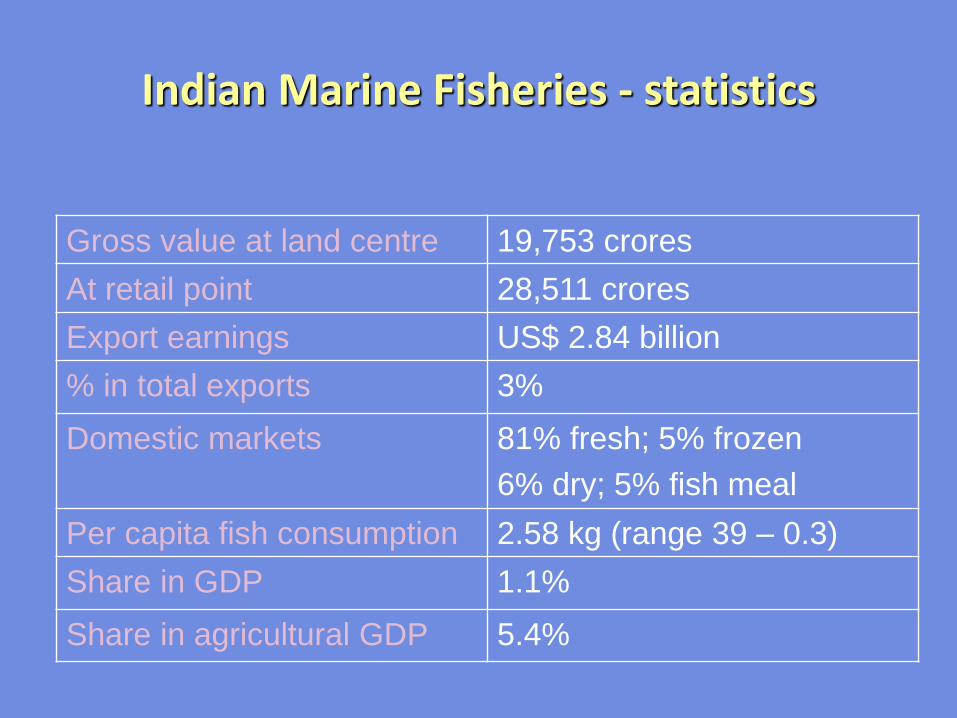
Indian Marine Fisheries - statistics
Gross value at land centre 19,753 crores
At retail point 28,511 crores
Export earnings US$ 2.84 billion
% in total exports 3%
Domestic markets 81% fresh; 5% frozen
6% dry; 5% fish meal
Per capita fish consumption 2.58 kg (range 39 – 0.3)
Share in GDP 1.1%
Share in agricultural GDP 5.4%
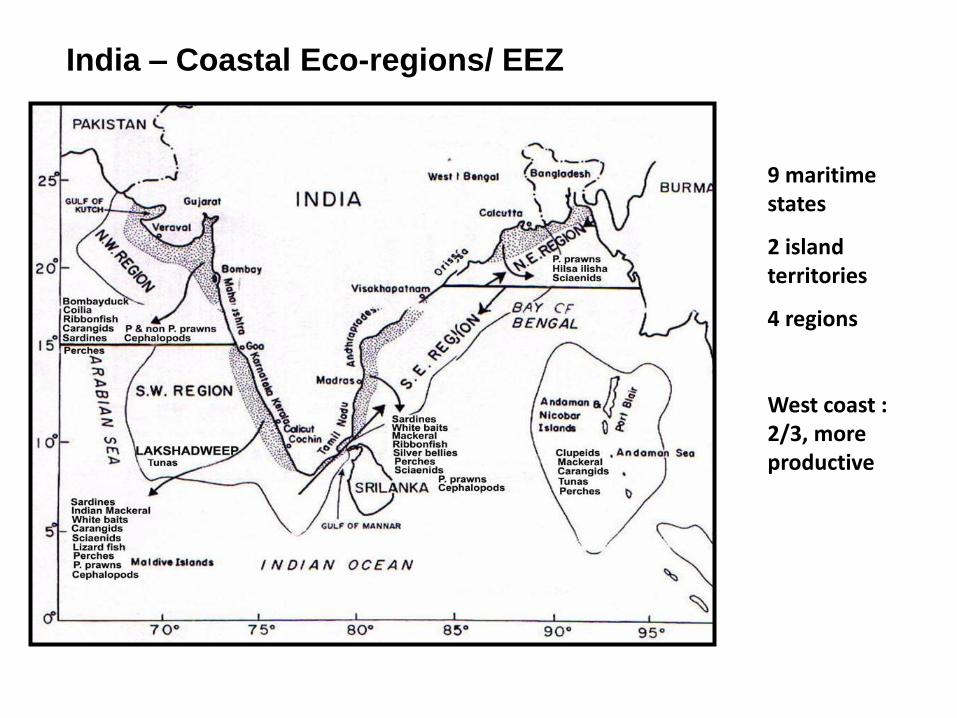
9 maritime states
2 island territories
4 regions
West coast : 2/3, more productive
India – Coastal Eco-regions/ EEZ

India Vs World – Catch Trends
0
10
20
30
40
50
60
70
80
90
100
1950 1958 1966 1974 1982 1990 1998 2006
Ca
tch
(m
illi
on
to
nn
es
)
India Global
0
500000
1000000
1500000
2000000
2500000
3000000
3500000
1961 1971 1981 1991 2001
India : 0.53 mt to 3.3 mt, stagnated at 2.7 during 2000-07
High fecundity, continuous spawning, fast growth, short life span
Global : stagnates at 82 m t for 15 years

Classification of Fisheries
Realm-wise Broad
resource
group-wise
Major species-wise
(exceeding 100,000
tonnes)
Vessel-wise Gear-wise
Pelagic fisheries
[55]
Finfish
[80.5]
Oil sardine [15.0] Non-
mechanized
[4.8]
Trawl [44.0]
Demersal
fisheries [45]
Crustacean
[14.9]
Croakers [5.2] Motorized
[24.9]
Seining [19.2]
Molluscan
[4.6]
Bombay duck [4.1] Mechanized
[70.3]
Gillnets [18.4]
Threadfin breams [3.9] Hooks and lines
[2.0]
Carangids [7.5] Bag nets [11.0]
Ribbonfish [5.6] Artisanal [4.8]
Mackerel [5.5]
Penaeid shrimp [6.8]
Non-penaeid shrimp
[5.4]
Cephalopods [4.4]

Multispecies nature of fish stocks in the
Indian Ocean (figures in parentheses refer to
commercially important species)
Country
Finfishes Penaeids Cephalopods
India 1400 (263) 36 (15) 34 (8)
Number of species
What do we exploit - MULTISPECIES
Commercial species in brackets

How the Exploitation is Carried Out
• 5 major Gears
– Trawl -
– Bagnets
– Gillnets
– Seines
– Hook & Line
• Major Crafts
– Mechanized - 58,911
– Motorized - 75,591
– Non-motorised -104,270
• More than 25 craft gear combinations
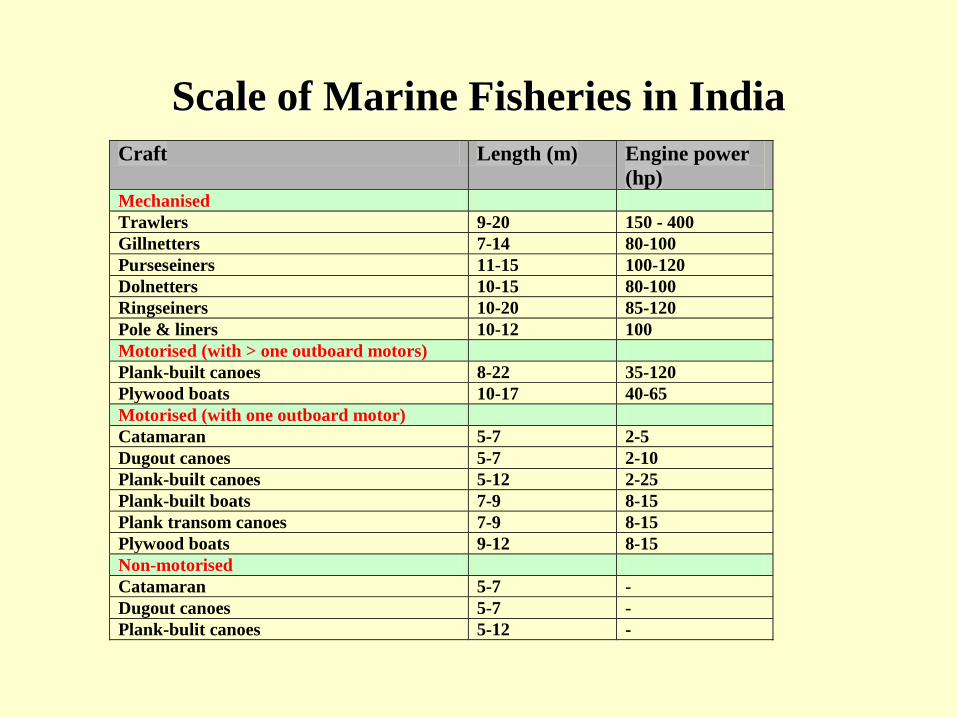
Scale of Marine Fisheries in India
Craft Length (m) Engine power
(hp) Mechanised
Trawlers 9-20 150 - 400
Gillnetters 7-14 80-100
Purseseiners 11-15 100-120
Dolnetters 10-15 80-100
Ringseiners 10-20 85-120
Pole & liners 10-12 100
Motorised (with > one outboard motors)
Plank-built canoes 8-22 35-120
Plywood boats 10-17 40-65
Motorised (with one outboard motor)
Catamaran 5-7 2-5
Dugout canoes 5-7 2-10
Plank-built canoes 5-12 2-25
Plank-built boats 7-9 8-15
Plank transom canoes 7-9 8-15
Plywood boats 9-12 8-15
Non-motorised
Catamaran 5-7 -
Dugout canoes 5-7 -
Plank-bulit canoes 5-12 -
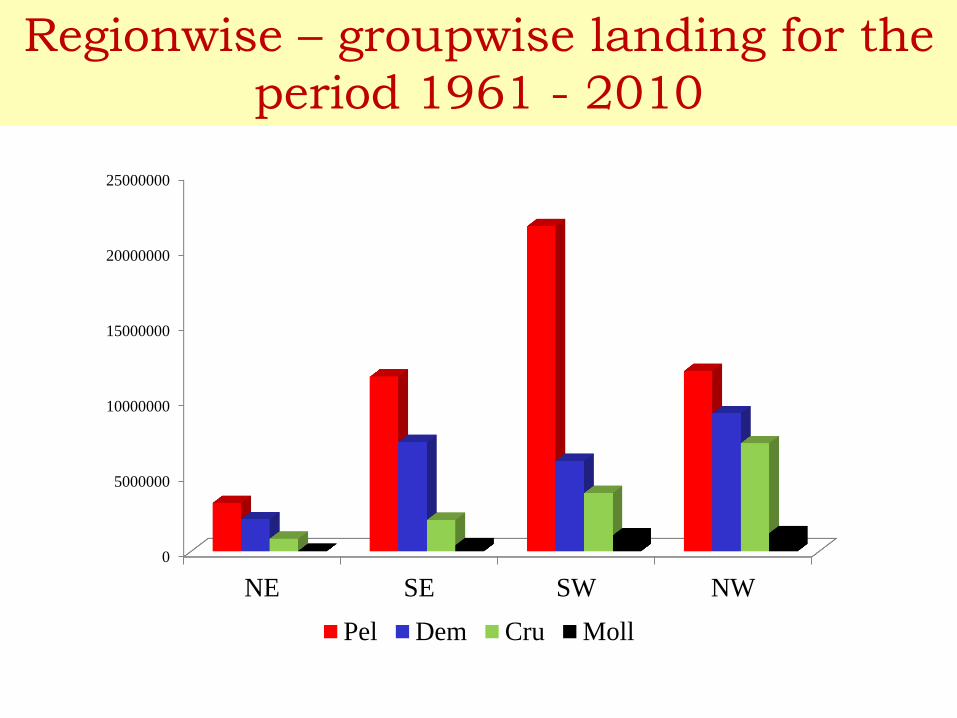
Regionwise – groupwise landing for the
period 1961 - 2010
0
5000000
10000000
15000000
20000000
25000000
NE SE SW NW
Pel Dem Cru Moll

Marine Fisheries Management in India
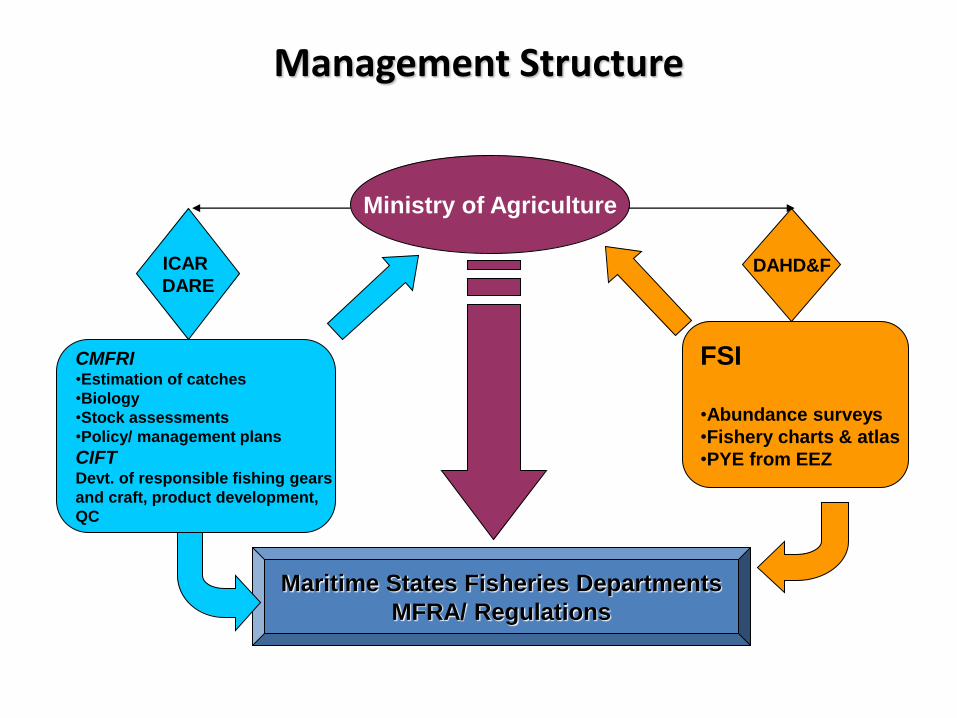
Management Structure
Ministry of Agriculture
CMFRI •Estimation of catches
•Biology
•Stock assessments
•Policy/ management plans
CIFT Devt. of responsible fishing gears
and craft, product development,
QC
ICAR
DARE
FSI
•Abundance surveys
•Fishery charts & atlas
•PYE from EEZ
DAHD&F
Maritime States Fisheries Departments
MFRA/ Regulations
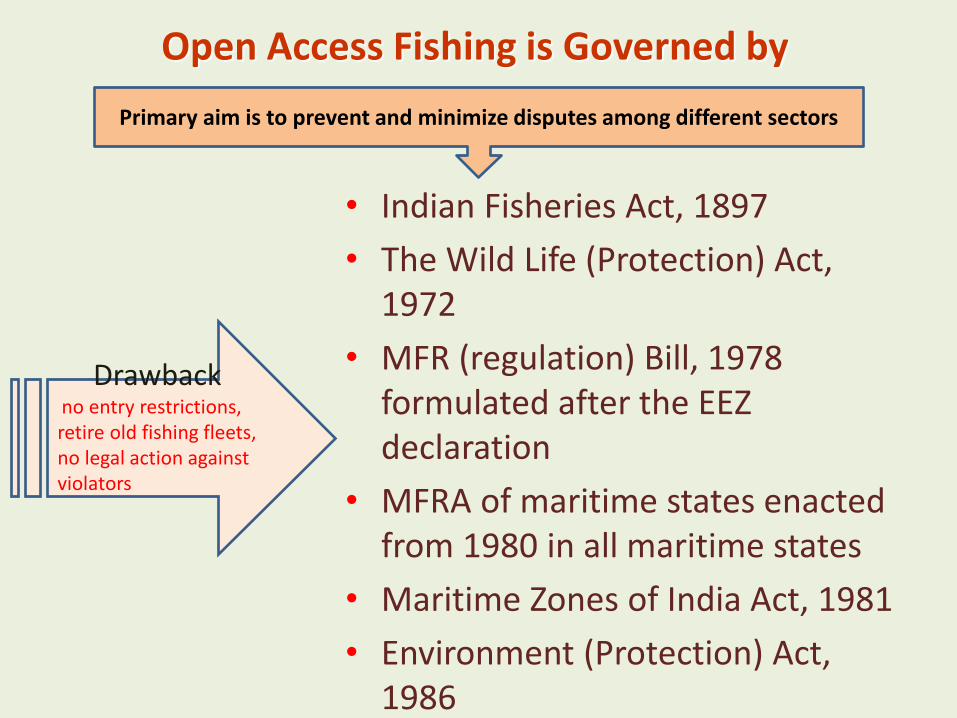
Open Access Fishing is Governed by
• Indian Fisheries Act, 1897
• The Wild Life (Protection) Act, 1972
• MFR (regulation) Bill, 1978 formulated after the EEZ declaration
• MFRA of maritime states enacted from 1980 in all maritime states
• Maritime Zones of India Act, 1981
• Environment (Protection) Act, 1986
Primary aim is to prevent and minimize disputes among different sectors
Drawback no entry restrictions, retire old fishing fleets, no legal action against violators

MAJOR FISHERIES
Trawl fisheries
•Major gear-44% of landngs
•Number of trawlers increased twice, the estimated efficiency (engine horsepower) increased by nearly 4 times, from 951,200 hp (1980) to 3,448, 570 hp (1998). •From 1999, employed for deep sea fishing upto 400 m depth •The medium trawlers undertaking multi-day voyages carry nearly a dozen different trawl nets each rigged differently and having different cod-end mesh sizes (15 to 35 mm) to target commercially highly valued resources.
• Penaeid shrimps are the main stay of the trawl fishery.
• High opening trawls reduce the dependance on shrimp; instead squid, cuttle fish and fishes became important.
• Finfishes exploited by trawls belong to 21 major fish groups. • Each region is characterized by dominance of specific finfish groups. • NE coast - sciaenids, catfish and pomfrets (together contributing 74.0% to the demersal landings). • SE coast - silverbellies and pigface breams • SW coast - threadfin breams and other perches • NW coast - sciaenids, catfish and threadfin breams
Seine Fisheries
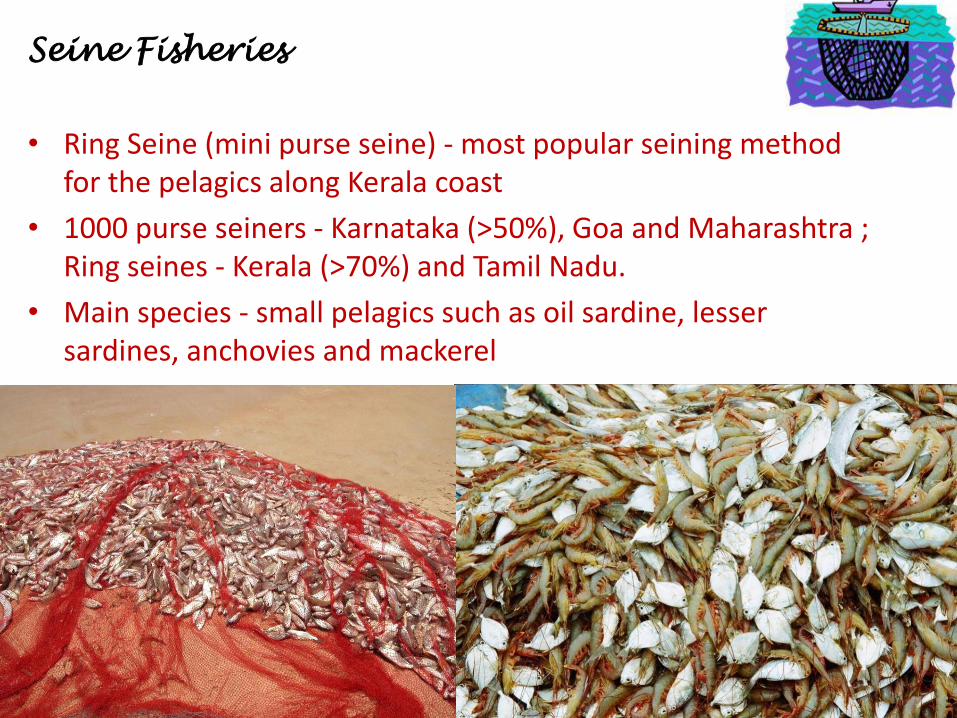
• Ring Seine (mini purse seine) - most popular seining method for the pelagics along Kerala coast
• 1000 purse seiners - Karnataka (>50%), Goa and Maharashtra ; Ring seines - Kerala (>70%) and Tamil Nadu.
• Main species - small pelagics such as oil sardine, lesser sardines, anchovies and mackerel
Gillnet Fisheries
• The gillnet catches which ranged from 1.0 lakh to 1.35 lakh t during the 1980s and 1990s, increased by more than 4 times in recent years (5.8 lakh t in 2008).
• Share of mechanized gillnetters (MGN) is increasing as compared to outboard gillnetters (OBGN) (last 5 years).
• Exploits only few species; upto 60 species recorded.
• Small meshed gillnets (Clupeids and croakers)
• Large meshed gill nets (Sharks, seerfish, mackerels, catfishes, pomfrets, tunas and carangids)
• Average productivity of this gear - estimated at 13.7 kg/h maximum in SW coast followed by NE.
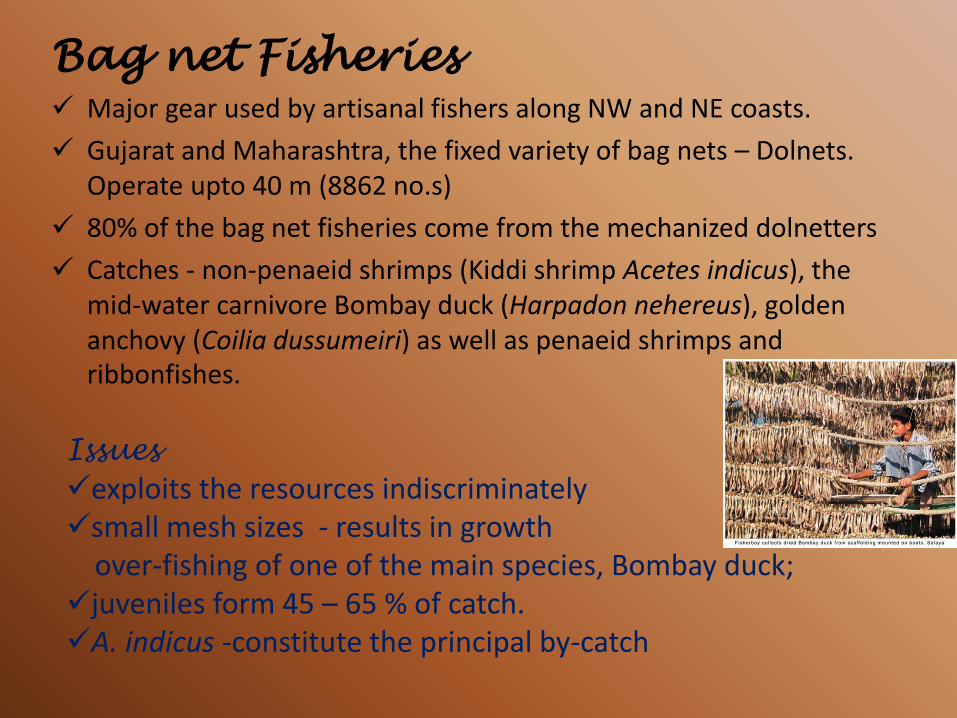
Bag net Fisheries
Major gear used by artisanal fishers along NW and NE coasts.
Gujarat and Maharashtra, the fixed variety of bag nets – Dolnets. Operate upto 40 m (8862 no.s)
80% of the bag net fisheries come from the mechanized dolnetters
Catches - non-penaeid shrimps (Kiddi shrimp Acetes indicus), the mid-water carnivore Bombay duck (Harpadon nehereus), golden anchovy (Coilia dussumeiri) as well as penaeid shrimps and ribbonfishes.
Issues
exploits the resources indiscriminately small mesh sizes - results in growth over-fishing of one of the main species, Bombay duck; juveniles form 45 – 65 % of catch. A. indicus -constitute the principal by-catch
Hooks and Line Fisheries
• Contributes - 2% of the all India marine fish catch
• Targets the large pelagic fishes such as sharks, tunas and barracudas.
• Regional modification and craft mechanisation
• Development schemes of the government has targeted promotion of H&L fisheries particularly the modern version of long line fishing for tunas.
• Many large shrimp trawlers in NE converted to longliners.

Artisanal Fisheries
Sector has dwindled with the advent of mechanization from 88 % in 1960 to 2 % recently
Innovative - with fishing gears, and to withstand competition from the mechanized sector, motorized their crafts, initially with outboard engines and lately with inboard engines as well.
Catamaran and plank built boats have been motorised
Bivalve fishery
• Clams and mussels mainly in inland waters and bays; hand picking and by dredge.
• Meat is also sold both in internal markets as well as to export processing plants
• Kerala leads India in the production of clams with estimated annual landings of about 66,000 tons (t) in 2008-09
• Estimated fishery from bivalves is approximately 1 lakh t.
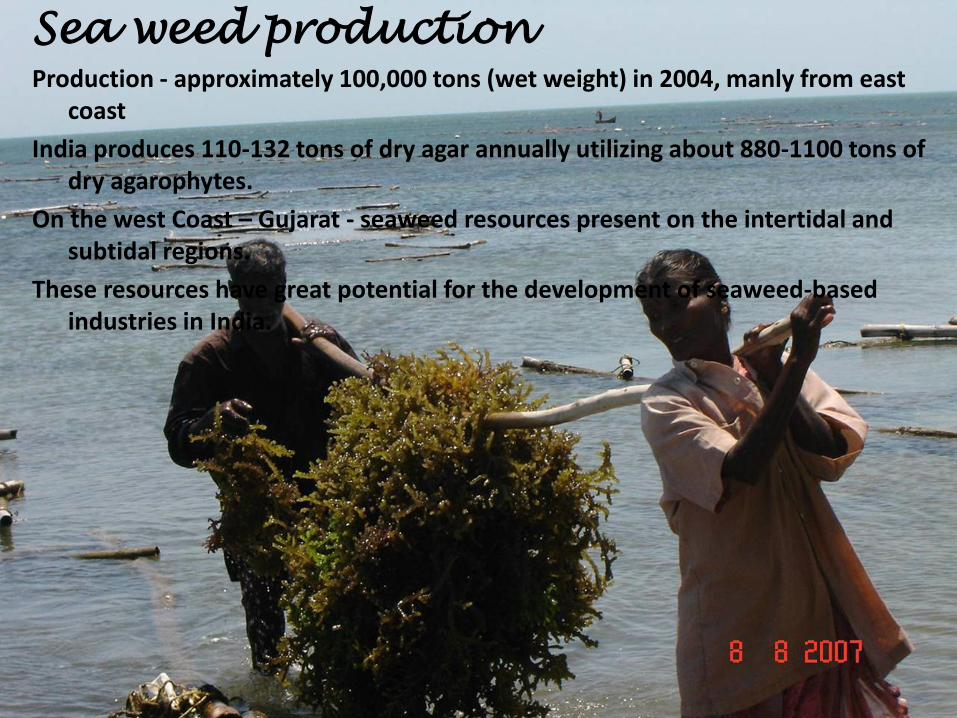
Sea weed production
Production - approximately 100,000 tons (wet weight) in 2004, manly from east coast
India produces 110-132 tons of dry agar annually utilizing about 880-1100 tons of dry agarophytes.
On the west Coast – Gujarat - seaweed resources present on the intertidal and subtidal regions.
These resources have great potential for the development of seaweed-based industries in India.

Top-ten Resources by Value (Landing centre prices)
Rank Resource/ Stock Rs. Billion US$ Million
1 Penaeid shrimps 43.4 964.4
2 Sardines 10.7 237.8
3 Cephalopods 9.0 200.0
4 Seerfishes 6.0 133.4
5 Pomfrets 5.8 128.9
6 Croakers 4.6 102.2
7 Carangids 4.6 102.2
8 Mackerel 3.9 86.7
9 Perches 3.9 86.7
10 Bombay duck 2.5 55.6
Others 15.6 346.7
TOTAL 110.1 2446.7

0
100
200
300
400
500
600
700
800
900
19
61
-62
19
63
-64
19
65
-66
19
67
-68
19
69
-70
19
71
-72
19
73
-74
19
75
-76
19
77
-78
19
79
-80
19
81
-82
19
83
-84
19
85
-86
19
87
-88
19
89
-90
19
91
-92
19
93
-94
19
95
-96
19
97
-98
19
99
-00
20
01
-02
20
03
-04
20
05
-06
20
07
-08
20
09
-10
Marine products export growth
Quantity (in '000 t)
2.84 billion US $ (2010-11)

Regulatory Measures Include
• Closed season
• Closed fishing areas
• Marine Protected Areas (MPAs)
• Protected Species
• Ban on certain destructive fishing gears and methods
• Minimum mesh size regulation
• Minimum legal size at capture
• Use of Turtle Excluder Device (TED) in trawls in Orissa
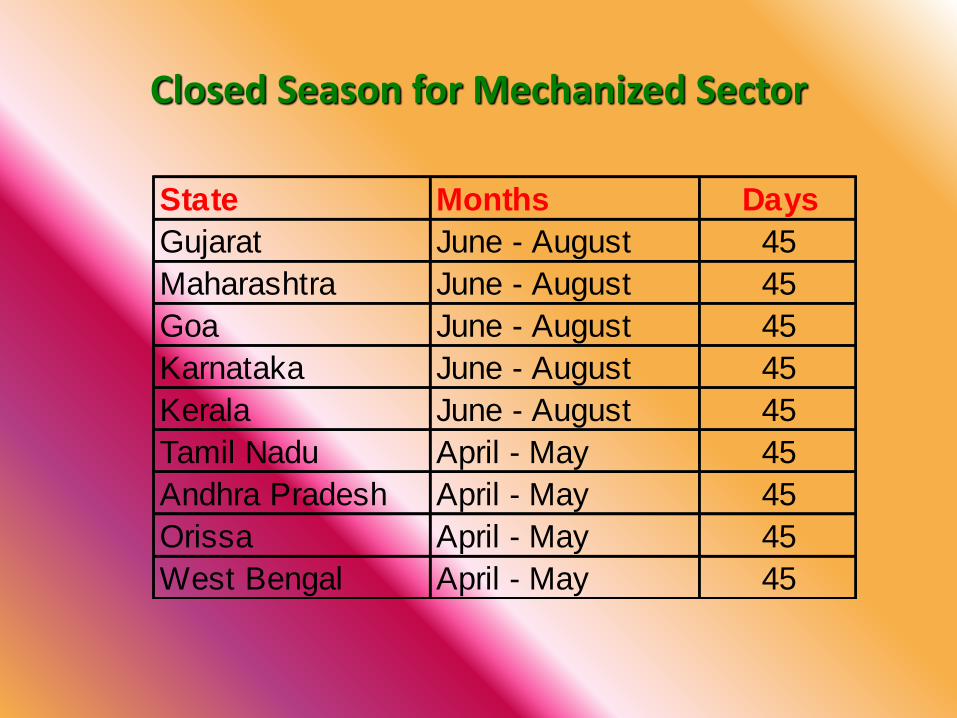
Closed Season for Mechanized Sector
State Months Days
Gujarat June - August 45
Maharashtra June - August 45
Goa June - August 45
Karnataka June - August 45
Kerala June - August 45
Tamil Nadu April - May 45
Andhra Pradesh April - May 45
Orissa April - May 45
West Bengal April - May 45

Spatial Closures
State Reserved for
traditional vessels
Available to mechanized vessels
Goa Up to 5 km Beyond 5 km
Kerala Up to 10 km <25 GRT: 10-22 km; >25 GRT: beyond 23 km
Karnataka Up to 6 km <15m LOA: 6-20 km; >15m LOA: beyond 20 km
Maharashtra Up to 5-10 fathom Beyond 10 fathom depth
Tamil Nadu Up to 3.4 nautical miles Beyond to 3.4 nautical miles
Andhra Pradesh Up to 10 km <20m LOA: 10-23 km; >20m LOA: beyond 23 km
Orissa Up to 5 km <15m LOA: 5-10km; >15m LOA: beyond 20 km

MARINE PROTECTED AREAS (MPAs)
• Currently, there are 31 MPAs (majority in A&N)
• The current area under MPAs is 6.16 per cent of the area in the coastal biogeographic, which is proposed to be expanded to 7.12 per cent
• Oil wells in Bombay High and Godavari Basin also function as MPAs

Protected Species (under Indian Wildlife (Protection) Act, 1972
Species/ Group Number
Molluscs 24 species
Elasmobranchs 10 species
Grouper fish 1 species
Sea horses All species
Sea Cucumber All species
Sponges and seafans All species
Corals All species
Turtles All 5 species
Whales, dolphins, sea cow All species
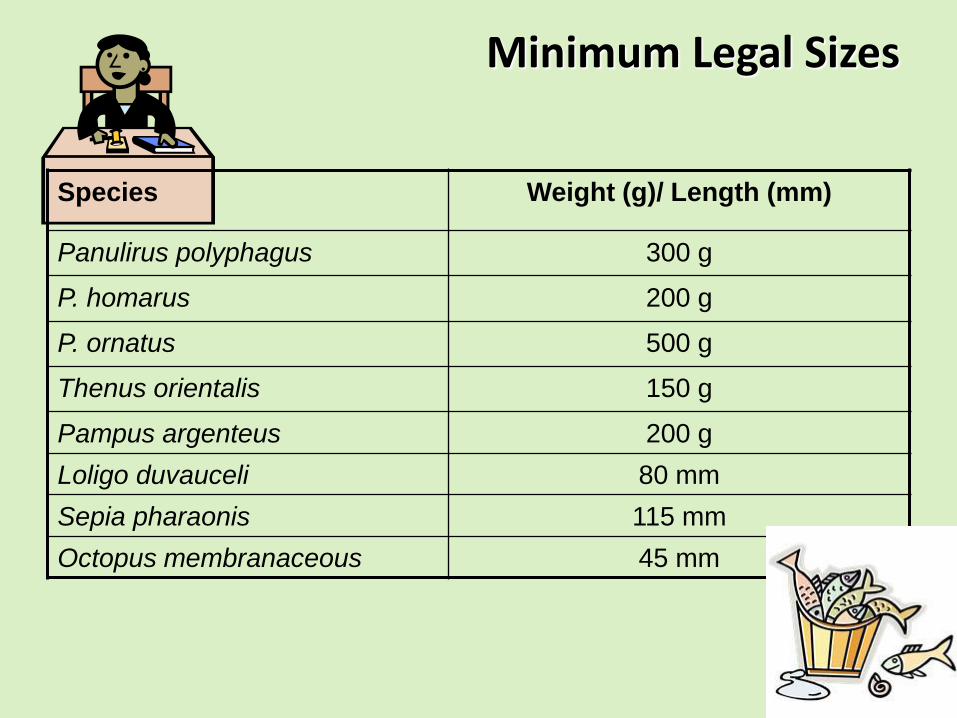
Minimum Legal Sizes
Species Weight (g)/ Length (mm)
Panulirus polyphagus 300 g
P. homarus 200 g
P. ornatus 500 g
Thenus orientalis 150 g
Pampus argenteus 200 g
Loligo duvauceli 80 mm
Sepia pharaonis 115 mm
Octopus membranaceous 45 mm

Ban on Destructive Fishing Methods
• Dynamite fishing
• Cyanide poisoning
• Pair trawling in GoM and Palk Bay
• Thalluvalai (minitrawl) in GoM and Palk Bay
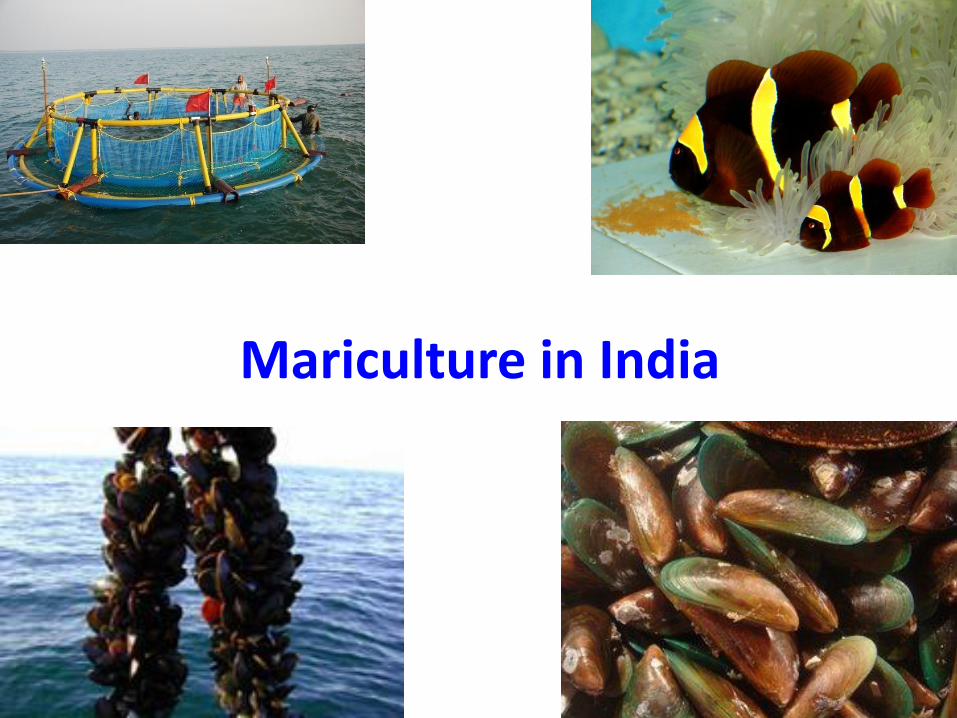
Mariculture in India
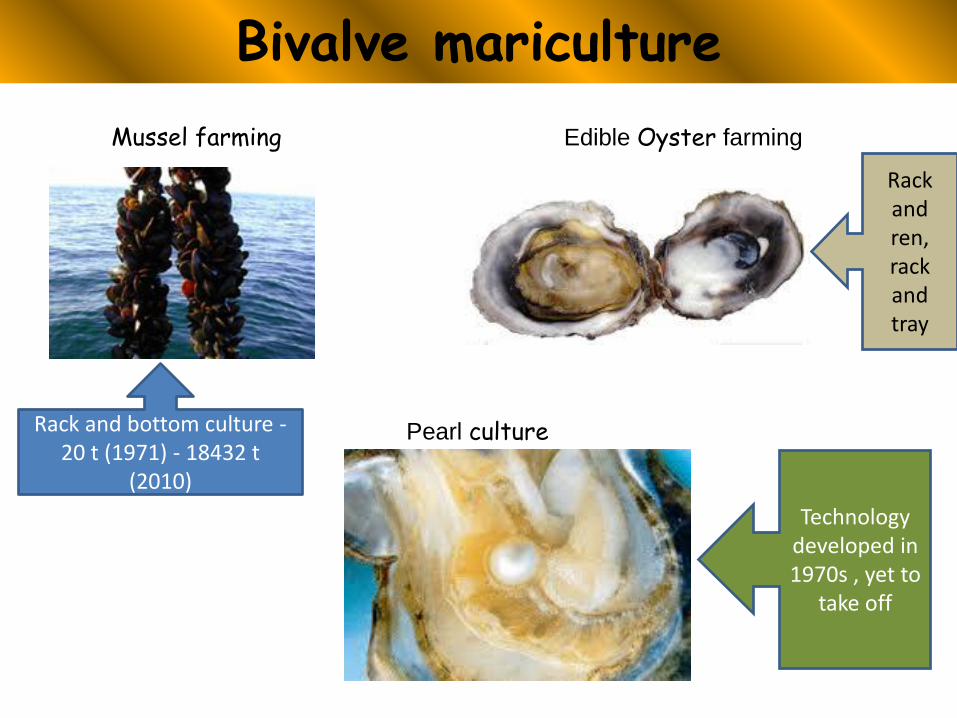
Bivalve mariculture
Mussel farming Edible Oyster farming
Pearl culture Rack and bottom culture -20 t (1971) - 18432 t
(2010)
Rack and ren, rack and tray
Technology developed in 1970s , yet to
take off
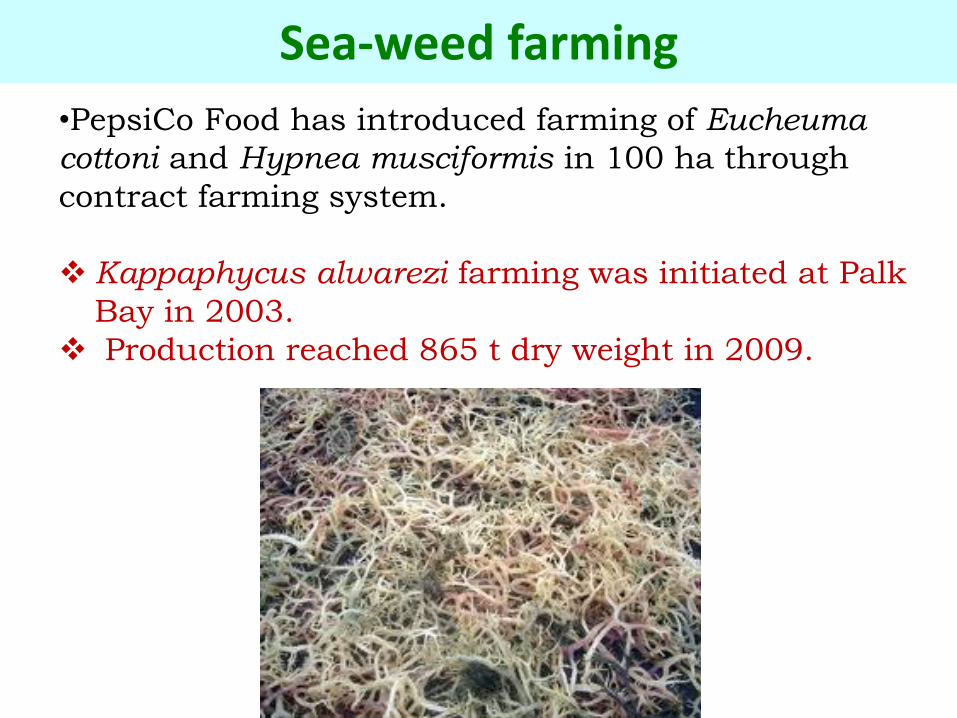
Sea-weed farming
•PepsiCo Food has introduced farming of Eucheuma
cottoni and Hypnea musciformis in 100 ha through
contract farming system.
Kappaphycus alwarezi farming was initiated at Palk
Bay in 2003.
Production reached 865 t dry weight in 2009.

Cage farming
CMFRI has been successful in demonstrating open sea cage farming of lobster
and Asian Sea bass at different parts of Indian coast with the support of NFDB
and fishermen societies and is targeting to harvest one lakh tonne of fish
through open sea cage farming

Lobsters harvested from cage

Hatchery production of finfish seed
CMFRI has been able to
successfully breed Cobia –
Rachycentron canadum in
captivity
Hatchery production technology
of Asian sea bass
(Lates calcarifer) has been
standardised by CIBA
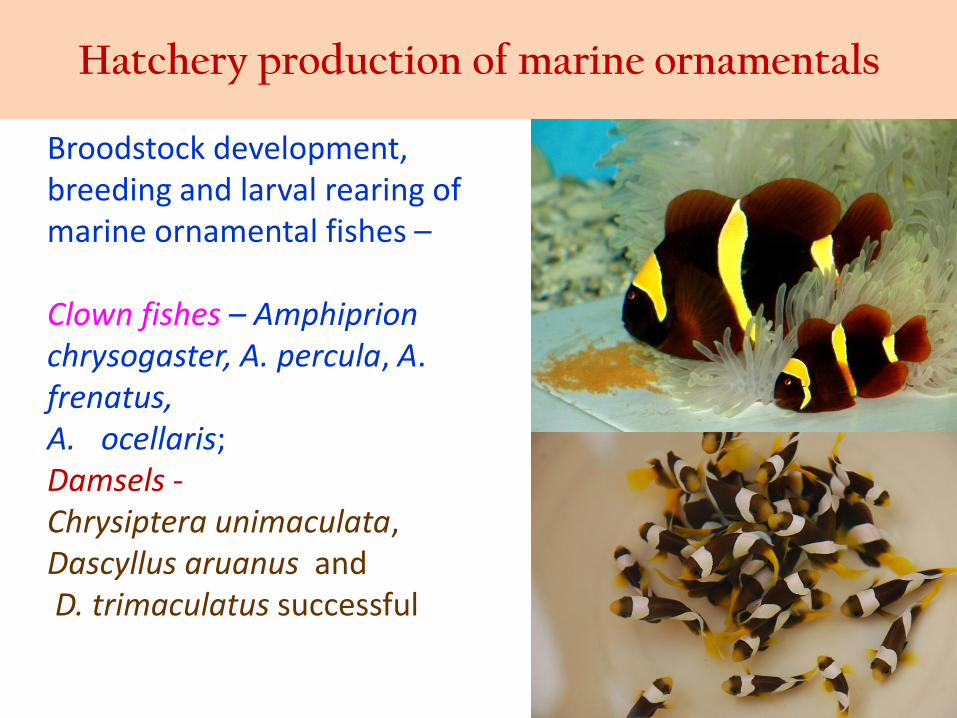
Hatchery production of marine ornamentals
Broodstock development, breeding and larval rearing of marine ornamental fishes – Clown fishes – Amphiprion chrysogaster, A. percula, A. frenatus, A. ocellaris; Damsels - Chrysiptera unimaculata, Dascyllus aruanus and D. trimaculatus successful

Issues
• Declining catches and overfishing in coastal waters (open access, c/e of demersals reduced , FDMFW
SE coast etc
• Post-harvest losses (discard, spoilage, reduced quality
• Habitat degradation (industrial waste, domestic
sewage, pestcdes etc
• Climate change
• Illegal, unreported and unregulated landings
• Poor implementation of regulations (eg; mesh
size
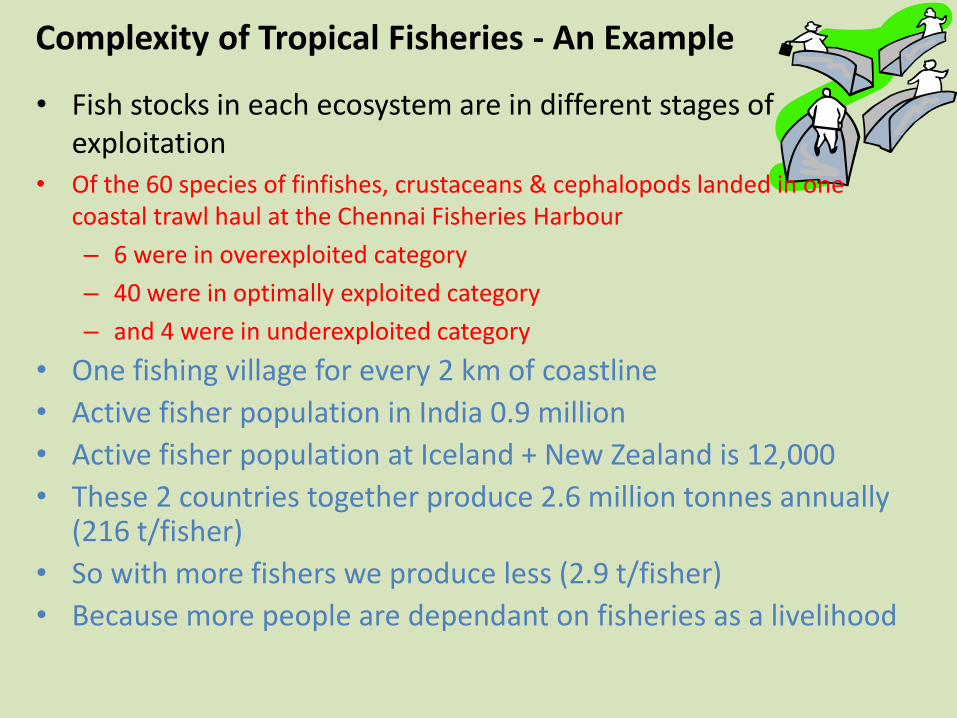
Complexity of Tropical Fisheries - An Example
• Fish stocks in each ecosystem are in different stages of exploitation
• Of the 60 species of finfishes, crustaceans & cephalopods landed in one coastal trawl haul at the Chennai Fisheries Harbour
– 6 were in overexploited category
– 40 were in optimally exploited category
– and 4 were in underexploited category
• One fishing village for every 2 km of coastline
• Active fisher population in India 0.9 million
• Active fisher population at Iceland + New Zealand is 12,000
• These 2 countries together produce 2.6 million tonnes annually (216 t/fisher)
• So with more fishers we produce less (2.9 t/fisher)
• Because more people are dependant on fisheries as a livelihood

Future Plans
Fisheries sustainability
Unlike other resources invisible, diverse, migratory, seasonal, its own dynamics as well as anthropogenic and climatic impacts
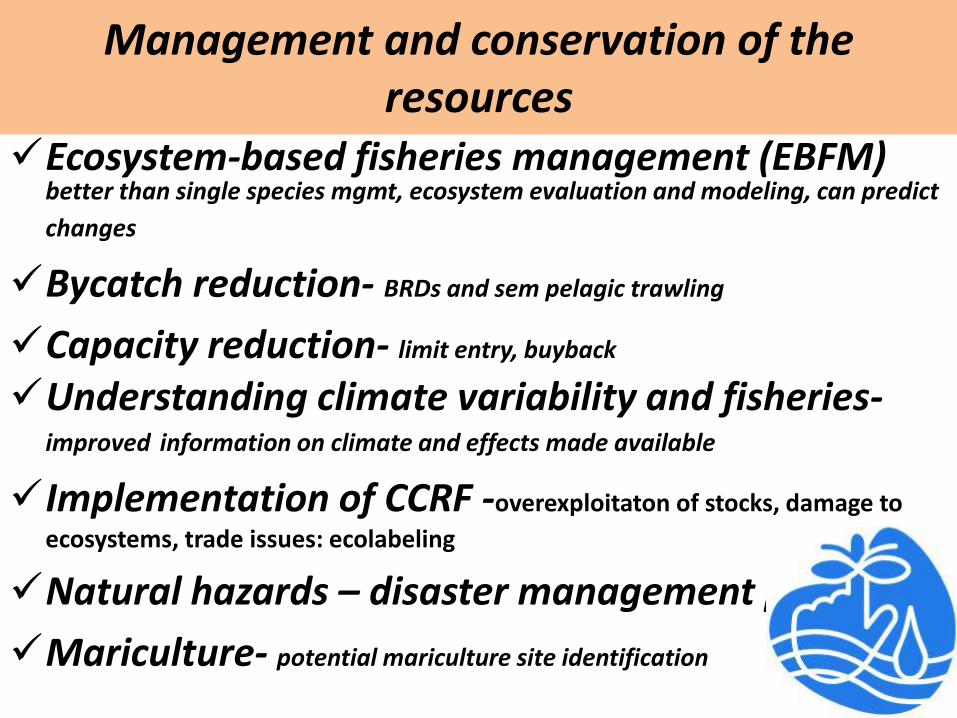
Management and conservation of the
resources
Ecosystem-based fisheries management (EBFM) better than single species mgmt, ecosystem evaluation and modeling, can predict
changes
Bycatch reduction- BRDs and sem pelagic trawling
Capacity reduction- limit entry, buyback
Understanding climate variability and fisheries-improved information on climate and effects made available
Implementation of CCRF -overexploitaton of stocks, damage to
ecosystems, trade issues: ecolabeling
Natural hazards – disaster management plans
Mariculture- potential mariculture site identification
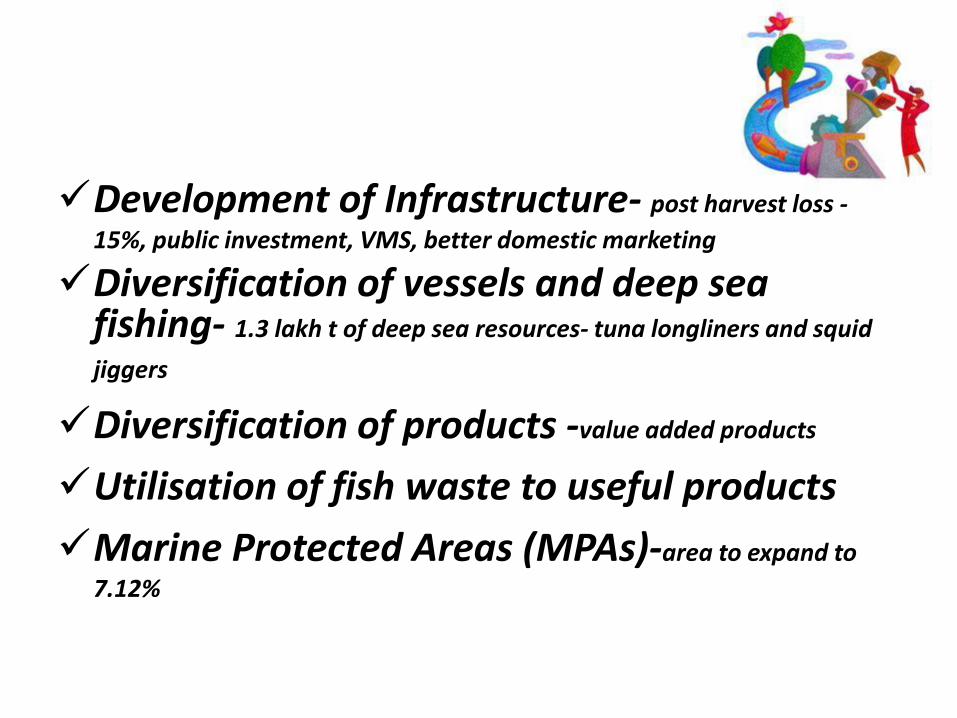
Development of Infrastructure- post harvest loss -
15%, public investment, VMS, better domestic marketing
Diversification of vessels and deep sea fishing- 1.3 lakh t of deep sea resources- tuna longliners and squid
jiggers
Diversification of products -value added products
Utilisation of fish waste to useful products
Marine Protected Areas (MPAs)-area to expand to
7.12%

Habitat degradation
• water contamination
• enforcement of standards for water discharge
• maintaining the quality of river runoff
• reducing greenhouse gas emissions
• ? -----
Also to look into -

Compliance to FAO CCRF
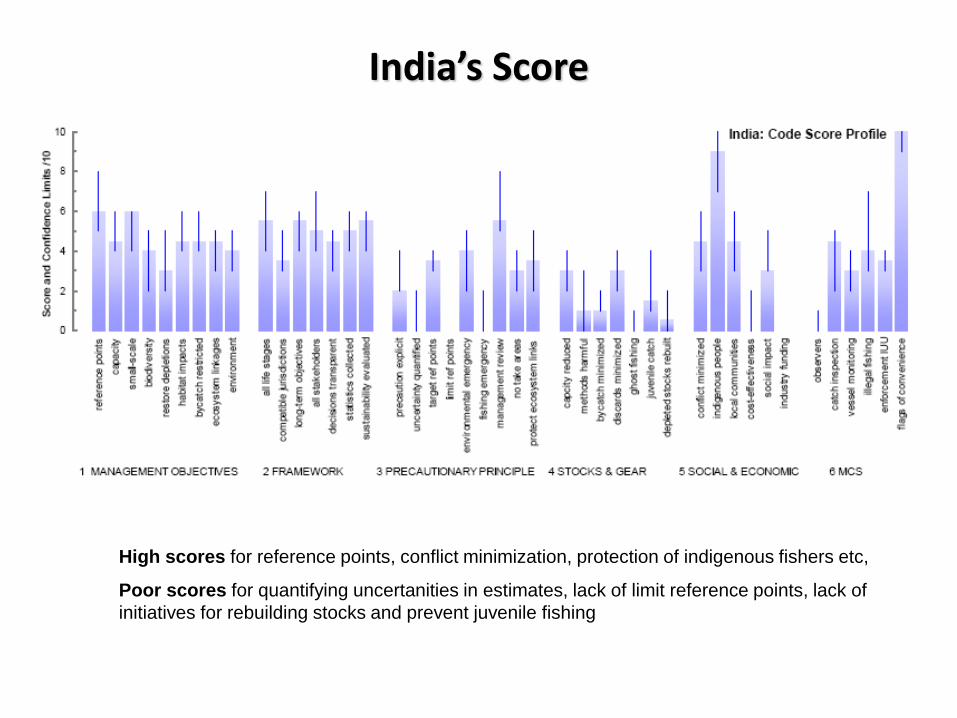
India’s Score
High scores for reference points, conflict minimization, protection of indigenous fishers etc,
Poor scores for quantifying uncertanities in estimates, lack of limit reference points, lack of
initiatives for rebuilding stocks and prevent juvenile fishing

36

The Sunken Billions: The Economic Justification for fisheries Reform- World Bank report, 2008
• This study concludes that marine capture fisheries are an underperforming global asset.
• The difference between the potential and actual net economic benefits from marine fisheries is in the order of $50 billion per year.
• India can very well capture $2 billion per year from marine fisheries by way of fisheries reforms and improved governance


![NATIONAL MARINE FISHERIES SERVICE …...NATIONAL MARINE FISHERIES SERVICE INSTRUCTIONS 01-101-03 [9/30/2015] Fisheries Management Fisheries Management Actions, NMFSPD -01-101 OPERATIONAL](https://static.fdocuments.net/doc/165x107/5f0d46657e708231d4398972/national-marine-fisheries-service-national-marine-fisheries-service-instructions.jpg)


![appraisal marine fisheries gujarat - [email protected] - Central Marine](https://static.fdocuments.net/doc/165x107/620624468c2f7b173004d426/appraisal-marine-fisheries-gujarat-emailprotected-central-marine.jpg)