
Overview of Globalization and its Impacts on Inequality · Overview of Globalization and its...
31
Overview of Globalization and its Impacts on Inequality Donald Low Vice President, Economic Society of Singapore
Transcript of Overview of Globalization and its Impacts on Inequality · Overview of Globalization and its...
Overview of Globalization and its Impacts on Inequality
Donald Low
Vice President,
Economic Society of Singapore
Outline
• Trends in inequality
• What’s driving it?
• Government perspectives on inequality
• New perspectives on inequality
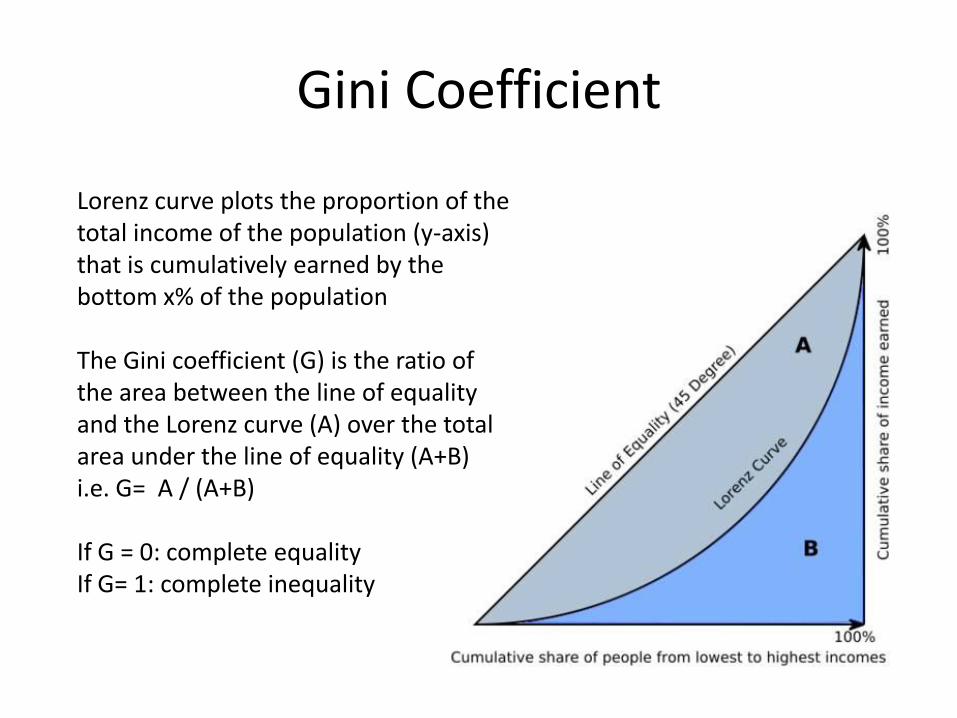
Gini Coefficient
Lorenz curve plots the proportion of the total income of the population (y-axis) that is cumulatively earned by the bottom x% of the population
The Gini coefficient (G) is the ratio of the area between the line of equality and the Lorenz curve (A) over the total area under the line of equality (A+B) i.e. G= A / (A+B)
If G = 0: complete equalityIf G= 1: complete inequality
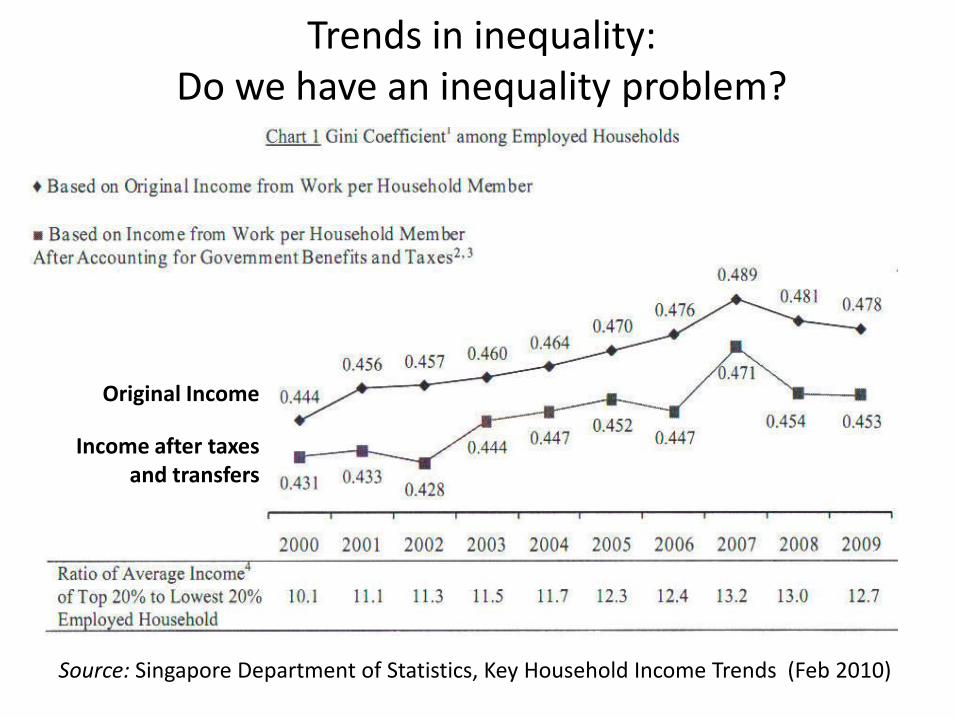
Trends in inequality: Do we have an inequality problem?
Original Income
Income after taxes and transfers
Source: Singapore Department of Statistics, Key Household Income Trends (Feb 2010)
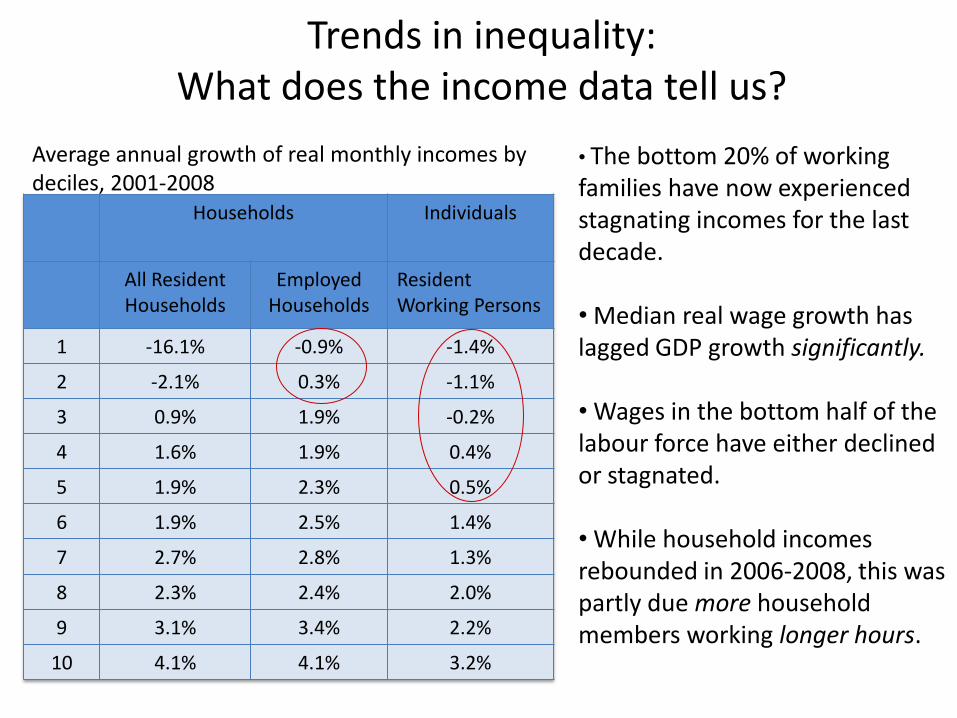
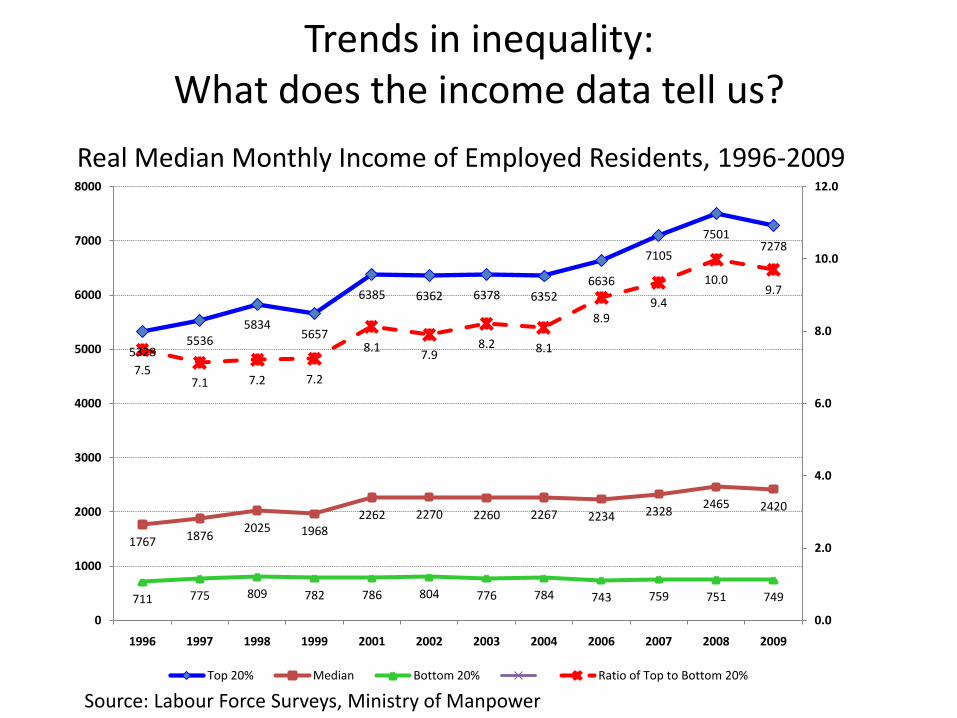
Trends in inequality: What does the income data tell us?
• The bottom 20% of working families have now experienced stagnating incomes for the last decade.
• Median real wage growth has lagged GDP growth significantly.
• Wages in the bottom half of the labour force have either declined or stagnated.
• While household incomes rebounded in 2006-2008, this was partly due more household members working longer hours.
Households Individuals
All ResidentHouseholds
EmployedHouseholds
ResidentWorking Persons
1 -16.1% -0.9% -1.4%
2 -2.1% 0.3% -1.1%
3 0.9% 1.9% -0.2%
4 1.6% 1.9% 0.4%
5 1.9% 2.3% 0.5%
6 1.9% 2.5% 1.4%
7 2.7% 2.8% 1.3%
8 2.3% 2.4% 2.0%
9 3.1% 3.4% 2.2%
10 4.1% 4.1% 3.2%
Average annual growth of real monthly incomes by deciles, 2001-2008
Trends in inequality: What does the income data tell us?
53285536
58345657
6385 6362 6378 63526636
7105
75017278
1767 18762025 1968
2262 2270 2260 2267 2234 23282465 2420
711 775 809 782 786 804 776 784 743 759 751 749
7.57.1 7.2 7.2
8.17.9
8.2 8.1
8.99.4
10.09.7
0.0
2.0
4.0
6.0
8.0
10.0
12.0
0
1000
2000
3000
4000
5000
6000
7000
8000
1996 1997 1998 1999 2001 2002 2003 2004 2006 2007 2008 2009
Top 20% Median Bottom 20% Ratio of Top to Bottom 20%
Real Median Monthly Income of Employed Residents, 1996-2009
Source: Labour Force Surveys, Ministry of Manpower
Trends in inequality: What does the income data tell us?
City USD/hour
(net)
USD/hour
(gross)*
Amsterdam 13.50 20.70
Auckland 8.40 10.60
Barcelona 11.60 14.40
Frankfurt 14.50 22.10
Geneva 20.40 29.20
Hong Kong 8.00 8.80
Kuala Lumpur 5.10 6.70
London 13.90 18.00
Los Angeles 17.40 23.90
Moscow 5.90 6.90
New York 19.90 26.10
Seoul 6.10 8.00
Shanghai 3.00 3.90
Singapore 5.90 7.10
Taipei 6.70 7.70
Tel Aviv 8.60 10.30
Tokyo 15.70 19.40
Toronto 12.80 17.10
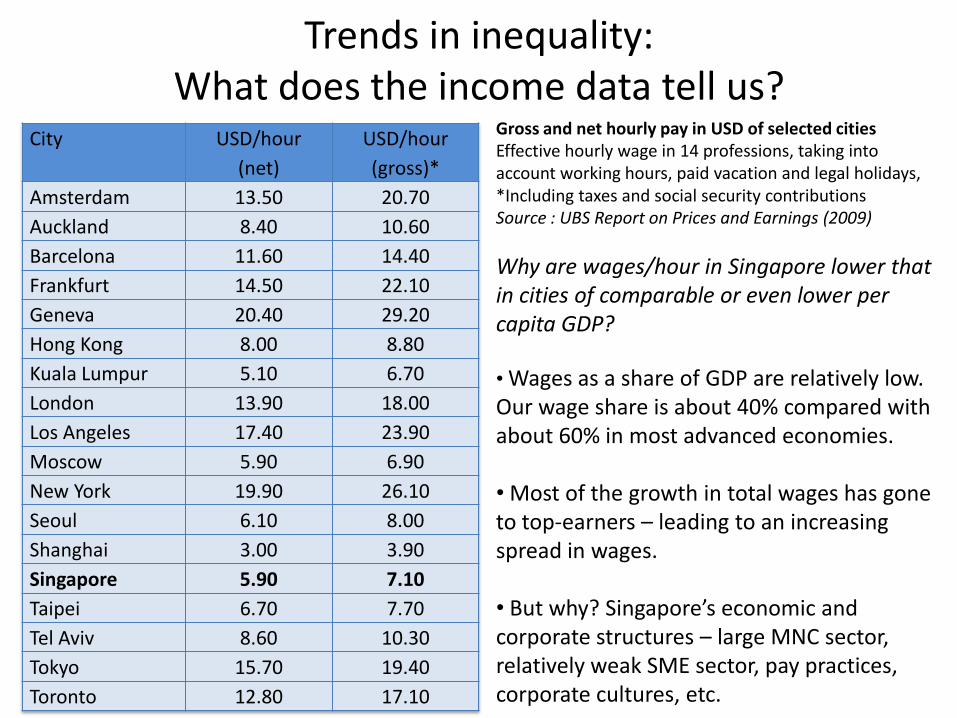
Gross and net hourly pay in USD of selected citiesEffective hourly wage in 14 professions, taking into account working hours, paid vacation and legal holidays,*Including taxes and social security contributionsSource : UBS Report on Prices and Earnings (2009)
Why are wages/hour in Singapore lower that in cities of comparable or even lower per capita GDP?
• Wages as a share of GDP are relatively low. Our wage share is about 40% compared with about 60% in most advanced economies.
• Most of the growth in total wages has gone to top-earners – leading to an increasing spread in wages.
• But why? Singapore’s economic and corporate structures – large MNC sector, relatively weak SME sector, pay practices, corporate cultures, etc.
Trends in inequality: The experience elsewhere
Earliest Most recent
Average annual change
Nordic Social Market EconomiesDenmark (1987-97)Finland (1987-00)Norway (1979-00)Sweden (1981-00)
22.125.420.922.319.7
25.225.724.725.125.2
.03
.29
.13
.29
Continental Social Market EconomiesAustria (1987-97)Belgium (1985-00)Germany (1981-00)Netherlands (1983-99)Switzerland (1982-92)France (1979-94)
25.322.722.724.426.030.929.3
26.726.627.726.424.830.728.8
.39
.33
.11-.08-.02 -.03
Liberal Market EconomiesAustralia (1981-94)Canada (1981-00)Ireland (1987-00)United Kingdom (1979-99)United States (1979-00)
29.328.128.432.827.030.1
33.031.130.232.334.536.8
.23
.09-.04.38.32
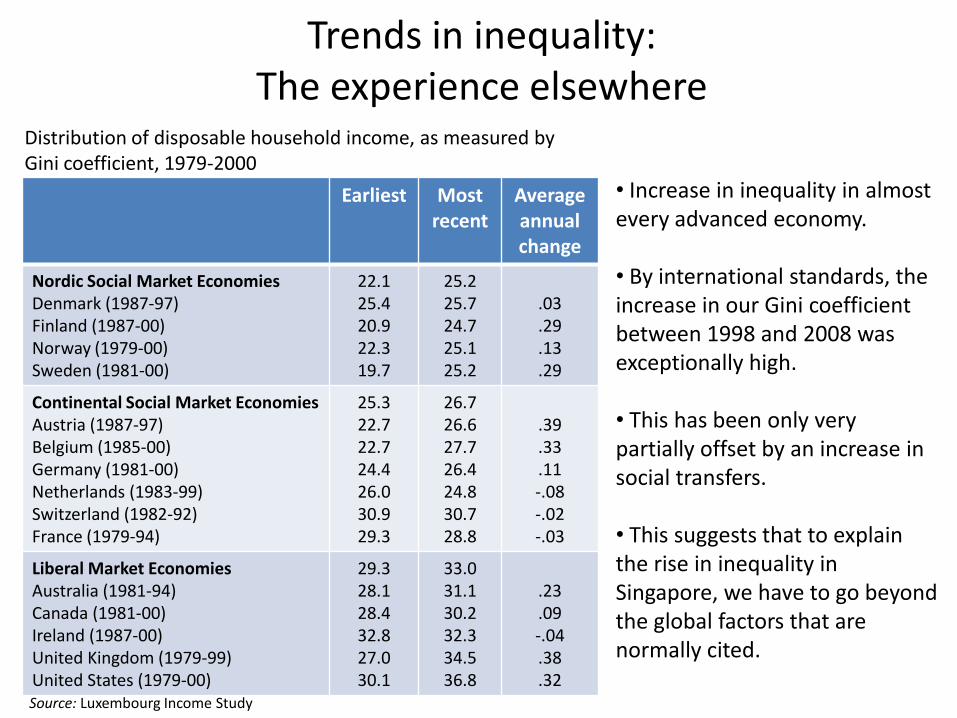
Distribution of disposable household income, as measured by Gini coefficient, 1979-2000
• Increase in inequality in almost every advanced economy.
• By international standards, the increase in our Gini coefficient between 1998 and 2008 was exceptionally high.
• This has been only very partially offset by an increase in social transfers.
• This suggests that to explain the rise in inequality in Singapore, we have to go beyond the global factors that are normally cited.
Source: Luxembourg Income Study
Trends in inequality: The rise of the (super) rich in the US
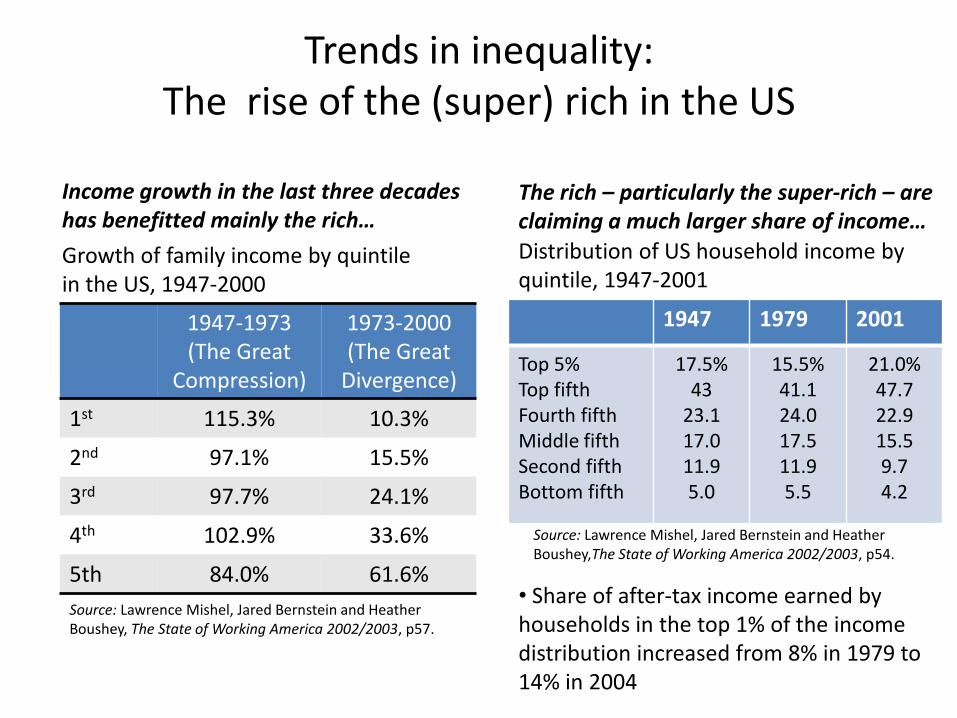
Distribution of US household income by quintile, 1947-2001
1947 1979 2001
Top 5%Top fifthFourth fifthMiddle fifthSecond fifthBottom fifth
17.5%43
23.117.011.95.0
15.5%41.124.017.511.95.5
21.0%47.722.915.59.74.2
Growth of family income by quintile in the US, 1947-2000
1947-1973(The Great
Compression)
1973-2000(The Great
Divergence)
1st 115.3% 10.3%
2nd 97.1% 15.5%
3rd 97.7% 24.1%
4th 102.9% 33.6%
5th 84.0% 61.6%
Source: Lawrence Mishel, Jared Bernstein and Heather Boushey, The State of Working America 2002/2003, p57.
Source: Lawrence Mishel, Jared Bernstein and Heather Boushey,The State of Working America 2002/2003, p54.
Income growth in the last three decades has benefitted mainly the rich…
The rich – particularly the super-rich – are claiming a much larger share of income…
• Share of after-tax income earned by households in the top 1% of the income distribution increased from 8% in 1979 to 14% in 2004
Trends in inequality: The rise of the (super) rich in the US
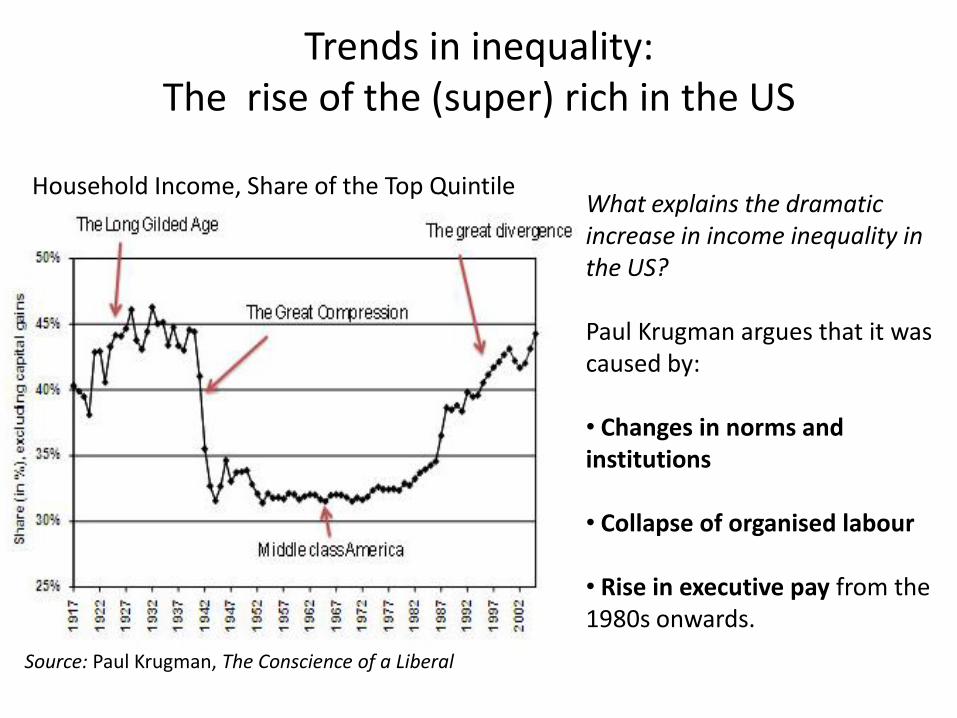
Household Income, Share of the Top Quintile What explains the dramatic increase in income inequality in the US?
Paul Krugman argues that it was caused by:
• Changes in norms and institutions
• Collapse of organised labour
• Rise in executive pay from the 1980s onwards.
Source: Paul Krugman, The Conscience of a Liberal
What’s driving it?Trade and globalisation
• Trade liberalisation and the entry of large numbers of surplus labour from previously closed economies into the global economy
• China is already deeply embedded in global supply chains and as it moves up the value-added ladder, it will confront higher wage-producers with the choice of increasing productivity or forcing their costs down.
• India’s success in exporting higher-skilled “knowledge” services has expanded the scope of globalisation, bringing wage competition to an even larger share of an advanced economy’s workforce.
What’s driving it?Is China at a Lewis Turning Point?
• Arthur Lewis argued in 1954 that for countries with large pools of surplus labour from their rural hinterland, wages in the cities do not need to increase to attract more workers from the countryside.
• But eventually, the economy will reach a turning point. The capitalist enclaves would reach so deeply into the country’s labour force that labour demand would outstrip supply. Beyond this point, wages in cities have to start rising to attract more migrant workers.
• Has China reached this point?
What’s driving it?Technology
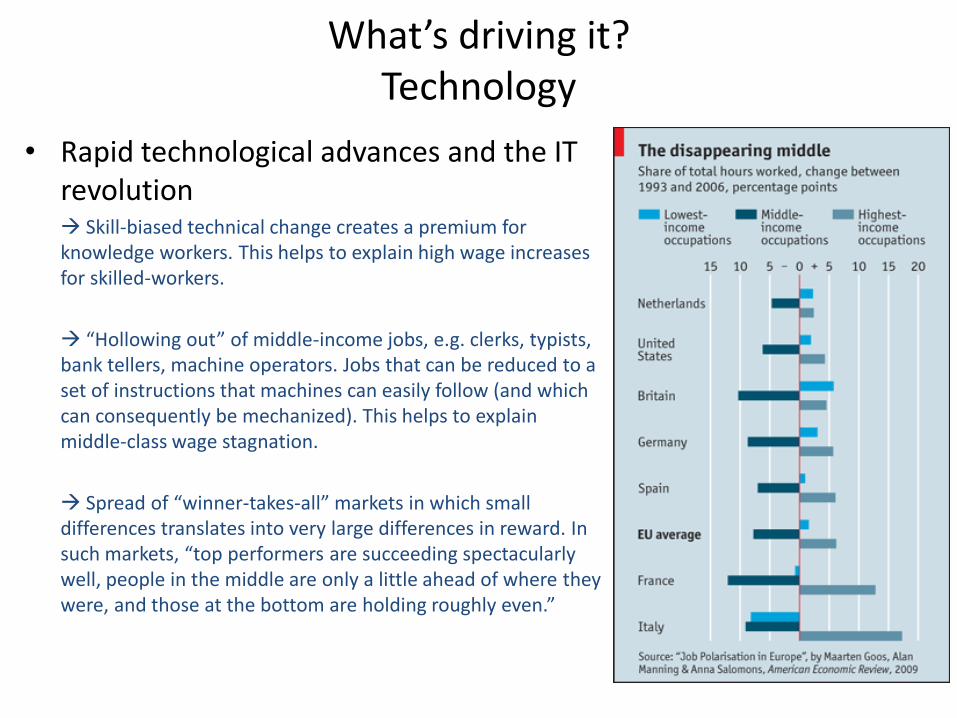
• Rapid technological advances and the IT revolution Skill-biased technical change creates a premium for knowledge workers. This helps to explain high wage increases for skilled-workers.
“Hollowing out” of middle-income jobs, e.g. clerks, typists, bank tellers, machine operators. Jobs that can be reduced to a set of instructions that machines can easily follow (and which can consequently be mechanized). This helps to explain middle-class wage stagnation.
Spread of “winner-takes-all” markets in which small differences translates into very large differences in reward. In such markets, “top performers are succeeding spectacularly well, people in the middle are only a little ahead of where they were, and those at the bottom are holding roughly even.”
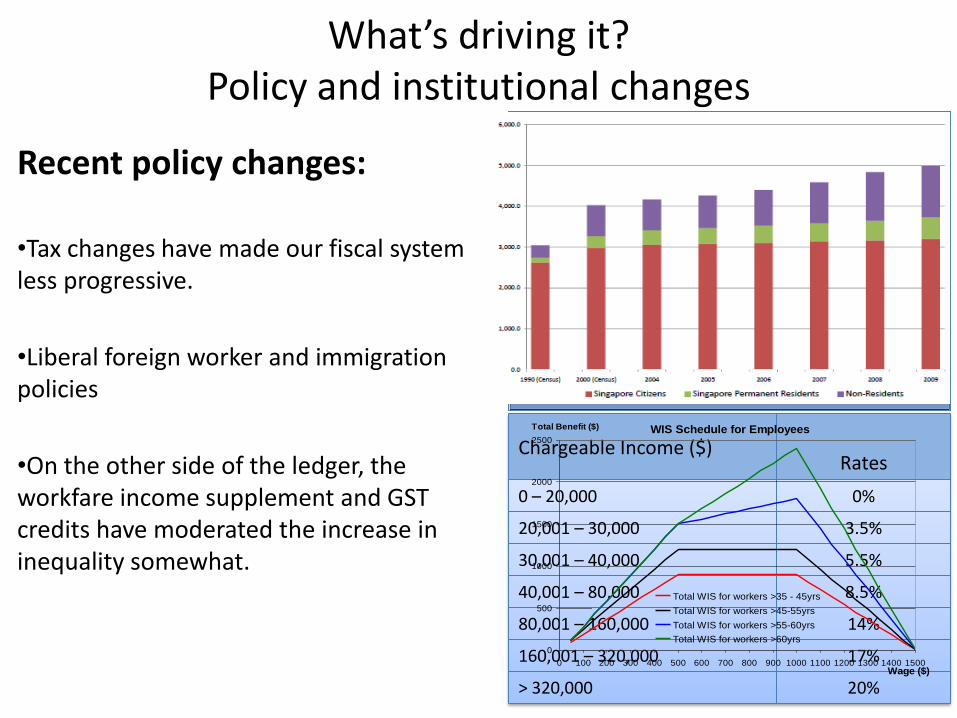
What’s driving it?Policy and institutional changes
Recent policy changes:
•Tax changes have made our fiscal system less progressive.
•Liberal foreign worker and immigration policies
•On the other side of the ledger, the workfare income supplement and GST credits have moderated the increase in inequality somewhat.
Chargeable Income ($)Rates
0 – 20,000 0%
20,001 – 30,000 3.5%
30,001 – 40,000 5.5%
40,001 – 80,000 8.5%
80,001 – 160,000 14%
160,001 – 320,000 17%
> 320,000 20%
WIS Schedule for Employees
0
500
1000
1500
2000
2500
0 100 200 300 400 500 600 700 800 900 1000 1100 1200 1300 1400 1500Wage ($)
Total Benefit ($)
Total WIS for workers >35 - 45yrs
Total WIS for workers >45-55yrs
Total WIS for workers >55-60yrs
Total WIS for workers >60yrs
In defence of inequality…
• “We don’t have an inequality problem”– It’s a statistical illusion caused by population ageing, smaller household sizes,
the fact that the data is not longitudinal, etc.
– It’s not a problem as long as we provide (equal) opportunities for Singaporeans, primarily through education.
– It’s not a problem as long as incomes across the board are rising.
• “It’s a global phenomenon”– Rising inequality is driven by the forces of trade and technology, which bring
overall benefits to Singapore.
– It’s foolish to insulate Singaporeans from global competition.
• “Inequality is unavoidable if we want growth.”– Unequal rewards spur individual effort and enterprise.
– Lower growth does not mean a better distribution of income.
– Efforts to ameliorate inequality will sacrifice economic growth: they lower after-tax incomes, reduce incentives for people to work , reduce our attractiveness to talent and investment, and undermine fiscal discipline.
In defence of inequality…
“If we were able to choose, we would want to grow incomes without at the same time incomes becoming more unequal. If we were able to choose, that’s what we would want... The reality of course, is that to create jobs and opportunities for those with lower skills, we have to provide adequate incentive for those with the talents and entrepreneurial abilities and the skills, adequate incentive for them to work, earn better incomes, grow their wealth. That is the reality we face.”
“If we make it difficult for people who are able to seize opportunities in Asian markets and globally to make the most of their talents, if we make it difficult for them to earn their keep in Singapore and to feel that Singapore is a place where they can grow their business, grow opportunities, we will be unfortunately holding down the wages of the rest. And that’s the reality we face as a global city.”
Tharman Shanmugaratnam, Minister for FinanceEconomic Society of Singapore Annual Dinner 2010 Keynote Address
What’s been our approach?
• Promote social mobility by investing in education
The reason why we have been able to achieve uplift of such a large proportion of people who start off with disadvantaged backgrounds is because culture changes and education is about culture. Because we provide the incentive for everyone regardless of starting point to aim high, work hard for it, whether it’s academic studies or a sport that you’re good at, in order to get into the school of choice or the course you want to get into. It motivates people. It motivates the average family and it motivates the lower income family in a way that you don’t see in most other developed societies. Culture changes in response to incentives. And that is how we’ve succeeded in education, by keeping that culture of self-improvement and social mobility going through our schools and tertiary institutions.
Tharman Shanmugaratnam, Minister for FinanceEconomic Society of Singapore Annual Dinner 2010 Keynote Address
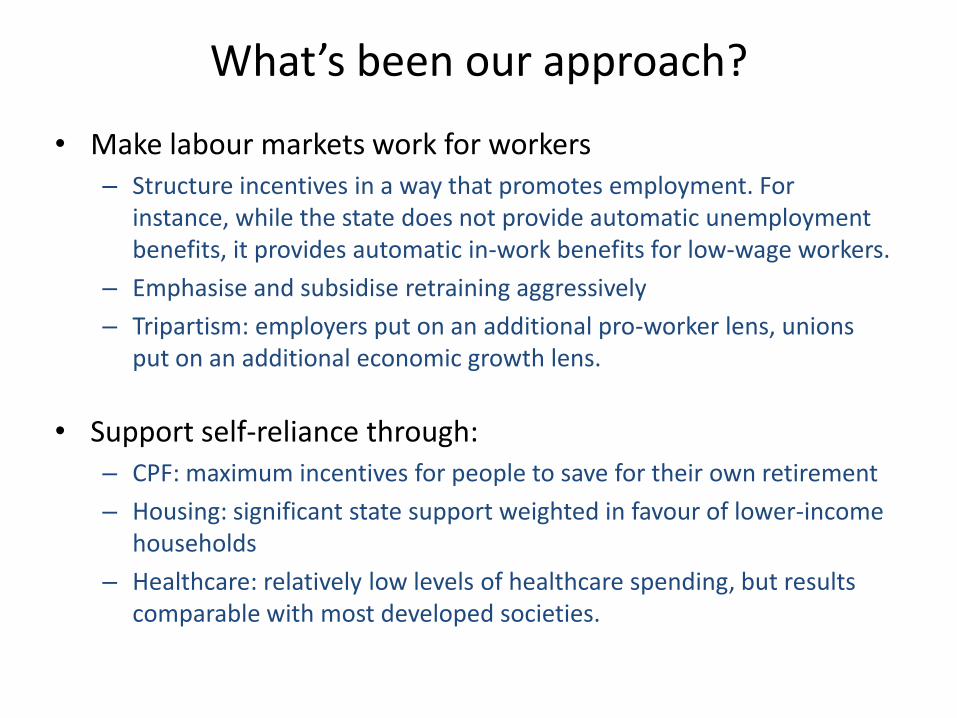
What’s been our approach?
• Make labour markets work for workers– Structure incentives in a way that promotes employment. For
instance, while the state does not provide automatic unemployment benefits, it provides automatic in-work benefits for low-wage workers.
– Emphasise and subsidise retraining aggressively
– Tripartism: employers put on an additional pro-worker lens, unions put on an additional economic growth lens.
• Support self-reliance through:– CPF: maximum incentives for people to save for their own retirement
– Housing: significant state support weighted in favour of lower-income households
– Healthcare: relatively low levels of healthcare spending, but results comparable with most developed societies.
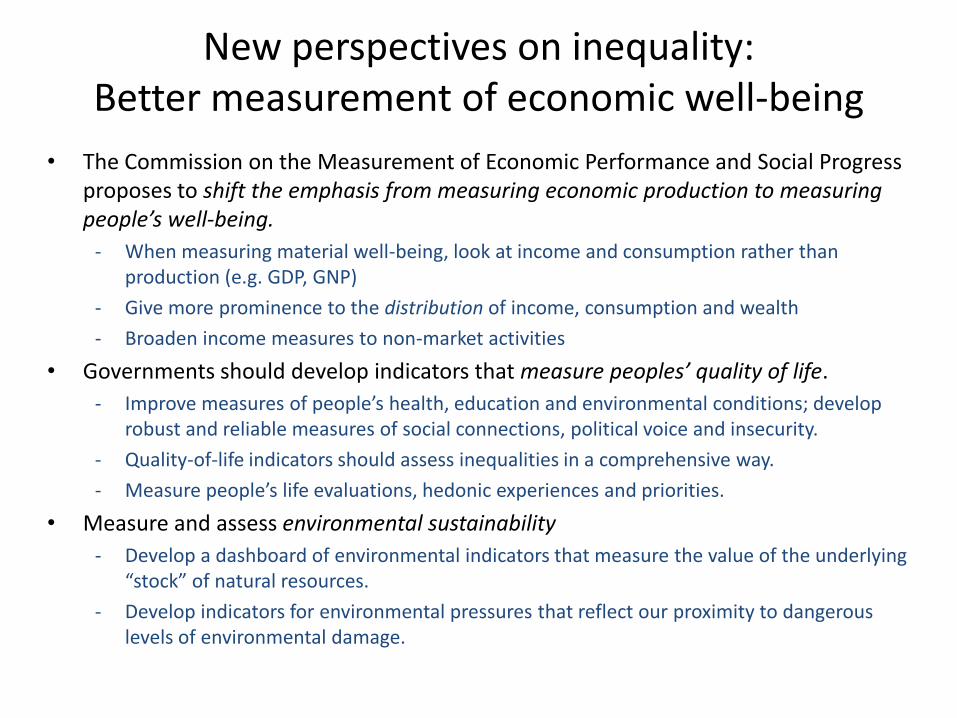
New perspectives on inequality:Better measurement of economic well-being
• The Commission on the Measurement of Economic Performance and Social Progress proposes to shift the emphasis from measuring economic production to measuring people’s well-being.
- When measuring material well-being, look at income and consumption rather than production (e.g. GDP, GNP)
- Give more prominence to the distribution of income, consumption and wealth
- Broaden income measures to non-market activities
• Governments should develop indicators that measure peoples’ quality of life.
- Improve measures of people’s health, education and environmental conditions; develop robust and reliable measures of social connections, political voice and insecurity.
- Quality-of-life indicators should assess inequalities in a comprehensive way.
- Measure people’s life evaluations, hedonic experiences and priorities.
• Measure and assess environmental sustainability
- Develop a dashboard of environmental indicators that measure the value of the underlying “stock” of natural resources.
- Develop indicators for environmental pressures that reflect our proximity to dangerous levels of environmental damage.
New perspectives on inequality:Better measurement of economic well-being
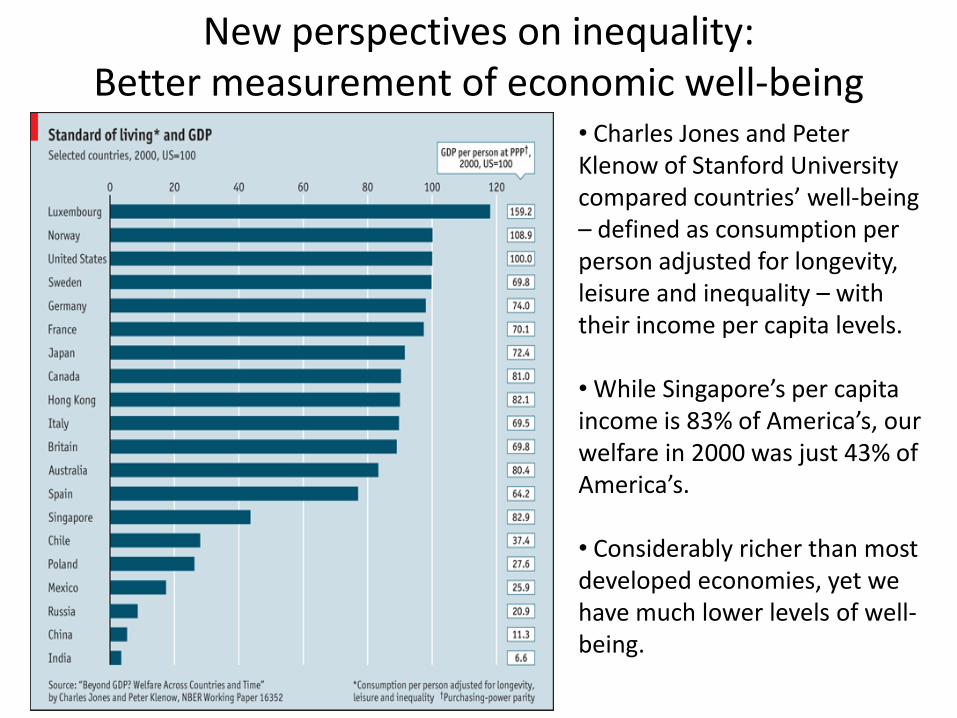
• Charles Jones and Peter Klenow of Stanford University compared countries’ well-being – defined as consumption per person adjusted for longevity, leisure and inequality – with their income per capita levels.
• While Singapore’s per capita income is 83% of America’s, our welfare in 2000 was just 43% of America’s.
• Considerably richer than most developed economies, yet we have much lower levels of well-being.
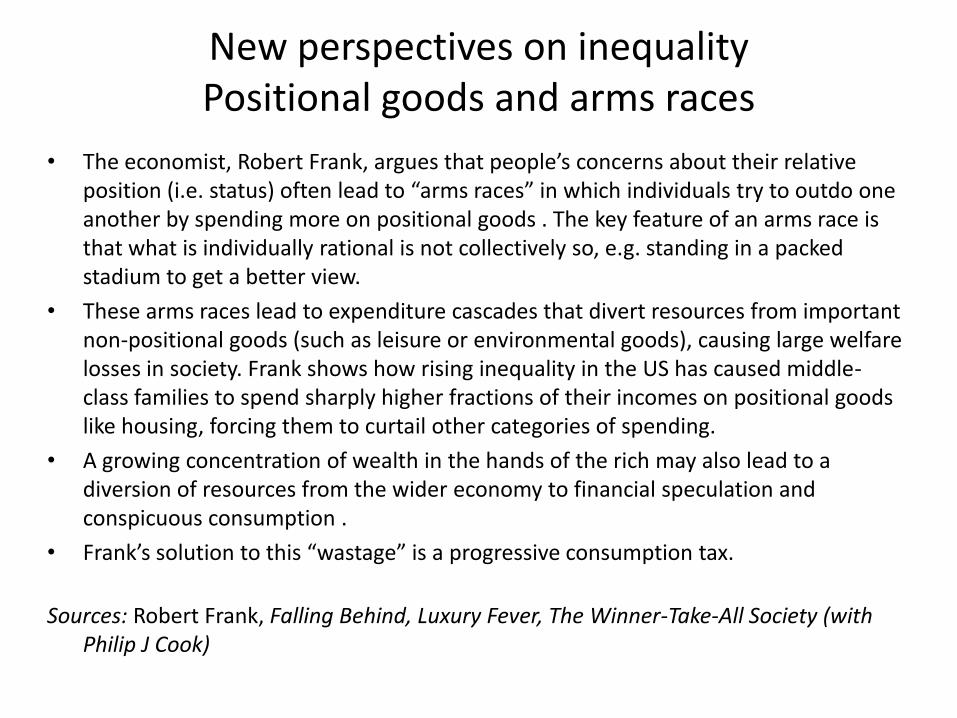
New perspectives on inequalityPositional goods and arms races
• The economist, Robert Frank, argues that people’s concerns about their relative position (i.e. status) often lead to “arms races” in which individuals try to outdo one another by spending more on positional goods . The key feature of an arms race is that what is individually rational is not collectively so, e.g. standing in a packed stadium to get a better view.
• These arms races lead to expenditure cascades that divert resources from important non-positional goods (such as leisure or environmental goods), causing large welfare losses in society. Frank shows how rising inequality in the US has caused middle-class families to spend sharply higher fractions of their incomes on positional goods like housing, forcing them to curtail other categories of spending.
• A growing concentration of wealth in the hands of the rich may also lead to a diversion of resources from the wider economy to financial speculation and conspicuous consumption .
• Frank’s solution to this “wastage” is a progressive consumption tax.
Sources: Robert Frank, Falling Behind, Luxury Fever, The Winner-Take-All Society (with Philip J Cook)
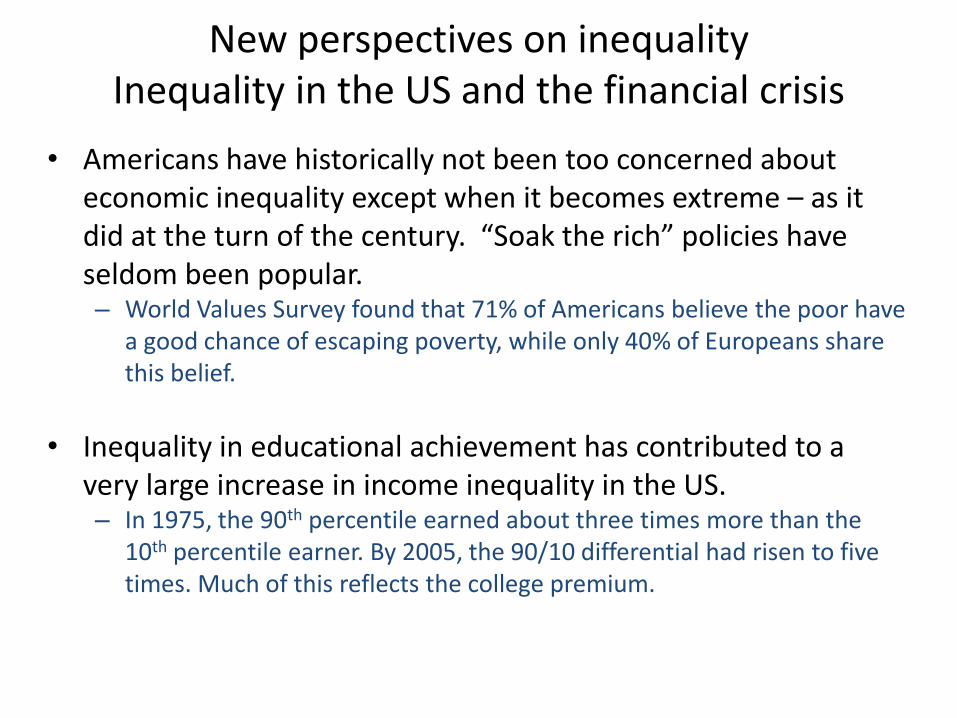
New perspectives on inequalityInequality in the US and the financial crisis
• Americans have historically not been too concerned about economic inequality except when it becomes extreme – as it did at the turn of the century. “Soak the rich” policies have seldom been popular.– World Values Survey found that 71% of Americans believe the poor have
a good chance of escaping poverty, while only 40% of Europeans share this belief.
• Inequality in educational achievement has contributed to a very large increase in income inequality in the US.– In 1975, the 90th percentile earned about three times more than the
10th percentile earner. By 2005, the 90/10 differential had risen to five times. Much of this reflects the college premium.
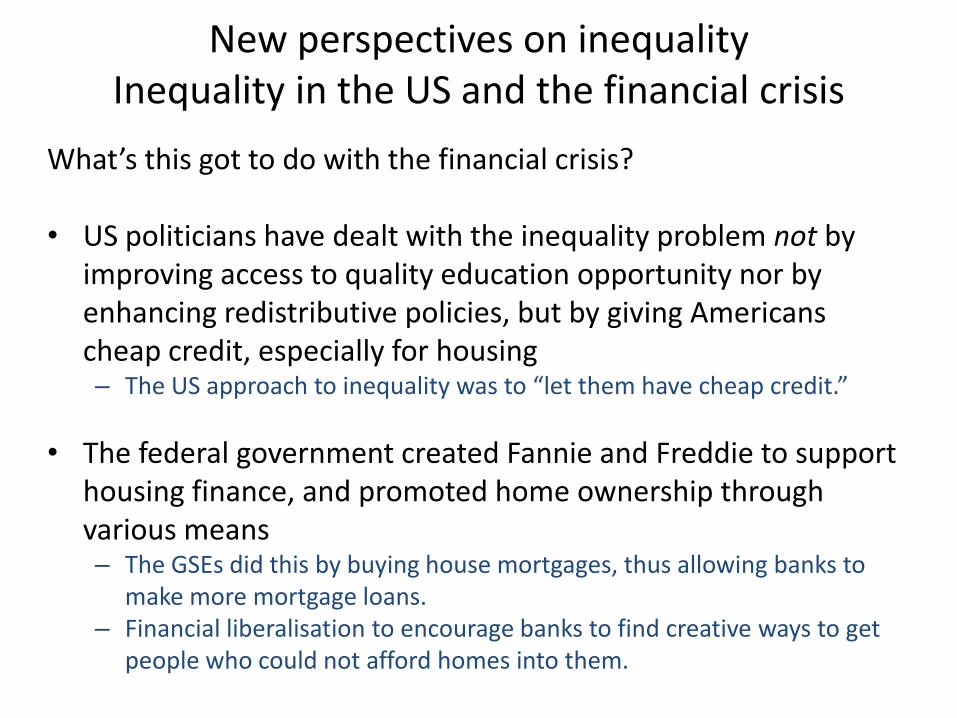
New perspectives on inequalityInequality in the US and the financial crisis
What’s this got to do with the financial crisis?
• US politicians have dealt with the inequality problem not by improving access to quality education opportunity nor by enhancing redistributive policies, but by giving Americans cheap credit, especially for housing– The US approach to inequality was to “let them have cheap credit.”
• The federal government created Fannie and Freddie to support housing finance, and promoted home ownership through various means – The GSEs did this by buying house mortgages, thus allowing banks to
make more mortgage loans. – Financial liberalisation to encourage banks to find creative ways to get
people who could not afford homes into them.
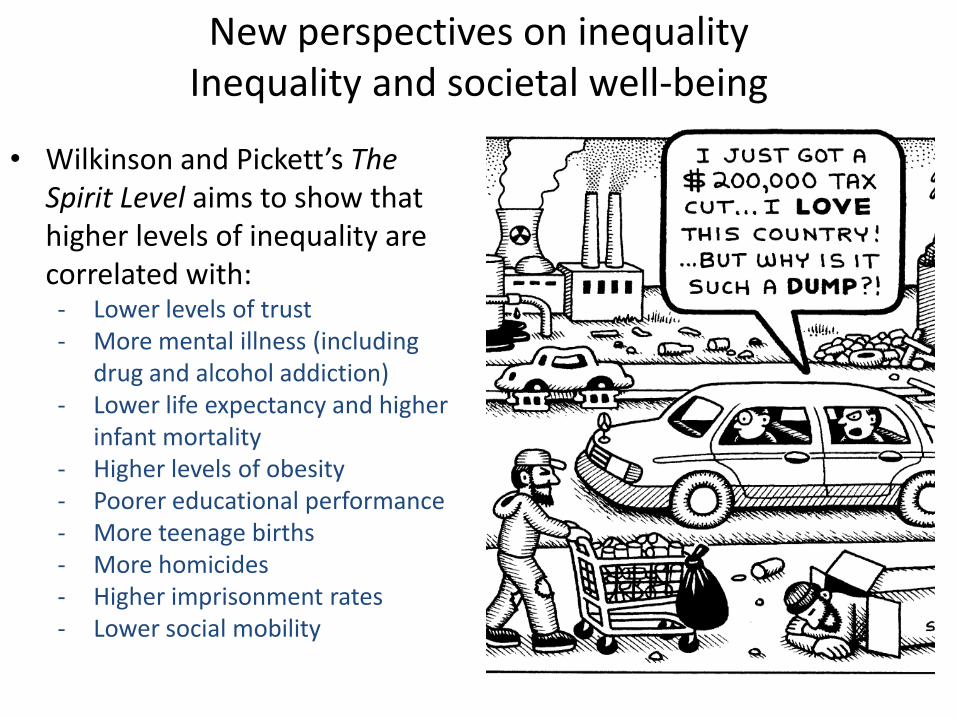
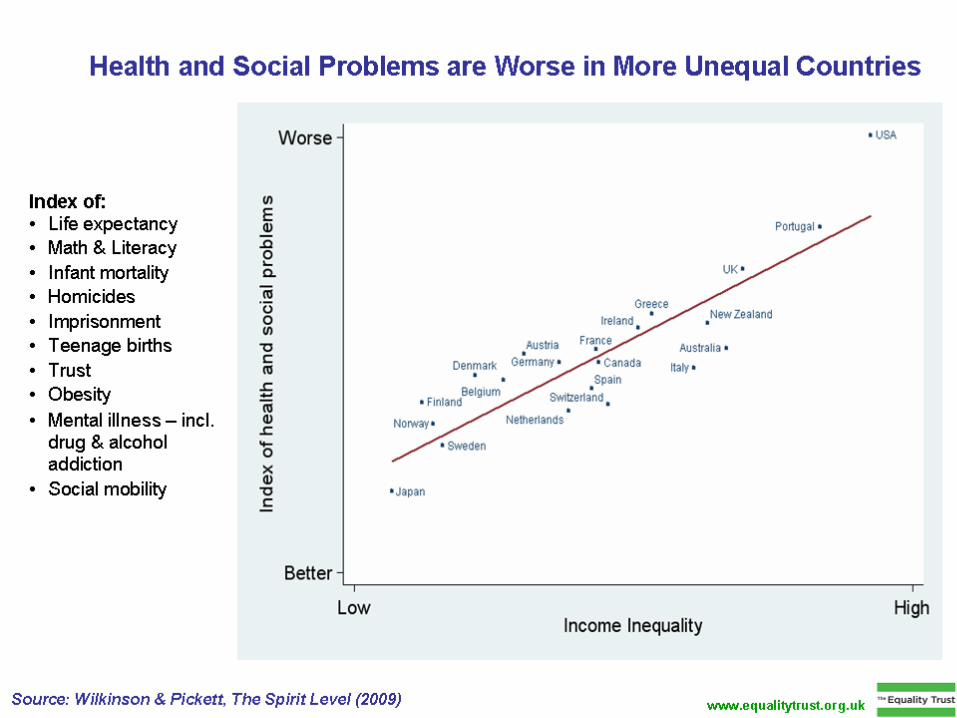
New perspectives on inequalityInequality and societal well-being
• Wilkinson and Pickett’s The Spirit Level aims to show that higher levels of inequality are correlated with:- Lower levels of trust- More mental illness (including
drug and alcohol addiction)- Lower life expectancy and higher
infant mortality- Higher levels of obesity- Poorer educational performance- More teenage births- More homicides- Higher imprisonment rates- Lower social mobility
New perspectives on inequalityInequality and societal well-being
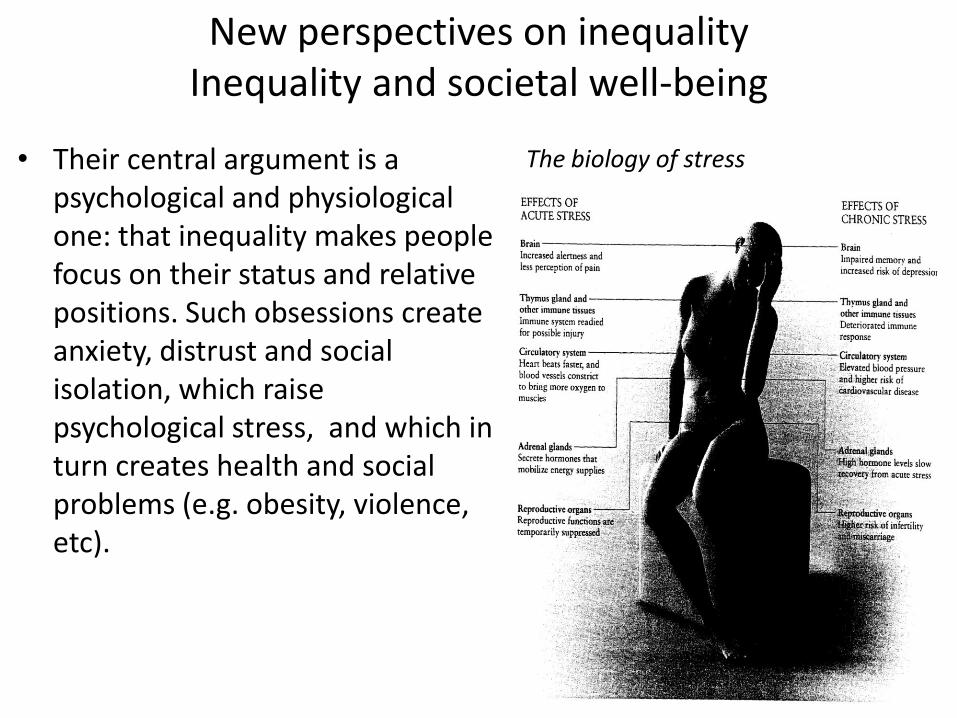
• Their central argument is a psychological and physiological one: that inequality makes people focus on their status and relative positions. Such obsessions create anxiety, distrust and social isolation, which raise psychological stress, and which in turn creates health and social problems (e.g. obesity, violence, etc).
The biology of stress
New perspectives on inequalityInequality and societal well-being
• The authors argue that the relationship between inequality and poor health and social problems are too strong to be attributable to chance. They then suggest causal links specific to each health and social problem.
- Argue that the link runs mostly from inequality to the particular health or social problem, and not the other way round.
- They also argue that people at almost all income levels, not just the poor, do worse in more unequal societies. Inequality, not poverty, is the main culprit.
• Criticisms:– Data only shows correlation not causality– Some of the relations are quite sensitive to the choice of countries, e.g.
inclusion of Hong Kong, Korea, Taiwan and Singapore would alter the relationship between income inequality and infant mortality significantly
• But proving causality is inherently difficult, if not impossible. - We cannot experimentally reduce the inequalities in half the sample of
countries and not in the others and then wait to see what happens. We can’t conduct a randomized experiment to prove causation.
Conclusions• Inequality in Singapore has increased significantly in the last decade,
probably at a rate faster than in most advanced economies.
• Globalisation and rapid technical change are main causes. It also appears that public policies have not slowed the increase in inequality, and may even have accentuated it in some respects.
• Inequality harms society, and may also contribute to financial and macroeconomic instability.
• We can pursue more progressive policies, e.g. more progressive taxation, expansion of social safety nets, and more aggressive use of social insurance. What matters is the design of our social safety nets, not the total level of spending.
• By pursuing a more progressive agenda, the government bolsters public support for free trade, globalisation and economic restructuring, and increases Singaporeans’ acceptance of liberal immigration policies.
Strengthening social protection facilitates economic restructuring; it’s not just a social imperative, but also an economic one.