Geotechnical Hazards | Geological Considerations in Dams ...
California North Coast Offshore Wind Studies
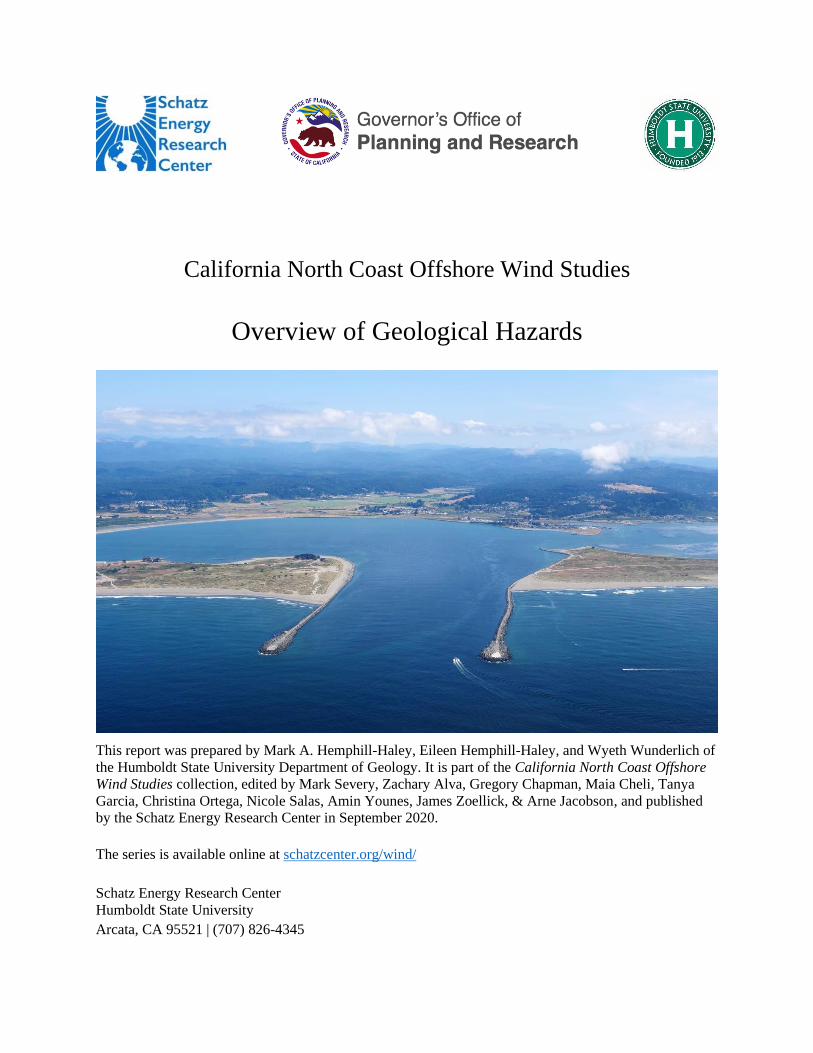
Overview of Geological Hazards
This report was prepared by Mark A. Hemphill-Haley, Eileen Hemphill-Haley, and Wyeth Wunderlich of
the Humboldt State University Department of Geology. It is part of the California North Coast Offshore
Wind Studies collection, edited by Mark Severy, Zachary Alva, Gregory Chapman, Maia Cheli, Tanya
Garcia, Christina Ortega, Nicole Salas, Amin Younes, James Zoellick, & Arne Jacobson, and published
by the Schatz Energy Research Center in September 2020.
The series is available online at schatzcenter.org/wind/
Schatz Energy Research Center
Humboldt State University
Arcata, CA 95521 | (707) 826-4345

California North Coast Offshore Wind Studies
Overview of Geological Hazards ii
Disclaimer
This study was prepared under contract with Humboldt State University
Sponsored Programs Foundation with financial support from the Department of
Defense, Office of Economic Adjustment. The content reflects the views of the
Humboldt State University Sponsored Programs Foundation and does not
necessarily reflect the views of the Department of Defense, Office of Economic
Adjustment.
This report was created under Grant Agreement Number: OPR19100
About the Schatz Energy Research Center
The Schatz Energy Research Center at Humboldt State University advances clean
and renewable energy. Our projects aim to reduce climate change and pollution
while increasing energy access and resilience.
Our work is collaborative and multidisciplinary, and we are grateful to the many
partners who together make our efforts possible.
Learn more about our work at schatzcenter.org
Rights and Permissions
The material in this work is subject to copyright. Please cite as follows:
Hemphill-Haley, M.A., Hemphill-Haley, E. and Wunderlich, W. (2020).
Overview of Geological Hazards. In M. Severy, Z. Alva, G. Chapman, M. Cheli,
T. Garcia, C. Ortega, N. Salas, A. Younes, J. Zoellick, & A. Jacobson (Eds.)
California North Coast Offshore Wind Studies. Humboldt, CA: Schatz Energy
Research Center. schatzcenter.org/pubs/2020-OSW-R16.pdf.
All images remain the sole property of their source and may not be used for any
purpose without written permission from that source.

California North Coast Offshore Wind Studies
Overview of Geological Hazards iii
CONTENTS
1 EXECUTIVE SUMMARY................................................................................................................... 1
2 INTRODUCTION ................................................................................................................................ 7
3 STRONG MOTION .............................................................................................................................. 7 3.1 Potential Sources of Seismicity and Strong Shaking ................................................................. 10
3.1.1 Cascadia subduction zone (CSZ) .......................................................................................... 10
3.1.2 San Andreas fault (SAF) ....................................................................................................... 15
3.1.3 Mendocino Fault (MF) .......................................................................................................... 20
3.1.4 Gorda plate ............................................................................................................................ 21
3.1.5 Faults in the Fold and Thrust Belt of the Accretionary Wedge ............................................. 23
3.1.5.1 Table Bluff Fault and Anticline .................................................................................... 27
3.1.5.2 Little Salmon Fault ....................................................................................................... 29
3.2 North Coast Earthquakes >M6 Since 1960 ............................................................................... 32 3.2.1 1980 M7.2 Earthquake .......................................................................................................... 36
3.2.2 1992 M7.2 Earthquake .......................................................................................................... 38
3.2.3 2010 M6.5 Earthquake .......................................................................................................... 41
4 SURFACE RUPTURE ....................................................................................................................... 43
5 GAS HYDRATES AND SHALLOW-SEAFLOOR FREE GAS....................................................... 52 5.1 Gas Hydrate Occurrence ............................................................................................................ 53 5.2 Gas Hydrates Offshore of Northern California ......................................................................... 56
6 LIQUEFACTION ............................................................................................................................... 59 6.1 Overview of Liquefaction Processes and Related Ground Failure ............................................ 60 6.2 Liquefaction in the Marine Environment .................................................................................. 62 6.3 Documented Liquefaction from North Coast Earthquakes........................................................ 63
7 SUBMARINE LANDSLIDES ........................................................................................................... 69 7.1 Overview of Submarine Landslides........................................................................................... 69 7.2 Slumps and Slides ...................................................................................................................... 69 7.3 Unstable Sediment Masses ........................................................................................................ 71 7.4 Turbidity currents ...................................................................................................................... 74
8 TSUNAMIS ........................................................................................................................................ 76 8.1 Overview of Tsunami Hazards .................................................................................................. 76 8.2 Tsunami Record for the North Coast at Humboldt Bay ............................................................ 80
9 COSEISMIC LAND-LEVEL CHANGES ......................................................................................... 81 9.1 Coseismic Subsidence ............................................................................................................... 81 9.2 Coseismic Uplift ........................................................................................................................ 85 9.3 Interseismic Subsidence at Humboldt Bay ................................................................................ 86
10 RECOMMENDATIONS FOR FUTURE WORK.......................................................................... 87
11 REFERENCES ............................................................................................................................... 90

California North Coast Offshore Wind Studies
Overview of Geological Hazards iv
FIGURES
Figure 1. Map showing the Northern California Offshore Wind (NCOW) study area, including the
location of proposed offshore wind farms (Humboldt Call Area) and proposed locations of associated
infrastructure (“NCOW facilities”). .............................................................................................................. 2
Figure 2. Map of the intersection of the Gorda, Pacific, and North America plates at the Mendocino triple
junction. ........................................................................................................................................................ 8
Figure 3. Map showing the extent of the Cascadia subduction zone off northwestern North America. ..... 11
Figure 4. USGS base map of the San Andreas fault in California. ............................................................. 16
Figure 5. Map showing the 1906 rupture length of the San Andreas fault and area of impact from the
earthquake. .................................................................................................................................................. 17
Figure 6. Modified Mercalli Intensity shake map of northern California for the 1906 San Andreas fault
earthquake. .................................................................................................................................................. 18
Figure 7. Probabilistic seismic hazard model showing a 10% probability of peak ground accelerations
exceeded 0.4-0.8 g in coastal Northern California over the next 50 years. ................................................ 20
Figure 8. Map of the Gorda plate ("Gorda deformation zone") by Rollins and Stein, 2010.. ..................... 22
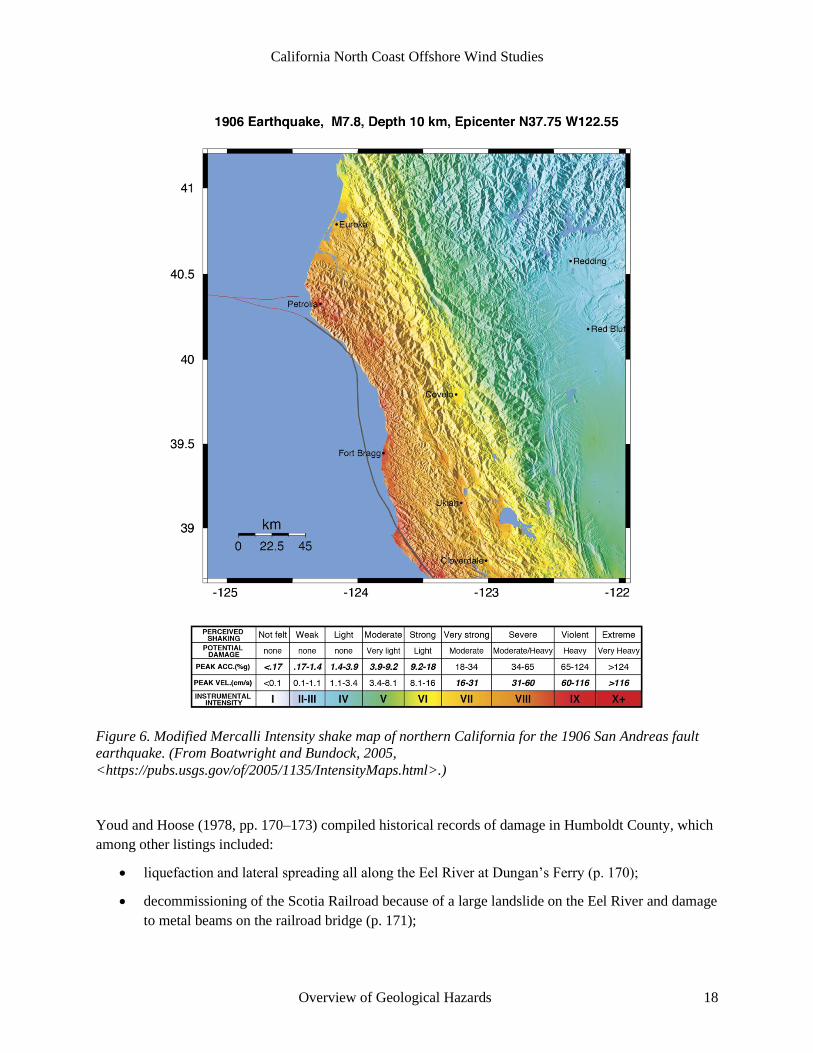
Figure 9. Cascadia subduction zone accretionary prism relative to the location of the Humboldt Call
Area.. ........................................................................................................................................................... 25
Figure 10. Uninterpreted and interpreted seismic reflection profile constructed in NE to SW azimuth
roughly parallel to the coastline. ................................................................................................................. 26
Figure 11. Multi-channel seismic profile constructed in a NE-SW azimuth that transects the southern end
of the Humboldt Call Area. ......................................................................................................................... 26
Figure 12. Geologic map of the Humboldt Bay Region.. ........................................................................... 28
Figure 13. Interpretation of proprietary seismic section from SSW to NE across the Eel River basin, Table
Bluff anticline and Humboldt Hill.. ............................................................................................................ 28
Figure 14. Onshore map of the Little Salmon fault showing locations of fault investigation studies
conducted on multiple splays of the fault.. ................................................................................................. 29
Figure 15. Geologic map of the College of the Redwoods campus and surface traces of the middle splay
of the Little Salmon fault. ........................................................................................................................... 31
Figure 16. Cross-sections across the middle splay of the Little Salmon fault at College of the Redwoods
campus. See Figure 15 for cross-section locations.. ................................................................................... 32
Figure 17. Map showing earthquakes > M2.5 in the North Coast region in the time period 2000-2020. .. 33
Figure 18. Regional earthquakes > M6 since 1960. .................................................................................... 34
Figure 19. USGS MMI shake map for the 1980 M7.2 earthquake. ............................................................ 37
Figure 20. USGS MMI shake map for the April 25, 1992 M7.2 Cape Mendocino earthquake. ................ 39
Figure 21. USGS MMI shake map for the April 26, 1992 M6.5 Cape Mendocino earthquake aftershock.
.................................................................................................................................................................... 39
Figure 22. USGS MMI shake map for the April 26, 1992 M6.6 Cape Mendocino earthquake aftershock.
.................................................................................................................................................................... 41
Figure 23. USGS MMI shake map for the 2010 M6.5 earthquake. ............................................................ 42

California North Coast Offshore Wind Studies
Overview of Geological Hazards v
Figure 24. Map showing locations of faults and folds off Humboldt Bay identified from multi- and single-
channel deep- to intermediate-depth seismic-reflection profiles and side-scan sonar mosaics .................. 44
Figure 25. Map showing the bathymetry and topography of the southernmost Cascadia subduction zone in
and near the Humboldt Call Area. .............................................................................................................. 45
Figure 26. High resolution multi-beam bathymetry map of the Trinidad Canyon and Eel River Plateau
portions of the southern Cascadia subduction zone showing locations of surface deformation features such
as the Little Salmon and Table Bluff anticlines.. ........................................................................................ 46
Figure 27. Uninterpreted and interpreted seismic profile from transect approximately parallel to coastline
.................................................................................................................................................................... 47
Figure 28. Multi-channel seismic profile showing the deformation front of the Cascadia subduction zone
in the vicinity of the Humboldt call area and the position of the Little Salmon fault zone and Table Bluff
anticline ....................................................................................................................................................... 48
Figure 29. Potential upper plate structures that might be associated with slip along a basal thrust fault. .. 49
Figure 30. Diagrams of onshore surface faulting within the hanging wall of splays of the Little Salmon
fault zone at the Humboldt Bay power plant and College of the Redwoods.) ............................................ 49
Figure 31. Comparative profiles of structures and coseismic displacement between the Aleutian trench
during the 1964 M9.2 earthquake and a hypothetical megathrust earthquake along the southern Cascadia
subduction zone .......................................................................................................................................... 52
Figure 32. Global gas hydrate locations ...................................................................................................... 53
Figure 33. Schematic diagram showing typical submarine settings for gas hydrates and associated features
such as diapirs and seeps.. ........................................................................................................................... 54
Figure 34. Bottom-simulating reflector (BSR) representing the base of the gas hydrate stability zone. .... 55
Figure 35. Map showing location of gas hydrates (yellow polygon) in the vicinity of the Humboldt call
area based on available data from seismic reflection surveys. The possible extent of gas hydrates beyond
the areas shown by the polygons is unknown. Red polygon: areas of surface pockmark identified from
side-scan sonar and ocean bottom photography (Yun et al., 1999). Green polygon: location of mud diapir
interpreted from seismic reflection data (Yun et al., 1999). ....................................................................... 57
Figure 36. Map showing the geophysical survey trackline coverage of the southern Cascadia margin and
accretionary prism (from Hill et al., 2020, their Figure 1b). The multichannel seismic profiles for the
yellow lines labeled “6c” and “6d” are shown in Figure 37. ...................................................................... 58
Figure 37. Multichannel seismic reflection profiles across the accretionary prism at Trinidad Canyon and
Eel Plateau. ................................................................................................................................................. 59
Figure 38. Map showing areas of varying levels of seismic instability, including liquefaction hazard
zones, for Humboldt County ....................................................................................................................... 64
Figure 39. Sites of documented liquefaction from the 1980 M7.2 earthquake superimposed on the USGS
MMI map. ................................................................................................................................................... 65
Figure 40. Sites of documented liquefaction from the 1906 M7.9 San Andreas earthquake superimposed
on the USGS MMI map. ............................................................................................................................. 67
Figure 41. Historical photograph of lateral spreading from liquefaction along the lower Eel River, at Port
Kenyon, Humboldt County, triggered by the 1906 earthquake on the San Andreas fault. ......................... 67
California North Coast Offshore Wind Studies
Overview of Geological Hazards vi
Figure 42. Historical photograph of the Pacific Lumber Company dock at Fields Landing that collapsed
from liquefaction triggered by the 1906 San Andreas fault earthquake. .................................................... 68
Figure 43. General landslide classifications that can be applied to submarine failures. ............................. 69
Figure 44. High-resolution bathymetry of Trinidad Canyon and Eel Plateau portions of the southern
Cascadia subduction zone. .......................................................................................................................... 72
Figure 45. Shaded relief and bathymetry map showing the location of the “Humboldt Slide” and possible
sediment waves ........................................................................................................................................... 73
Figure 46. Interpreted acoustic profile across the “Humboldt Slide”. ........................................................ 73
Figure 47. High resolution boomer profiles of the outer shelf and upper slope of the Eel Plateau ........... 74
Figure 48. Areas of slope instability and slides with respect to the Humboldt Call Area based on seismic
reflection and side-scan sonar surveys ........................................................................................................ 76
Figure 49. Map of tsunami inundation zone for Humboldt Bay ................................................................. 78
Figure 50. Map of tsunami inundation zone in the vicinity of the Humboldt Bay Generating Station ...... 79
Figure 51. Photo of a core collected from Jacoby Creek marsh at the edge of northern Humboldt Bay
(Arcata Bay). ............................................................................................................................................... 83
Figure 52. Core diagrams showing multiple times in the past that areas of northern Humboldt Bay
coseismically subsided ................................................................................................................................ 84
Figure 53. Marine terrace sequence at Humboldt Bay, California.............................................................. 86
California North Coast Offshore Wind Studies
Overview of Geological Hazards vii
TABLES
Table 1. Summary of geologic hazards pertinent to the Northern California Offshore Wind Study. ........... 3
Table 2. Recommendations for future work on geological hazards with the potential to impact the
development of offshore wind energy capabilities for northern California. ................................................. 6
Table 3. The Modified Mercalli Intensity Scale (MMI). .............................................................................. 9
Table 4. Example historical subduction zone earthquakes. ........................................................................ 11
Table 5. Ages and recurrence intervals of earthquakes for the past 3,000 years on the southern Cascadia
subduction zone based on results of field studies between the lower Eel River valley and Crescent City,
California. ................................................................................................................................................... 14
Table 6. Earthquakes shown on Figure 8, the Rollins and Stein (2010) map of the Gorda plate (“Gorda
deformation zone”). Earthquakes shown are those >M5.9 that occurred during the time period 1976-2010.
.................................................................................................................................................................... 23
Table 7. Regional earthquakes > M6 since 1960 (between latitudes 40°-42 N and longitudes 127°-123°W.
.................................................................................................................................................................... 35

California North Coast Offshore Wind Studies
Overview of Geological Hazards viii
ABBREVIATIONS
BSR Bottom-simulating reflector
B.P. before present (for radiocarbon ages, "B.P." refers to before 1950 C.E.)
cal yrs B.P. calibrated years before 1950 C.E. (unit for radiocarbon age)
C.E. common era
CSZ Cascadia subduction zone
ft foot/feet
g standard acceleration due to gravity
HBGS Humboldt Bay Generating Station
LSF Little Salmon fault
LSFZ Little Salmon fault zone
m meter
MF Mendocino fault
mm millimeter
MMI Modified Mercalli Intensity
MTJ Mendocino triple junction
NCOW
facilities
Proposed infrastructure to support the offshore wind project, including the
Humboldt Bay Generating Station (HBGS); a turbine assembly area at Terminal I
on North Spit; a cable landing area on the north end of South Spit; and cable
corridors both offshore and within Humboldt Bay.
NCOWS Northern California Offshore Wind Study
PGA Peak ground acceleration
RSL relative sea level
SAF San Andreas fault
sec second(s)
TBA Table Bluff anticline
yr year

California North Coast Offshore Wind Studies
Overview of Geological Hazards 1
1. EXECUTIVE SUMMARY
The Northern California Offshore Wind Study (NCOWS) is a research project exploring the feasibility of
developing offshore wind farms in the Humboldt Call Area, which is being considered for a lease auction
by the Bureau of Ocean Energy Management (2018). Using existing literature, this report investigates the
geological hazards associated with development of offshore wind and associated facilities in the
seismically active north coast of California. The report reviews geologic and seismic hazards that may
impact North Coast Offshore Wind (NCOW) facilities including a floating offshore wind farm, cable
landfall on the coastline, interconnection with terrestrial electric transmission infrastructure, and port
infrastructure located within Humboldt Bay. Collectively, these areas are referred to as the potential North
Coast Offshore Wind facilities (NCOW facilities) (Figure 1). Seven geological hazards are considered in
this report (Table 1).
Strong Motion (Section 3)
The NCOW facilities lie within what is arguably the most seismically active area in the conterminous
United States. Seismic sources capable of delivering strong motion to any component of the NCOW
facilities include: (1) the Cascadia subduction zone, which encompasses the entire NCOW facilities area,
and is capable of producing earthquakes greater than M9; (2) the San Andreas fault, located immediately
to the south of the NCOW facilities, which has produced historical earthquakes as large as M7.9; (3) the
Mendocino fault, also located immediately south of the study site, which is capable of producing M7
earthquakes; (4) faults within the Gorda plate, which is the subducting oceanic plate along the
southernmost Cascadia subduction zone; and (5) faults within the fold and thrust belt of the Cascadia
subduction zone accretionary wedge that, although they have not ruptured during historical times, show
ample geological evidence for producing M>7 earthquakes in the past hundreds to thousands of years.
The primary sources of historical seismicity for northwestern California have been active faults in the
Gorda plate and activity along with the Mendocino fault, with recorded earthquakes as large as M7.2.
All components of the NCOW facilities could be adversely impacted by the effects of strong ground
motion which may include high ground accelerations, long-period and/or high frequency motion, and
long-duration shaking. In addition to the direct effect from strong shaking, strong ground motion can also
trigger other adverse geological hazards including destabilizing gas hydrates beneath the seafloor,
sediment liquefaction both on- and offshore, and submarine landslides.
Surface Rupture (Section 4)
Hazards exist to all portions of the NCOW facilities as a result of surface fault rupture and associated
deformation, including folding. On-land faults have been identified from the resulting geomorphic
expression of thrust faults and folds. Numerous paleoseismic investigations, including a large-scale effort
conducted for the seismic safety assessment of the PG&E Humboldt Bay Power Plant (which has since
been replaced at the same site by the Humboldt Bay Generating Station), have revealed a series of active
faults capable of producing surface offsets that may exceed several meters. The potential offshore
continuations of these faults and folds have been identified using high-resolution bathymetry and multi-

California North Coast Offshore Wind Studies
Overview of Geological Hazards 2
channel seismic studies. These structures exist within the Humboldt Call Area and are crossed by power
transmission corridors.
Figure 1. Map showing the Northern California Offshore Wind (NCOW) study area, including the
location of proposed offshore wind farms (Humboldt Call Area) and proposed locations of associated
infrastructure (“NCOW facilities”): (1) the turbine assembly location at Marine Terminal I on North
Spit; (2) the transmission cable landfall at the north end of South Spit and associated cable crossing
under the adjacent navigation channel in Humboldt Bay; (3) the Humboldt Bay Generating Plant; and (4)
approximate area of a corridor for transmission cables from the Humboldt Call Area to the South Spit
cable landing.
California North Coast Offshore Wind Studies
Overview of Geological Hazards 3
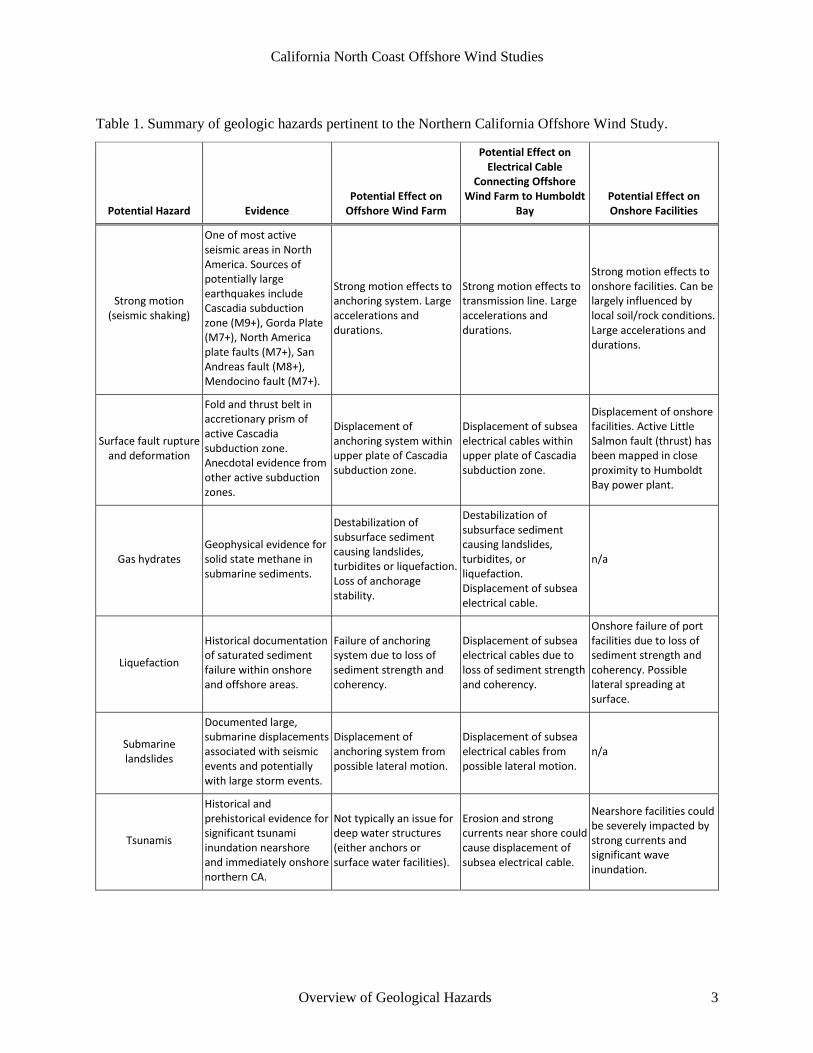
Table 1. Summary of geologic hazards pertinent to the Northern California Offshore Wind Study.
Potential Hazard Evidence Potential Effect on
Offshore Wind Farm
Potential Effect on Electrical Cable
Connecting Offshore Wind Farm to Humboldt
Bay Potential Effect on Onshore Facilities
Strong motion (seismic shaking)
One of most active seismic areas in North America. Sources of potentially large earthquakes include Cascadia subduction zone (M9+), Gorda Plate (M7+), North America plate faults (M7+), San Andreas fault (M8+), Mendocino fault (M7+).
Strong motion effects to anchoring system. Large accelerations and durations.
Strong motion effects to transmission line. Large accelerations and durations.
Strong motion effects to onshore facilities. Can be largely influenced by local soil/rock conditions. Large accelerations and durations.
Surface fault rupture and deformation
Fold and thrust belt in accretionary prism of active Cascadia subduction zone. Anecdotal evidence from other active subduction zones.
Displacement of anchoring system within upper plate of Cascadia subduction zone.
Displacement of subsea electrical cables within upper plate of Cascadia subduction zone.
Displacement of onshore facilities. Active Little Salmon fault (thrust) has been mapped in close proximity to Humboldt Bay power plant.
Gas hydrates Geophysical evidence for solid state methane in submarine sediments.
Destabilization of subsurface sediment causing landslides, turbidites or liquefaction. Loss of anchorage stability.
Destabilization of subsurface sediment causing landslides, turbidites, or liquefaction. Displacement of subsea electrical cable.
n/a
Liquefaction
Historical documentation of saturated sediment failure within onshore and offshore areas.
Failure of anchoring system due to loss of sediment strength and coherency.
Displacement of subsea electrical cables due to loss of sediment strength and coherency.
Onshore failure of port facilities due to loss of sediment strength and coherency. Possible lateral spreading at surface.
Submarine landslides
Documented large, submarine displacements associated with seismic events and potentially with large storm events.
Displacement of anchoring system from possible lateral motion.
Displacement of subsea electrical cables from possible lateral motion.
n/a
Tsunamis
Historical and prehistorical evidence for significant tsunami inundation nearshore and immediately onshore northern CA.
Not typically an issue for deep water structures (either anchors or surface water facilities).
Erosion and strong currents near shore could cause displacement of subsea electrical cable.
Nearshore facilities could be severely impacted by strong currents and significant wave inundation.

California North Coast Offshore Wind Studies
Overview of Geological Hazards 4
Potential Hazard Evidence Potential Effect on
Offshore Wind Farm
Potential Effect on Electrical Cable
Connecting Offshore Wind Farm to Humboldt
Bay Potential Effect on Onshore Facilities
Coseismic land level change
Documented sudden, vertical coastal subsidence or emergence (dependent on location relative to megathrust displacement offshore). Vertical displacement in excess of 2 m have been observed during subduction zone earthquakes.
Not considered a significant hazard
Near-shore changes in relative sea-level could expose transmission cables.
Greatest impact likely due to sudden submergence of coastal area where facility likely located.
Surface rupture can affect any NCOW facilities including anchorages, footings, seabed and underground
pipeline and transmission structures and onshore facilities.
Gas Hydrates (Section 5)
Interstitial methane and associated gas are found offshore at ocean depths greater than 500 m and most
commonly between 800 and 1,200 m at suitable pressure and temperature conditions to maintain the gas
in solid form. The thickness of the frozen gas is dependent largely on the geothermal gradient caused by
burial of ocean sediments. Gas hydrates often form impermeable layers that trap free gas below, which
may be pressurized. They can become destabilized by external environmental drivers such as sea level
change, rising ocean water temperatures, landslides, storm currents and earthquake strong motion. Gas
hydrates have been identified throughout the Humboldt Call Area.
Consequences of gas hydrate destabilization may include surface disruption, loss of integrity of
sediments, liquefaction and landslides, which could disrupt anchors and mooring lines used to connect
floating offshore wind turbines to the seafloor and subsea cables.
Liquefaction (Section 6)
Liquefaction is the process of sediment strength loss as a result of pore water pressure exceeding the shear
strength of the sediments. Causes of liquefaction include seismic shaking and over-pressurization of
saturated sediment, such as caused by loading as a result of rapid sedimentation, rapid changes in sea
level due to storms or tsunamis, and cyclic loading due to storm surges. Liquefaction poses a potential
hazard to on-land facilities, underground and underwater pipelines, footings and anchorages and other
infrastructure. Consequences of liquefaction include, but are not limited to, slope failure, settling and
tipping of buildings, collapse of retaining walls, lateral spreads of surfaces with low gradients, large
surface deformations and settlement and flooding of large areas.

California North Coast Offshore Wind Studies
Overview of Geological Hazards 5
Liquefaction could affect potential NCOW facilities by destabilizing substrate holding turbine platform
anchors in place, disrupting subsurface transmission lines, and causing land settlement or lateral
spreading at on-land facilities.
Submarine Landslides (Section 7)
Evidence for slope instability, including slumps, large, unstable sediment masses, sediment waves and
turbidity currents has been documented throughout portions of the NCOW facilities area. Offshore
landslides, the result of strong shaking destabilization of saturated sediments, has been documented
within and near the call-out area. Most slumps are located in relatively high-gradient portions of the lower
slope of the continental margin as evidenced by slide headscarps in upper reaches of canyons. Gullies and
sediment waves, indicative of erosion, are located in the upper slope areas of the continental margin.
Consequences of submarine landslides may include destabilization of anchorages, footings, and
underwater transmission pipelines and cables. Large submarine landslides may also generate local
tsunamis.
Tsunamis (Section 8)
Tsunamis are anomalous waves that may provide rapid currents throughout the entire water column and
can cause substantial, repeated changes in local sea level. The North Coast is susceptible to both nearfield
and farfield tsunamis. Potential nearfield tsunami sources include sudden coseismic vertical displacement
of the sea floor as a result of earthquakes on the Cascadia subduction megathrust, displacement of faults
within the fold and thrust belt or submarine landslides. Far-field tsunamis may be generated by numerous
trans-Pacific earthquake sources.
Consequences of tsunami occurrence include on-land inundation, coastal and shallow seafloor erosion
and potential impacts to on-land facilities and structures. The North Coast has experienced both nearfield
and farfield tsunami inundation. Inundation hazard maps indicate that most on-land facilities that would
be associated with offshore wind development (i.e. port facilities and electrical interconnection point) are
located within tsunami hazard areas.
Coseismic Land-level Change (Section 9)
Coseismic coastal and near-coastal land-level changes may occur during large magnitude earthquakes
associated with the Cascadia megathrust or faults within the fold and thrust portion of the accretionary
wedge. The land-level change may be abrupt and can either result in upward (uplift) or downward
(subsidence) motion of the land. Paleoseismic investigations within the Humboldt Bay area indicate up to
six Cascadia-related subsidence events have occurred over the past 3,000 years with the coast dropping as
much as 1m during these events. The result was areas formerly positioned above tide level were lowered
into the intertidal zone and subsequently buried in muddy sediment.
A potential effect of coseismic subsidence on NCOW facilities located close to sea level along Humboldt
Bay would be susceptibility to tidal flooding and excess sediment accumulation on site.

California North Coast Offshore Wind Studies
Overview of Geological Hazards 6
The findings of this report are not definitive as a decision-making document for the feasibility of
development for the Humboldt Call Area and associated NCOW facilities, but instead are intended to
provide guidance for topics that should be explored in more detail as development of offshore wind and
associated facilities are further considered for northern California. Recommendations for future work to
adequately address potential geological hazards in the design and implementation of offshore wind power
generation in the proposed Humboldt Call Area and NCOW facilities areas are listed in Section 10 and
Table 2.
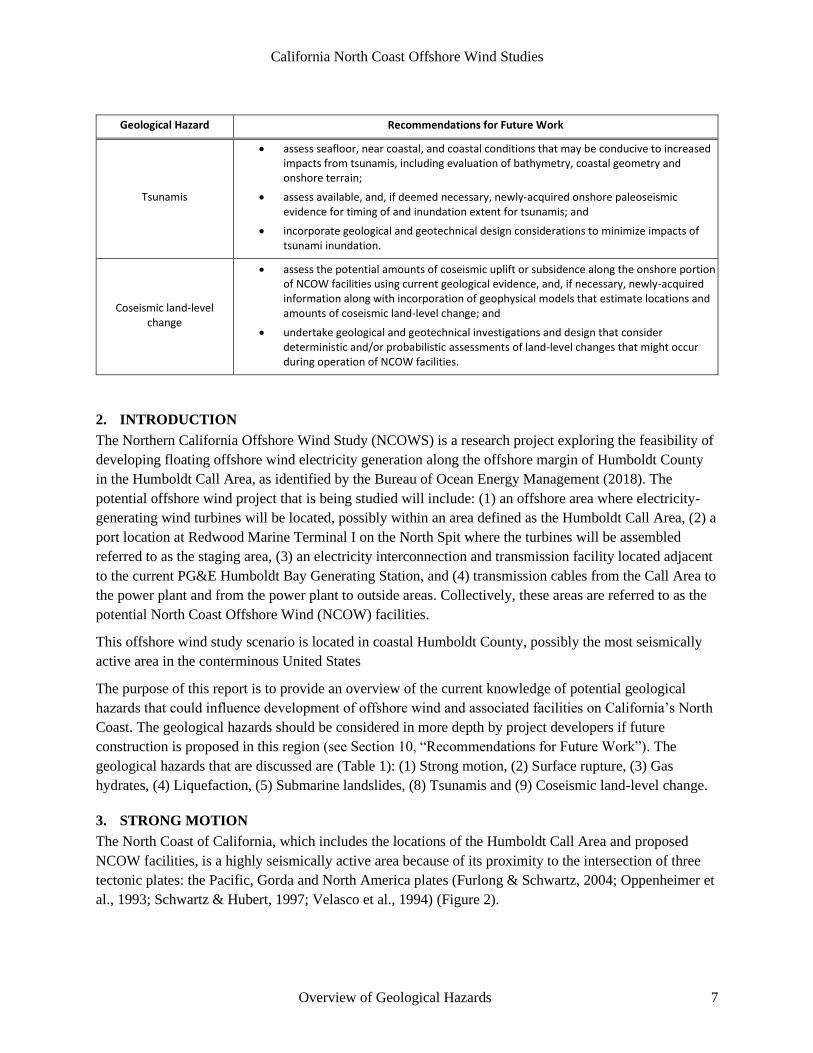
Table 2. Recommendations for future work on geological hazards with the potential to impact the
development of offshore wind energy capabilities for northern California.
Geological Hazard Recommendations for Future Work
Strong motion
• evaluate hypocentral information for both offshore and onshore earthquakes to improve earthquake location and magnitude estimates;
• develop deterministic and/or probabilistic seismic hazard assessments for facilities, including anchorages, footings, seabed and underground pipeline and transmission structures and onshore facilities; and
• develop geological and geotechnical designs that utilize seismic hazard parameters for all NCOW facilities.
Surface rupture
• compile existing onshore and offshore fault mapping data including public agency documents (e.g. USGS and CGS); data collected for offshore mineral exploration, including geophysical investigations; and consultants’ reports, including fault studies for residential and commercial facilities.
• identify in detail the locations of offshore structures that may be able to produce surface rupture, incorporating existing data and acquiring new data for this project using established geophysical methods; and
• for each potential surface rupture source, create deterministic and probabilistic assessments of maximum surface deformation or displacement, style of faulting or folding and, in the case of probabilistic assessment, recurrence information for surface rupture.
Gas hydrates
• complete geological, geophysical and exploratory investigations of the project area in order to assess gas hydrate and free gas quantities, including locations and ocean depth occurrences, hydrate thicknesses, and burial depths below the sea bed; and
• develop geotechnical-based data resulting in design and remediations, using established industry guidelines for offshore facilities.
Liquefaction
• complete a geological and geotechnical assessment of the liquefaction potential for sediments for both offshore and onshore facilities that include probabilistic assessments; and
• develop design parameters that either account for the occurrence of liquefaction or incorporate remediation efforts that minimize the liquefaction potential of affected sediments.
Submarine landslides
• assess the locations and sizes of submarine landslides along offshore portions of the NCOW facilities;
• complete geological and geotechnical investigations that estimate landslide potential that might impact NCOW facilities; and
• develop measures to mitigate or minimize hazards associated with seabed instability.
California North Coast Offshore Wind Studies
Overview of Geological Hazards 7
Geological Hazard Recommendations for Future Work
Tsunamis
• assess seafloor, near coastal, and coastal conditions that may be conducive to increased impacts from tsunamis, including evaluation of bathymetry, coastal geometry and onshore terrain;
• assess available, and, if deemed necessary, newly-acquired onshore paleoseismic evidence for timing of and inundation extent for tsunamis; and
• incorporate geological and geotechnical design considerations to minimize impacts of tsunami inundation.
Coseismic land-level change
• assess the potential amounts of coseismic uplift or subsidence along the onshore portion of NCOW facilities using current geological evidence, and, if necessary, newly-acquired information along with incorporation of geophysical models that estimate locations and amounts of coseismic land-level change; and
• undertake geological and geotechnical investigations and design that consider deterministic and/or probabilistic assessments of land-level changes that might occur during operation of NCOW facilities.
2. INTRODUCTION
The Northern California Offshore Wind Study (NCOWS) is a research project exploring the feasibility of
developing floating offshore wind electricity generation along the offshore margin of Humboldt County
in the Humboldt Call Area, as identified by the Bureau of Ocean Energy Management (2018). The
potential offshore wind project that is being studied will include: (1) an offshore area where electricity-
generating wind turbines will be located, possibly within an area defined as the Humboldt Call Area, (2) a
port location at Redwood Marine Terminal I on the North Spit where the turbines will be assembled
referred to as the staging area, (3) an electricity interconnection and transmission facility located adjacent
to the current PG&E Humboldt Bay Generating Station, and (4) transmission cables from the Call Area to
the power plant and from the power plant to outside areas. Collectively, these areas are referred to as the
potential North Coast Offshore Wind (NCOW) facilities.
This offshore wind study scenario is located in coastal Humboldt County, possibly the most seismically
active area in the conterminous United States
The purpose of this report is to provide an overview of the current knowledge of potential geological
hazards that could influence development of offshore wind and associated facilities on California’s North
Coast. The geological hazards should be considered in more depth by project developers if future
construction is proposed in this region (see Section 10, “Recommendations for Future Work”). The
geological hazards that are discussed are (Table 1): (1) Strong motion, (2) Surface rupture, (3) Gas
hydrates, (4) Liquefaction, (5) Submarine landslides, (8) Tsunamis and (9) Coseismic land-level change.
3. STRONG MOTION
The North Coast of California, which includes the locations of the Humboldt Call Area and proposed
NCOW facilities, is a highly seismically active area because of its proximity to the intersection of three
tectonic plates: the Pacific, Gorda and North America plates (Furlong & Schwartz, 2004; Oppenheimer et
al., 1993; Schwartz & Hubert, 1997; Velasco et al., 1994) (Figure 2).

California North Coast Offshore Wind Studies
Overview of Geological Hazards 8
Figure 2. Map of the intersection of the Gorda, Pacific, and North America plates at the Mendocino triple
junction. Arrows show relative plate motion at faults and spreading ridges. (From Dengler et al., 1995,
their Figure 1).
The zone where the plates meet, the Mendocino triple junction (MTJ) (Atwater, 1989; Merritts, 1996;
Velasco et al., 1994) (Figure 2) is a tectonically complex area that encompasses the onshore and offshore
vicinity of Cape Mendocino. The MTJ forms a major tectonic transition from transform plate motion to
the south, where the Pacific plate is moving in a northwest direction relative to the North America plate,
to convergent plate motion to the north, where the plates are colliding at an oblique angle and the denser,
oceanic Gorda plate is being subducted beneath the North America plate. The boundary between the
Gorda plate to the north and Pacific plate to the south is the east-west trending Mendocino fault, a 260 km
long right-lateral transform boundary that accommodates the motion of the Pacific plate relative to the
motion of the Gorda plate (Bryant, 2001). Regional geological structures associated with the tectonic
forces acting at the MTJ are interpreted as forming over the past ~1 million years (Burger et al., 2002a;
Carver, 1992).

California North Coast Offshore Wind Studies
Overview of Geological Hazards 9
Earthquakes and their impacts on the built environment are described using the concepts of either
magnitude or intensity. Magnitude is a quantitative measurement of the amount of energy released by an
earthquake at its source (USGS, 2020b). In this report we use the moment magnitude scale (here denoted
as “M”) to describe and compare different earthquakes based on magnitude. In comparison, intensity
refers to how strongly shaking is felt at a location during an earthquake, and is described with the
Modified Mercalli Intensity Scale (MMI) (USGS, 2020n) (Table 3). The MMI is divided into 10 levels (I-
X) ranging from an MMI value of I (Not felt) to a value of X (Extreme). Because of the descriptive nature
of the MMI, it is typically used for communicating information about earthquakes to non-scientists and
communities in general. In contrast to earthquake magnitude, which is a single numerical value,
earthquake intensity varies and generally decreases with distance from the earthquake epicenter, although
variabilities will occur based on a number of factors including geologic substrate, building type, and site
location (for example, valley versus ridgetop). Therefore, reports of intensity do not necessarily provide
information about magnitude as intensity is not only dependent on distance from the earthquake source
(hypocenter) but also on the site conditions.
Table 3. The Modified Mercalli Intensity Scale (MMI).
(USGS/Public Domain)
In the following sections we describe five seismic sources with the potential to generate intense and
possibly long-duration shaking in onshore and offshore areas of the California North Coast. These sources
are: (1) the southern end of the Cascadia subduction zone (CSZ); (2) the northern end of the San Andreas
transform fault zone; (3) the Mendocino fault; (4) the Gorda plate; and (5) the fold and thrust belt of the
accretionary wedge of the overriding North America plate, which underlies the coastal and nearshore
California North Coast Offshore Wind Studies
Overview of Geological Hazards 10
areas of Humboldt County. We describe sources of strong motion first in this review as other geological
hazards with possible implications for NCOW facilities (e.g., liquefaction, submarine turbidites or
landslides, disruption and release of gas hydrates) may be driven or triggered by seismic shaking.
3.1 Potential Sources of Seismicity and Strong Shaking
3.1.1 Cascadia subduction zone (CSZ)
The Cascadia subduction zone (CSZ) consists of the megathrust (regional thrust fault) and associated
deformation zone formed at the tectonic boundary between the subducting Juan de Fuca and Gorda plates
and the overriding North America (PNSN, 2020) (Figure 3). The CSZ extends for approximately 1,300
km (800 mi) from northern California to Vancouver Island, British Columbia (Zimmerman et al., 2005).
The mapped location of the megathrust where it intersects the seafloor is at the western edge of the
deformation front of the accretionary wedge (Personius & Nelson, 2006). This location increases in
distance from shore from a few kilometers off northern California at Cape Mendocino to more than 100
km off Washington state at the Olympic Peninsula. At the southern extent of the CSZ, along the
California North Coast, the megathrust dips landward about 10-15°, and separates the subducting mafic
oceanic rocks and capping pelagic sediment of the Gorda plate from the Cretaceous, Miocene, and
younger rocks of the overlying North American plate (McLaughlin et al., 2000).
Subduction zones are the only sources on the earth capable of generating > M8.5 earthquakes (PNSN,
2020), as megathrusts may rupture along great distances, 100s of km, in a single event. Earthquakes of
this magnitude generate strong shaking lasting for several minutes, a feature of earthquake behavior
commensurate with the area (length and width) of the fault rupture (Wells & Coppersmith, 1994).
Destructive tsunamis are commonly generated during subduction zone earthquakes as large volumes of
seawater are displaced from sudden upheaval of the seafloor during fault rupture (Satake & Atwater,
2007; Sugawara et al., 2008; Voit, 1987), or from massive submarine landslides set in motion by the
shaking (Didenkulova et al., 2010; Earthweb, 2020; Løvholt et al., 2015; McAdoo & Watts, 2004; Watts,
2002).
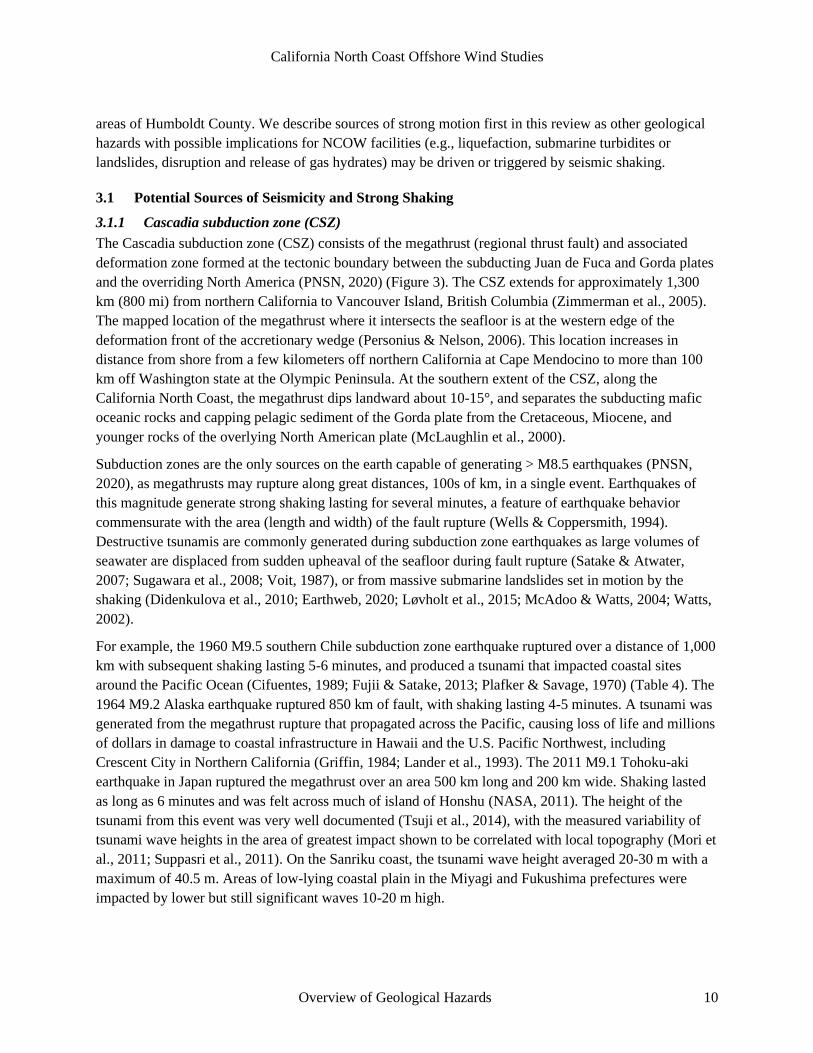
For example, the 1960 M9.5 southern Chile subduction zone earthquake ruptured over a distance of 1,000
km with subsequent shaking lasting 5-6 minutes, and produced a tsunami that impacted coastal sites
around the Pacific Ocean (Cifuentes, 1989; Fujii & Satake, 2013; Plafker & Savage, 1970) (Table 4). The
1964 M9.2 Alaska earthquake ruptured 850 km of fault, with shaking lasting 4-5 minutes. A tsunami was
generated from the megathrust rupture that propagated across the Pacific, causing loss of life and millions
of dollars in damage to coastal infrastructure in Hawaii and the U.S. Pacific Northwest, including
Crescent City in Northern California (Griffin, 1984; Lander et al., 1993). The 2011 M9.1 Tohoku-aki
earthquake in Japan ruptured the megathrust over an area 500 km long and 200 km wide. Shaking lasted
as long as 6 minutes and was felt across much of island of Honshu (NASA, 2011). The height of the
tsunami from this event was very well documented (Tsuji et al., 2014), with the measured variability of
tsunami wave heights in the area of greatest impact shown to be correlated with local topography (Mori et
al., 2011; Suppasri et al., 2011). On the Sanriku coast, the tsunami wave height averaged 20-30 m with a
maximum of 40.5 m. Areas of low-lying coastal plain in the Miyagi and Fukushima prefectures were
impacted by lower but still significant waves 10-20 m high.

California North Coast Offshore Wind Studies
Overview of Geological Hazards 11
Figure 3. Map showing the extent of the Cascadia subduction zone off northwestern North America.
Table 4. Example of historical subduction zone earthquakes.
Subduction zone earthquake year
and location Magnitude (M) Length of rupture
(km) Width of rupture
zone (km)
Duration of shaking
(minutes)
Tsunami average height / maximum height in area of greatest impact
1960 Chile 9.5 1,000 200 5-6 2-10 m / 25 m at Isla Mocha1
1964 Alaska 9.2 850 250 4-5
10-20 m / 32 m at Prince William Sound (Whittier, Chenega Cove)2
2004 Sumatra-Andaman
9.2 1,200 180 8-10 5-10 m / 50 m at Northern Sumatra3
2010 Chile 8.8 500 200 3 5-10/ 29 m at Maule region – Constitución4
2011 Tohoku-aki, Japan
9.1 500 200 6 20-30 / 40.5 m at Sanriku coast5
References for tsunami observations: 1–NCEI (2020); 2–Nicolsky (2013), Earthweb (2020); 3–Choi et al.(2006); 4–Fritz et al. (2011a); 5–Suppasri et al. (2011).

California North Coast Offshore Wind Studies
Overview of Geological Hazards 12
The largest earthquakes emanating from the Cascadia subduction zone will be from sudden rupture and
strain release along the megathrust, but significant earthquakes > M7 are possible from displacement of
crustal faults within the overriding North America plate or faults deep within the subducting Gorda plate
(USGS, 2020i). Like other subduction zones, the data show that the CSZ has and will rupture along
segments of different lengths as well in full-margin ruptures (Goldfinger et al., 2012, 2013; Leonard et al.,
2010; Nelson et al., 1995, 2006; Satake et al., 2003). Modeling suggests that segment ruptures that only
incorporate portions of the southern and central CSZ possess the potential to generate earthquakes in the
range M7.4-8.7 (Goldfinger et al., 2013).
Prior to the 1980s, the potential for the CSZ to produce great earthquakes was not well understood,
because unlike other subduction zones fringing the Pacific, the CSZ had not ruptured in an M8 or larger
earthquake during the more than 250 years since the arrival of European settlers on the northwestern coast
of North America and introduction of written history for the area. However, in the mid-1980s the
potential for the CSZ to generate great earthquakes was revealed through breakthroughs in two areas of
earthquake science: (1) geodetic and geophysical modeling that demonstrated the similarities between the
CSZ and other subduction zones fringing the Pacific that produced major ruptures in the 20th century
(Heaton & Hartzell, 1986, 1987; Heaton & Kanamori, 1984); and (2) a geological and geochronological
study that provided field evidence for that great CSZ earthquakes had occurred in the past, and the
approximate timing of those prehistorical events (Atwater, 1987).
The analyses by Heaton and Kanamori (1984) and Heaton and Hartzell (1986, 1987) showed that the CSZ
had more characteristics in common with strongly coupled subduction zones that rupture in great (M8) to
giant (M9) earthquakes than with “Marinas type, weakly coupled” (Heaton & Hartzell, 1987, p. 162) plate
boundaries that do not produce large earthquakes. In particular they noted the similarities between
convergence rate and age of the subducting slab at the CSZ with other subduction zones that had
produced great historical ruptures: the 1960 M9.5 southern Chile subduction zone earthquake; the 1944
and 1946 M8.1 earthquakes off southwestern Japan; and the 1906 M8.8 earthquake in the northern Peru-
Chile subduction zone off Colombia and Ecuador. The combination of high convergence rates, young and
relatively buoyant subducting oceanic lithosphere, and amount of sediment supply at the megathrust
interface of Cascadia compared to other seismogenic subduction zones suggest that the CSZ is capable of
great earthquakes (Oleskevich et al., 1999).
The geophysical theories that the CSZ could produce great earthquakes were validated by Atwater (1987)
who discovered geological field evidence for past subduction zone earthquakes and associated tsunami
inundation in coastal southwestern Washington. The geological and chronological data at the type
localities in Willapa Bay, Washington, showed evidence for 6 CSZ earthquakes in the past 3,500 years,
some of which were associated with tsunamis. The stratigraphic signature of the past earthquakes
discovered by Atwater (1987) adjacent to the CSZ is comparable to what is observed at coastal localities
along other subduction zones such as Chile (Garrett et al., 2015; Nelson et al., 2009), Alaska (Hamilton &
Shennan, 2005; Savage & Plafker, 1991; Shennan & Hamilton, 2006a), and Japan (Imakiire & Koarai,
2012a). It is characterized by marsh or forest soils showing evidence for abrupt burial by tidal flat mud,
caused by land surfaces physically dropping relative to sea level during the earthquakes (“coseismic
subsidence”), a result of the fault offset and flexure of the overriding plate during the subduction zone
earthquake.

California North Coast Offshore Wind Studies
Overview of Geological Hazards 13
Since Atwater’s (1987) seminal paper on field evidence for past CSZ earthquakes, scores of studies at
coastal and estuarine sites along the length of the CSZ from California to maritime British Columbia have
documented field evidence for CSZ earthquakes, and worked to demonstrate earthquake correlation and
recurrence among different sites. The accepted view now is that the CSZ has ruptured in >M8
earthquakes in the past, and is currently locked by friction at depths shallower than about 30 km, building
seismic stresses for a future rupture (Hyndman & Wang, 1995; Savage et al., 1991; Wang et al., 2003;
Wang & Tréhu, 2016).
The most recent major CSZ earthquake occurred on 27 January 1700. It is interpreted as a >M9 full-
margin rupture, and documented by field evidence along the length of the CSZ from California to British
Columbia. The uniquely precise date of the 1700 C.E. earthquake, which preceded written history in
maritime British Columbia and the U.S. Pacific Northwest, is based on historical records in Japan of a
destructive tsunami that had no local source, but was consistent with originating from a CSZ earthquake
across the Pacific Ocean (Atwater et al., 2005). Using data on the inundation in Japan, Satake et al. (1996,
2003) were able to calculate both the date of the event and the amount of rupture (~M9) required to
produce a tsunami of that size on Japan coast.
In northern California, investigations into the record of past CSZ earthquakes have focused on Humboldt
Bay and the lower Eel River valley (Carver et al., 1998a; Engelhart et al., 2016; E. Hemphill-Haley, 2017;
W.-H. Li, 1992; Padgett et al., in press; Patton, 2004b; Pritchard, 2004; Valentine et al., 2012) and sites
between the Klamath River and northern Crescent City (Abramson, 1998; Carver et al., 1998a; Garrison-
Laney, 1998; E. Hemphill-Haley et al., 2019; Peterson et al., 2011). Pertinent studies in central and
southern Oregon include Goldfinger et al., 2012, 2013; Graehl et al., 2015; Hawkes et al., 2011; Kelsey et
al., 2002a, 2005a; Milker et al., 2016; Nelson et al., 2006; Peterson et al., 2015; Witter et al., 2001, 2003.
In southern Humboldt Bay, at Hookton Slough, Patton (2004) reported evidence for 4 past CSZ
earthquakes, 2 of which may have been accompanied by tsunamis (Table 5).
Valentine et al. (2012) includes a compilation of stratigraphic, biostratigraphic, and radiocarbon data for
sites between the lower Eel River valley and northern Humboldt Bay (Table 5). The earthquake
chronology presented in this paper is based on unpublished masters theses and reports, in the 1980s and
1990s (Carver, 1992; Carver et al., 1998; Li, 1992; Valentine, 1992; Vick, 1988), and relies on bulk
radiocarbon ages (Valentine et al., 2012, p. 1063) with the exception of 2 high-precision ages from other
studies included to support findings for the 1700 C.E. event at upper Mad River slough: (1) a high-
precision C14 age from the 1700 C.E. buried soil (Nelson et al., 1995) and a dendrochronological age
from a tree stump (Jacoby et al., 1995). They conclude that these Humboldt Bay area data show
deformation from 3-4 earthquakes from CSZ ruptures, and 2-3 earthquakes from local faults, in the past
2,000 years.
Recent work in northern Humboldt Bay provides the most updated evidence for the timing and amount of
deformation (subsidence) from past CSZ earthquakes over the past ~1,700 years (Engelhart et al., 2016;
Hemphill-Haley, 2017; Padgett et al., in press) (Table 5). The shorter age range (~1,700 years) of the
earthquake stratigraphy at northern Humboldt Bay sites is the result of a more recent development of
tidally dominated marsh environments that are suitable for identifying earthquake stratigraphy.

California North Coast Offshore Wind Studies
Overview of Geological Hazards 14
Table 5. Ages and recurrence intervals of earthquakes for the past 3,000 years on the southern Cascadia
subduction zone based on results of field studies between the lower Eel River valley and Crescent City,
California.
Southern Humboldt Bay (Patton, 2004)
Humboldt Bay (Valentine, 2012)
Northern Humboldt Bay (Padjett et al., in
press)
Crescent City and Lagoon Creek (Carver et al., 1988; Peterson
et al., 2011)
Crescent City (Hemphill-Haley et
al., 2019)
Radiocarbon ages of past CSZ earthquakes
1700 C.E.1 1700 C.E.1 1700 C.E.1 1700 C.E.1* 1700 C.E.1*
– – 875 cal yr B.P. (1075
C.E.)
943-743; 960-790 cal yr B.P. *
907-735 cal yr B.P.
- 1,400-1,150 cal yr BP 1,120 cal yr B.P. (830
C.E.) 1,055-778 cal yr B.P.* –
1,696-1,522 cal yr B.P.*
1,650-1,500 cal yr BP 1,620 cal yr B.P. (330
C.E. 1,690-1,350 cal yr
B.P.* ~1,694-1,558 cal yr
BP*
2,748-2,364 cal yr B.P.*
– – 2,707-2,361 cal yr
B.P.* –
– – – 2,920-2,488 cal yr
B.P.* –
3401-3606 cal yr B.P. – – – –
Estimated recurrence for CSZ earthquakes
650-720 yr
(past 2,400 yr)
(no recurrence estimate provided)
245-625 yr
(past 1,700 yr)
450 yr
(past 3,000 yr)
(no recurrence estimate provided)
Ages of possible earthquakes on local faults
– 500-600 cal yr BP – – –
– 1,000-1,250 cal yr BP – – –
– 1,900-1,750 cal yr BP – – –
* Includes biostratigraphic evidence for tsunami inundation.
1Radiocarbon ages consistent with the full-rupture event in 1700 C.E. 2Valentine et al. (2012) questioned whether this event represented a local or regional event, but evidence for significant coseismic subsidence at Mad River slough and age overlap with a CSZ earthquake identified in northern Humboldt by Padgett et al. (in press) suggests it is likely a CSZ event.
The earthquake studies at Crescent City, Lagoon Creek, and Redwood Creek (Carver et al., 1998a;
Hemphill-Haley et al., 2019; Peterson et al., 2011) (Table 5) primarily rely on the presence of
paleotsunami deposits to identify occurrences of past CSZ earthquakes, as the depositional environments
mostly consist of freshwater marshes and lagoons where evidence for coseismic subsidence is less
evident. However, Hemphill-Haley et al. (2019) identified both biostratigraphic and lithostratigraphic
evidence for subsidence during the 1700 C.E. earthquake at Crescent City.
Planning for proposed NCOW facilities will need to incorporate geological and geophysical modeling
that demonstrates that the megathrust is locked and therefore possesses the potential for >M8 earthquakes.
California North Coast Offshore Wind Studies
Overview of Geological Hazards 15
The last ~M9 full-rupture earthquake on the CSZ occurred in 1700 C.E., and recurrence of great
subduction zone earthquakes for the southern CSZ range from an estimated 245-720 years from the
onshore record at Humboldt Bay and Crescent City (Table 5) to ~240 years from the offshore turbidite
record (Goldfinger et al., 2012, 2013). Historical records of the intensity and duration of strong shaking
from modern events of the past 50-60 years may be used as reliable analogs for effects on infrastructure
from potential future events on the southern CSZ.
3.1.2 San Andreas fault (SAF)
The San Andreas fault (SAF) is part of a 100 km wide transform boundary that forms the interface
between the Pacific and North America tectonic plates (Wallace, 1990; Schulz & Wallace, 1997). At this
boundary, the Pacific plate is moving northwest relative to the North America plate, resulting in right-
lateral offset across the fault. The entire SAF extends for about 1,200 km (750 mi) from near the Salton
Sea in southern California to the MTJ offshore from Cape Mendocino in the north (Figure 2 and Figure
4). The SAF is divided into 3 sections (northern, central, and southern) based on different characteristics
including slip rates and historical rupture history (Schulz & Wallace, 1997; Berkeley Seismological Lab,
2020). The northern SAF, which extends from Hollister, California, in the south to the MTJ in the north,
is the youngest section of the SAF. This section developed over approximately the past 10 million years
by the northward migration of the triple junction (Furlong & Schwartz, 2004; Stoffer, 2005; Wallace,
1990), and experiences slip rates of about 35-40 mm/yr (Freymueller et al., 1999).
Potential strong shaking from earthquakes along the northern SAF is significant for the North Coast
because of proximity and history of past events. The northern SAF has been the source of possibly 8-12
large earthquakes over the past few millennium based on paleoseismic research (Kelson et al., 2006;
Niemi, 2010; Weldon et al., 2013; H. Zhang et al., 2006). A chronology for deep-sea turbidites, dense
subaqueous flows that can be generated by seismic shaking, identified possibly two major ruptures of the
northern SAF, one ~1300 C.E. and the other in the mid-1600s C.E. (Goldfinger et al., 2003). Historically,
have been three significant ruptures along the northern SAF: the 1838 Peninsula San Andreas earthquake
(~M 7); the 1906 San Francisco earthquake (M 7.9); and the 1989 Loma Prieta earthquake (M 6.9)
(Bakun & Prescott, 1993; Ellsworth et al., 2013; Holzer, 1992; Schwartz et al., 2014; Streig et al., 2014;
Toppozada & Borchardt, 1998).
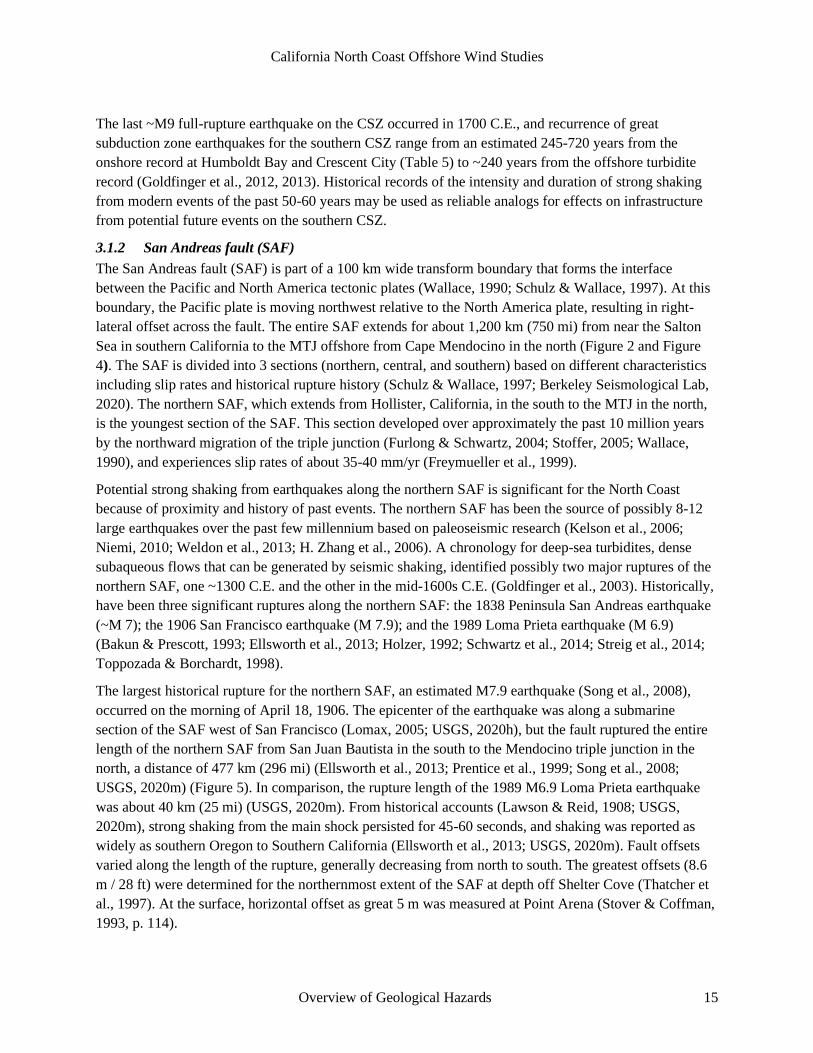
The largest historical rupture for the northern SAF, an estimated M7.9 earthquake (Song et al., 2008),
occurred on the morning of April 18, 1906. The epicenter of the earthquake was along a submarine
section of the SAF west of San Francisco (Lomax, 2005; USGS, 2020h), but the fault ruptured the entire
length of the northern SAF from San Juan Bautista in the south to the Mendocino triple junction in the
north, a distance of 477 km (296 mi) (Ellsworth et al., 2013; Prentice et al., 1999; Song et al., 2008;
USGS, 2020m) (Figure 5). In comparison, the rupture length of the 1989 M6.9 Loma Prieta earthquake
was about 40 km (25 mi) (USGS, 2020m). From historical accounts (Lawson & Reid, 1908; USGS,
2020m), strong shaking from the main shock persisted for 45-60 seconds, and shaking was reported as
widely as southern Oregon to Southern California (Ellsworth et al., 2013; USGS, 2020m). Fault offsets
varied along the length of the rupture, generally decreasing from north to south. The greatest offsets (8.6
m / 28 ft) were determined for the northernmost extent of the SAF at depth off Shelter Cove (Thatcher et
al., 1997). At the surface, horizontal offset as great 5 m was measured at Point Arena (Stover & Coffman,
1993, p. 114).

California North Coast Offshore Wind Studies
Overview of Geological Hazards 16
Figure 4. USGS base map of the San Andreas fault in California. The 1906 rupture extended from San
Juan Batista in the south to off Cape Mendocino in the north (Accessed June 2020 from:
https://pubs.usgs.gov/gip/earthq3/where.html).
California North Coast Offshore Wind Studies
Overview of Geological Hazards 17
Figure 5. Map showing the 1906 rupture length of the San Andreas fault and area of impact from the
earthquake. (From Dengler et al., 2008, their Figure 1).
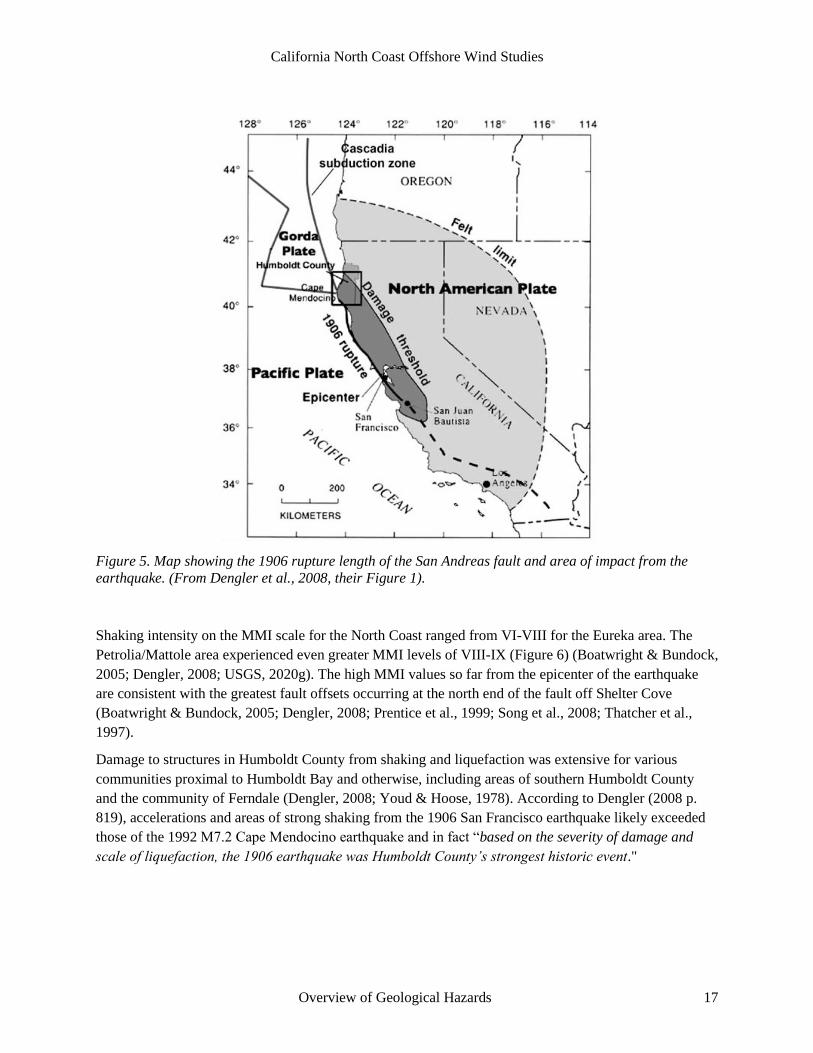
Shaking intensity on the MMI scale for the North Coast ranged from VI-VIII for the Eureka area. The
Petrolia/Mattole area experienced even greater MMI levels of VIII-IX (Figure 6) (Boatwright & Bundock,
2005; Dengler, 2008; USGS, 2020g). The high MMI values so far from the epicenter of the earthquake
are consistent with the greatest fault offsets occurring at the north end of the fault off Shelter Cove
(Boatwright & Bundock, 2005; Dengler, 2008; Prentice et al., 1999; Song et al., 2008; Thatcher et al.,
1997).
Damage to structures in Humboldt County from shaking and liquefaction was extensive for various
communities proximal to Humboldt Bay and otherwise, including areas of southern Humboldt County
and the community of Ferndale (Dengler, 2008; Youd & Hoose, 1978). According to Dengler (2008 p.
819), accelerations and areas of strong shaking from the 1906 San Francisco earthquake likely exceeded
those of the 1992 M7.2 Cape Mendocino earthquake and in fact “based on the severity of damage and
scale of liquefaction, the 1906 earthquake was Humboldt County’s strongest historic event."
California North Coast Offshore Wind Studies
Overview of Geological Hazards 18
Figure 6. Modified Mercalli Intensity shake map of northern California for the 1906 San Andreas fault
earthquake. (From Boatwright and Bundock, 2005,
<https://pubs.usgs.gov/of/2005/1135/IntensityMaps.html>.)
Youd and Hoose (1978, pp. 170–173) compiled historical records of damage in Humboldt County, which
among other listings included:
• liquefaction and lateral spreading all along the Eel River at Dungan’s Ferry (p. 170);
• decommissioning of the Scotia Railroad because of a large landslide on the Eel River and damage
to metal beams on the railroad bridge (p. 171);

California North Coast Offshore Wind Studies
Overview of Geological Hazards 19
• major liquefaction and lateral spreading at Cock Robin Island and Cannibal Island near Ferndale,
with 1-10 ft of subsidence from liquefaction and numerous sand boils present (p. 171);
• damage to chimneys across communities south of Eureka (p. 171);
• 100 ft long fissure in road at Field’s Landing (p. 171);
• subsidence and damage at Pelican Island across from Field’s Landing such that the US Pile
Beacon dropped by 3 ft and was left standing at a 45° angle (p. 171);
• Sand boils and deep cracks from lateral spreading at Field’s Landing (p. 172);
• Water mains for the Eureka Water Company broken by subsidence at Elk River (p. 172);
• pipes and roads cracked at place called Sweasy Ranch near Eureka (p. 172);
• land around the Eureka foundry cracked and subsided (p. 172);
• water mains of the Eureka Water Company were twisted and broken as the grounded heaved up
(p. 172);
• ground subsidence (from liquefaction) of several feet beneath the Vance Company mill and
warehouses in Samoa (p. 173);
• subsidence in marshy areas (from liquefaction) between Eureka and Arcata (p. 173);
• cave-in for one end of the Loleta train tunnel (p. 173);
Planning for NCOW facilities will need to consider probabilities of large earthquakes along the northern
SAF. The recurrence interval for earthquakes on the northern SAF large enough to generate offsets that
can be measured in the geologic record is about 200 years (Weldon et al., 2013; Field et al., 2014;
Schwartz et al., 2014). The probability for a 1906-size event to occur within the planned lifetime of the
NCOWS project will need to be investigated. Field et al. (2014) report a 30% probability that the San
Francisco Bay Area will experience a M7.5 earthquake in the next 30 years, but note that rupture is more
likely along faults within the San Andreas fault zone to the east of the SAF, namely the Hayward-Rodgers
Creek and Calaveras Faults, which have not ruptured as recently as the 1906 northern SAF event (Field et
al., 2014; Watt et al., 2016). How rupture along these faults and their northern extensions will affect
NCOWS sites and infrastructure will need to be evaluated. Petersen et al. (2020) and Rukstales and
Shumway (2019) provide probabilistic estimates for strong motion within the continental US. They
estimate that the northern coast of California has a 10% chance of peak horizontal ground accelerations
exceeding 0.4 to 0.8 g in 50 years (Figure 7).

California North Coast Offshore Wind Studies
Overview of Geological Hazards 20
Figure 7. Probabilistic seismic hazard model showing a 10% probability of peak ground accelerations
exceeded 0.4-0.8 g in coastal Northern California over the next 50 years. (From Rukstales and Shumway,
2019, <https://www.sciencebase.gov/catalog/item/5d5597d0e4b01d82ce8e3ff1>.)
3.1.3 Mendocino Fault (MF)
The Mendocino fault (MF) is a near-vertical, right-lateral transform boundary that separates the Pacific
plate to the south and Gorda plate to the north (Figure 2). The MF strikes east-west for about 260 km (160
mi) from the MTJ to the Gorda Ridge near longitude 127.5°W (Bryant, 2001; Dengler et al., 1995). It is
the divergent spreading at Gorda Ridge drives the right-lateral motion along the MF (McLaughlin et al.,
2000).
Prior to its recognition as a tectonic transform boundary, the MF was labeled as the “Gorda escarpment”
(Shepard, 1957) or “Mendocino escarpment” (Bolt et al., 1968) because of its sections of steep north- or
south-facing escarpments, or “Mendocino fracture zone” (McLaughlin et al., 2000) because of its obvious
frequent seismic activity. It is now accepted that “Mendocino fault” is appropriate for the area east of the
Gorda Ridge where right-lateral fault slip is occurring (Bryant, 2001; Clarke Jr. & Field, 1989; Jennings
& Saucedo, 1994).
The Mendocino fault is a highly seismically active region and a frequent source of felt seismic shocks for
the North Coast (Bryant, 2001), although most earthquakes generated in this area are small. A search of
the USGS interactive online earthquake map (https://earthquake.usgs.gov/earthquakes) shows > 400

California North Coast Offshore Wind Studies
Overview of Geological Hazards 21
earthquakes greater than M4.5 along the MF since 1960, and 63 that exceeded M5. However, only
earthquakes at the eastern end of the MF will likely impact onshore and nearshore infrastructure. For
example, the 1994 M6.9 earthquake on the MF, although a large event, was 140 km (85 mi) from shore.
Intensities did not exceed MMI-III on land and it caused little damage (Dengler et al., 1995). Larger and
closer events on the MF are possible, however, according to Bakun (2000) who estimated from historical
records that a possible M7 earthquake occurred on the MF in 1878 within 75 km (46 mi) from shore.
Further discussion on recent (post-1960) earthquakes along the MF is provided in Section 3.3 (“North
Coast Earthquakes > M6.0 Since 1960”).
3.1.4 Gorda plate
The Gorda plate is the southernmost oceanic tectonic plate that is being subducted beneath the North
America plate at the Cascadia subduction zone (Figure 2). It extends between approximately latitudes
40°N and 43°N, and is separated from the oceanic Juan de Fuca plate to the north by the Blanco fracture
zone (Figure 3, Figure 8, Table 6). Earlier studies included the Gorda plate as a southern section of the
Juan de Fuca plate (e.g., Stoddard, 1991; Dziak et al., 2001; Rollins and Stein, 2010; Stoddard, 1991), but
it is now recognized as a distinct tectonic plate with characteristics different from either the Juan de Fuca
plate to the north or Pacific plate to the south of the MF and MTJ (Chaytor et al., 2004; Dziak et al., 2001;
Fox & Dziak, 1999; Gulick et al., 2001).
The Gorda plate is actively deforming under tectonic stresses and therefore an area of frequent fault
rupture and seismicity (Chaytor et al., 2004; Dziak et al., 2001; Fox & Dziak, 1999; Gulick et al., 2001;
Kilbourne & Saucedo, 1981; Rollins & Stein, 2010; Tobin & Sykes, 1968; Wilson, 1989). It is also the
primary source of felt earthquakes for the North Coast area (USGS, 2020l).
A prominent feature of the Gorda plate area is the preponderance of northeast striking left-lateral faults
(Chaytor et al., 2004; Gulick et al., 2001; Smith et al., 1993; Stoddard, 1991; Wilson, 2012) (Figure 8,

California North Coast Offshore Wind Studies
Overview of Geological Hazards 22
Table 6). This faulting pattern is the result of the north-south compression and east-west extension that
the Gorda plate experiences because of its position between the subducting Juan de Fuca plate to the north
and the east-west striking Mendocino fault to the south (Rollins and Stein, 2010). In addition, the Gorda
plate as a mass is rotating in a clockwise direction as it concurrently moves eastward toward the
subduction interface, a result of slower spreading rates in the southern part of the Gorda Ridge compared
to the north, compounding the tectonic stresses and propensity for brittle deformation (D. S. Wilson,
2012) (Figure 8).
The geologically frequent, earthquake-generating, left-lateral fault ruptures in the Gorda plate are the
result of the combined tectonic forces of compression, extension, and internal plate rotation. (Figure 8).
As described by Rollins and Stein (2010, p. 1), the Gorda plate1 is “a 50,000 km2 area of diffuse shear and
rotation offshore northernmost California” which “has been the site of 20 M ≥ 5.9 earthquakes on four
different fault orientations since 1976, including four M ≥ 7 shocks.” Rollins and Stein (2010, p. 1) noted
that, based on the frequency and size of earthquakes, the Gorda plate produced “the highest rate of large
earthquakes in the contiguous United States.” In addition to the 20 earthquakes between 1976-2010
described by Rollins and Stein (2010) (Figure 8,
1 Rollins and Stein (2010) referred to the Gorda plate as the “Gorda deformation zone.”

California North Coast Offshore Wind Studies
Overview of Geological Hazards 23
Table 6), an additional 3 earthquakes > M5.9 have been
Figure 8. Map of the Gorda plate ("Gorda deformation zone") by Rollins and Stein, 2010. Letters indicate
epicenters for earthquakes > M5.9 between the years 1976 and 2010. Earthquake magnitudes are listed
in Table 6.

California North Coast Offshore Wind Studies
Overview of Geological Hazards 24
Table 6. Earthquakes shown on Figure 8, the Rollins and Stein (2010) map of the Gorda plate (“Gorda
deformation zone”). Earthquakes shown are those >M5.9 that occurred during the time period 1976-
2010.
Earthquake epicenter ID
shown on Figure SM 6 (Rollins and Stein (2010)
map Year Magnitude
(M)
Earthquake epicenter ID
shown on Figure SM 6 (Rollins and Stein (2010)
map Year Magnitude
(M)
A 1976 6.7 K 1992 6.5
B 1980 7.3 L 1992 6.6
C 1983 6.1 M 1994 7.0
D 1984 6.6 N 1995 6.6
E 1987 6.0 O 2000 5.9
F 1991 6.8 P 2005 7.2
G 1991 6.3 Q 2005 6.6
H 1991 6.1 R 2008 5.9
I 1991 7.1 S 2010 6.5
J 1992 6.9 T 2010 5.9
Data summarized from Rollins and Stein, 2010, p. 3, Table 1
recorded from the Gorda plate: an M6.5 event in 2010; an M6.8 event in 2014; and an M6.6 event in 2016
(USGS, 2020l). The issue of frequent seismicity in the Gorda plate is examined further in Section 3.3,
below.
The Gorda plate is seismically active and is the tectonic plate adjacent to, and subducting beneath, the
North Coast. The NCOWS project will have to consider the effects of fault rupture in the Gorda plate,
potentially within close enough proximity to onshore and offshore structures to represent a major seismic
hazard.
3.1.5 Faults in the Fold and Thrust Belt of the Accretionary Wedge
The Cascadia subduction zone accretionary prism in the North Coast area is an approximately 85 to 100
km wide and 2,500 m thick zone of sedimentary rocks consisting of deformed deep-trench and lower-
slope Miocene basin sediments overlain by the shallower water “Wildcat Group,” which consists of late
Pliocene to Pleistocene shelf and margin deposits (Clarke & Carver, 1992b; Field et al., 1980; Hill et al.,
2020; Ogle, 1953; Swan, Carver, McLaren, et al., 2002; Woodward-Clyde Consultants, 1980). These
sedimentary units, in turn, overlie middle Jurassic to early Tertiary Franciscan Complex metasedimentary
and igneous rocks (Burger et al., 2002b; Ogle, 1953). The dominant feature of the accretionary prism is
the Eel River basin, a forearc basin, which extends for approximately 210 km northwestward from near
Cape Mendocino and is bordered on the west by the subduction zone. Onshore, the Eel River basin
comprises the northwest trending Eel River valley; offshore it becomes north-northwest oriented and

California North Coast Offshore Wind Studies
Overview of Geological Hazards 25
extends to near Cape Sebastian, Oregon (Burger et al., 2002b). This change in orientation of the Eel River
Basin occurs in the vicinity of the Humboldt Call Area.
Faults and folds that are part of the upper-plate structure of the Cascadia subduction margin have been
identified in bathymetric and seismic sections within the accretionary prism (Figure 9, Figure 10 and
Figure 11), with evidence that they have deformed or offset basin-fill deposits, and some instances,
Holocene marine sediments (Burger et al., 2002b; Clarke & Carver, 1992b; Field et al., 1980; Hill et al.,
2020; McLaughlin et al., 2000; Swan, Carver, McLaren, et al., 2002; Woodward-Clyde Consultants,
1980). Clarke and Carver (1992b) and McLaughlin et al. (2000) define the faults as southwest-vergent
(hanging wall moving toward the southwest), northeast-dipping thrust faults that create imbricated faulted
sections of the marine sediments. Associated with the thrust faults are asymmetric, hanging-wall folds
that form synclinal troughs and anticlinal ridges. Field et al. (1980) describe the offshore structures as
“broad and gentle to narrow and tight; most are symmetrical or nearly so.” Clarke and Carver (1992b)
and McLaughlin et al. (2000) note that sediments are more intensely deformed at the southern end of the
accretionary prism, likely as a result of stronger coupling as the Cascadia megathrust encounters the
Mendocino fault and comes closer to land. Field et al. (1980) describe relief across the surface of the
accretionary prism to be up to 200 m as a result of folding of sediments as young as Holocene in age.
Both the Little Salmon and Table Bluff faults are represented in the bathymetry and in subsurface seismic
sections within the Humboldt Call Area.
California North Coast Offshore Wind Studies
Overview of Geological Hazards 26
Figure 9. Cascadia subduction zone accretionary prism relative to the location of the Humboldt Call
Area. Call Area boundary indicated by black polygon centered at approximately 41°N. Multi-colored
subparallel lines represent locations of bathymetric profiles completed by Hill et al. (2020). Red line
represents the location of seismic profile in Figure 10. Orange line represents location of seismic profile
in Figure 11. (Modified from Hill et al., 2020, their Figure 3).

California North Coast Offshore Wind Studies
Overview of Geological Hazards 27
Figure 10. Uninterpreted and interpreted seismic reflection profile constructed in NE to SW azimuth
roughly parallel to the coastline (see Figure 9 for location). Profile shows Freshwater, South Bay and Eel
River synclines, and Little Salmon, South Bay, and Table Bluff anticlines as well as faults within the Little
Salmon and Table Bluff anticlines. Interpretations represent faults as nearly vertical structures which is
in contrast to on-land documentation of faults dipping from 20° to 35°. Several faults within each zone
are interpreted as displacing youngest sediments. (From Burger et al., 2002, their Figure 3).
Figure 11. Multi-channel seismic profile collected along a NE-SW azimuth that transects the southern
end of the Humboldt Call Area (see Figure 9 for profile location). Of note are the oceanic Gorda plate to
the west; the steep, highly deformed deformation front at the seaward end of the Cascadia megathrust;
and the Table Bluff and Little Salmon anticlines and associated faults. (From Hill et al., 2020, their
Figure 6d).

California North Coast Offshore Wind Studies
Overview of Geological Hazards 28
Swan (2002) describes a series of onshore Quaternary anticlines (Figure 12) as active thrust fault-
associated folds that are the projection of related structures identified offshore (Burger et al., 2002a;
Clarke & Carver, 1992; Field et al., 1980; Hill et al., 2020). These include the Table Bluff anticline and
Humboldt Hill (also referred to as the Little Salmon anticline), which are germane to this study as they
are near the port infrastructure on the Samoa Peninsula, the power cable landing and substation on the
South Spit and near King Salmon and also may traverse transmission pathways and are located within the
Humboldt Call Area. The folds have up to 1.5 km of structural relief and are asymmetrical. The Humboldt
Hill anticline has a long-gentle northeast sloping limb while the Table Bluff anticline has a gently dipping
southern limb. Swan (2002) also describes a series of subsiding, synclinal basins in the onshore area that
include the Freshwater syncline forming Arcata Bay and the South Bay syncline that forms Southern
Humboldt Bay (Figure 13).
3.1.5.1 Table Bluff Fault and Anticline
Onshore the Table Bluff fault consists of an interpreted deep, north-dipping, south vergent blind thrust
fault which is, in part, responsible for the Table Bluff anticline that separates Humboldt Bay from the Eel
River syncline (Swan et al., 2002; Vadurro, 2006; Woodward-Clyde Consultants, 1980) (Figure 13).
Seismic section data suggest that the anticline is the surface manifestation of a backthrust fault dipping
southward and soling into the larger north-dipping low angle fault that may merge with the Little Salmon
fault or possibly the Cascadia megathrust at depth (Swan et al., 2002). Seismic reflection profiles reveal a
prominent, approximately 3 km wide fault and anticline (Figure 9, Figure 10, and Figure 11). Burger et al.
(2002b) report that folding extends almost to the seafloor and that the fold is asymmetric suggesting
northward vergence. Contrary to onshore evidence, they suggest that the fault is nearly vertical and, rather
than vertical separation, shows evidence for right lateral displacement as indicated by offset of a channel
across the fault.

California North Coast Offshore Wind Studies
Overview of Geological Hazards 29
Figure 12. Geologic map of the Humboldt Bay Region. Of special note are the locations of the Eel River,
South Bay, and Freshwater synclines and the Table Bluff and Little Salmon faults which extend offshore
and are part of the Cascadia accretionary prism. (From Swan, 2002, his Figure 3.3).
Figure 13. Interpretation of proprietary seismic section from SSW to NE across the Eel River basin,
Table Bluff anticline and Humboldt Hill. The main Table Bluff fault is interpreted to be a north-dipping,
blind thrust fault, with the Table Bluff anticline representing the surface expression of a south-dipping
backthrust fault. The Little Salmon fault is thrusting Humboldt Hill southward over Tertiary and younger
sediments to the south. (From Vadurro, 2006, his Figure 3).

California North Coast Offshore Wind Studies
Overview of Geological Hazards 30
3.1.5.2 Little Salmon Fault
The Little Salmon fault is a major component of the upper plate fold and thrust belt structures of the
Cascadia subduction zone. It has been described as the southern 95 km of a 330 km long collection of
active faults and folds referred to as the Little Salmon fault system (Swan et al., 2002). Onshore, the fault
zone extends from the south, near Bridgeville, California, and strikes northwest along the Van Duzen
river valley through Humboldt Bay (Kelsey & Carver, 1988a; Nicovich, 2015; Swan et al., 2002;
Woodward-Clyde Consultants, 1980). From there it continues offshore striking northwest as far as
offshore southern Oregon (Swan, 2002). The offshore portion of the fault zone parallels the Cascadia
subduction deformation front in a system of en echelon anticlines and thrust faults (Swan et al., 2002).
Burger et al. (2002) interpret the Little Salmon fault as an approximately 7.5 km wide broad anticline
associated with near vertical faults. The on-land, upper portion of the fault dips to the northeast at about
20° to 35° (Kelsey & Carver, 1988b; McCrory, 2000; Woodward-Clyde Consultants, 1980). On land it is
described as 20 to 25 km wide, extending south to north from the Table Bluff anticline to the Freshwater
syncline (Swan et al., 2002).
Terrestrial fault studies (Figure 14) define the Little Salmon fault zone as consisting of imbricate, south-
vergent thrust sheets consisting of at least three splays at Humboldt Hill, which is an associated active
hanging wall anticline. These splays are interpreted as active during the Holocene (Swan, 2002; Vadurro
et al., 2006; Woodward-Clyde Consultants, 1980). The southwestern-most splay has been identified as the
having the greatest Holocene displacement (Carver & Burke, 1988; Swan, 2002; Witter et al., 2002;
Woodward-Clyde Consultants, 1980). This splay is located along the margin of Humboldt Bay at the
southwestern base of Humboldt Hill (Figure 12). The middle splay of the fault has been documented
through the College of the Redwoods campus by the consulting firm LACO Associates (Vadurro et al.,
2006). At that location the deformation is displayed as a single, low angle, northeast-dipping thrust fault
with a complex series of hanging wall backthrusts, normal faults, and folds that spans distance of more
than 500 m (Figure 15 and Figure 16).

California North Coast Offshore Wind Studies
Overview of Geological Hazards 31
Figure 14. Onshore map of the Little Salmon fault showing locations of fault investigation studies
conducted on multiple splays of the fault. The location of the Humboldt Bay Generating Station is shown
as “ISFSI SITE” on this map. (From Swan, 2002, his Figure 3-7).
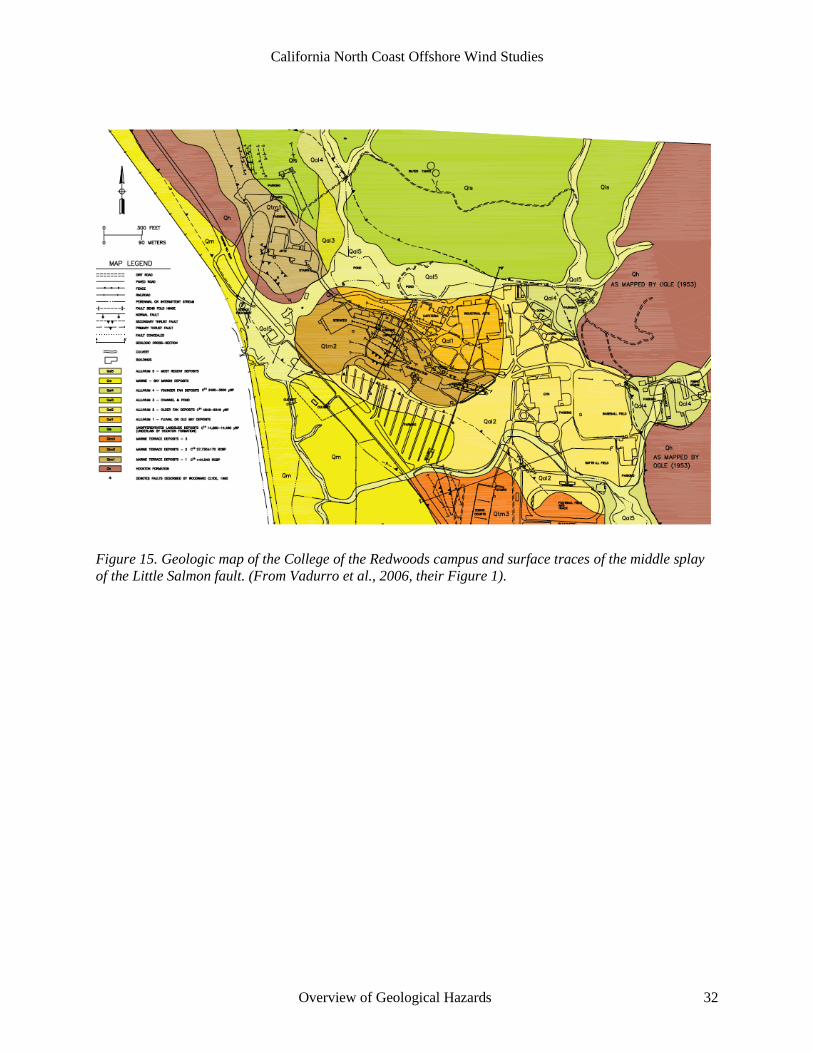
California North Coast Offshore Wind Studies
Overview of Geological Hazards 32
Figure 15. Geologic map of the College of the Redwoods campus and surface traces of the middle splay
of the Little Salmon fault. (From Vadurro et al., 2006, their Figure 1).

California North Coast Offshore Wind Studies
Overview of Geological Hazards 33
Figure 16. Cross-sections across the middle splay of the Little Salmon fault at College of the Redwoods
campus. See Figure 15 for cross-section locations. (From Vadurro et al., 2006, their Figure 4).
The eastern trace of the fault lies within the lower slopes of Humboldt Hill, traverses the upper, eastern
part of the College of the Redwoods campus and extends northwestward where it passes immediately
south of Buhne Point and the PG&E power plant site (Humboldt Bay Generating Station) where it is
referred to as the Bay Entrance fault (Swan et al., 2002). Proprietary deep seismic survey data (Figure 13)
provide a suggestion that the Little Salmon fault and adjacent Table Bluff fault sole into the Cascadia
megathrust at depth (Swan, 2002).
Paleoseismic investigations of the on-land portion of the fault indicate at least three surface rupture
(coseismic) events in the last 1,700 to 2,000 years with individual slip events accounting for 1 to more
than 4 m of displacement (Carver & Burke, 1988; Swan et al., 2002; Witter et al., 2002). Witter et al.
(2002) found evidence for a Little Salmon event less than 460 years ago but could not attribute that event
to coeval motion with the most recent event on the Cascadia megathrust. Thus, there is suggestion, but
not definitive evidence, that movement of the Little Salmon fault may be coincident with at least some
Cascadia megathrust events.
3.2 North Coast Earthquakes >M6 Since 1960
The proximity of the California North Coast to the complex tectonic regime of the Mendocino triple
junction and the deforming Gorda plate make it the most seismically active region in the conterminous
United States (Dengler et al., 1995, 2008; Freymueller et al., 1999; Furlong & Schwartz, 2004). Since the
mid-1960s, seismicity in Central and Northern California has been closely monitored through the
Northern California Seismic System (NCSS, 2020), a collaborative effort between the U.C. Berkeley
Seismological Laboratory and USGS. Since the launch of the NCSS, thousands of earthquakes have been

California North Coast Offshore Wind Studies
Overview of Geological Hazards 34
recorded in the North Coast region (USGS, 2020l), the vast majority of which were too small to be
detected except by seismographic instruments, or were felt by local citizens but did not result in damage
to infrastructure. For example, a search for recorded seismicity in an area bounded by latitudes 39°-43°N
and longitudes 128°-123°W—which encompasses the North Coast region and NCOWS area—identified
3,789 earthquakes > M2.5 in the past 20 years (2000-2020) (Figure 17) (USGS, 2020l). In comparison,
the area to the north encompassing the next 4 degrees of latitude (43°-47°N) recorded 669 earthquakes
>M2.5 over the same time period. In the area encompassing 4-degrees of latitude farther to the south,
between 35°-39°N, there were 56 earthquakes > M2.5 during this time.
Figure 17. Map showing earthquakes > M2.5 in the North Coast region in the time period 2000-2020.
The majority follow the east-west trend of the Mendocino fault.
These data show that the North Coast region experiences exceptionally frequent seismicity, higher than
compared to any other area of the conterminous U.S. Although most of the seismicity is associated with
low-magnitude earthquakes, the area has experienced 16 significant earthquakes > M6 associated with
deformation of the Gorda plate and Mendocino fault in just the past 60 years (Figure 18, Table 7).
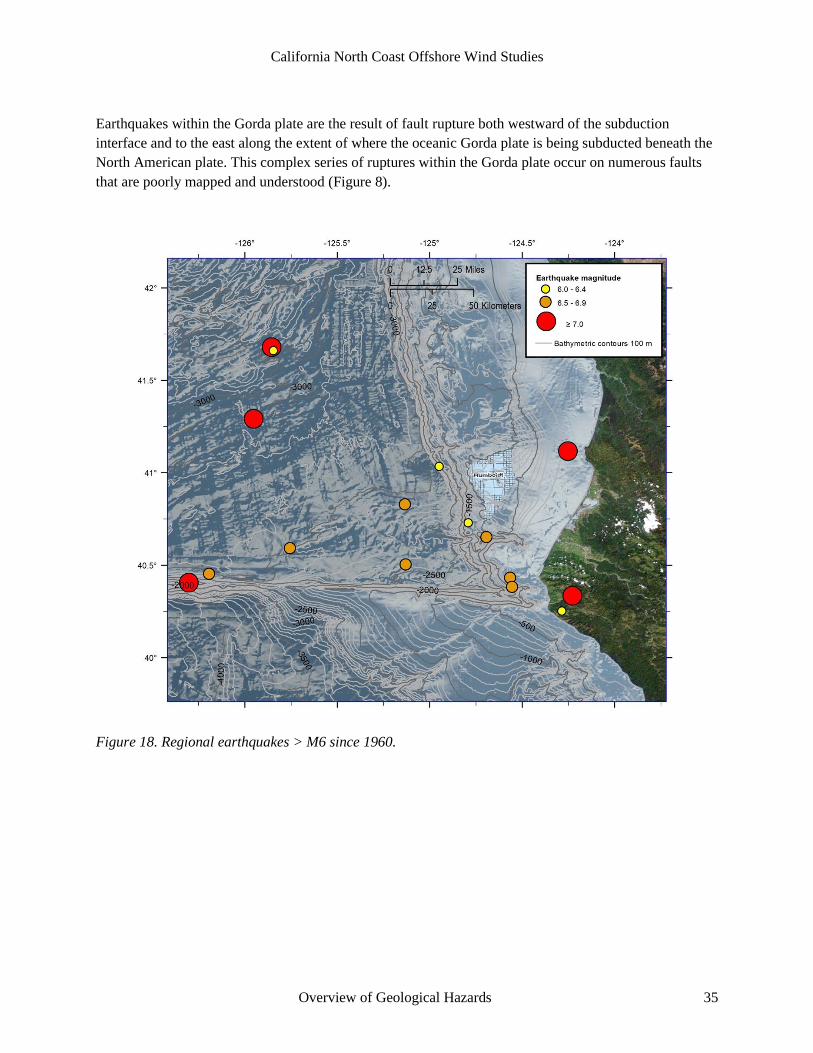
California North Coast Offshore Wind Studies
Overview of Geological Hazards 35
Earthquakes within the Gorda plate are the result of fault rupture both westward of the subduction
interface and to the east along the extent of where the oceanic Gorda plate is being subducted beneath the
North American plate. This complex series of ruptures within the Gorda plate occur on numerous faults
that are poorly mapped and understood (Figure 8).
Figure 18. Regional earthquakes > M6 since 1960.

California North Coast Offshore Wind Studies
Overview of Geological Hazards 36
Table 7. Regional earthquakes > M6 since 1960 (between latitudes 40°-42 N and longitudes 127°-123°W.
Year Magnitude
(M) Depth (km)
Epicenter location (decimal latitude,
longitude) Description Event date/time Data Source (USGS
Earthquake Catalog)
1980 7.2 19.0 41.117°N
124.253°W
Gorda Plate; 5 miles NW of Trinidad. Large, left-lateral strike slip fault, striking N50E from the Mendocino Fracture Zone
1980-11-08 10:27:34 (UTC)
https://earthquake.usgs.gov/earthquakes/eventpage/usp0001aq1/executive
1991 7.0 1.3 41.679°N
125.856°W Central Gorda Plate. Left-lateral strike-slip fault.
1991-08-17 22:17:09 (UTC)
https://earthquake.usgs.gov/earthquakes/eventpage/nc228064/executive
1992 7.2 9.9 40.335°N
124.229°W
Cape Mendocino (Petrolia). Oblique-slip fault with reverse component. Coseismic uplift of 1.5 m recorded at the coast near Petrolia. Generated tsunami with maximum wave heights (peak-to-trough) of 1.1 m at Crescent City. California, and 0.1 meters on Hawaii. Two large earthquakes (M6.5 and M6.6) occurred in the same area on the following day, 26 April 1992.
1992-04-25 18:06:05 (UTC) (11:06 am PDT)
https://earthquake.usgs.gov/earthquakes/eventpage/nc269151/executive
1994 7.0 5.0 40.406°N
126.303°W
Mendocino Fracture Zone, 70 miles west of Cape Mendocino. Strike-slip fault
1994-09-01 15:15:48 (UTC)
https://earthquake.usgs.gov/earthquakes/eventpage/nc30056327/executive
2005 7.2 16.0 41.292°N
125.953°W
Central Gorda Plate, 110 km west of epicenter of 1980 M7.2 event. Northeast striking left-lateral strike-slip fault
2005-06-15 02:50:54 (UTC)
https://earthquake.usgs.gov/earthquakes/eventpage/usp000dt25/executive
1960 6.0 15.0 40.729°N
124.792°W Gorda plate, 25 mile NW of Eel River
1960-06-06 01:17:53 (UTC)
https://earthquake.usgs.gov/earthquakes/eventpage/iscgem879414/executive
1976 6.3 41.8 41.035°N
124.950°W Gorda plate, 35 mi NW of Eureka. Strike-slip fault
1976-11-26 11:19:32 (UTC)
https://earthquake.usgs.gov/earthquakes/eventpage/nc1032447/executive
1984 6.6 4.3 40.504°N
125.130°W Gorda plate, 40 miles NW of Cape Mendocino
1984-09-10 03:14:28 (UTC)
https://earthquake.usgs.gov/earthquakes/eventpage/nc27615/executive
1991 6.1 2.5 41.661°N
125.846°W Central Gorda Plate. Strike-slip fault with small reverse component.
1991-08-16 22:26:14 (UTC)
https://earthquake.usgs.gov/earthquakes/eventpage/nc227958/executive
1991 6.0 8.3 40.252°N
124.286°W Cape Mendocino. Reverse (thrust) fault; mechanism poorly constrained.
1991-08-17 19:29:40 (UTC)
https://earthquake.usgs.gov/earthquakes/eventpage/nc228027/executive
1992 6.5 18.8 km
40.433°N 124.566°W
Cape Mendocino (Petrolia) / Gorda plate. This earthquake occurred less than 24 hours later and in the same area as the M7.2 earthquake on 25 April 1992. Strike-slip fault with small reverse component.
1992-04-26 07:41:40 (UTC) (12:42 am PDT)
https://earthquake.usgs.gov/earthquakes/eventpage/nc268031/executive

California North Coast Offshore Wind Studies
Overview of Geological Hazards 37
Year Magnitude
(M) Depth (km)
Epicenter location (decimal latitude,
longitude) Description Event date/time Data Source (USGS
Earthquake Catalog)
1992 6.6 21.7 40.383°N
124.555°W
Cape Mendocino (Petrolia) / Gorda Plate. Occurred less than 4 hours after the M6.5 earthquake, and less than 24 hours after the M7.2 earthquake. Strike-slip fault with small reverse component.
1992-04-26 11:18:25 (UTC) (4:19
am PDT)
https://earthquake.usgs.gov/earthquakes/eventpage/nc268078/executive
1995 6.6 4.6 40.592°N
125.757°W Southern Gorda plate. Strike-slip fault.
1995-02-19 04:03:14 (UTC)
https://earthquake.usgs.gov/earthquakes/eventpage/nc30068187/executive
2010 6.5 28.7 40.652°N
124.693°W
Southern Gorda Plate, 20 miles W of Eel River. Near vertical strike-slip fault striking N47E.
2010-01-10 00:27:39 (UTC)
https://earthquake.usgs.gov/earthquakes/eventpage/nc71338066/executive
2014 6.8 16.4 40.829°N
125.134°W
Southern Gorda Plate, 40 miles W of Eureka. Oblique-slip fault with reverse component.
2014-03-10 05:18:13 (UTC)
https://earthquake.usgs.gov/earthquakes/eventpage/nc72182046/executive
2016 6.6 8.5 40.454°N
126.194°W Mendocino Fracture Zone. Right-lateral strike-slip fault.
2016-12-08 14:49:45 (UTC)
https://earthquake.usgs.gov/earthquakes/eventpage/us20007z6r/executive
The most recent earthquakes of greatest concern in terms of the built environment on the North Coast
were the 1980 M7.2 earthquake; the 1992 M7.2 earthquake and associated M6.5 and M6.6 aftershocks;
and the 2010 M6.5 earthquake. Several other sizeable earthquakes during that time period include two
earthquakes in the Gorda plate in 1991 (M7.0) and 2005 (M7.2), and an M7.2 earthquake on the
Mendocino fault in 2005, but each of these were too distant (>130 km) to generate strong shaking
onshore2 (Figure 18) (Dengler et al., 1995; USGS, 2020l). There was also a strong earthquake in 1954
that caused damage, including from liquefaction, in the Eureka-Arcata area. The size of the this
earthquake is estimated as M6.5 (USGS, 2020c), but it is not well documented as it occurred prior to the
launch of the NCSS network. Bakun (2000, p. 799) used historical records of shaking intensity in
Northern California and coincident reports in more distant areas in California and Oregon to propose that
earthquakes > M7.0 may have also occurred either in the Gorda plate or Mendocino fault in 1873, 1878,
1899, 1923, and 1945.
3.2.1 1980 M7.2 Earthquake
The M7.2 earthquake on November 8, 1980 was the largest event for the North Coast region in several
decades (USGS, 2020g). According to eyewitness accounts, strong shaking lasted locally for 15-20
seconds, and shaking was felt as far away as San Francisco and Salem, Oregon (Lajoie & Keefer, 1981).
The epicenter was relatively deep in the Gorda plate (19 km) along a northeast-southwest trending left-
lateral strike slip fault (Kilbourne & Saucedo, 1981; Rollins & Stein, 2010; USGS, 2020g) (Figure 8 and
2 USGS MMI shake maps show low intensity levels for 3 earthquakes >M7.0 in the Gorda plate and Mendocino
fault that, although large, were also distant from shore: (1) 1991 M7.0
<https://earthquake.usgs.gov/earthquakes/eventpage/nc228064/map>; (2) 2005 M7.2
<https://earthquake.usgs.gov/earthquakes/eventpage/usp000dt25/map>; and (3) 1994 M7.2
<https://earthquake.usgs.gov/earthquakes/eventpage/nc30056327/map>.

California North Coast Offshore Wind Studies
Overview of Geological Hazards 38
Figure 18). Previous analyses have described the distance of the epicenter from shore as about 50-60 km
(30-37 mi) west-northwest of Trinidad, California (Lajoie & Keefer, 1981; Rollins & Stein, 2010) (Figure
8). More recent data from the USGS (2020g) shows the epicenter much closer to shore at 8 km (5 miles)
(Figure 18 and Figure 19).
Figure 19. USGS MMI shake map for the 1980 M7.2 earthquake. (Map accessed June 2020 from:
<https://earthquake.usgs.gov/earthquakes/eventpage/usp0001aq1/map>.)
Shaking intensity reached levels VI-VII in the greater Humboldt Bay area (Figure 19). Although
structural damage in the area was not extensive, the effects from shaking caused liquefaction and ground
failure (slumps and slides) in both onshore and offshore environments of the North Coast (Field, 1984,
1993; Field et al., 1981; Lajoie & Keefer, 1981).
Lajoie and Keefer (1981) completed a post-earthquake reconnaissance study in which they looked for
evidence of damage from both the ground and from overhead flights of the area. They reported (p. 4) that
structural damage in the area was minimal with severe damage limited to few homes and buildings that
were poorly constructed and failed easily in Fields Landing or on the North Spit/Samoa Peninsula. In the
areas of strongest shaking, most damage associated with buildings consisted of broken windows,
collapsed chimneys, and damage to objects displaced from shelves. For example, no structural damage

California North Coast Offshore Wind Studies
Overview of Geological Hazards 39
was reported at any of the numerous buildings at the lumber mill sites on the North Spit/Samoa Peninsula
(p. 8). The PG&E power plant (i.e., HBGS) at Buhne Point was briefly shut down as a precautionary
measure, but neither the main power plant nor cold-storage nuclear facility sustained any damage (p. 9).
Failure of a highway overpass on Highway 101 at Tompkins Hill Road, which resulted in two vehicle
crashes and six injuries, was attributed to poor design that allowed the supports for the overpass to be
dislodged from their footings as a result of the shaking (Imbsen, 1981; Lajoie & Keefer, 1981). The
overpass had already been scheduled for a reinforcement upgrade by Caltrans to be completed in 1981, as
it was known to have previously sustained minor damage by an earthquake in 1975 (Lajoie & Keefer,
1981, p. 16).
The shaking triggered numerous small slumps and landslides in the area, and the effects of liquefaction,
primarily in the area of intensity level VII, were evident from cracks in roads and parking lots built over
presumably water-saturated alluvial deposits (Kilbourne & Saucedo, 1981; USGS, 2020g). Kilbourne and
Saucedo (1981, p. 55) noted that, based on comparison of the 1980 earthquake with previous events,
surface ground failures in areas of high intensity shaking are “very repetitive in occurrence” in the
Humboldt region.
Offshore, the 1980 M7.2 earthquake triggered a large submarine landslide in about 60 m of water on the
continental shelf south of the Klamath River (Field, 1984, 1993; Field et al., 1981, 1982; Field &
Jennings, 1987a). The slide was the result of liquefaction and degassing of the seafloor sediment,
displacing an area of about 20 km2 on a nearly flat surface. (See also Section 8).
3.2.2 1992 M7.2 Earthquake
The 1992 “Cape Mendocino earthquakes” consisted of a M7.2 mainshock on April 25 followed by a
series of aftershocks, the largest of which were M6.5 and M6.6 earthquakes on April 26 (Reagor &
Brewer, 1992; Toppozada & Branum, 2004; Velasco et al., 1994). The M7.2 mainshock occurred onshore
at Cape Mendocino at a depth of 9.9 km and about 4 km (2.5 mi) west of the town of Petrolia (Murray et
al., 1996; Oppenheimer et al., 1993; Reagor & Brewer, 1992, USGS, 2020d) (Figure 18). The M6.5 and
M6.6 aftershocks occurred on strike-slip faults in the Gorda plate about 30 km (19 mi) offshore of Cape
Mendocino and at depths of 18.8 km and 21.7 km, respectively, (USGS, 2020d, 2020f) (Figure 18).
Combined impacts from the earthquakes on April 25-26 resulted in more than 350 injures and
approximately $75 million in damage to homes, businesses, roads, and bridges, mainly in the
communities between the Eel River valley and Scotia (O’Brien, 1992; Toppozada & Branum, 2004).
Shaking intensities for the M7.2 event reached level IX in the Cape Mendocino area and VI-VIII in areas
encompassing Humboldt Bay (Figure 20). The aftershocks also produced level VIII intensities in the
vicinity of Cape Mendocino and V-VII in the Humboldt Bay area (Figure 21 and Figure 22). Compared to
communities south of Humboldt Bay, damage in Eureka and Arcata was minimal (O’Brien, 1992;
Toppozada & Branum, 2004).
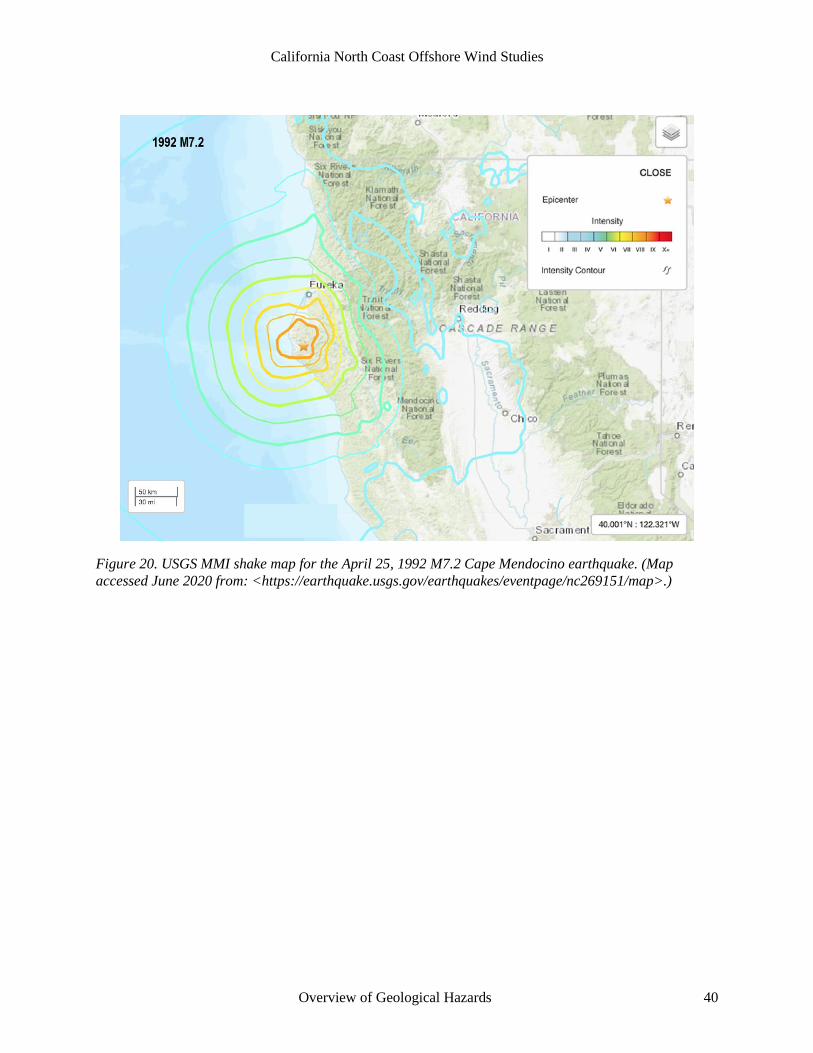
California North Coast Offshore Wind Studies
Overview of Geological Hazards 40
Figure 20. USGS MMI shake map for the April 25, 1992 M7.2 Cape Mendocino earthquake. (Map
accessed June 2020 from: <https://earthquake.usgs.gov/earthquakes/eventpage/nc269151/map>.)

California North Coast Offshore Wind Studies
Overview of Geological Hazards 41
Figure 21. USGS MMI shake map for the April 26, 1992 M6.5 Cape Mendocino earthquake aftershock.
(Map accessed June 2020 from: <https://earthquake.usgs.gov/earthquakes/eventpage/nc268031/map>.)

California North Coast Offshore Wind Studies
Overview of Geological Hazards 42
Figure 22. USGS MMI shake map for the April 26, 1992 M6.6 Cape Mendocino earthquake aftershock.
(Map accessed June 2020 from: <https://earthquake.usgs.gov/earthquakes/eventpage/nc268078/map>.)
Fault offset during the M7.2 earthquake resulted in 1.4 m of permanent uplift along a 15 km long stretch
of the coast from Cape Mendocino to south of Punta Gorda (Green & Sawyer, 1993; Merritts, 1996), and
generated a small, non-destructive tsunami that reached Eureka followed by Crescent City in less than 1
hour (González et al., 1995). Landslides were widespread in the areas of greatest impact (Green &
Sawyer, 1993; Reagor & Brewer, 1992). Liquefaction features, including sand boils 20 m across, were
observed in saturated alluvial deposits in the Eel and Mattole rivers valleys (Green & Sawyer, 1993;
Reagor & Brewer, 1992).
A prevailing theory is that the M7.2 mainshock represented rupture along the Cascadia megathrust (Green
& Sawyer, 1993; Oppenheimer et al., 1993). However, more recent research strongly supports rupture
along a parallel thrust fault above the megathrust in the upper plate/accretionary wedge (Crawford, 2019;
Hartshorn et al., 2017; Vermeer et al., 2015; Vermeer & Hemphill-Haley, 2014; Vermeer, 2016).
Regardless, the mainshock and associated aftershocks are further examples of the geologically frequent
deformation occurring in the tectonically active MTJ region (Merritts, 1996).
3.2.3 2010 M6.5 Earthquake
The M6.5 earthquake on January 9, 2010, was located on a northeast-striking left-lateral strike-slip fault
in the Gorda plate about 48km (30 mi) west-northwest of Eureka and at a depth of 28.7 km (Berkeley
Seismological Laboratory, 2020; Bonowitz et al., 2010; Storesund et al., 2010; USGS, 2020e) (Figure 18,
Figure 23). It was the largest earthquake in the region since two M7.2 events in 1992 and 2005. Although
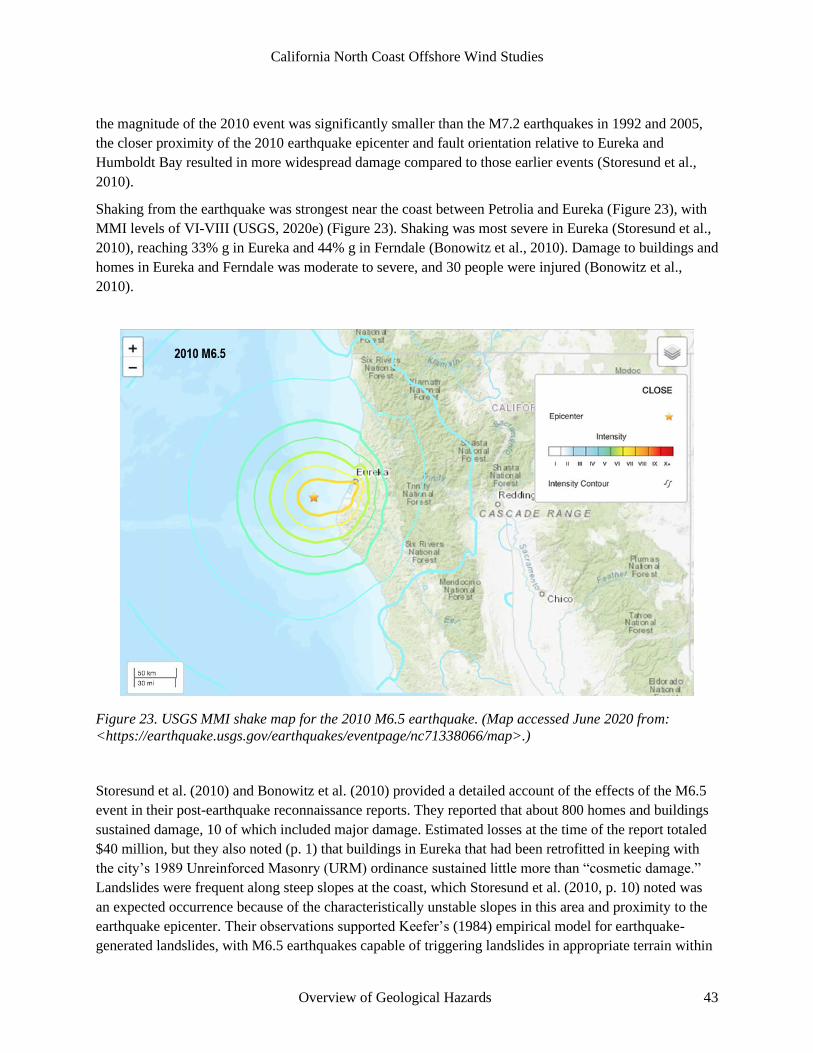
California North Coast Offshore Wind Studies
Overview of Geological Hazards 43
the magnitude of the 2010 event was significantly smaller than the M7.2 earthquakes in 1992 and 2005,
the closer proximity of the 2010 earthquake epicenter and fault orientation relative to Eureka and
Humboldt Bay resulted in more widespread damage compared to those earlier events (Storesund et al.,
2010).
Shaking from the earthquake was strongest near the coast between Petrolia and Eureka (Figure 23), with
MMI levels of VI-VIII (USGS, 2020e) (Figure 23). Shaking was most severe in Eureka (Storesund et al.,
2010), reaching 33% g in Eureka and 44% g in Ferndale (Bonowitz et al., 2010). Damage to buildings and
homes in Eureka and Ferndale was moderate to severe, and 30 people were injured (Bonowitz et al.,
2010).
Figure 23. USGS MMI shake map for the 2010 M6.5 earthquake. (Map accessed June 2020 from:
<https://earthquake.usgs.gov/earthquakes/eventpage/nc71338066/map>.)
Storesund et al. (2010) and Bonowitz et al. (2010) provided a detailed account of the effects of the M6.5
event in their post-earthquake reconnaissance reports. They reported that about 800 homes and buildings
sustained damage, 10 of which included major damage. Estimated losses at the time of the report totaled
$40 million, but they also noted (p. 1) that buildings in Eureka that had been retrofitted in keeping with
the city’s 1989 Unreinforced Masonry (URM) ordinance sustained little more than “cosmetic damage.”
Landslides were frequent along steep slopes at the coast, which Storesund et al. (2010, p. 10) noted was
an expected occurrence because of the characteristically unstable slopes in this area and proximity to the
earthquake epicenter. Their observations supported Keefer’s (1984) empirical model for earthquake-
generated landslides, with M6.5 earthquakes capable of triggering landslides in appropriate terrain within

California North Coast Offshore Wind Studies
Overview of Geological Hazards 44
a 150 km radius of the earthquake epicenter. Liquefaction features (sand boils and lateral spreading) were
present in saturated sediment at Centerville Beach and along the Eel River (Bonowitz et al., 2010;
Storesund et al., 2010, p. 15), and several asphalt parking lots in Eureka showed minor cracks attributed
to liquefaction of underlying alluvial sediment (Storesund et al., 2010, p. 19). Although widely
distributed, no serious damage from liquefaction, lateral spreading, or ground settling was reported in the
greater Humboldt Bay area from this event.
4. SURFACE RUPTURE
Active faults and fault-related structures, including folds, are located within the onshore and offshore
Cascadia subduction margin (see Section 3.2 for discussion of seismic sources). Field et al. (1980), Clarke
(1990), and Clarke and Carver (1992a) identified these structures in the offshore sediments of the Eel
River basin (Figure 24). More recently, high-resolution multichannel seismic reflection surveys and
detailed bathymetry have provided even better imaging of offshore structures (Hill et al., 2020). Further
understanding of deformation of the Gorda plate, which is a major contributing source to current regional
seismicity, came from seismic reflection surveys beyond the subduction margin (Gulick et al., 1998,
2001) and analysis of seismicity within the plate (Chaytor et al., 2004; Furlong & Schwartz, 2004; Rollins
& Stein, 2010; Smith et al., 1993; Stoddard, 1991; Wilson, 1989, 1993). The on-land faults and associated
folds within the terrestrial Eel River basin were originally mapped by Ogle (1953). Later paleoseismic
studies by Woodward-Clyde Consultants (1980) followed by local academic studies and other
consultants’ investigations have provided a greater understanding of the extent of the faults and the
recognition that they are Quaternary—and in many cases Holocene—active structures (Burke & Carver,
1992; Carver, 1992; Carver & Burke, 1988; Clarke & Carver, 1992; Hemphill-Haley & Witter, 2006;
Kelsey & Carver, 1988; Nelson et al., 1995; Vadurro, 2006; Valentine et al., 2012; Witter et al., 2002).
Summaries of seismic sources include Woodward-Clyde Consultants (1980), McCrory (2000) and Swan
et al. (2002).
Faults and associated structures that may be significant for the NCOW facilities include the Cascadia
subduction megathrust, which is located to the west of the Humboldt Call Area, and the Table Bluff
anticline (TBA) and Little Salmon fault zone (LSFZ) which cross the boundaries of the call area (Figure
25 and Figure 26). The deformation belt associated with the Cascadia subduction zone, which includes
the TBA and LFSZ, may be as much as 65 to 100 km wide (Swan, Carver, & Page, 2002). Gulick et al.
(1998) report that the outer 15 to 20 km of the accretionary margin contains thrusts that are seaward and
landward vergent.

California North Coast Offshore Wind Studies
Overview of Geological Hazards 45
Figure 24. Map showing locations of faults and folds off Humboldt Bay identified from multi- and single-
channel deep- to intermediate-depth seismic-reflection profiles and side-scan sonar mosaics (modified
from Clarke, 1990). These fault interpretations include those offsets interpreted in the pre-Tertiary
Franciscan basement and do not necessarily reflect offset in the younger, overlying Quaternary
sediments.

California North Coast Offshore Wind Studies
Overview of Geological Hazards 46
Figure 25. Map showing the bathymetry and topography of the southernmost Cascadia subduction zone
in and near the Humboldt Call Area (in center of map with pale-yellow shading and black outline).
Quaternary active faults in the onshore and offshore area primarily from USGS Quaternary fault and fold
database (USGS, 2020k) and McCrory (2000). Onshore faults extend offshore in the accretionary prism.
Yellow solid line is approximate location of seismic profile from Burger et al. (2002) shown in Figure 27.
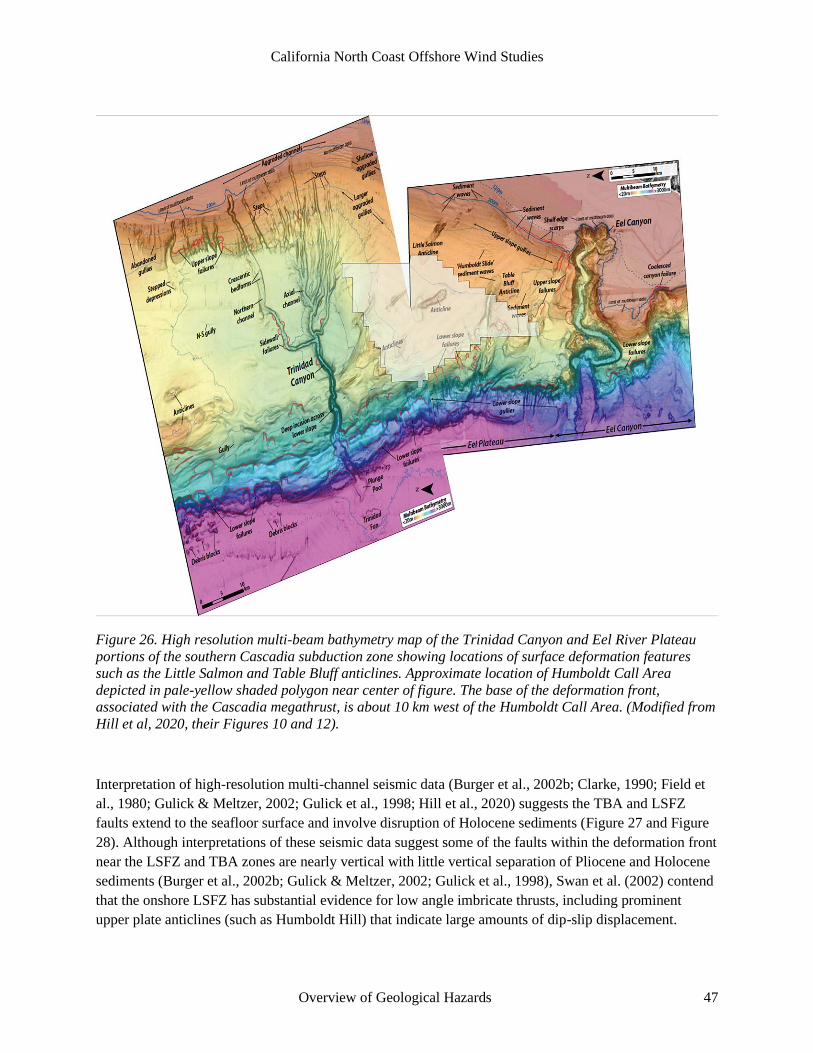
California North Coast Offshore Wind Studies
Overview of Geological Hazards 47
Figure 26. High resolution multi-beam bathymetry map of the Trinidad Canyon and Eel River Plateau
portions of the southern Cascadia subduction zone showing locations of surface deformation features
such as the Little Salmon and Table Bluff anticlines. Approximate location of Humboldt Call Area
depicted in pale-yellow shaded polygon near center of figure. The base of the deformation front,
associated with the Cascadia megathrust, is about 10 km west of the Humboldt Call Area. (Modified from
Hill et al, 2020, their Figures 10 and 12).
Interpretation of high-resolution multi-channel seismic data (Burger et al., 2002b; Clarke, 1990; Field et
al., 1980; Gulick & Meltzer, 2002; Gulick et al., 1998; Hill et al., 2020) suggests the TBA and LSFZ
faults extend to the seafloor surface and involve disruption of Holocene sediments (Figure 27 and Figure
28). Although interpretations of these seismic data suggest some of the faults within the deformation front
near the LSFZ and TBA zones are nearly vertical with little vertical separation of Pliocene and Holocene
sediments (Burger et al., 2002b; Gulick & Meltzer, 2002; Gulick et al., 1998), Swan et al. (2002) contend
that the onshore LSFZ has substantial evidence for low angle imbricate thrusts, including prominent
upper plate anticlines (such as Humboldt Hill) that indicate large amounts of dip-slip displacement.

California North Coast Offshore Wind Studies
Overview of Geological Hazards 48
Figure 27. Uninterpreted and interpreted seismic profile from transect approximately parallel to
coastline (see Figure 25 for location). Near vertical lines are interpreted faults. Of note are faults within
the Little Salmon fault zone (LSFZ) and Table Bluff anticline (TBA). Note that some fault structures
extend through the youngest sediments to the seafloor. Also, faults here are depicted as near vertical
while the onshore projections of these structures are mapped as low angle thrust faults. (From Burger et
al., 2002, their Figure 3.)

California North Coast Offshore Wind Studies
Overview of Geological Hazards 49
Figure 28. Multi-channel seismic profile showing the deformation front of the Cascadia subduction zone
in the vicinity of the Humboldt call area and the position of the Little Salmon fault zone and Table Bluff
anticline. (From Hill et al., 2020, their Figure 6d.)
Surface rupture along any of these structures could pose hazards to offshore anchorage of offshore wind
structures, transmission lines, and onshore facilities. Surface displacement along the Cascadia megathrust
might be substantial, as interpreted for the most recent full-rupture event in 1700 C.E. (Satake et al.,
2003), but importantly may also incorporate the upper plate deformation structures such as the TBA and
LSFZ during a CSZ megathrust rupture (e.g., Witter et al., 2001). Analysis of upper plate deformation
structures associated with thrust faults defines a wide range of surface displacement and fold features
(Figure 29) that might accommodate movement along the principle fault (in this case, likely the
megathrust).
Most of the paleoseismic information on the LSFZ (and much less information for the TBA) has been
collected from terrestrial sites. Analysis of the LSFZ near the Humboldt Bay Generating Station (HBGS)
site (labeled “ISFSI Site” on Figure 14) shows multiple fault splays. As stated in Page and Swan (2002, p.
8-2) “The style of faulting and related surface deformation, width of the deformed area, amount of
surface displacement, and relative contributions of fault displacement and folding to the total slip on a
fault commonly change within short distances along strike.” Surface rupture may simply be along a
single low angle fault plane or may involve a complex array of imbricate, stacked faults, back-thrusts and
normal faults as well as folds. End member complexity may include hundreds or thousands of closely
spaced conjugate faults that occur in a broad deformation zone (Page & Swan, 2002). Further, as noted by
Page and Swan (2002), thrust faults are often “blind” and do not reach the ground surface, although the
upper plate deformation includes faults and folds.
Investigation of the Little Salmon fault at College of the Redwoods by Witter et al. (2001) revealed a
complex, broad zone of faults and folds in the upper plate (Figure 30). This style of faulting is likely
similar to that of the offshore extensions of the Little Salmon fault, and, may exemplify the style of
deformation associated with motion along the megathrust, however, at a larger scale.
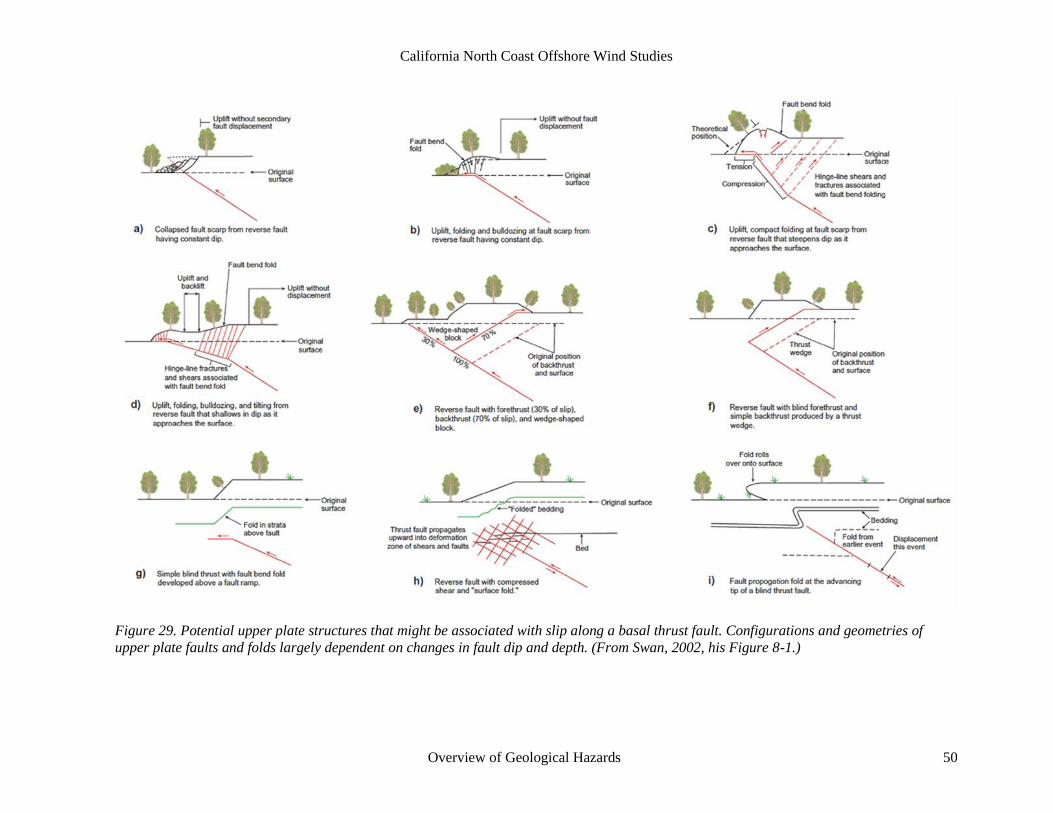
California North Coast Offshore Wind Studies
Overview of Geological Hazards 50
Figure 29. Potential upper plate structures that might be associated with slip along a basal thrust fault. Configurations and geometries of
upper plate faults and folds largely dependent on changes in fault dip and depth. (From Swan, 2002, his Figure 8-1.)

California North Coast Offshore Wind Studies
Overview of Geological Hazards 51
Figure 30. Diagrams of onshore surface faulting within the hanging wall of splays of the Little Salmon
fault zone at the Humboldt Bay power plant and College of the Redwoods. (From Swan, 2002, his Figure
8-3.)
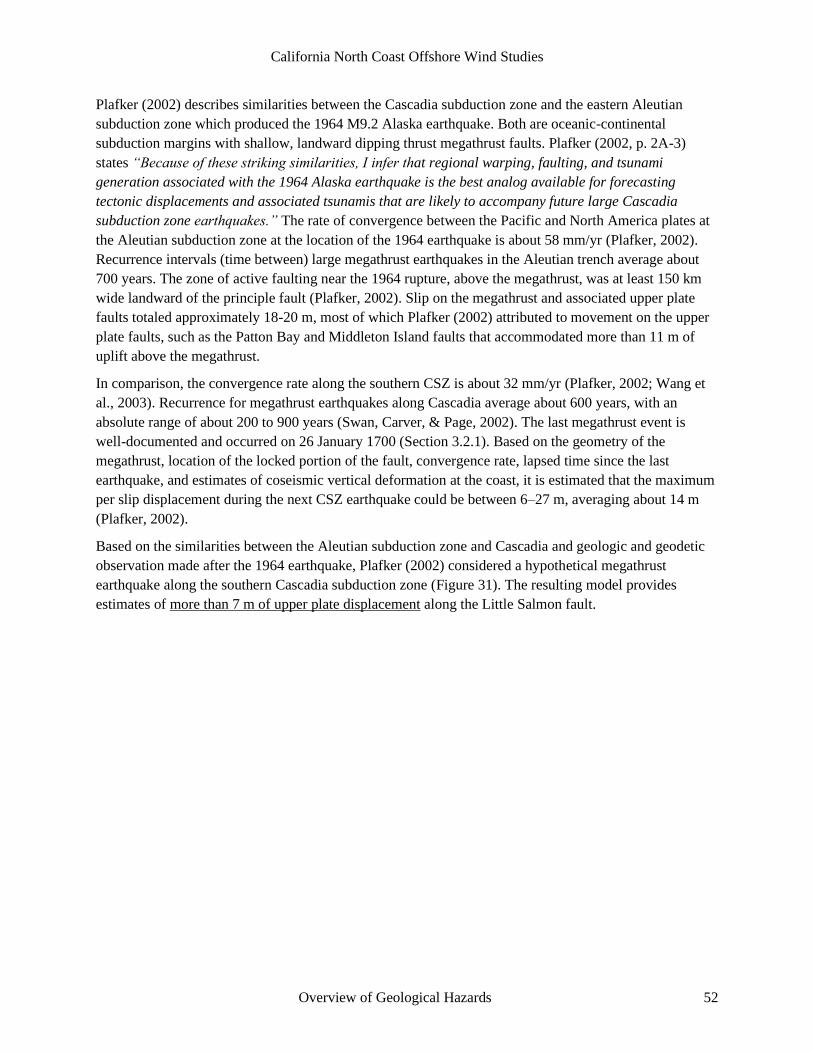
California North Coast Offshore Wind Studies
Overview of Geological Hazards 52
Plafker (2002) describes similarities between the Cascadia subduction zone and the eastern Aleutian
subduction zone which produced the 1964 M9.2 Alaska earthquake. Both are oceanic-continental
subduction margins with shallow, landward dipping thrust megathrust faults. Plafker (2002, p. 2A-3)
states “Because of these striking similarities, I infer that regional warping, faulting, and tsunami
generation associated with the 1964 Alaska earthquake is the best analog available for forecasting
tectonic displacements and associated tsunamis that are likely to accompany future large Cascadia
subduction zone earthquakes.” The rate of convergence between the Pacific and North America plates at
the Aleutian subduction zone at the location of the 1964 earthquake is about 58 mm/yr (Plafker, 2002).
Recurrence intervals (time between) large megathrust earthquakes in the Aleutian trench average about
700 years. The zone of active faulting near the 1964 rupture, above the megathrust, was at least 150 km
wide landward of the principle fault (Plafker, 2002). Slip on the megathrust and associated upper plate
faults totaled approximately 18-20 m, most of which Plafker (2002) attributed to movement on the upper
plate faults, such as the Patton Bay and Middleton Island faults that accommodated more than 11 m of
uplift above the megathrust.
In comparison, the convergence rate along the southern CSZ is about 32 mm/yr (Plafker, 2002; Wang et
al., 2003). Recurrence for megathrust earthquakes along Cascadia average about 600 years, with an
absolute range of about 200 to 900 years (Swan, Carver, & Page, 2002). The last megathrust event is
well-documented and occurred on 26 January 1700 (Section 3.2.1). Based on the geometry of the
megathrust, location of the locked portion of the fault, convergence rate, lapsed time since the last
earthquake, and estimates of coseismic vertical deformation at the coast, it is estimated that the maximum
per slip displacement during the next CSZ earthquake could be between 6–27 m, averaging about 14 m
(Plafker, 2002).
Based on the similarities between the Aleutian subduction zone and Cascadia and geologic and geodetic
observation made after the 1964 earthquake, Plafker (2002) considered a hypothetical megathrust
earthquake along the southern Cascadia subduction zone (Figure 31). The resulting model provides
estimates of more than 7 m of upper plate displacement along the Little Salmon fault.

California North Coast Offshore Wind Studies
Overview of Geological Hazards 53
Figure 31. Comparative profiles of structures and coseismic displacement between the Aleutian trench
during the 1964 M9.2 earthquake and a hypothetical megathrust earthquake along the southern Cascadia
subduction zone (from Plafker, 2002, reproduced in Swan, 2002). During the Alaska event, vertical
displacement upwards of 3 and 11 m occurred along the upper plate Middleton Island and Patton Bay
faults, respectively. Similar convergence rates, megathrust geometries, and upper plate structures suggest
that the Little Salmon fault at Humboldt Bay may experience between 6 to almost 8 m of vertical slip
during a CSZ megathrust earthquake.
5. GAS HYDRATES AND SHALLOW-SEAFLOOR FREE GAS
The existence of gas hydrates in continental margin settings has been the focus of numerous
investigations globally, and specifically in the Cascadia subduction margin (Bohrmann et al., 1998;
Brooks et al., 1991; Chapman et al., 2004; Field et al., 1980; Field & Barber, 1993; Field & Jennings,
1987b; Field & Kvenvolden, 1985; Hautala et al., 2014; Kastner, 2001; Kvenvolden, 1993; Kvenvolden
& McMenamin, 1980; Keith A. Kvenvolden, 1993; Li et al., 2016; Skarke et al., 2014; Suess et al., 1999;
Waite et al., 2009; Yelisetti et al., 2014; Yun et al., 1999). The term gas hydrates refers to relatively
shallow accumulations of gas in two forms: thermogenic and biogenic. Biogenic gas (methane) forms
from the biological decay of organic matter near the sea floor; thermogenic gas results from high
temperature conversion of organic matter into complex hydrocarbons, commonly associated with
petroleum products (Field & Barber, 1993; Kvenvolden, 1993). Gas hydrates occur as ice-like crystalline
compounds consisting of methane and water in what are referred to as clathrate structures, with the
gaseous hydrocarbon molecules trapped in a crystalline water lattice (Brooks et al., 1991; Chapman et al.,

California North Coast Offshore Wind Studies
Overview of Geological Hazards 54
2004; Field et al., 1980; Field & Barber, 1993; Field & Kvenvolden, 1985; Kvenvolden, 1998;
Kvenvolden & McMenamin, 1980; Kvenvolden, 1993; Li et al., 2016; Waite et al., 2009; Yun et al.,
1999).
5.1 Gas Hydrate Occurrence
Gas hydrates are typically found in water depths greater than 500 m, and most commonly between 800 m
to 1,200 m. They have also been identified in depths exceeding 6,000 m (Booth et al., 1996). They are
found globally (Figure 32), primarily in continental shelf environments (Kvenvolden, 1993) where
necessary pressure and temperature (0°C) conditions exist to maintain the gas in solid form (Field et al.,
1980; Field & Kvenvolden, 1985) and where there is plentiful methane. They are typically found at
depths of 150 to 200 m below the seafloor (Booth et al., 1996; Field et al., 1980; Field & Kvenvolden,
1985; A. Li et al., 2016).
Figure 32. Global gas hydrate locations. Yellow circles denote locations where hydrate has been
recovered. Red circles correspond to hydrate locations inferred from seismic data and black circles
indicate locations where hydrate drilling projects have been completed. (From USGS, 2020,
<https://www.usgs.gov/media/images/map-gas-hydrates>.)
Thicknesses of gas hydrates are limited by the geothermal gradient, which increases as depth within the
sedimentary column increases. Below this depth the crystalline hydrates become unstable and decompose
to gas phase (Field & Kvenvolden, 1985). Free gas, commonly pressurized, often exists below the base of
the hydrates (Figure 33). In situ gas hydrates appear as glassy, white nodules; dispersed crystals; and
layered bands up to 30 m thick (Booth et al., 1996; Brooks et al., 1991). Along the sea floor, in areas of
relatively low concentrations of gas hydrate but in the presence of free gas, pock marks and craters have
been identified by side scan sonar and deep sea photographs (Figure 33) (Goff et al., 1996; Yun et al.,
1999). These pock marks likely result from free gas escaping through the hydrate and deforming the
California North Coast Offshore Wind Studies
Overview of Geological Hazards 55
seafloor. Additionally, dome-like (diapiric) structures occur within the gas hydrate accumulations that
bow upward and pierce the youngest sediments, a type of structure that has been identified offshore of
Eureka (Field et al., 1980), as further discussed below.
Figure 33. Schematic diagram showing typical submarine settings for gas hydrates and associated
features such as diapirs and seeps. White dotes indicate locations of gas pock marks. The BSR is
indicated by the black dashed line. (From Skarke et al., 2014, their Figure 3).
Gas hydrates are identified in seismic reflection data as a bottom-simulating reflector (BSR) which occurs
at the base of the frozen substrate (Figure 34). The BSR represents the change in seismic velocity between
the free gas sediment to the solid gas hydrate zone above (Brooks et al., 1991; Chapman et al., 2004;
Field & Kvenvolden, 1985; Kvenvolden, 1993). Typically, the BSR mimics the bathymetric surface; it
deepens relative to the seafloor with increased water depth and cuts across bedding (Brooks et al., 1991).
Gas hydrates also appear on seismic reflection profiles as vertical zones of distortion referred to as
“acoustic wipeouts” showing gas migration through fractures and faults (Burger et al., 2002b).
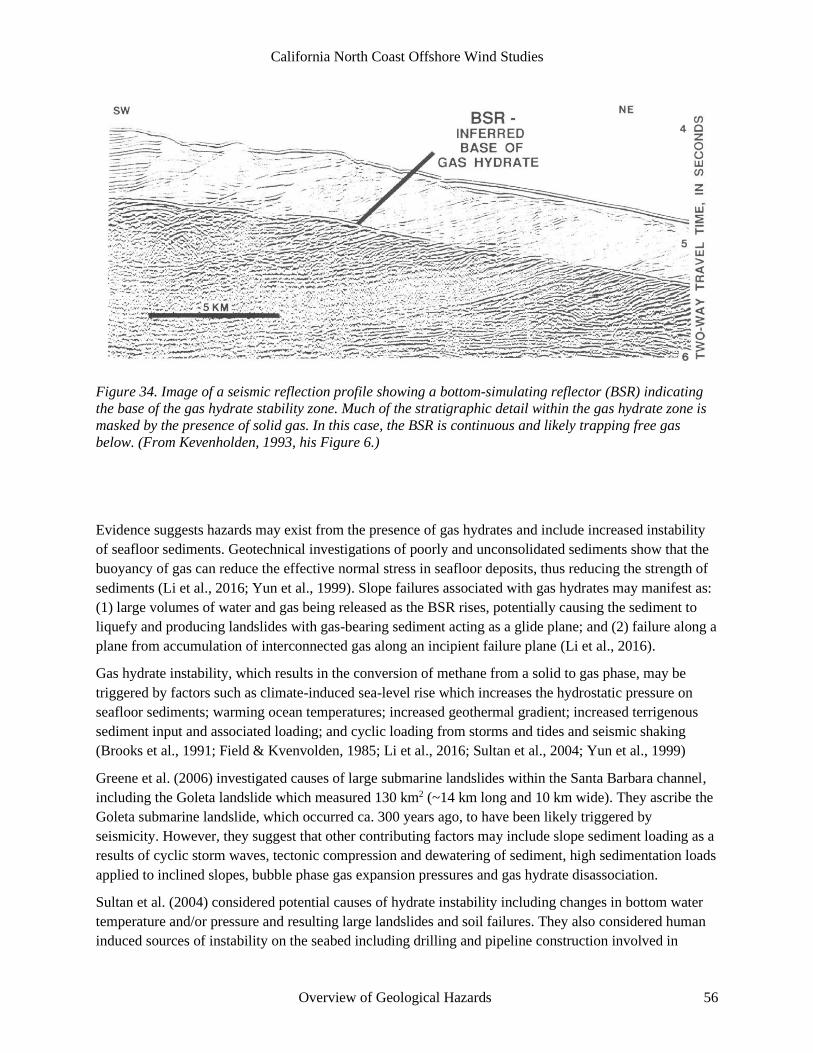
California North Coast Offshore Wind Studies
Overview of Geological Hazards 56
Figure 34. Image of a seismic reflection profile showing a bottom-simulating reflector (BSR) indicating
the base of the gas hydrate stability zone. Much of the stratigraphic detail within the gas hydrate zone is
masked by the presence of solid gas. In this case, the BSR is continuous and likely trapping free gas
below. (From Kevenholden, 1993, his Figure 6.)
Evidence suggests hazards may exist from the presence of gas hydrates and include increased instability
of seafloor sediments. Geotechnical investigations of poorly and unconsolidated sediments show that the
buoyancy of gas can reduce the effective normal stress in seafloor deposits, thus reducing the strength of
sediments (Li et al., 2016; Yun et al., 1999). Slope failures associated with gas hydrates may manifest as:
(1) large volumes of water and gas being released as the BSR rises, potentially causing the sediment to
liquefy and producing landslides with gas-bearing sediment acting as a glide plane; and (2) failure along a
plane from accumulation of interconnected gas along an incipient failure plane (Li et al., 2016).
Gas hydrate instability, which results in the conversion of methane from a solid to gas phase, may be
triggered by factors such as climate-induced sea-level rise which increases the hydrostatic pressure on
seafloor sediments; warming ocean temperatures; increased geothermal gradient; increased terrigenous
sediment input and associated loading; and cyclic loading from storms and tides and seismic shaking
(Brooks et al., 1991; Field & Kvenvolden, 1985; Li et al., 2016; Sultan et al., 2004; Yun et al., 1999)
Greene et al. (2006) investigated causes of large submarine landslides within the Santa Barbara channel,
including the Goleta landslide which measured 130 km2 (~14 km long and 10 km wide). They ascribe the
Goleta submarine landslide, which occurred ca. 300 years ago, to have been likely triggered by
seismicity. However, they suggest that other contributing factors may include slope sediment loading as a
results of cyclic storm waves, tectonic compression and dewatering of sediment, high sedimentation loads
applied to inclined slopes, bubble phase gas expansion pressures and gas hydrate disassociation.
Sultan et al. (2004) considered potential causes of hydrate instability including changes in bottom water
temperature and/or pressure and resulting large landslides and soil failures. They also considered human
induced sources of instability on the seabed including drilling and pipeline construction involved in
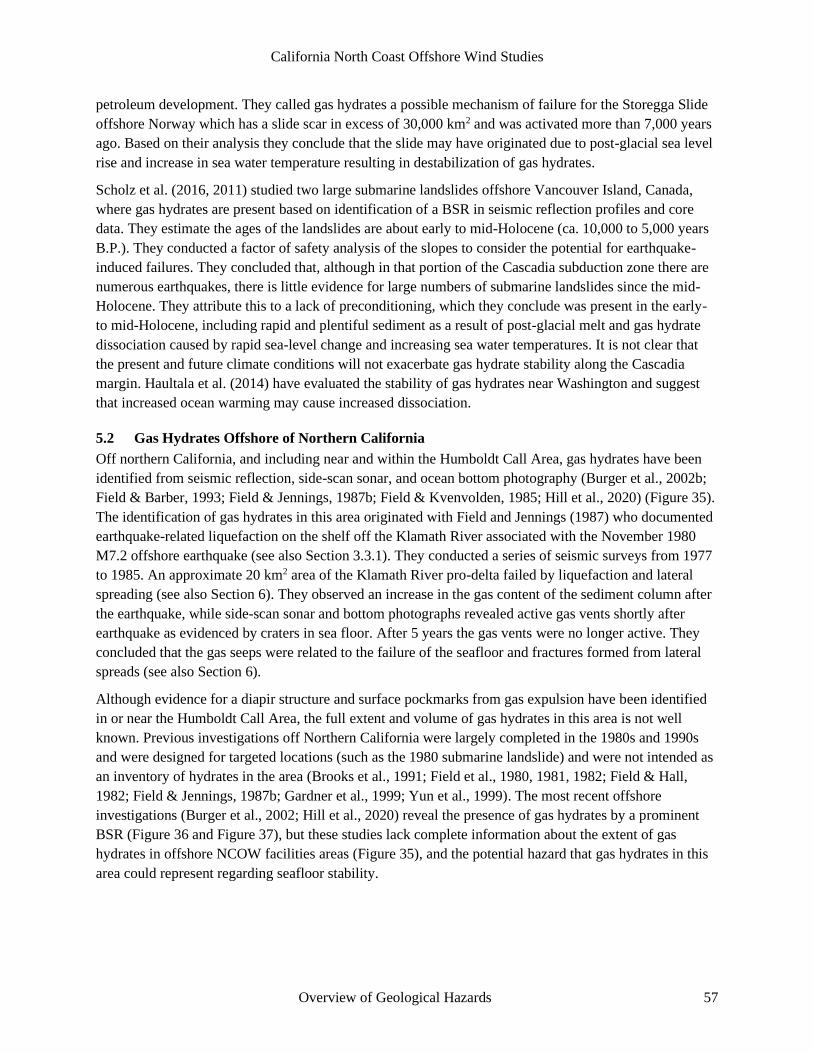
California North Coast Offshore Wind Studies
Overview of Geological Hazards 57
petroleum development. They called gas hydrates a possible mechanism of failure for the Storegga Slide
offshore Norway which has a slide scar in excess of 30,000 km2 and was activated more than 7,000 years
ago. Based on their analysis they conclude that the slide may have originated due to post-glacial sea level
rise and increase in sea water temperature resulting in destabilization of gas hydrates.
Scholz et al. (2016, 2011) studied two large submarine landslides offshore Vancouver Island, Canada,
where gas hydrates are present based on identification of a BSR in seismic reflection profiles and core
data. They estimate the ages of the landslides are about early to mid-Holocene (ca. 10,000 to 5,000 years
B.P.). They conducted a factor of safety analysis of the slopes to consider the potential for earthquake-
induced failures. They concluded that, although in that portion of the Cascadia subduction zone there are
numerous earthquakes, there is little evidence for large numbers of submarine landslides since the mid-
Holocene. They attribute this to a lack of preconditioning, which they conclude was present in the early-
to mid-Holocene, including rapid and plentiful sediment as a result of post-glacial melt and gas hydrate
dissociation caused by rapid sea-level change and increasing sea water temperatures. It is not clear that
the present and future climate conditions will not exacerbate gas hydrate stability along the Cascadia
margin. Haultala et al. (2014) have evaluated the stability of gas hydrates near Washington and suggest
that increased ocean warming may cause increased dissociation.
5.2 Gas Hydrates Offshore of Northern California
Off northern California, and including near and within the Humboldt Call Area, gas hydrates have been
identified from seismic reflection, side-scan sonar, and ocean bottom photography (Burger et al., 2002b;
Field & Barber, 1993; Field & Jennings, 1987b; Field & Kvenvolden, 1985; Hill et al., 2020) (Figure 35).
The identification of gas hydrates in this area originated with Field and Jennings (1987) who documented
earthquake-related liquefaction on the shelf off the Klamath River associated with the November 1980
M7.2 offshore earthquake (see also Section 3.3.1). They conducted a series of seismic surveys from 1977
to 1985. An approximate 20 km2 area of the Klamath River pro-delta failed by liquefaction and lateral
spreading (see also Section 6). They observed an increase in the gas content of the sediment column after
the earthquake, while side-scan sonar and bottom photographs revealed active gas vents shortly after
earthquake as evidenced by craters in sea floor. After 5 years the gas vents were no longer active. They
concluded that the gas seeps were related to the failure of the seafloor and fractures formed from lateral
spreads (see also Section 6).
Although evidence for a diapir structure and surface pockmarks from gas expulsion have been identified
in or near the Humboldt Call Area, the full extent and volume of gas hydrates in this area is not well
known. Previous investigations off Northern California were largely completed in the 1980s and 1990s
and were designed for targeted locations (such as the 1980 submarine landslide) and were not intended as
an inventory of hydrates in the area (Brooks et al., 1991; Field et al., 1980, 1981, 1982; Field & Hall,
1982; Field & Jennings, 1987b; Gardner et al., 1999; Yun et al., 1999). The most recent offshore
investigations (Burger et al., 2002; Hill et al., 2020) reveal the presence of gas hydrates by a prominent
BSR (Figure 36 and Figure 37), but these studies lack complete information about the extent of gas
hydrates in offshore NCOW facilities areas (Figure 35), and the potential hazard that gas hydrates in this
area could represent regarding seafloor stability.

California North Coast Offshore Wind Studies
Overview of Geological Hazards 58
Figure 35. Map showing location of gas hydrates (yellow polygon) in the vicinity of the Humboldt call
area based on available data from seismic reflection surveys. The possible extent of gas hydrates beyond
the areas shown by the polygons is unknown. Red polygon: areas of surface pockmark identified from
side-scan sonar and ocean bottom photography (Yun et al., 1999). Green polygon: location of mud diapir
interpreted from seismic reflection data (Yun et al., 1999).

California North Coast Offshore Wind Studies
Overview of Geological Hazards 59
Figure 36. Map showing the geophysical survey trackline coverage of the southern Cascadia margin and
accretionary prism (from Hill et al., 2020, their Figure 1b). The multichannel seismic profiles for the
yellow lines labeled “6c” and “6d” are shown in Figure 37.
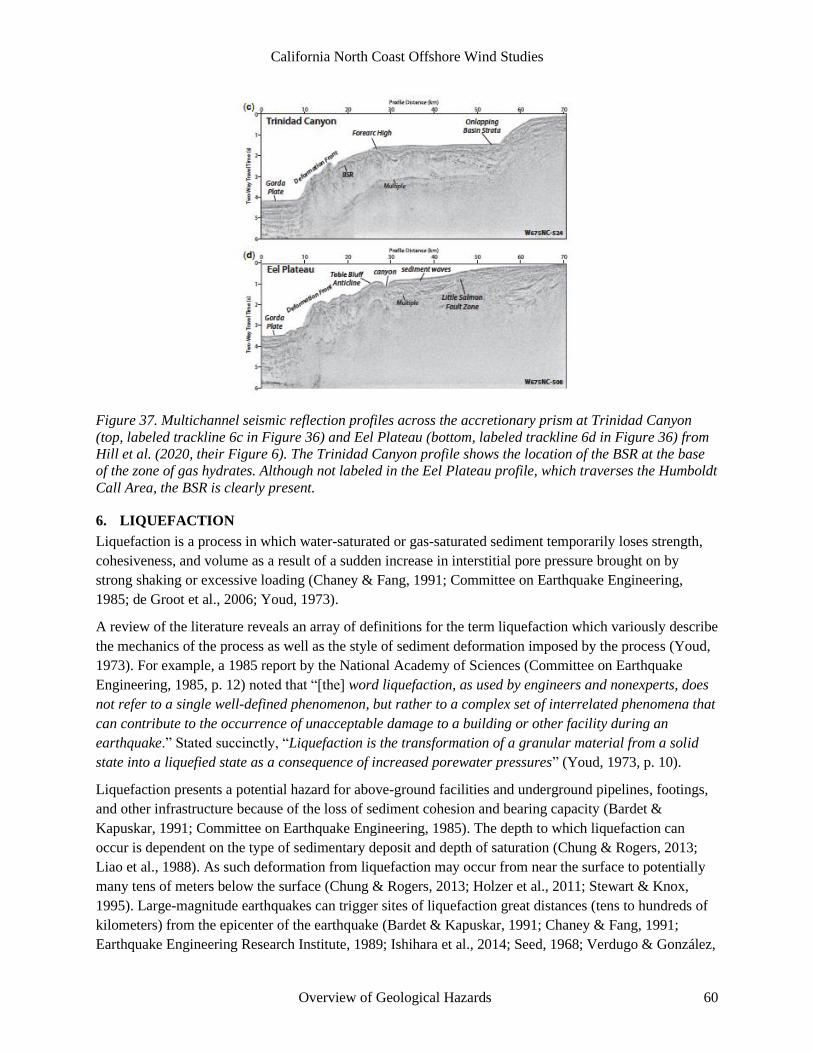
California North Coast Offshore Wind Studies
Overview of Geological Hazards 60
Figure 37. Multichannel seismic reflection profiles across the accretionary prism at Trinidad Canyon
(top, labeled trackline 6c in Figure 36) and Eel Plateau (bottom, labeled trackline 6d in Figure 36) from
Hill et al. (2020, their Figure 6). The Trinidad Canyon profile shows the location of the BSR at the base
of the zone of gas hydrates. Although not labeled in the Eel Plateau profile, which traverses the Humboldt
Call Area, the BSR is clearly present.
6. LIQUEFACTION
Liquefaction is a process in which water-saturated or gas-saturated sediment temporarily loses strength,
cohesiveness, and volume as a result of a sudden increase in interstitial pore pressure brought on by
strong shaking or excessive loading (Chaney & Fang, 1991; Committee on Earthquake Engineering,
1985; de Groot et al., 2006; Youd, 1973).
A review of the literature reveals an array of definitions for the term liquefaction which variously describe
the mechanics of the process as well as the style of sediment deformation imposed by the process (Youd,
1973). For example, a 1985 report by the National Academy of Sciences (Committee on Earthquake
Engineering, 1985, p. 12) noted that “[the] word liquefaction, as used by engineers and nonexperts, does
not refer to a single well-defined phenomenon, but rather to a complex set of interrelated phenomena that
can contribute to the occurrence of unacceptable damage to a building or other facility during an
earthquake.” Stated succinctly, “Liquefaction is the transformation of a granular material from a solid
state into a liquefied state as a consequence of increased porewater pressures” (Youd, 1973, p. 10).
Liquefaction presents a potential hazard for above-ground facilities and underground pipelines, footings,
and other infrastructure because of the loss of sediment cohesion and bearing capacity (Bardet &
Kapuskar, 1991; Committee on Earthquake Engineering, 1985). The depth to which liquefaction can
occur is dependent on the type of sedimentary deposit and depth of saturation (Chung & Rogers, 2013;
Liao et al., 1988). As such deformation from liquefaction may occur from near the surface to potentially
many tens of meters below the surface (Chung & Rogers, 2013; Holzer et al., 2011; Stewart & Knox,
1995). Large-magnitude earthquakes can trigger sites of liquefaction great distances (tens to hundreds of
kilometers) from the epicenter of the earthquake (Bardet & Kapuskar, 1991; Chaney & Fang, 1991;
Earthquake Engineering Research Institute, 1989; Ishihara et al., 2014; Seed, 1968; Verdugo & González,

California North Coast Offshore Wind Studies
Overview of Geological Hazards 61
2015; Yasuda et al., 2012), and depending on the setting, liquefaction from a single earthquake can extend
over a wide geographic area (Committee on Earthquake Engineering, 1985; Davis et al., 2015; Potter et
al., 2015). As the primary requirement for liquefaction is a geologically recent (non-indurated) saturated
deposit, liquefaction occurs both in terrestrial settings (Ambraseys & Sarma, 1969; Audemard & de
Santis, 1991; Chaney & Fang, 1991; Committee on Earthquake Engineering, 1985; Cubrinovski et al.,
2011; Dengler, 2008; Duke & Leeds, 1963; Earthquake Engineering Research Institute, 1989; Seed,
1968) and the marine environment (Ambraseys & Sarma, 1969; Chaney, 1991; Chaney & Almagor, 2015;
Chaney & Fang, 1986; Dalrymple, 1979; de Groot et al., 2006; Field, 1993; Puig et al., 2004; Mutlu et al.,
2007; Teh et al., 2004, 2006).
From the Committee on Earthquake Engineering (1985, p. 2), impacts from liquefaction may include:
• slope failure
• settling and tipping of buildings and bridge piers
• collapse of retaining walls
• lateral spreading of slightly inclined ground
• large deformations of the ground surface
• settlement and flooding of large areas
Additionally, sediment deformation from liquefaction often results in damaged or ruptured underground
pipes and cables (Dengler, 2008; Earthquake Engineering Research Institute, 1989; Youd & Hoose, 1978)
and can cause marine pipes and cables laid on the seabed to sink beneath the surface (de Groot et al.,
2006; Teh et al., 2006).
6.1 Overview of Liquefaction Processes and Related Ground Failure
Liquefaction occurs because an anomalous force, such as shaking from an earthquake, suddenly disrupts
the particle-to-particle structure of a saturated sedimentary deposit. When water-saturated deposits are in
a stable state, the water present between the sediment particles exerts a steady pressure on the particles
which keeps the deposit intact. However, when impacted by strong shaking from an earthquake or
excessive loading from waves, the interstitial pressure suddenly rises, forcing out the interstitial water,
which allows the sediment particles to collapse into one another and the mass to flow. In some cases the
pore water is forced out as a sediment slurry that is channelized along fissures or cracks towards the
surface (Audemard & de Santis, 1991; Committee on Earthquake Engineering, 1985). The displacement
of the interstitial water causes large volumes of material to be dislodged towards the ground surface,
while at the same time releasing the static pressure holding the sediment grains in in place. The result is
that the sediment changes nearly instantaneously from a solid state to a freely moving non-cohesive flow
until the point at which equilibrium is restored (Berkeley Seismological Lab, 2008; Committee on
Earthquake Engineering, 1985). As described by Field et al. (1982, p. 545) “Once liquefaction has
occurred, the sediment is free to flow, owing to the complete loss of shear strength.” The change in
volume that occurs when the liquefied material at depth is ejected to the surface manifests as ground
settlement (Bertalot et al., 2013; Committee on Earthquake Engineering, 1985; Earthquake Engineering
Research Institute, 1989; Potter et al., 2015; Seed & Wilson, 1967), and the loss of cohesion between
sediment particles leads to slumping, sliding, or lateral spreading (Bardet & Kapuskar, 1991; Chaney,

California North Coast Offshore Wind Studies
Overview of Geological Hazards 62
1991; Chaney & Fang, 1991; Committee on Earthquake Engineering, 1985; Dengler, 2008; Huang & Yu,
2013; Idriss & Boulanger, 2008; Seed & Wilson, 1967).
The three basic types of ground failures associated with liquefaction, from Youd (1973, p.6), are flow
landslides, lateral-spreading landslides, and quick-condition failures. Flow landslides are those that are
relatively unrestrained and therefore may displace over large areas. Lateral-spreading landslides are
typically found on flatter surfaces and result in limited displacement. Quick condition failures refer to the
loss of ground stability and weight-bearing capacity as a result of upward-percolating pore water. Youd
(1973, p. 6) notes that in addition to these, “the ejection of water and sediments in the form of sand boils
has been a source of damage associated with liquefaction during earthquakes (Ambraseys and Sarma,
1969).”
Deposits most likely to liquefy are geologically recent, saturated sediment, primarily sand but also some
silts and gravels, lacking the presence of fines (clay, organic material) to add cohesiveness and reduce
porosity (Committee on Earthquake Engineering, 1985). Lade and Yamamuro (2011, p. 247) noted that
based on laboratory experiments as well as empirical case histories “it is silty sands that liquefy under
static and a majority of earthquake-induced conditions.” Coastal sediment, including along the lower
reaches of estuaries and on the continental shelf, is susceptible to liquefaction because of large areas of
consistent grain size and saturated, non-indurated structures. For example, Chaney (1991) noted the
correlation between grain size and the liquefaction-driven landslide off the Klamath River in 1980.
The most prevalent cause of liquefaction is strong shaking from earthquakes (Seed & Idriss, 1982;
Committee on Earthquake Engineering, 1985; Idriss & Boulanger, 2008) but in the coastal environment
liquefaction can also by triggered by excessive loading from large or sustained storm waves (Chaney &
Fang, 1991; Dalrymple, 1979; Lee et al., 1993; Sassa & Sekiguchi, 1999), as well as tsunamis (Kastens &
Cita, 1981; Young et al., 2009). Further, since the primary requirement for liquefaction is geologically
recent, primarily sandy deposits, data show that deposits that liquefy during one earthquake may liquefy
again in subsequent earthquakes (Committee on Earthquake Engineering, 1985; Towhata et al., 2014).
It was the shocking, large-scale damage from liquefaction associated with two different earthquakes in
1964—the M7.5 earthquake in Niigata, Japan, and the M9.2 Great Alaskan Earthquake—that served as
catalysts for international cooperation in accelerated liquefaction studies in the laboratory (e.g., Chaney &
Demars, 1985; Elgamal et al., 1989; Fiegel & Kutter, 1994; Holzer et al., 2011; Ishihara, 1993; Scott &
Zuckerman, 1973; Seed & Lee, 1966; Sumer et al., 2007; Zhang et al., 2004, 2004; Zhu et al., 2017) as
well as in the field (e.g., Seed and Idriss, 1967, 1971; Scott and Zuckerman, 1973; Dalrymple, 1979;
Chaney and Demars, 1985; Lindenberg et al., 1989; Bardet and Kapuskar, 1991; Wotherspoon et al.,
2015; Zhu et al., 2017). Since 1964, numerous other large earthquakes have provided additional sources
of empirical measurements to evaluate the potential for liquefaction at industrial or populated sites. A few
examples include the 1989 M6.9 Loma Prieta (California) earthquake (Bardet & Kapuskar, 1991;
Earthquake Engineering Research Institute, 1989; Holzer, 1998; Seed et al., 1991); the 2010 M8.8 Maule
(Chile) earthquake (Bertalot et al., 2013; Verdugo, 2012; Verdugo & González, 2015); the 2010 M7.1
Darfield (New Zealand) earthquake (Potter et al., 2015; Wotherspoon et al., 2015); and the 2011 M9.1
Tohoku-aki (“Great East Japan”) earthquake (Ishihara et al., 2014; Towhata et al., 2014; Tsukamoto et al.,
2012; Yasuda et al., 2012).
During the 1989 Loma Prieta earthquake, the damage sustained by the San Francisco Marina District
showed the combined hazard of building on saturated deposits which, in addition to being susceptible to

California North Coast Offshore Wind Studies
Overview of Geological Hazards 63
liquefaction, also amplify intensity from shaking (Holzer, 1992, 1998). For example, in their detailed
analysis of liquefaction from the Loma Prieta earthquake, Seed et al. (1991, p. 1,575) described damage
in the Marina District as follows: "Loose, fine sandy fill liquefied and this resulted in sand boils, lateral
spreading, settlement, partial bearing failures, structural distress, pavement damage, and damage to
pipes and other buried utilities. This region also suffered considerable damage to structures as a result of
strong ground shaking. A number of buildings were destroyed or badly damaged; much of the area was
evacuated and public access was restricted immediately following the earthquake." Although the Marina
District was 97 km (60 mi) from the earthquake epicenter, peak ground acceleration (PGA) exceeded
0.05-0.1 g, the threshold for triggering liquefaction deformation in deposits in that area (Rosidi &
Wigginton, 1991). It is significant that the area of the Marina District that sustained the most severe
damage is underlain by artificial or hydraulically placed fill, comparable to large areas fringing San
Francisco Bay where liquefaction in artificial fill was “significantly more pervasive and severe” than in
natural deposits (Seed et al., 1991, p. 1575). It should be noted that the majority of the artificial fill that
failed in the San Francisco Bay area was emplaced prior to the 1960s and more recent advancements in
soil liquefaction engineering (e.g., Seed et al., 2003).
6.2 Liquefaction in the Marine Environment
Liquefaction of deposits from the shore and seaward may be triggered by strong shaking from
earthquakes (Ambraseys & Sarma, 1969; Chaney & Fang, 1986, 1991; Coulter & Migliaccio, 1966; de
Groot et al., 2006; Mutlu Sumer et al., 2007; Towhata et al., 2014) or excessive loading from large or
sustained storm waves (Chaney & Fang, 1991; Dalrymple, 1979; Lee et al., 1993; Puig et al., 2004; Sassa
& Sekiguchi, 1999), as well as tsunamis (Kastens & Cita, 1981; Young et al., 2009). Compared to
terrestrial deposits, marine deposits on the continental shelf and slope may be particularly susceptible to
liquefaction because of the consistent grain size resulting from depositional processes moving sediment
offshore, as described by Chaney and Fang (1986. P. 104): “Because of the segregating action of wave
attack on the shore material and of the seaward transportation, most marine granular deposits have a
relatively narrow particle size range… These relatively uniform deposits make them susceptible to
liquefaction.”
The topic of marine liquefaction is complex and widely studied3 because of the importance of maintaining
marine infrastructure such as pipelines, cables, and platforms (Chaney & Almagor, 2015; Chaney & Fang,
1986, 1991; de Groot et al., 2006; Rahman & Jaber, 1991; Sumer et al., 1999; Mutlu et al., 2007).
Compared to the terrestrial environment, liquefaction in the marine environment is exacerbated by the
natural propensity for shelf deposits to liquefy and the potential for forcing from two different
mechanisms: earthquake shaking and wave loading. The result of liquefaction on the seafloor may be an
abrupt transformation of saturated marine deposits from a stable to liquefied state which can result in
sediment deformation including large-scale sediment displacements on even gently sloping surfaces
(Field et al., 1981, 1982; Rahman & Jaber, 1991).
A well-documented example of liquefaction on the continental shelf off Humboldt County is the large
submarine landslide triggered by the 1980 M7.2 earthquake (Chaney, 1991; Field, 1993; Field et al.,
1981) (See also Section 7). The slide was located 60 km northeast of the earthquake epicenter and
3 The preeminent expert on this topic is Dr. Ronald C. Chaney, Professor Emeritus from the HSU Department of
Environmental Resources Engineering.

California North Coast Offshore Wind Studies
Overview of Geological Hazards 64
displaced sediment over an area about 1 km wide and 20 km long on a nearly flat (0.25°) surface.
Deformation features on the slide included cracks from lateral spreading, collapse craters, and sand boils
as large as 25 m in diameter; horizontal dislocation along the slide plane was attributed to sediment
flowage and collapse (Chaney, 1991; Field et al., 1981, 1982; M. E. Field & Hall, 1982). Both Field
(1993) and Chaney (1991) emphasized the role of sediment type where the slide failure occurred. Chaney
(1991, p. 2140) specified that "The liquefaction failure offshore of the Klamath River was controlled
initially by sediment type. The seaward boundary of the failure zone coincides with the contact between
muddy sand and sandy clayey silt.” The correlation of the large area of liquefaction from the 1980
earthquake and the distribution of muddy sand (or silty sand) is consistent with the laboratory and field
observations reported elsewhere of the high potential of this sediment type to liquefy (e.g., Lade and
Yamamuro, 2011).
The 1980 submarine landslide shows that submarine liquefaction on a large-scale can occur during
earthquakes in the North Coast region, and that a thorough evaluation of sedimentary deposits and their
potential to liquefy during future events should be a priority for the offshore transmission cables corridors
and seafloor anchoring areas within the Humboldt Call Area.
6.3 Documented Liquefaction from North Coast Earthquakes
Liquefaction is a recognized hazard for areas of Humboldt County underlain by geologically young,
saturated sedimentary deposits (Humboldt County, 2017; van Dohlen, 2015). The liquefaction hazard
map of van Dohlen (2015) (Figure 38) identifies the potential hazard zones as all low-lying areas around
Humboldt Bay, in addition to the Arcata Bottom to the north and Eel River valley to the south.
In coastal Humboldt County, evidence for liquefaction from earthquakes was observed in the field
following the events in 1980 (Chaney, 1991; Lajoie & Keefer, 1981), 1992 (O’Brien, 1992; Reagor &
Brewer, 1992), and 2010 (Storesund et al., 2010). There were also reports of liquefaction from the 1906
San Andreas fault earthquake, with inventories based on field observations at the time (Lawson & Reid,
1908) as well as compilations from historical newspaper accounts and photographs (Dengler, 2008; Youd
& Hoose, 1978). With the exception of the discovery by the USGS of the liquefaction-generated
submarine landslide triggered by the 1980 earthquake (Field, 1993; M. E. Field et al., 1981, 1982; Field &
Hall, 1982; Field & Jennings, 1987b), there are no data available to determine if any offshore areas
sustained liquefaction deformation during these events.
For coastal Humboldt County between the mouth of Klamath River in the north to the lower Mattole
River valley in the south, the effects of liquefaction from earthquakes in 1980, 1992, and 2010 were
insignificant in terms of the built environment. Most evidence of liquefaction was observed on non-
industrial areas of sand spits, river flood plains, or beaches. Further, in each of these cases, liquefaction

California North Coast Offshore Wind Studies
Overview of Geological Hazards 65
Figure 38. Map showing areas of varying levels of seismic instability, including liquefaction hazard zones
(gray hatch pattern), for Humboldt County (from van Dohlen, 2015,
https://earthworks.stanford.edu/catalog/stanford-nk595pg0743.)
features were confined to areas underlain by sandy or saturated deposits that were not only naturally
highly susceptible to failure from liquefaction, but were also somewhat regionally controlled by proximity
to the earthquake epicenters and areas of strongest shaking.
For example, the largest liquefaction features observed from the 1980 earthquake, which occurred on a
fault in the Gorda plate northwest of Eureka (41.1°N/-124.2°) (Figure 18 and Figure 19) were observed
onshore at the Big Lagoon spit (Lajoie & Keefer, 1981) and offshore at the seaward edge of the marine
delta of the Klamath River (Chaney, 1991; Field, 1993; Field & Hall, 1982; Field & Jennings, 1987b;
Lajoie & Keefer, 1981) (Figure 39). At the Big Lagoon spit, Lajoe and Keefer (1981, p. 20) observed that
“[l]iquefaction-induced lateral spreads, cracks, and sand boils were observed in numerous places along
a kilometer-long traverse on foot at the southern end of this spit... Gary Carver and Tom Stephens4
reported similar features along the entire 5-km length of the spit.“ Other liquefaction features further to
the south— small ground cracks at King Salmon, minor ground settlement at Fields Landing, and a few
cracks and small sand boils on the southernmost South Spit (Figure 39)—were minor in comparison to
the size and extent of the ground failure at Big Lagoon and the submarine slide off the Klamath River. No
evidence for liquefaction in 1980 was observed in other areas underlain by saturated alluvial or estuarine
4 From Humboldt State University Department of Geology

California North Coast Offshore Wind Studies
Overview of Geological Hazards 66
deposits including Arcata Bottom, Arcata Bay, Jacoby Creek floodplain, Samoa Peninsula/North Spit, the
norther half of South Spit, or the Eel River floodplain.
Figure 39. Sites of documented liquefaction from the 1980 M7.2 earthquake superimposed on the USGS
MMI map. (Shaking intensity map accessed June 2020 from:
https://earthquake.usgs.gov/earthquakes/eventpage/usp0001aq1/map.)
Liquefaction from the 1992 mainshock and aftershocks, with epicenters at Cape Mendocino (Figures 18,
20, 21, and 22), triggered large liquefaction features in the Mattole and Eel River valleys (Reagor &
Brewer, 1992, p. 2), but there were no reports of deformation north of the Eel River. The 2010 M6.5
earthquake west of the Eel River produced liquefaction features consisting of numerous sand boils at
Centerville Beach and the lower Eel River valley, lateral spreading at King Salmon and along the banks
of the lower Eel River, and minor ground cracking and displacements in areas of Eureka close to the bay
(Storesund et al., 2010).
Liquefaction in the Eureka-Arcata area from the December 21, 1954, ~M6.5 earthquake, based on
newspaper accounts (Coffman & Von Hake, 1973; Stover & Coffman, 1993; Youd & Hoose, 1978) was
more substantial than in 1980, 1992, or 2010. As the earthquake preceded the seismic analysis capabilities
of the NCSS network started in the 1960s (Section 3.2), the size and epicenter location of this earthquake
is poorly understood, but is estimated as close to or directly beneath Eureka-Arcata area (USGS, 2020c).

California North Coast Offshore Wind Studies
Overview of Geological Hazards 67
Although they don’t mention the term “liquefaction” specifically and location information is mostly
vague, Stover and Coffman (1993, p. 148) are clearly reporting liquefaction deformation in the Eureka
and Arcata areas, including ground settling, from the 1954 event: “Damage to structures and
underground pipelines occurred in areas of unstable ground. Previous ground settling, as well as
subsidence at the time of the shock, were observed in some of the damaged areas. Between Eureka and
Arcata, U.S. Highway 101 was cracked and bulged in places.” Youd and Hoose (1978, p. 172-173)
describe underground pipe damage and ground settling in the Eureka area, and underground water lines
broken in Samoa: “In the poorly consolidated ground areas north and east of Eureka there were some
pipeline failures, and Eureka's main water reservoir was cracked. A large section of the older, downtown
filled area of Eureka settled from 2 to 6 inches… [The] Hammond Lumber Company brought its
operations to a sudden halt when several breaks occurred in the underground main of the company's fire
protection system. A.0. LeFors, spokesman for Hammond, stated that the mill will not operate in Samoa
or at its Eureka plants until repairs have been made.” This greater severity of liquefaction for sites
around Humboldt Bay in 1954 as compared with 1980, 1992, and 2010 is likely the result of the close
proximity of the earthquake epicenter to Humboldt Bay as interpreted by the USGS (2020c).
Compared to the minimal effects from liquefaction following the 1980, 1992, and 2010 earthquakes for
coastal Humboldt County, and the larger but relatively isolated effects in 1954, surface deformation
associated with liquefaction from the 1906 M7.9 San Andreas earthquake was significant in some
locations, and reported from a broader geographic area (Dengler, 2008; Lawson, 1908; Youd & Hoose,
1978) (Figure 40).
Although communities around Humboldt Bay are distant (~360-390 km/~220-240 mi) from the 1906
earthquake epicenter off San Francisco, they are only about ~60-90 km (~40-55 mi) from the
northernmost reach of the SAF, south of Cape Mendocino, where fault offsets were large and energy
release was high (Thatcher et al., 1997; USGS, 2020a, 2020m) (Figure 6) (see also Section 3.2.2). The
combination of high intensity and long duration (estimated 45-60 sec) shaking from the 1906 earthquake
in coastal Humboldt County resulted in the widespread observed deformation from liquefaction, to
include large areas of soft-sediment deformation, lateral spreading, and ground settling and subsidence
(Dengler, 2008; Youd & Hoose, 1978). The shaking in Eureka was reported as lasting 47 sec by A. H.
Bell, an observer at the Weather Bureau in Eureka (Lawson, 1908, p. 166) who kept notes on all
earthquakes felt in the area between 1903 and 1911 (Dengler, 2008, p. 920).
Deformation from liquefaction in 1906 was extensive in the Eel River valley area, including the
community of Port Kenyon (Figure 40 and Figure 41) and included large areas of lateral spreading,
ground settling, and sand boils. An eyewitness account by A.S. Eakle (Lawson, 1908, p. 165), a U.C.
Berkeley geology professor who surveyed the region three weeks after the earthquake, describes the
deformation in the Eel River valley as follows: “At Dungan's Ferry, on the north bank of the Eel River,
the ground was full of fissures. Every bar on the river had been opened by fissures, and the gravel toppled
over leaving big ditches, some 6 feet deep and over 500 feet long. Coming up on the mainland the road
had dropped about 2 feet in one place and was full of small fissures. A 40-acre field was entirely ruined.
It was heavily fissured, having dropped down in strips from 2 to 6 feet wide, from 4 to 6 feet deep, and
from 5 to 500 feet long, the fissures pointing between south and southwest. All the fields were full of

California North Coast Offshore Wind Studies
Overview of Geological Hazards 68
Figure 40. Sites of documented liquefaction from the 1906 M7.9 San Andreas earthquake superimposed
on the USGS MMI map. (Shaking intensity map accessed June 2020 from:
https://earthquake.usgs.gov/earthquakes/eventpage/iscgem16957905/map.)
Figure 41. Historical photograph of lateral spreading from liquefaction along the lower Eel River, at
Port Kenyon, Humboldt County, triggered by the 1906 earthquake on the San Andreas fault. (Original
photograph by E. Garrett; image reproduced from Dengler, 2008, her Figure 11).
quicksand volcanoes, some 1 to 3 cubic yards in size. They were perfect miniature volcanoes, every one
having a crater. It is said they extended 30 miles up the river.” The community of Ferndale sustained
extensive damage from the 1906 earthquake, but although ground settling from liquefaction was indicated

California North Coast Offshore Wind Studies
Overview of Geological Hazards 69
for the 1954 earthquake (Youd & Hoose, 1978), the extensive damage to buildings and homes in 1906
was attributed to the strong ground motion that wrenched buildings out of square (Beltz, 2006; Dengler,
2008; Lawson, 1908; Youd & Hoose, 1978). During the earthquake, local Ferndale citizens reported that
the ground rose and fell “in great waves like those of the sea” (Lawson, 1908, p. 165).
Eakle’s field observations (published in Lawson, 1908) plus compilations of historical records by Youd
and Hoose (1978) and Dengler (2008) also document significant deformation at Fields Landing, south
Eureka at the mouth of Elk River, and on the North Spit at Samoa (Figure 41 and Figure 42). Ground
settling and fissuring from liquefaction is mentioned for sites in Eureka, Arcata, and near Freshwater, but
there are minimal details as most damage reports focused on structural damage to businesses and homes,
particularly numbers of downed chimneys (Dengler, 2008; Lawson, 1908; Youd & Hoose, 1978). An
account in one of the Humboldt area newspapers in 1906, the Weekly Humboldt Times, mentions
problems encountered by the Northwestern Pacific Railroad because the “marsh land between [Eureka}
and Arcata sand in places” (Youd and Hoose, 1978, p. 173), but no details are provided.
Figure 42. Historical photograph of the Pacific Lumber Company dock at Fields Landing that collapsed
from liquefaction triggered by the 1906 San Andreas fault earthquake. (Image reproduced from Dengler,
2008, her Figure 8.)
At Fields Landing, liquefaction caused significant lateral spreading and ground settling or subsidence
(Lawson, 1908; Youd & Hoose, 1978). A full meter of subsidence was recorded for an island in the
channel off Fields Landing, and the Pacific Lumber Company dock was destroyed when the ground
settled beneath it (Dengler, 2008) (Figure LF5). Ground settlement at Samoa was problematic for at least
one of the large timber mills: “At Samoa, where the Vance Company has its mill and warehouses… one
warehouse, the ground sunk beneath it several feet. The floor of the planing mill sank several inches on
the east side and some are of the opinion that the factors settled also at one wall" (Youd and Hoose, 1978,
p. 173). There are no observations concerning possible liquefaction for other areas of the North or South
spits, nor—as with most of the other strong earthquakes after 1906—any information as to possible
effects in offshore areas.
Liquefaction will be a challenge for locating proposed offshore wind facilities because sandy or saturated
deposits underlie the NCOW facilities areas on the North and South spits as well as the areas of the

California North Coast Offshore Wind Studies
Overview of Geological Hazards 70
continental shelf that may include the Humboldt Call Area and pathways for submarine transmission
cables.
However, liquefaction in seismically active areas, and particularly in coastal environments, has been an
international area of focus for more than 60 years (Committee on Earthquake Engineering, 1985; Holzer
et al., 2011; ICRAGEESD, 2001, 2010, 2016; Seed et al., 2003, 2001), with advances in liquefaction
engineering gleaned from numerous case studies of past seismically induced engineering failures. For
example, Seed et al. (R. B. Seed et al., 2003, p. 1) note that “Soil liquefaction engineering has evolved
into a sub-field in its own right, and engineering assessment and mitigation of seismic soil liquefaction
hazard is increasingly well addressed in both research and practice. This rapid evolution in the treatment
of liquefaction has been pushed largely by a confluence of lessons and data provided by a series of major
earthquakes over the past dozen years, as well as by the research and professional/political will
engendered by these major seismic events." It is reasonable to expect that that hazards from liquefaction
can be mitigated for the NCOW facilities assuming that there is a comprehensive geotechnical evaluation
of the sedimentary materials on which all NCOW facilities will be constructed, and realistic estimates for
intensity of seismic shaking are considered in the liquefaction engineering designs.
7. SUBMARINE LANDSLIDES
For the purposes of this report, we do not include terrestrial landslides as a potential hazard for the
NCOW facilities. Although terrestrial landslides are common in the steep terrain and coastal bluffs of
Humboldt County, there would be no direct impact from terrestrial landslides at NCOW facility locations.
Indirect effects from landslides, such accelerated sediment delivery to offshore turbidites or tsunami
generation from catastrophic failure, are discussed elsewhere in the text (Sections 7.4 and 8, respectively).
7.1 Overview of Submarine Landslides
Instability in sediments along the offshore continental margin of the Cascadia subduction zone has been
documented primarily by research cruises using multibeam bathymetric profiling, multi-channel seismic
reflection, and ocean bottom photography (Burger et al., 2002b; Clarke, 1990; Field et al., 1980, 1982a,
1982b; Field & Clarke, 1984; Gulick et al., 1998; Hill et al., 2020). Field et al. (1980) describe five types
of seafloor instability: slumps and slides, unstable sediment masses, areas of uplift (diapirism),
accumulation of shallow gas, and gas hydrates. Only the first two are described in this section as the last
three (uplift, shallow gas and gas hydrates) are described in earlier sections of this report. A detailed
discussion of causes of slope failures, especially due to liquefaction, is in Section 6 of this report.
Turbidity currents, another source of slope instability, are described below in this section.
7.2 Slumps and Slides
Field et al. (1980) describe landslides as sediment moving in a discrete mass with little or no internal
deformation. The sediment movement is either translational (glides) or rotational along failure planes
(slumps) (Figure 43). It is possible for these mass movements to occur on gentle slopes of only 1°–8°.
They describe the criteria for recognition of slumps as evidence for dislocation of beds or groups of beds,
bed rotation, lack of internal structure or sedimentary bedding, and presence of a gently curving failure
surface. Field et al. (1982) further describe another form of slide which they referred to as sediment flows
and lateral spreads identified by a toe scarp, compressional ridges, sand boils and collapse craters. They
also describe hummocky topography associated with the slide masses and another form of slope

California North Coast Offshore Wind Studies
Overview of Geological Hazards 71
instability observed are areas of unconsolidated sediment that, although they do not have apparent failure
planes, show some evidence of motion.
Figure 43. General landslide classifications that can be applied to submarine failures (from Lee et al.,
1993, their Figure 3).
Large slumps are common throughout the seafloor of the accretionary prism and offshore Eel River basin.
Field et al. (1980) documented slumps ranging in size from 1,000 m to over 10 km in length, and in water
depths from 200 m to more than 750 m on the shelf edge, plateau slope, and the plateau. They document a
large zone of slumping that covers an area exceeding 185 km2.
Hill et al. (2020) describe numerous small, scarps (< 1 km wide) and slide scars between 800 and 1,200 m
depth that are on slopes of 6–8° (Figure 44).
Following the 1980 M7.2 offshore earthquake (Section 3.2.1), shaking-induced failure of parts of the
seafloor was evident by the presence of scarps and terraces that had not been observed during previous
multi-channel reflection or side-scan surveys (Field et al., 1981, 1982a, 1982b; Field & Clarke, 1984;
Field & Hall, 1982). Using sonographs, Field and Hall (1982) located a large failure zone off the mouth
of the Klamath River in about 60 m of water that extends for about 20 km along a 1 to 5 km wide, NNW-
trending zone. They estimated the mass to be between 5 to 15 m thick. Within the failure zone they
documented areas of sand boils up to 25 m wide (indicative of liquefaction), collapse features that
included irregular scarps up to 25 m across, and sediment flows that extended about 100 m in lateral
distance as evidence by sediment lobes. These failures were accompanied by areas of active gas seeps
which were imaged by seismic reflection and side scan sonar (Field & Hall, 1982).
Field et al. (1980), Field and Barber (1993), and Gardner et al. (1999) described a massive feature they
interpreted to be a large landslide, referred to as the “Humboldt Slide,” that affects an area of
approximately 200 km2 on a 4° slope in water depths of 500–650 m. It overlaps with the southeasternmost
portion of the Humboldt Call Area (Figure 44 and Figure 45). The feature is about 10 km long and 60 m
thick (Gardner et al., 1999). They identified it using high-resolution seismic, multibeam bathymetric, and
side-scan sonar surveys by identifying geometry and internal structures that are similar to other well-
documented submarine slides. They also described the likelihood of abundant gas in the sediment by the
presence of pockmarks, acoustic wipeouts, and bottom-simulating reflector (BSR). They did not observe a
head wall or upslope scarp with this feature although the upslope portion is steeper, up to 6°, than the
body of the slide. They observed a distinctive ridge and swale topography that they considered similar to
topography found associated with subaerial retrogressive landslides (Figure 43). They noted that these

California North Coast Offshore Wind Studies
Overview of Geological Hazards 72
features had systematic rhythmic and undulatory forms but argued they were not sedimentary structures.
They concluded that the “Humboldt Slide” is a translational slide active in the Late Pleistocene to
Holocene, and possibly currently active (Figure 46). Hill et al. (2020) provide high resolution profiles and
cross-sections of areas of sediment waves in the Eel Plateau (Figure 47).
7.3 Unstable Sediment Masses
Lee et al. (2002) reassessed the “Humboldt Slide” and concluded it was not a landslide but a different
type of sediment instability: a field of sediment waves formed by hyperpycnal flow (dense near-bottom
currents), related to discharge from the Eel River, delivering large amounts of sediment in the form of
unconfined turbidity currents. They refer to the sediment waves as a series of undulatory block-like units
with a wavelength of 400–1,000 m and wave height of 2–10 m. They also consider the absence of a
headwall or scarp as reported by Gardner et al. (1999) to support this being a sedimentary feature. Hill et
al. (2020) describe sediment wave-type bedforms that range across the Eel Plateau having wavelengths of
approximately 1 km and 5 m amplitude that occur in water depths of 150– 300 m on the north side of the
Little Salmon anticline (Figure 44). They also identify a sediment wave field located south of the Table
Bluff anticline.
Hill et al. (2020) describe the role of surface gradient and areas of deposition and erosion. Their
observations show that, in general, areas with low gradient (4–5°) support sediment accumulation while
higher gradient areas are susceptible to erosion. Specifically, regarding the Eel Plateau, they suggest that
the low gradient parts of the outer shelf and upper slope contain large sediment wave fields related to high
sediment discharge form the Eel River immediately to the east. Much of this sediment transport they
attribute to hyperpycnal flows. They consider the area between the Little Salmon anticline (LSA) and Eel
Canyon to be a higher gradient canyon that is characterized by erosion and gullying as evidenced by large
landslide scars. They suggest that the lower shelf headscarps have no evidence of sediment drape from the
nearby Eel River source, indicating they are young features. They also suggest that these scarps may be
evidence for coseismic failure of lower slopes during earthquakes. They describe the lower slope of the
accretionary prism to be an area of slides, slumps, debris flows that are likely the result of earthquake-
induced failure that ultimately result in turbidity flows that occur outside the confines of canyons.
Hill et al. (2020) speculate on why there appear to be fewer active landslides in the Eel Plateau area than
in the central and northern Cascadia subduction accretionary prism, especially given ample factors present
that are thought to promote submarine failure including presence of gas hydrates, significant sediment
accumulation causing overpressurization, and significant seismicity. They indicate that most open-slope
failures in southern Cascadia occur on slopes of 4° to 6°. They speculate that one factor may be seismic
strengthening of sediments due to repeated shaking and settlement of the unconsolidated sediments, thus

California North Coast Offshore Wind Studies
Overview of Geological Hazards 73
Figure 44. High-resolution bathymetry of Trinidad Canyon and Eel Plateau portions of the southern
Cascadia subduction zone, modified from Hill et al. (2020, their Figures 10 and 12). The Humboldt Call
Area is shown in the center as a pale-yellow polygon. The “Humboldt Slide” occurs in the southeastern
portion of the call area. Note the presence of large landslide head scarps at the heads of canyons, along
the lower slope and at the shelf edge. Large fields of sediment waves are associated with the upper slope
and represent areas of mobilized sediment and accumulation.

California North Coast Offshore Wind Studies
Overview of Geological Hazards 74
Figure 45. Shaded relief and bathymetry map showing the location of the “Humboldt Slide” and possible
sediment waves (From Lee et al., 2002, their Figure 7.)
Figure 46. Interpreted acoustic profile across the “Humboldt Slide” from Gardner et al. (1999, their
Figure 7). Vertical exaggeration = 30x.

California North Coast Offshore Wind Studies
Overview of Geological Hazards 75
Figure 47. High resolution boomer profiles of the outer shelf and upper slope of the Eel Plateau. (a)
Sediment waves in area of low gradient and sediment accumulation. (From Hill et al., 2020, their Figure
13a, location shown on map to the right.) (b) Area of higher gradient showing evidence for erosion
including bed truncation and a 5 m high headscarp. (From Hill et al, 2020, their Figure 13b, location
shown on map to the right.)
increasing their shear strength. They also propose that lithologic differences between southern Cascadia
and areas to the north may also contribute to stability differences.
7.4 Turbidity currents
Turbidity currents are gravity driven, sediment-laden submarine flows that are transported in suspension
via fluid turbulence. They can cause catastrophic erosion as well as extreme deposition (Meiburg &
Kneller, 2010). In addition to submarine landslides, they are considered a primary means of moving
sediment from the shelf to the abyssal plain. Sediment-transport distances via turbidity currents range
from hundreds of meters to thousands of kilometers (Meiburg & Kneller, 2010). Erosional features such
as gullies on upper slopes and submarine canyons are often associated with turbidite generation areas
(Meiburg & Kneller, 2010).
From Meiburg and Keller (2010), mechanisms responsible for creating the conditions that lead to
turbidity current generation include:
• large amounts of sediment generated by rivers in flood, which may lead to hyperpycnal5 currents
derived directly from nearby rivers distributing excess sediment or disturbing in-place sediment
5 “Hyperpycnal” describes dense, sediment-laden flows, particularly those produced by rivers.

California North Coast Offshore Wind Studies
Overview of Geological Hazards 76
• storm-induced downwelling caused by wave action and piling up of water in a landward direction
• coherence in wind and water waves producing oscillations in the near shore
• seismically-induced accelerations on the seafloor
• destabilization of sediments on the seafloor due to liquefaction
• large subaerial landslide sources that deposit excessive amounts of sediment into rivers which is
then delivered offshore to the upper slope or canyon heads.
Much investigation has been conducted in the past 30 years regarding the identification of turbidity
current depositional and erosional features and the association between turbidity current generation and
earthquakes along the Cascadia subduction margin (e.g., Adams, 1990; Atwater et al., 2003, 2014;
Atwater & Griggs, 2012; Goldfinger et al., 2003, 2012, 2013; Priest et al., 2017). The ongoing hypothesis
has been that the presence of turbidites emanating from numerous canyons at the same time along the
length of the subduction margin represent destabilization of upper slope and in-canyon sediment during
large megathrust earthquakes. This hypothesis has, in turn, been a driving force for establishing
recurrence estimates for these earthquakes (Goldfinger et al., 2003, 2012, 2013). However, Atwater et al.
(2014) caution that attempted correlation between turbidites at separate locations includes large
uncertainties, and further that there is not similar evidence for synchronous turbidites being produced
during large earthquakes at other subductions zones although they show sediment availability comparable
to Cascadia. Thus, there are equivocal conclusions about whether, along southern Cascadia, there is a
reliable correspondence between large earthquakes and production of turbidity currents.
The hazard posed by submarine landslides to offshore structures associated within the Humboldt Call
Area and in corridors between the Call Area and onshore facilities cannot be clearly ascertained based on
the current data. Although there is evidence that large landslides have occurred in the upper slope and,
especially, in the steeper lower slope of the Trinidad and Eel Plateau portions of the southern Cascadia
margin (Hill et al., 2020), there are large amounts of rapidly-emplaced, unconsolidated sediment in this
area that, in spite of significant large, historic and pre-historic earthquakes, do not appear to have been
remobilized. The presence of sediment waves in portions of these areas suggests that sediment is currently
being transported, possibly due to unconfined turbidity currents and hyperpycnal flow related to large
discharge events from the Eel River (Hill et al., 2020; Homa J Lee et al., 2002). In total, the reporting by
Hill et al. (2020) and Field et al. (1980) indicate that a significant portion of the Humboldt Call Area may
be susceptible to slope instability (Figure 44 and Figure 48), and that further study in support of an
offshore wind project is warranted.
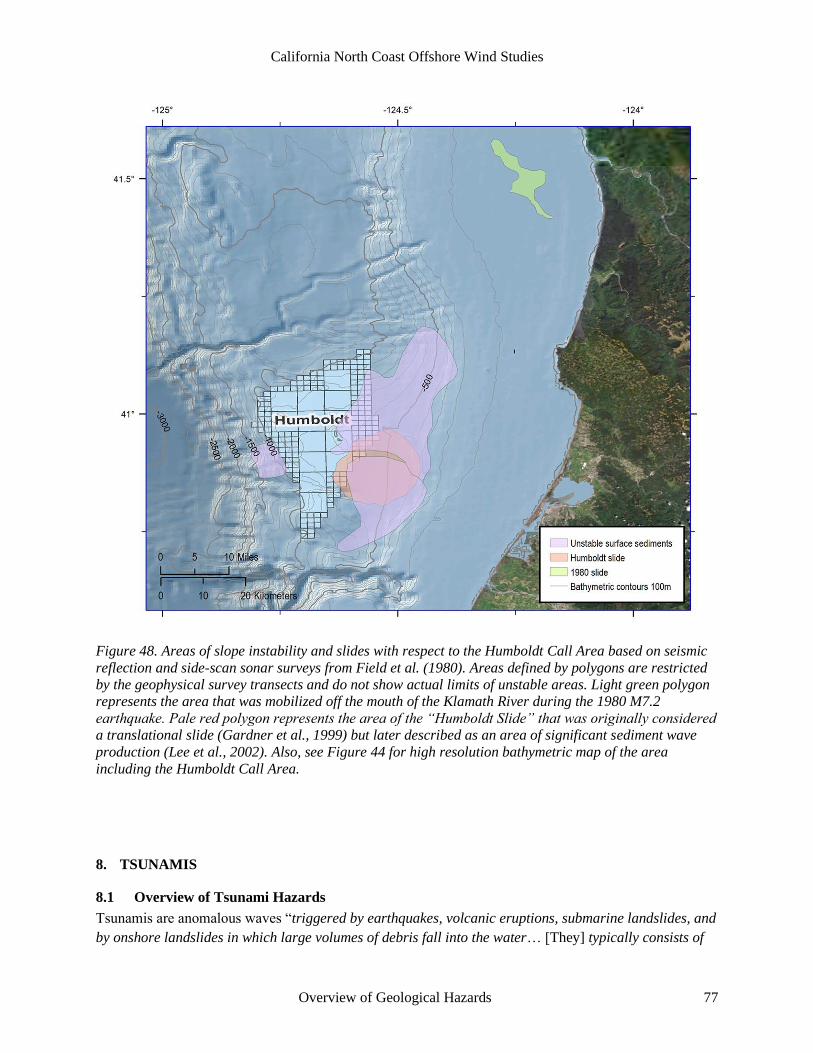
California North Coast Offshore Wind Studies
Overview of Geological Hazards 77
Figure 48. Areas of slope instability and slides with respect to the Humboldt Call Area based on seismic
reflection and side-scan sonar surveys from Field et al. (1980). Areas defined by polygons are restricted
by the geophysical survey transects and do not show actual limits of unstable areas. Light green polygon
represents the area that was mobilized off the mouth of the Klamath River during the 1980 M7.2
earthquake. Pale red polygon represents the area of the “Humboldt Slide” that was originally considered
a translational slide (Gardner et al., 1999) but later described as an area of significant sediment wave
production (Lee et al., 2002). Also, see Figure 44 for high resolution bathymetric map of the area
including the Humboldt Call Area.
8. TSUNAMIS
8.1 Overview of Tsunami Hazards
Tsunamis are anomalous waves “triggered by earthquakes, volcanic eruptions, submarine landslides, and
by onshore landslides in which large volumes of debris fall into the water… [They] typically consists of

California North Coast Offshore Wind Studies
Overview of Geological Hazards 78
multiple waves that rush ashore like a fast-rising tide with powerful currents” (USGS, 2020o). For the
North Coast and other areas adjacent to subduction zones, tsunami sources fall into two categories: (1)
local or nearfield tsunamis generated by seafloor displacement associated with a rupture along the
subduction zone megathrust, or landslides set in motion by seismic shaking, to include submarine
landslides and massive coastal landslides that fall into the sea; and (2) distant-source or farfield tsunamis
(also called teletsunamis, e.g. Wilson et al., 2013) originating from seismic disturbances, particularly
along subduction zones, in other locations as far as thousands of kilometers away.
The North Coast area faces risk from both nearfield and farfield tsunamis. Geophysical modeling and
geological field data show that the CSZ has ruptured in estimated M8-M9 earthquakes in the past, and
that comparable to other subduction zones worldwide, tsunamis have accompanied a number of these past
earthquakes (Abramson, 1998; Atwater et al., 2003, 2005; Carver et al., 1998b; Garrison-Laney, 1998;
Heaton & Hartzell, 1987; Hemphill-Haley et al., 2019; Kelsey et al., 2005b; Patton, 2004b; Peterson et
al., 2011). For the NCOW facilities, tsunami concerns include on-land inundation, coastal and shallow
seafloor erosion, and potential impacts to infrastructure from strong currents in Humboldt Bay. The major
effect of farfield tsunamis would be strong, possibly erosive currents in the bay (Admire, 2013; Admire et
al., 2011, 2014; Wilson et al., 2013b), whereas nearfield tsunamis would likely involve all three areas of
impact.
The primary authorities on tsunami hazards for the North Coast are the California Geological Survey
(CGS, 2020) and the Redwood Coast Tsunami Work Group (RCTWG, https://rctwg.humboldt.edu) who
produced the tsunami inundation maps shown in Figure 49 and Figure 50. These maps show that the
Humboldt Bay Generating Station (HBGS) in the King Salmon area and Redwood Marine Terminal I (a
possible offshore wind assembly port on the North Spit) both lie within the projected tsunami inundation
zones from a subduction zone earthquake.
The aftermaths of tsunamis associated with the subduction zone earthquakes in 2004 (e.g., Kurian et al.,
2006; Szczuciński et al., 2006), 2010 (e.g., Fritz et al., 2011; Palermo et al., 2013), and 2011 (e.g., Fraser
et al., 2013; Hazarika et al., 2013; Suppasri et al., 2012) attest to the level of destruction that can
accompany such events. For the 1964 M9.2 Alaska earthquake, 116 of the 131 reported fatalities were
caused by tsunami inundation, much attributed to submarine landslides, along the coast and fjords of
southern Alaska (Brothers et al., 2016; Haeussler et al., 2007, 2014; Suleimani et al., 2011). On the North
Coast and elsewhere along the coast of the Pacific Northwest and British Columbia, the farfield tsunami
from the 1964 earthquake caused significant damage. Crescent City, California, was impacted the most
severely with 29 city blocks damaged and 11 citizens killed (Dengler & Magoon, 2005; Griffin, 1984).
For the 2011 Tohoku-aki M9.0 earthquake, even though the earthquake shook a large part of the island of
Honshu—including large urban areas—for as much as 6 minutes, most of the destruction and the majority
of the >20,000 deaths were attributed to the tsunami rather than the shaking (Nakahara & Ichikawa,
2013).

California North Coast Offshore Wind Studies
Overview of Geological Hazards 79
Figure 49. Map of tsunami inundation zone for area of Humboldt Bay that will include the (1) Redwood
Marine Terminal I on North Spit, (2) the proposed transmission cable landing site on the South Spit, and
(3) the location of the Humboldt Bay Generating Station (HBGS). (Modified from RCTWG, 2020,
Humboldt Bay Tsunami Evacuation Map, <https://rctwg.humboldt.edu/sites/default/files/regional-
crop.pdf>.)

California North Coast Offshore Wind Studies
Overview of Geological Hazards 80
Figure 50. Map of tsunami inundation zone in the vicinity of the Humboldt Bay Generating Station (red
dot). (Modified from RCTWG, 2020, Fields Landing – King Salmon Tsunami Evacuation Map,
<https://rctwg.humboldt.edu/sites/default/files/fllks.pdf>.)
Tsunamis are usually not observed as a single wave, but the arrival of a series of waves with the crests
separated by an amount of time determined by their wavelength and distance from source, ranging from a
few minutes to hours (NOAA, 2020). Often the first wave to arrive is not the largest (Dengler & Magoon,
2005; Okal & Synolakis, 2016). The destructive forces of tsunamis not only include the landward force
and flooding of the incoming waves, but also the erosion and deposition by backwash as debris-filled
water rushes back to the ocean, typically at high flow velocities (Bahuguna et al., 2008; Feldens et al.,
2009; Hazarika et al., 2013; McAdoo et al., 2011; Udo et al., 2016). As described by Lemmons (2016),
the “force of the tsunami backwash can be just as strong, and in some cases stronger than the initial
impact. Some waves take five minutes or more to move inland, and less than two minutes to wash back out
to sea, so the outgoing velocity may be greater than the initial surge. The outgoing waves often take the
loose debris from the destruction of the incoming wave with them, placing projectiles in the water for the
next crest to launch when it moves inland.” The combined landward flow and subsequent backwash can

California North Coast Offshore Wind Studies
Overview of Geological Hazards 81
result in areas of coastal erosion and deposition in the nearshore (Feldens et al., 2009; Hazarika et al.,
2013; Ikehara et al., 2014; MacInnes et al., 2009; Tanaka et al., 2012; Udo et al., 2012), as well as
sediment scour in ports and harbors (Borrero et al., 2015; SAFFR Tsunami Modeling Working Group,
2013; Son et al., 2020; Wilson et al., 2012).
8.2 Tsunami Record for the North Coast at Humboldt Bay
The record of tsunamis for the Humboldt Bay/North Coast area includes prehistoric tsunamis from CSZ
megathrust earthquakes (Carver et al., 1998b; Patton, 2004b), a local but non-destructive tsunami driven
by the 1992 M7.2 earthquake at Cape Mendocino (Dengler et al., 2008; González et al., 1995), and
numerous tsunamis from distant-source events documented by tide gauges or other instrumentation
(Admire et al., 2011, 2014).
Previous paleoseismic studies at Humboldt Bay that report evidence for tsunami inundation from past
CSZ earthquakes include Carver et al. (1998) and Patton (2004b). Both of these studies were located in
southern Humboldt Bay. To date, no definitive tsunami deposits have been identified at study locations
along northern Humboldt Bay (Arcata Bay), which is relatively sheltered from the Pacific Ocean by
intervening high sand dunes between the mouth of Humboldt Bay and the Mad River (Engelhart et al.,
2016; Hemphill-Haley, 2017; Padgett et al., in press; Pritchard, 2004). Carver et al. (1998b) described
sandy deposits on the bayward side of South Spit that they interpreted as possible tsunami deposits from
CSZ earthquakes, although their chronology was based on few radiocarbon ages. In the Hookton Slough
area on the east side of southern Humboldt Bay about 5 km (3 mi) from the Pacific Ocean, Patton (2004)
identified evidence for past instances of coseismic subsidence from prehistoric CSZ earthquakes in the
form of layers of former marsh soils buried by intertidal mud (see also Section 10). Two of the buried
soils, indicating earthquakes about 1,500-1,700 years ago and 2,300-2,700 years ago (Table 4), were
capped by coarse silt and sand, consistent with a tsunami having inundated the area in conjunction with
the earthquake that caused the land subsidence. This coincidence of layers of silt and sand in direct
juxtaposition with buried soil deposits has been similarly identified at numerous other locations along the
length of the CSZ, and interpreted as evidence for tsunami inundation from past CSZ earthquakes
(Atwater et al., 1995; Atwater & Hemphill-Haley, 1997; Hemphill-Haley et al., 2019; Kelsey et al.,
2002b; Nelson et al., 1995, 2006; Witter et al., 2003, 2012).
Patton (2004) found no evidence at Hookton Slough for a tsunami deposit associated with the ~ M9.0
CSZ earthquake in 1700 C.E., and evidence for the 1700 C.E. deposit at the South Humboldt Bay sites
studied by Carver et al. (1998) is possible but equivocal because of the proximity of the study sites to the
ocean and overlapping radiocarbon ages with the age of destructive coastal storms in the late 19th century
(e.g., Hemphill-Haley et al., 2019). However, it is likely that the coast at Humboldt Bay was impacted by
the CSZ tsunami in 1700 C.E. as there is abundant evidence for this event at coastal sites to the north at
Crescent City and elsewhere in coastal Del Norte County (Abramson, 1998; Carver et al., 1998b;
Garrison-Laney, 1998; Hemphill-Haley et al., 2019; Peterson et al., 2011).
Farfield tsunamis are a fairly frequent occurrence on the North Coast, with 33 tsunamis recorded since the
installation of the first tide gauge at Crescent City in 1933 (Admire et al., 2011, 2014). Five of these
farfield tsunamis caused major damage to the harbor at Crescent City, but compared to Humboldt Bay,
Crescent City is “particularly vulnerable to tsunamis” (Admire et al., 2014, p. 3385) because of its
geographic position, offshore morphology, and configuration of the harbor area that serves to magnify
tsunami energy (Dengler et al., 2008; Dengler & Uslu, 2011; Kowalik et al., 2008; Uslu et al., 2008). To

California North Coast Offshore Wind Studies
Overview of Geological Hazards 82
date, Humboldt Bay has not suffered damage from farfield tsunamis, although higher current velocities
have been recorded, for example, 0.6 m/sec to 0.84 m/sec in 2011 from the Tohoku farfield tsunami
(Admire, 2013; Admire et al., 2011, 2014). The “Physical Oceanographic Real-time System (PORTS)
project, a collaborative effort at Humboldt Bay between NOAA, Humboldt State University and Chevron
(https://tidesandcurrents.noaa.gov/ports/index.html?port=hb) currently maintains a continuous monitoring
system in Humboldt Bay in the event of tsunami activity to acquire “Better estimates of the currents
generated by tsunamis [which] can be used to improve numerical modeling and to provide better
understanding of the hazards in ports and harbors caused by currents (Admire et al., 2014, p. 3402). As
undertaken in other ports in California (e.g., Borrero et al., 2015; SAFFR Tsunami Modeling Working
Group, 2013), an evaluation of potential effects of tsunami-driven currents in Humboldt Bay should be
included in infrastructure designs for NCOW facilities.
9. COSEISMIC LAND-LEVEL CHANGES
Coseismic land-level changes may accompany large magnitude earthquakes, including those possible
from rupture of the CSZ megathrust and large local thrust faults in the accretionary prism in the vicinity
of Humboldt Bay.
Coseismic land-level changes refer to abrupt movements either up (uplift) or down (subsidence) during
large earthquakes. The vertical motion is the result of land movement from fault rupture, and in the case
of subduction zone earthquakes (such as those along the CSZ megathrust) areas of sudden vertical land-
level change may be found in coastal areas along the length of the subduction zone (Atwater et al., 2003;
Imakiire & Koarai, 2012b). In subduction zone earthquakes, whether the vertical land movement is up,
down, or neutral depends on the location of the site relative to the flexure point in the overriding plate
above the megathrust. For example, for the 1964 M9.2 Alaska earthquake, areas of uplift occurred largely
offshore, whereas areas of subsidence, as much as 2-3 m in some places (Plafker, 1969), occurred onshore
along the coast (Carver & Plafker, 2008; Freymueller et al., 2013; Shennan et al., 2014). In the most
recent full-margin rupture of the CSZ, in 1700 C.E., all coastal sites evaluated between Northern
California and Vancouver Island experienced coseismic subsidence; there is no evidence for areas of
coseismic uplift during this event. For the 1964 Alaska earthquake, the absolute amounts of subsidence
measured at some locations was attributed to vertical land motion from crustal deformation with the
added effects of liquefaction of unconsolidated deposits (Walsh et al., 1995). Field evidence for
liquefaction associated with other evidence for coseismic subsidence has been documented for past
megathrust earthquakes along the Cascadia subduction zone (Atwater, 2000; Clague et al., 1997;
Hemphill-Haley, 2017; Jacoby et al., 1997; Kelsey et al., 2002a; Takada & Atwater, 2004)).
9.1 Coseismic Subsidence
Unlike the temporary inundation from climatic events such as coastal storms or floods, coseismically
subsided areas abruptly drop from elevations unaffected by sea level to areas permanently inundated by
tides. A clear modern example of this are the large industrial and agricultural areas on the Sendai plain
that subsided during the 2011 M9.2 Tohoku-aki earthquake and are now continuously inundated by
seawater (Imakiire & Koarai, 2012b). Therefore, the inherent risk to buildings or infrastructure close to
sea level in areas adjacent to subduction zones, such as the southern CSZ, lies in their potential to become
submerged and unusable following the earthquake-induced subsidence.
Evidence for past instances of abrupt coseismic subsidence at coastal sites is recognized by the
stratigraphic juxtaposition of two dissimilar kinds of sedimentary deposits in sharp contact with one

California North Coast Offshore Wind Studies
Overview of Geological Hazards 83
another: an organic-rich soil (peat) indicating a former marsh, meadow, or coastal woodland—a type of
environment which would be infrequently or possibly never submerged by tides—abruptly overlain by
thick deposits of mud indicative of a lower intertidal setting such as a tidal flat (Figure 51). This
stratigraphic signature is observed at coastal and estuarine sites along the length of the CSZ, and records
the conversion of vegetated areas to tidal flats as a result of coseismic subsidence. These anomalous mud-
over-soil sequences are similarly observed at numerous locations along Humboldt Bay and the Eel River
estuary (Carver et al., 1998; Hemphill-Haley, 2017; Jacoby et al., 1995; Li, 1992; Padgett et al., in press,
2019; Patton, 2004; Pritchard, 2004; Valentine, 1992; Valentine et al., 2012; Vick, 1988) and are
interpreted, as elsewhere, of recording coseismic subsidence from past CSZ megathrust earthquakes.
The most recent of the paleoseismic studies in Humboldt Bay (Padgett et al, in press) (Figure 52) focused
on sites in northern Humboldt Bay (Arcata Bay) where they described 4 past incidences of earthquake-
driven subsidence from CSZ earthquakes. From multiple radiocarbon dates, the ages of the four events
are identified as (1) 1700 C.E.; (2) ~875 cal yrs B.P.6; (3) 1,120 cal yrs B.P.; and (4) ~1,620 cal yrs B.P.)
(Table 5). The estimated amounts of coseismic subsidence from these past earthquakes, determined
statistically from changes in microfossil assemblages across the soil-mud contacts, are about 1 m for the
earthquakes in 1700 C.E. and 1,120 cal yr B.P.; 0.4 m for the earthquake in 1,120 cal yr B.P.; and likely
greater than 1 m for the oldest recorded event in 1,620 cal yr B.P. Comparable qualitative or semi-
quantitative estimates for subsidence were determined from earlier studies, although without the precision
of the later study by Pagdett et al (in press). However, the combined results of the various paleoseismic
studies for Humboldt Bay suggest that coseismic subsidence on the order of 0.5-1 m or more is a
possibility for future CSZ earthquakes.
6 The unit “cal yrs B.P.” refers to “calibrated radiocarbon years before present” with “present” defined as the year
1950 C.E.
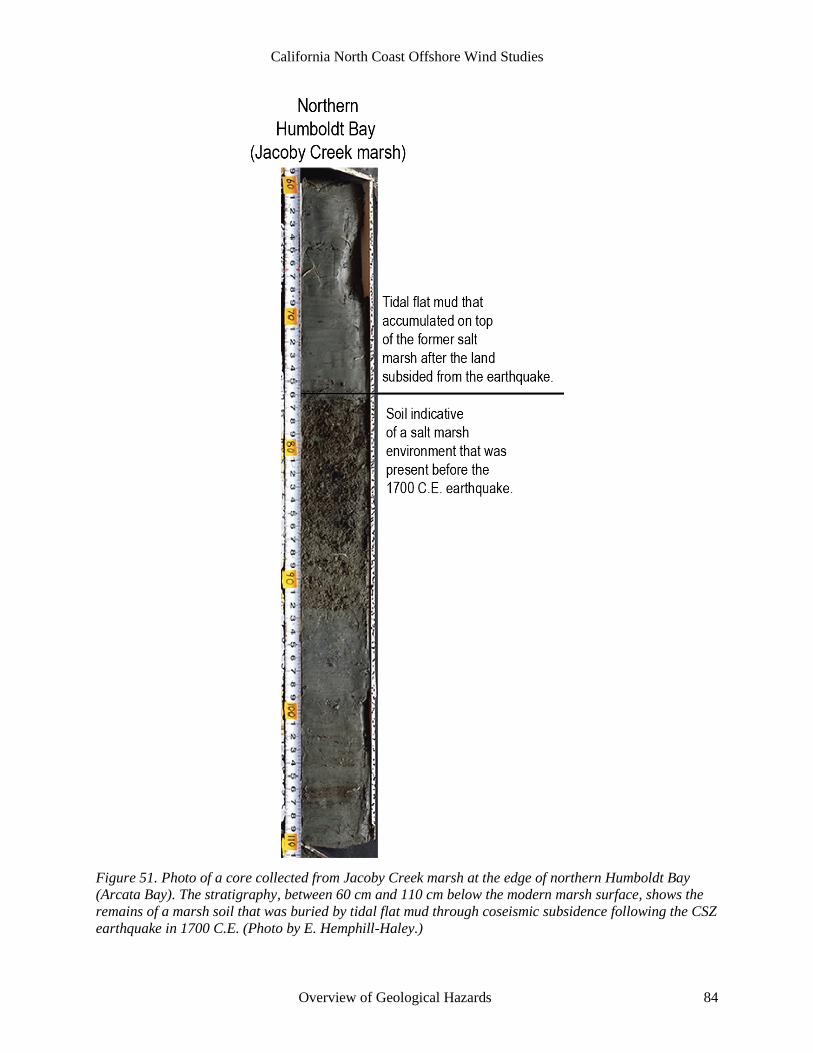
California North Coast Offshore Wind Studies
Overview of Geological Hazards 84
Figure 51. Photo of a core collected from Jacoby Creek marsh at the edge of northern Humboldt Bay
(Arcata Bay). The stratigraphy, between 60 cm and 110 cm below the modern marsh surface, shows the
remains of a marsh soil that was buried by tidal flat mud through coseismic subsidence following the CSZ
earthquake in 1700 C.E. (Photo by E. Hemphill-Haley.)

California North Coast Offshore Wind Studies
Overview of Geological Hazards 85
Figure 52. Core diagrams from Padgett et al. (in press, their Figure 2) showing multiple times in the past
that areas of northern Humboldt Bay coseismically subsided and former marshes (indicated by the dark
brown “peat” symbols) were buried by thick accumulations of intertidal mud (indicated by gray
symbols). Following subsidence, the land builds back up over time to an elevation high enough to support
marsh growth again, until the next great earthquake and subsequent burial.
Both Valentine et al. (2012) and Padgett et al. (in press) note the occurrence of at least one possible
episode of subsidence about 500 years ago that does not appear to correlate to well-documented CSZ
earthquakes. Padgett et al. (in press) do not specify a possible source of the buried soil of this age in the
Mad River slough, cautioning that the dynamic sedimentary processes in Mad River slough, including
past altering of the slough channel from dredging, may make the stratigraphic record at that site
particularly more complex and less reliable. Valentine et al. (2012, p. 1,070) speculated that the possible
evidence for subsidence at about 500 years ago in Mad River slough and sites farther to the south in
Humboldt Bay may be recording coseismic land-level change from past rupture on faults in the fold and
thrust belt (see also Section 3.2.5). They noted that the “expected effects” of rupture on the Little Salmon
fault or Mad River fault zone would be “minor amounts of subsidence within the frontal syncline adjacent
to the fault, larger amounts of subsidence in the syncline behind the fault, or uplift. For an earthquake on
the Little Salmon fault, subsidence would be expected in southern Humboldt Bay and the Freshwater
syncline (Mad River slough) but not in the Eel River delta. For an event on the Mad River fault zone,
subsidence would be expected in the Freshwater syncline (Mad River slough) but not in southern
Humboldt Bay or the Eel River delta. Subsidence would be variable from 0.25–1 m in the frontal portion
to 1–3 m in the back basin." However, they express uncertainties as to the possible record of subsidence
from fold and thrust earthquakes, conceding that (p. 1074): ‘There is not sufficient evidence from the data

California North Coast Offshore Wind Studies
Overview of Geological Hazards 86
to evaluate the cause(s) of this RSL7 event [500 years ago] or whether it represents a coseismic
subsidence due to an earthquake or coincidental RSL changes at several sites. If an earthquake caused
the observed RSL changes, then based on the distribution of the changes the earthquake was probably a
local event.”
At southern Humboldt Bay, Witter et al. (2001, p. 44) compiled evidence for coseismic subsidence
accompanying rupture of the Little Salmon fault, and reported that the “data suggest that submergence in
the footwall of the Little Salmon fault occurs during upper-plate earthquakes.” Significantly, based on
the results at their study sites near College of the Redwoods and Hookton Slough, they concluded that
although subsidence accompanied rupture on the LSF, the LSF ruptures were in turn triggered by and
coincident with ruptures in the CSZ megathrust. “Evidence for subsidence of the [LSF] western fault
scarp along with stratigraphic records of abrupt soil submergence suggests that coseismic subsidence of
the Humboldt Bay region also accompanied upper-plate seismicity. We conclude that where evidence for
slip on the Little Salmon fault and regional coseismic subsidence coincide, the evidence supports an
interpretation of upper-plate faulting triggered by rupture on the southern Cascadia plate-interface”
(Witter et al., 2001, p. 41). Therefore, it is possible that for Humboldt Bay and the Eel River valley
coseismic subsidence may have, at times in the past, included forcing from rupture on faults in the
accretionary prism in addition to the deformation associated with rupture of the southern CSZ megathrust.
This is a situation unique to the North Coast where the accretionary wedge of the subduction zone is
located onshore.
9.2 Coseismic Uplift
Coseismic uplift has been documented along the north coast of Humboldt county (Burke & Carver, 1992;
Swan et al., 2002; Woodward-Clyde Consultants, 1980). It is represented as a series of marine terraces
that occur along the hills and coastal exposures of Humboldt Bay (Figure 53) that record the progressive
regional uplift of the accretionary sediments above the megathrust while adjacent synclines are absent of
terraces. Relative dating (soil development and vertical position) and a few absolute dates suggest that
these terraces record at least 200,000 years of uplift along these structures (Figure 53). Evidence of a
longer record of uplift is not apparent in the terraces due to erosion. An older record of uplift is recorded
in separation of the base of Neogene sediments forming the cores of the folds where it is estimated that
more than 3,400 m of separation exists across the Little Salmon and Table Bluff faults (Kelsey & Carver,
1988a; Ogle, 1953; Swan et al., 2002; Vadurro, 2006).
Additionally, to the south of Humboldt Bay and adjacent to the Mendocino triple junction, coseismic
uplift of more than 1 m occurred along the coast between Cape Mendocino and Punta Gorda during the
1992 M7.2 earthquake. It has been interpreted as either rupture of limited length on the CSZ
megathrust (Oppenheimer et al., 1993) or, more likely, as along a blind thrust fault in the accretionary
wedge above the megathrust interface (Crawford, 2019; Hartshorn et al., 2017; Merritts, 1996; Vermeer et
al., 2015; Vermeer & Hemphill-Haley, 2014; Vermeer, 2016).
7 RSL – “relative sea level.”

California North Coast Offshore Wind Studies
Overview of Geological Hazards 87
Figure 53. Marine terrace sequence at Humboldt Bay, California. Note that the terraces record
progressive uplift of anticlinal folds as they grow, presumably coseismically, above thrust faults that
include the Table Bluff fault, Little Salmon fault, and an unnamed structure beneath Eureka. Marine
terrace geomorphology is absent from intervening synclines. (From Swan et al., 2002, his Figure 3-6).
9.3 Interseismic Subsidence at Humboldt Bay
In addition to episodic subsidence at Humboldt Bay from great earthquakes, Patton et al. (2017) have
shown that Humboldt Bay is interseismically subsiding on the order of millimeters per year, resulting in
relative sea level rise at Humboldt Bay that is “2-3 times greater than anywhere else in California”
(Patton et al., 2017, p.3). Patton et al. (2017) report the rates of land subsidence for five locations on
Humboldt Bay: South Humboldt Bay/Hookton Slough (-3.56 mm/yr); Fields Landing (-1.48 mm/yr);
North Spit (-2.33 mm/yr); Samoa (-0.25 mm/yr); and Arcata Bay/Mad River Slough (-1.11 mm/yr). The
implication is that these relatively high rates of interseismic subsidence are recording the effects of a
locked megathrust boundary, with the overriding North America plate being pulled downward as
subduction of the Gorda plate continues beneath it (Hyndman & Wang, 1995; Savage et al., 1991; Wang
et al., 2003; Wang & Tréhu, 2016). Which direction, up or down, of coseismic land level change may
occur when the megathrust ruptures next is uncertain. A suggestion is that the upper plate will rebound,
resulting in coseismic uplift, a model proposed by Plafker (1972) based on studies in Alaska and Chile
following the great earthquakes in 1964 and 1960, respectively. However, pre-seismic subsidence has
been documented for the 1964 and earlier earthquakes in the Upper Cook Inlet region of Alaska (Shennan
California North Coast Offshore Wind Studies
Overview of Geological Hazards 88
& Hamilton, 2006b; Zong et al., 2003), that is, the area was slowly subsiding prior to the 1964 M9.2
earthquake, and with the megathrust rupture, dropped >2 m within minutes. Whether the current
interseismic subsidence at Humboldt Bay is foreshadowing future uplift or subsidence from the next CSZ
earthquake is unknown.
10. RECOMMENDATIONS FOR FUTURE WORK
Strong motion – Earthquake sources in the vicinity of the NCOW facilities are varied and display
different ranges of potential earthquake magnitudes and associated ground motions. Earthquake
hypocentral information (latitude, longitude and depth) for onshore sources is available from resources
such as the USGS (https://earthquake.usgs.gov), UC Berkeley Seismological Laboratory
(https://seismo.berkeley.edu), and Pacific Northwest Seismic Network (https://pnsn.org). Offshore
earthquake hypocentral information is likely incomplete or inaccurate due to the lack of continuous
offshore seismometer coverage. In addition to the shaking hazards, strong ground motion can result in
other, adverse geological hazards such as destabilization of gas hydrates, liquefaction, and submarine
landslides. Thus, at a minimum, the following efforts will need to be considered:
• evaluation of hypocentral information for both offshore and onshore earthquakes to improve
earthquake location and magnitude estimates;
• development of deterministic and/or probabilistic seismic hazard assessments for facilities,
including anchorages, footings, seabed and underground pipeline and transmission structures and
onshore facilities; and
• development of geological and geotechnical designs that utilize seismic hazard parameters for all
NCOW facilities.
Surface Rupture – Faults and folds located within the accretionary prism (both onshore and offshore)
and within the Cascadia subduction zone may be capable of producing surface deformation either in the
form of primary fault rupture or folding with associated fracturing. Surface rupture can affect any NCOW
facilities including anchorages, footings, seabed and underground pipeline and transmission structures
and onshore facilities. We recommend the following efforts in order to assess this potential hazard more
fully:
• compile existing onshore and offshore fault mapping data including public agency documents
(e.g. USGS and CGS); data collected for offshore mineral exploration, including geophysical
investigations; and consultants reports, including fault studies for residential and commercial
facilities.
• identify in detail the locations of offshore structures that may be able to produce surface rupture,
incorporating existing data and acquiring new data for this project using established geophysical
methods; and
• for each potential surface rupture source, create deterministic and probabilistic assessments of
maximum surface deformation or displacement, style of faulting or folding and, in the case of
probabilistic assessment, recurrence information for surface rupture.
Gas Hydrates – Gas hydrates pose a potential hazard, primarily to offshore NCOW facilities. Potential
disturbance of gas hydrates can create seabed instability, expulsion of over-pressurized free gas,
liquefaction, and submarine landslides. This can result in disturbance to offshore anchorages, footings,
California North Coast Offshore Wind Studies
Overview of Geological Hazards 89
seabed and underground pipelines and transmission structures. Gas hydrates have been identified
throughout a large portion of the Humboldt Call Area and along the proposed transmission corridor.
However, no detailed assessment has been developed specific to the proposed NCOW facilities locations.
We recommend the following efforts:
• complete a geological and geophysical and exploratory investigation of the project area in order
to quantify gas hydrate and free gas quantities, including locations and ocean depth occurrences,
hydrate thickness, and burial depths below the sea bed; and
• develop geotechnical-based data and design and remediations, using established industry
guidelines for offshore facilities.
Liquefaction – The potential for liquefaction of sediments exists within the proposed offshore and
onshore portions of the NCOW facilities. Elevated levels of seismicity in the area likely increase the
probability for liquefaction occurrence. Affected portions of the NCOW facilities include anchorages,
footings, seabed and underground pipelines and transmission structures, and onshore structures. We
recommend the following:
• complete a geological and geotechnical assessment of the liquefaction potential for sediments for
both offshore and onshore facilities that include probabilistic assessments; and
• develop design parameters that either account for the occurrence of liquefaction or incorporate
remediation efforts that minimize the liquefaction potential of affected sediments.
Submarine Landslides – Evidence for paleo- and recent submarine landslides has been documented in
areas near and including the Humboldt Call Area and along the corridor to onshore facilities. Submarine
landslides documented in similar settings elsewhere have included some that are many km2 in area.
Mobilization of the seafloor can have substantial impacts to anchorages, footings, seabed and
underground pipelines and transmission structures. Submarine landslides can also generate tsunamis
which may impact all structures, including onshore facilities. We recommend the following:
• an assessment of locations and sizes of submarine landslides along offshore portions of the
NCOW facilities;
• development of geological and geotechnical investigations that estimate landslide potential that
might impact NCOW facilities; and
• development of measures to mitigate or minimize hazards associated with seabed instability.
Tsunamis – Paleo- and historical evidence for tsunami inundation of the NCOW facility area have been
documented. Tsunamis may be generated by sea floor displacement due to earthquakes along the
megathrust and faults within the accretionary prism of the subduction zone, as well as, submarine
landslides. Tsunamis may be generated locally or from distant locations. For the NCOW facilities,
tsunami concerns include on-land inundation, coastal and shallow seafloor erosion, and potential impacts
to infrastructure from strong currents in Humboldt Bay. The major effect of farfield tsunamis would be
strong, possibly erosive currents in the bay. We recommend the following:
• assessment of seafloor, near coastal, and coastal conditions that may be conducive to increased
impacts from tsunamis, including evaluation of bathymetry, coastal geometry and onshore terrain;

California North Coast Offshore Wind Studies
Overview of Geological Hazards 90
• Assessment of available, and, if deemed necessary, newly-acquired onshore paleoseismic
evidence for timing of and inundation extent for tsunamis; and
• Incorporation of geological and geotechnical design considerations to minimize impacts of
tsunami inundation.
Coseismic Land-level Changes – Coseismic (during earthquake) changes in coastal areas, with respect to
sea level, may accompany large magnitude earthquakes, including those possible from rupture of the CSZ
megathrust and large local thrust faults in the accretionary prism in the vicinity of Humboldt Bay. Land-
level changes associated with fault rupture are abrupt and may be up (uplift) or down (subsidence). There
is also evidence that gradual, interseismic (between earthquake) subsidence potentially related to loading
of the Cascadia megathrust or local faults is also occurring. Impacts to the nearshore and onshore NCOW
facilities may include submergence or emergence of pipelines and transmission lines as well as onshore
structures. We recommend the following:
• assessment of the potential amounts of coseismic uplift or subsidence along the onshore portion
of NCOW facilities using current geological evidence, and, if necessary, newly-acquired
information along with incorporation of geophysical models that estimate locations and amounts
of coseismic land-level change; and
• geological and geotechnical investigations and design that consider deterministic and
probabilistic assessments of land-level changes that might occur during operation of NCOW
facilities.

California North Coast Offshore Wind Studies
Overview of Geological Hazards 91
11. REFERENCES
Abramson, H. F. (1998). Evidence for tsunamis and earthquakes during the last 3500 years from Lagoon
Creek, a coastal freshwater marsh, northern California [Masters Thesis]. Humboldt State University.
Adams, J. (1990). Paleoseismicity of the Cascadia Subduction Zone: Evidence from turbidites off the
Oregon-Washington Margin. Tectonics, 9(4), 569–583. https://doi.org/10.1029/TC009i004p00569
Admire, A. R. (2013). Observed and modeled tsunami current velocities on California’s north coast
[Masters Thesis, Humboldt State University]. http://dspace.calstate.edu/handle/2148/1458
Admire, A. R., Dengler, L. A., Crawford, G. B., Uslu, B. U., Borrero, J. C., Greer, S. D., & Wilson, R. I.
(2014). Observed and Modeled Currents from the Tohoku-oki, Japan and other Recent Tsunamis in
Northern California. Pure and Applied Geophysics, 171(12), 3385–3403.
https://doi.org/10.1007/s00024-014-0797-8
Admire, A. R., Dengler, L., Crawford, G., Uslu, B., Montoya, J., & Wilson, R. (2011). Observed and
Modeled Tsunami Currents on California’s North Coast. AGU Fall Meeting Abstracts, 03.
Ambraseys, N., & Sarma, S. (1969). Liquefaction of soils induced by earthquakes. Bulletin of the
Seismological Society of America, 59(2), 651–664.
Atwater, B. F. (1987). Evidence for Great Holocene Earthquakes Along the Outer Coast of Washington
State. Science, 236(4804), 942–944. https://doi.org/10.1126/science.236.4804.942
Atwater, B. F. (2000). Questions about using liquefaction features to estimate strength of shaking in the
1700 Cascasdia earthquake. Proceedings of the Geological Society of America Penrose Conference:
Great Cascadia Earthquake Tricentennial, 23–24.
http://ftp.geogratis.gc.ca/pub/nrcan_rncan/publications/ess_sst/211/211698/of_3938.pdf
Atwater, B. F., Carson, B., Griggs, G. B., Johnson, H. P., & Salmi, M. S. (2014). Rethinking turbidite
paleoseismology along the Cascadia subduction zone. Geology, 42(9), 827–830.
https://doi.org/10.1130/G35902.1
Atwater, B. F., & Griggs, G. B. (2012). Deep-sea turbidites as guides to Holocene earthquake history at
the Cascadia subduction zone—Alternative views for a seismic-hazard workshop (Open-File Report
No. 2012–1043; Open-File Report). U.S. Geological Survey.
https://pubs.er.usgs.gov/publication/ofr20121043
Atwater, B. F., & Hemphill-Haley, E. (1997). Recurrence Intervals for Great Earthquakes of the Past
3500 Years at Northeastern Willapa Bay, Washington. 1576, 108.
Atwater, B. F., Musumi-Rokkaku, S., Satake, K., Tsuji, Y., Ueda, K., & Yamaguchi, D. K. (2005). The
orphan tsunami of 1700—Japanese clues to a parent earthquake in North America (Second Edition).
University of Washington Press and U.S. Geological Survey Professional Paper 1707.
http://pubs.er.usgs.gov/publication/pp1707
Atwater, B. F., Nelson, A. R., Clague, J. J., Carver, G. A., Yamaguchi, D. K., Bobrowsky, P. T.,
Bourgeois, J., Darienzo, M. E., Grant, W. C., & Hemphill-Haley, E. (1995). Summary of coastal
geologic evidence for past great earthquakes at the Cascadia subduction zone. Earthquake Spectra,
11(1), 1–18.

California North Coast Offshore Wind Studies
Overview of Geological Hazards 92
Atwater, B. F., Tuttle, M. P., Schweig, E. S., Rubin, C. M., Yamaguchi, D. K., & Hemphill-Haley, E.
(2003). Earthquake recurrence inferred from paleoseismology. In Developments in Quaternary
Sciences (Vol. 1, pp. 331–350). Elsevier. https://doi.org/10.1016/S1571-0866(03)01015-7
Atwater, T. (1989). Plate tectonic history of the northeast Pacific and western North America. In E. L.
Winterer, D. M. Hussong, & R. W. Decker (Eds.), The Eastern Pacific Ocean and Hawaii (pp. 21–
72). Geological Society of America. https://doi.org/10.1130/DNAG-GNA-N.21
Audemard, F. A., & de Santis, F. (1991). Survey of liquefaction structures induced by recent moderate
earthquakes. Bulletin of the International Association of Engineering Geology, 44(1), 5–16.
https://doi.org/10.1007/BF02602705
Bahuguna, A., Nayak, S., & Roy, D. (2008). Impact of the tsunami and earthquake of 26th December
2004 on the vital coastal ecosystems of the Andaman and Nicobar Islands assessed using
RESOURCESAT AWiFS data. International Journal of Applied Earth Observation and
Geoinformation, 10(2), 229–237. https://doi.org/10.1016/j.jag.2008.02.010
Bakun, W. H. (2000). Seismicity of California’s North Coast. Bulletin of the Seismological Society of
America, 90(4), 797–812. https://doi.org/10.1785/0119990138
Bakun, W. H., & Prescott, W. H. (1993). The Loma Prieta, California, Earthquake of October 17, 1989:
Earthquake occurrence (USGS Professional Paper No. 1550). U.S. Geological Survey.
http://pubs.er.usgs.gov/publication/pp1550
Bardet, J. P., & Kapuskar, M. (1991). The Liquefaction Sand Boils in the San Francisco Marina District
During the 1989 Loma Prieta Earthquake. 9, 6.
https://scholarsmine.mst.edu/icrageesd/02icrageesd/session13/19
Beltz, E. (2006). 1906 Earthquake—Ferndale, California. Field Trips by Ellen Beltz: April 18, 1906
Earthquake - Ferndale, California. http://ebeltz.net/fieldtrips/1906quake-fdale.html
Berkeley Seismological Lab. (2008). When the Ground Gives Way. Berkeley Seismologial Lab, Seismo
Blog. https://seismo.berkeley.edu/blog/2008/09/24/when-the-ground-gives-way.html
Berkeley Seismological Lab. (2020). When Creep becomes Unsteady. Seismo Blog.
https://seismo.berkeley.edu/blog/2018/06/19/when-creep-becomes-unsteady.html
Berkeley Seismological Laboratory. (2020). M6.5 Gorda plate earthquake offshore of Northern
California, 16:27 PST January 9, 2010. Berkeley Seismologial Lab: Information from the CISN
Northern California Management Center, USGS & UC Berkeley.
https://www.cisn.org/special/evt.10.01.10/
Bertalot, D., Brennan, A. j., & Villalobos, F. a. (2013). Influence of bearing pressure on liquefaction-
induced settlement of shallow foundations. Géotechnique, 63(5), 391–399.
https://doi.org/10.1680/geot.11.P.040
Boatwright, J., & Bundock, H. (2005). Modified Mercalli Intensity Maps for the 1906 San Francisco
Earthquake Plotted in ShakeMap Format (Open-File Report No. 2005–1135). U.S. Geological
Survey. https://pubs.usgs.gov/of/2005/1135/
Bohrmann, G., Greinert, J., Suess, E., & Torres, M. (1998). Authigenic carbonates from the Cascadia
subduction zone and their relation to gas hydrate stability. 4.

California North Coast Offshore Wind Studies
Overview of Geological Hazards 93
Bolt, B. A., Lomnitz, C., & McEvilly, T. V. (1968). Seismological evidence on the tectonics of central
and northern California and the Mendocino escarpment. Bulletin of the Seismological Society of
America, 58(6), 1725–1767.
Bonowitz, D., Dengler, L. A., & Lizundia, Bret. (2010). The Mw6.5 offshore northern California
earthquake of January 9, 2010 (p. 12) [EERI Special Earthquake Report]. Earthquake Engineering
Research Institute.
https://eeri.org/site/images/eeri_newsletter/2010_pdf/January_9_OffshoreNorCal.pdf
Booth, J. S., Rowe, M. M., & Fischer, K. M. (1996). Offshore Gas Hydrate Sample Database with an
Overview and Preliminary Analysis (Open-File Report No. 96–272; p. 31). U.S. Geological Survey.
Borrero, J. C., Lynett, P. J., & Kalligeris, N. (2015). Tsunami currents in ports. Philosophical
Transactions of the Royal Society A: Mathematical, Physical and Engineering Sciences, 373(2053),
20140372. https://doi.org/10.1098/rsta.2014.0372
Brooks, J. M., Field, M. E., & Kennicutt, M. C. (1991). Observations of gas hydrates in marine
sediments, offshore northern California. Marine Geology, 96(1–2), 103–109.
https://doi.org/10.1016/0025-3227(91)90204-H
Brothers, D. S., Haeussler, P. J., Liberty, L., Finlayson, D., Geist, E., Labay, K., & Byerly, M. (2016). A
submarine landslide source for the devastating 1964 Chenega tsunami, southern Alaska. Earth and
Planetary Science Letters, 438, 112–121. https://doi.org/10.1016/j.epsl.2016.01.008
Bryant, W. A. (2001). Fault number 18, Mendocino fault zone. Quaternary Fault and Fold Database of the
United States: U.S. Geological Survey Website.
https://earthquake.usgs.gov/cfusion/qfault/show_report_AB_archive.cfm?fault_id=18§ion_id=
Burger, R. L., Fulthorpe, C. S., Austin, J. A., & Gulick, S. P. S. (2002a). Lower Pleistocene to present
structural deformation and sequence stratigraphy of the continental shelf, offshore Eel River Basin,
northern California. Marine Geology, 185(3), 249–281. https://doi.org/10.1016/S0025-
3227(02)00196-2
Burger, R. L., Fulthorpe, C. S., Austin, J. A., & Gulick, S. P. S. (2002b). Lower Pleistocene to present
structural deformation and sequence stratigraphy of the continental shelf, offshore Eel River Basin,
northern California. Marine Geology, 185(3), 249–281. https://doi.org/10.1016/S0025-
3227(02)00196-2
Burke, R. M., & Carver, G. A., (eds). (1992). A look at the southern end of the Cascadia subduction zone
and the Mendocino triple junction: Guidebook for the Pacific Cell Friends of the Pleistocene Field
Trip to Coastal Northern California.
Carver, G. A. (1992). Late Cenozoic Tectonics of Coastal Northern California. In G. A. Carver & K. R.
Aalto (Eds.), Field Guide to the Late Cenozoic Subduction Tectonics & Sedimentation of North
Coastal California (pp. 1–9). Pacific Section of AAPG.
http://archives.datapages.com/data/pacific/data/087/087001/1_ps0870001.htm
Carver, G. A., Abramson, H. A., Garrison-Laney, C. E., & Leroy, T. (1998a). Investigation of
paleotsunami evidence along the north coast of California. Unpublished Report Prepared for Pacific
Gas and Electric Co, San Francisco, CA, 167, 238.

California North Coast Offshore Wind Studies
Overview of Geological Hazards 94
Carver, G. A., Abramson, H. A., Garrison-Laney, C. E., & Leroy, T. H. (1998b). Investigation of
paleotsunami evidence along the north coast of California (p. 238). prepared for Pacific Gas and
Electric Company.
Carver, G. A., & Burke, R. M. (1988). Trenching investigations of northwestern California faults,
Humboldt Bay Region, Final Report (USGS NEHRP Final Report No. 14-08-0001-G1082; p. 51). US
Geological Survey National Earthquake Hazards Reduction Program.
Carver, G. A., & Plafker, G. (2008). Paleoseismicity and neotectonics of the Aleutian Subduction Zone—
An overview. In Active Tectonics and Seismic Potential of Alaska (Vol. 179, pp. 43–63). American
Geophysical Union Geophysical Monograph Series.
http://adsabs.harvard.edu/abs/2008GMS...179...43C
CGS. (2020). California Official Tsunami Inundation Maps. California Department of Conservation.
https://www.conservation.ca.gov/cgs/tsunami/maps
Chaney, R. C. (1991). Fault Processes and Liquefaction in the Marine Environment. Proceedings: Second
International Conferences on Recent Advances in Geotechnical Earthquake Engineering and Soil
Dynamics, 2139–2141.
https://scholarsmine.mst.edu/cgi/viewcontent.cgi?article=3625&context=icrageesd
Chaney, R. C., & Almagor, G. (2015). Seafloor Processes and Geotechnology. CRC Press.
Chaney, R. C., & Demars, K. R. (1985). Strength Testing of Marine Sediments: Laboratory and In-situ
Measurements : a Symposium Sponsored by ASTM Committee D-18 on Soil and Rock, San Diego,
CA, 26-27 Jan. 1984. ASTM International.
Chaney, R. C., & Fang, H. Y. (Eds.). (1986). Marine Geotechnology and Nearshore/offshore Structures:
A Symposium. ASTM International.
Chaney, R. C., & Fang, H. Y. (1991). Liquefaction in the coastal environment: An analysis of case
histories. Marine Geotechnology, 10(3–4), 343–370. https://doi.org/10.1080/10641199109379899
Chapman, R., Pohlman, J., Coffin, R., Chanton, J., & Lapham, L. (2004). Thermogenic gas hydrates in
the northern Cascadia margin. Eos, Transactions American Geophysical Union, 85(38), 361.
https://doi.org/10.1029/2004EO380001
Chaytor, J. D., Goldfinger, C., Dziak, R. P., & Fox, C. G. (2004). Active deformation of the Gorda plate:
Constraining deformation models with new geophysical data. Geology, 32(4), 353.
https://doi.org/10.1130/G20178.2
Choi, B. H., Hong, S. J., & Pelinovsky, E. (2006). Distribution of runup heights of the December 26,
2004 tsunami in the Indian Ocean. Geophysical Research Letters, 33(13).
https://doi.org/10.1029/2006GL025867
Chung, J.-W., & Rogers, J. D. (2013). Influence of Assumed Groundwater Depth on Mapping
Liquefaction Potential. Environmental and Engineering Geoscience, 19(4), 377–389.
https://doi.org/10.2113/gseegeosci.19.4.377
Cifuentes, I. L. (1989). The 1960 Chilean earthquakes. Journal of Geophysical Research: Solid Earth,
94(B1), 665–680. https://doi.org/10.1029/JB094iB01p00665

California North Coast Offshore Wind Studies
Overview of Geological Hazards 95
Clague, J. J., Naesgaard, E., & Nelson, A. R. (1997). Age and significance of earthquake-induced
liquefaction near Vancouver, British Columbia, Canada. Canadian Geotechnical Journal, 34(1), 53–
62. https://doi.org/10.1139/t96-081
Clarke, S. H. (1990). Map showing geologic structures of the northern California continental margin
[Map]. U.S. Geological Survey Miscellaneous Field Studies Map MF-2130.
https://ngmdb.usgs.gov/Prodesc/proddesc_5733.htm
Clarke, Samuel H. (1990). Map showing geologic structures of the northern California continental margin
[Map]. U.S. Geological Survey Miscellaneous Field Studies Map MF-2130.
https://ngmdb.usgs.gov/Prodesc/proddesc_5733.htm
Clarke, S.H., & Carver, G. A. (1992a). Late Holocene Tectonics and Paleoseismicity, Southern Cascadia
Subduction Zone. Science, 255(5041), 188–192. https://doi.org/10.1126/science.255.5041.188
Clarke, S.H., & Carver, G. A. (1992b). Late Holocene Tectonics and Paleoseismicity, Southern Cascadia
Subduction Zone. Science, 255(5041), 188–192. https://doi.org/10.1126/science.255.5041.188
Clarke, S.H., Jr., & Field, M. E. (1989). Geologic map of the northern California Continental Margin.
California Continental Margin Geologic Map Series: Sacramento, California Division of Mines and
Geology, Scale, 1(250,000).
Coffman, J., & Von Hake, C. (1973). Earthquake History of the United States (revised edition through
1970) (U.S. Environmental Data Service No. 41–1; p. 208). US National and Atmospheric
Administration.
Committee on Earthquake Engineering. (1985). Liquefaction of Soils During Earthquakes. National
Academy of Sciences.
https://books.google.com/books?hl=en&lr=&id=oD4rAAAAYAAJ&oi=fnd&pg=PA1&dq=liquefacti
on+1964+earthquake&ots=aK_qeLRC7c&sig=PWLRHgUqHGb68Hw6J6DrC3_iIWc#v=onepage&
q&f=false
Coulter, H. W., & Migliaccio, R. R. (1966). Effects of the earthquake of March 27, 1964, at Valdez,
Alaska. U.S. Geological Survey Professional Paper 1515.
Crawford, B. (2019, May 16). Holocene marine terrace formation near the Mendocino triple junction:
Paleoseismic history derived from high resolution lidar. Geological Society of America, Cordilleran
Section - 115th Annual Meeting - 2019.
https://gsa.confex.com/gsa/2019CD/webprogram/Paper329671.html
Cubrinovski, M., Bray, J. D., Taylor, M., Giorgini, S., Bradley, B., Wotherspoon, L., & Zupan, J. (2011).
Soil Liquefaction Effects in the Central Business District during the February 2011 Christchurch
Earthquake. Seismological Research Letters, 82(6), 893–904. https://doi.org/10.1785/gssrl.82.6.893
Dalrymple, R. W. (1979). Wave-induced liquefaction: A modern example from the Bay of Fundy.
Sedimentology, 26(6), 835–844. https://doi.org/10.1111/j.1365-3091.1979.tb00976.x
Davis, C. A., Giovinazzi, S., & Hart, D. E. (2015). Liquefaction Induced Flooding in Christchurch, New
Zealand. Sixth International Conference on Earthquake Geotechnical Engineering, 9.
de Groot, M. B., Bolton, M. D., Foray, P., Meijers, P., Palmer, A. C., Sandven, R., Sawicki, A., & Teh, T.
C. (2006). Physics of Liquefaction Phenomena around Marine Structures. Journal of Waterway, Port,

California North Coast Offshore Wind Studies
Overview of Geological Hazards 96
Coastal, and Ocean Engineering, 132(4), 227–243. https://doi.org/10.1061/(ASCE)0733-
950X(2006)132:4(227)
Dengler, L.A. (2008). The 1906 Earthquake on California’s North Coast. Bulletin of the Seismological
Society of America, 98(2), 918–930. https://doi.org/10.1785/0120060406
Dengler, L.A., & Magoon, O. (2005). The 1964 Tsunami in Crescent City, California: A 40-Year
Retrospective. Solutions to Coastal Disasters 2005, 639–648. https://doi.org/10.1061/40774(176)64
Dengler, L.A., Moley, K., McPherson, R., Pasyanos, M., Dewey, J. W., & Murray, M. (1995). The
September 1, 1994 Mendocino fault earthquake. California Geology, 48(2), 43–53.
Dengler, L.A., Nicolini, T., Larkin, D., & Ozaki, V. (2008). Building Tsunami-Resilient Communities in
Humboldt County, California. Solutions to Coastal Disasters 2008, 178–191.
https://doi.org/10.1061/40978(313)17
Dengler, Lori A., & Uslu, B. (2011). Effects of Harbor Modification on Crescent City, California’s
Tsunami Vulnerability. Pure and Applied Geophysics, 168(6), 1175–1185.
https://doi.org/10.1007/s00024-010-0224-8
Dengler, Lori A., Uslu, B., Barberopoulou, A., Borrero, J., & Synolakis, C. (2008). The Vulnerability of
Crescent City, California, to Tsunamis Generated by Earthquakes in the Kuril Islands Region of the
Northwestern Pacific. Seismological Research Letters, 79(5), 608–619.
https://doi.org/10.1785/gssrl.79.5.608
Didenkulova, I., Nikolkina, I., Pelinovsky, E., & Zahibo, N. (2010). Tsunami waves generated by
submarine landslides of variable volume: Analytical solutions for a basin of variable depth. Natural
Hazards and Earth System Science, 10(11), 2407–2419. https://doi.org/10.5194/nhess-10-2407-2010
Duke, C. M., & Leeds, D. J. (1963). Response of soils, foundations, and earth structures to the Chilean
earthquakes of 1960. Bulletin of the Seismological Society of America, 53(2), 309–357.
Dziak, R. P., Fox, C. G., Bobbitt, A. M., & Goldfinger, C. (2001). Bathymetric Map of the Gorda Plate:
Structural and Geomorphological Processes Inferred from Multibeam Surveys. Marine Geophysical
Researches, 22(4), 235–250. https://doi.org/10.1023/A:1014606407111
Earthquake Engineering Research Institute. (1989). Loma Prieta, California, Earthquake of October 15,
1989: Reconnaissance Report. Earthquake Spectra, 6(S1), 1–448.
Earthweb. (2020). 1964 Prince William Sound Tsunami. Earthweb - University of Washington Earth and
Space Sciences. https://earthweb.ess.washington.edu/tsunami/general/historic/alaska64.html
Elgamal, A., Dobry, R., & Adalier, K. (1989). Small scale shaking table tests of saturated layered sand-
silt deposits. 32, 233–245.
Ellsworth, W. L., Lindh, A. G., Prescott, W. H., & Herd, D. G. (2013). The 1906 San Francisco
Earthquake and the Seismic Cycle. In Earthquake Prediction (pp. 126–140). American Geophysical
Union (AGU). https://doi.org/10.1029/ME004p0126
Engelhart, S. E., Hemphill-Haley, E., Kelsey, H. M., & Padgett, J. S. (2016). Refined Estimates of
Coseismic Subsidence along the Southern Cascadia Subduction Zone in Northern Humboldt Bay
(Arcata Bay): Collaborative Research with University of Rhode Island and Humboldt State
California North Coast Offshore Wind Studies
Overview of Geological Hazards 97
University (NERHP Final Technical Report G14AP00128, G14AP00129; p. 38). U.S. Geological
Survey.
Feldens, P., Schwarzer, K., Szczuciński, W., Stattegger, K., Sakuna, D., & Somgpongchaiykul, P. (2009).
Impact of 2004 Tsunami on Seafloor Morphology and Offshore Sediments, Pakarang Cape, Thailand.
Polish Journal of Environmental Studies, 18(1), 63–68.
Fiegel, G. L., & Kutter, B. L. (1994). Liquefaction Mechanism for Layered Soils. Journal of Geotechnical
Engineering, 120(4), 737–755. https://doi.org/10.1061/(ASCE)0733-9410(1994)120:4(737)
Field, E. H., Arrowsmith, R. J., Biasi, G. P., Bird, P., Dawson, T. E., Felzer, K. R., Jackson, D. D.,
Johnson, K. M., Jordan, T. H., Madden, C., Michael, A. J., Milner, K. R., Page, M. T., Parsons, T.,
Powers, P. M., Shaw, B. E., Thatcher, W. R., Weldon, R. J., & Zeng, Y. (2014). Uniform California
Earthquake Rupture Forecast, Version 3 (UCERF3)—The Time‐Independent Model. Bulletin of the
Seismological Society of America, 104(3), 1122–1180. https://doi.org/10.1785/0120130164
Field, M. E. (1984). The submarine landslide of 1980 off Northern California. In S. E. Clarke (Ed.),
Highlights in Marine Research: U.S. Geological Survey Circular 938 (pp. 65–72). U.S. Geological
Survey.
Field, M. E. (1993). Liquefaction of Continental Shelf Sediment: The Northern California Earthquake of
1980. In W. C. Schwab, H. J. Lee, & D. C. Twichell (Eds.), Submarine landslides; selected studies in
the U.S. Exclusive Economic Zone (pp. 143–150). U.S. Geological Survey Bulletin 2002.
Field, M. E., & Barber, J. H., Jr. (1993). A submarine landslide associated with shallow sea-floor gas and
gas hydrates off Northern California. In W. C. Schwab, H. J. Lee, & D. C. Twichell (Eds.),
Submarine landslides; selected studies in the U.S. Exclusive Economic Zone (pp. 151–157). U.S.
Geological Survey Bulletin 2002.
Field, M. E., & Clarke, S. E. (1984). The submarine landslide of 1980 off Northern California. In
Highlights in marine research of the U.S. Geological Survey (pp. 65–72). U.S. Geological Survey.
https://books.google.com/books?hl=en&lr=&id=-
4vKMaCm2RUC&oi=fnd&pg=PA65&dq=1980+earthquake+northern+california&ots=WjZL7nVcE
2&sig=gL5OnBt4YucknxGRg7cdjjhokcU#v=onepage&q=1980%20earthquake%20northern%20calif
ornia&f=false
Field, M. E., Clarke, S. E., & White, M. E. (1980). Geology and Geologic Hazards of Offshore Eel River
Basin, Northern California Continental Margin (Open-file Report 80-1080; p. 69). U.S. Geological
Survey.
Field, M. E., Gardner, J. V., Jennings, A. E., & Edwards, B. D. (1981). Seafloor failures caused by the
November 8, 1980 earthquake off northern California (Open-File Report No. 81–393). U.S.
Geological Survey.
Field, M. E., Gardner, J. V., Jennings, A. E., & Edwards, B. D. (1982). Earthquake-induced sediment
failures on a 0.25° slope, Klamath River delta, California. Geology, 10, 542–546.
Field, M. E., & Hall, R. K. (1982). Sonographs of submarine sediment failure caused by the 1980
earthquake off northern California. Geo-Marine Letters, 2(3–4), 135–141.
https://doi.org/10.1007/BF02462754

California North Coast Offshore Wind Studies
Overview of Geological Hazards 98
Field, M. E., & Jennings, A. E. (1987a). Seafloor gas seeps triggered by a northern California earthquake.
Marine Geology, 77(1), 39–51. https://doi.org/10.1016/0025-3227(87)90082-X
Field, M. E., & Jennings, A. E. (1987b). Seafloor gas seeps triggered by a northern California earthquake.
Marine Geology, 77(1), 39–51. https://doi.org/10.1016/0025-3227(87)90082-X
Field, M. E., Jennings, A. F., Gardner, J. V., Chase, T. E., Miller, C. P., & Young, J. D. (1982). High
resolution seismic reflection profiles collected from offshore northern California after November 8,
1980, earthquake. In High resolution seismic reflection profiles collected from offshore northern
California after November 8, 1980, earthquake (USGS Numbered Series No. 81–394; Open-File
Report, Vols. 81–394). https://doi.org/10.3133/ofr81394
Field, M. E., & Kvenvolden, K. A. (1985). Gas hydrates on the northern California continental margin.
Geology, 13(7), 517–520. https://doi.org/10.1130/0091-7613(1985)13<517:GHOTNC>2.0.CO;2
Fox, C. G., & Dziak, R. P. (1999). Internal deformation of the Gorda Plate observed by hydroacoustic
monitoring. Journal of Geophysical Research: Solid Earth, 104(B8), 17603–17615.
Fraser, S., Raby, A., Pomonis, A., Goda, K., Chian, S. C., Macabuag, J., Offord, M., Saito, K., &
Sammonds, P. (2013). Tsunami damage to coastal defences and buildings in the March 11th 2011
Mw9.0 Great East Japan earthquake and tsunami. Bulletin of Earthquake Engineering, 11(1), 205–
239. https://doi.org/10.1007/s10518-012-9348-9
Freymueller, J. T., Haeussler, P. J., Wesson, R. L., & Ekström, G. (2013). Active Tectonics and Seismic
Potential of Alaska. John Wiley & Sons.
Freymueller, J. T., Murray, M. H., Segall, P., & Castillo, D. (1999). Kinematics of the Pacific-North
America Plate Boundary Zone, northern California. Journal of Geophysical Research: Solid Earth,
104(B4), 7419–7441. https://doi.org/10.1029/1998JB900118
Fritz, H. M., Petroff, C. M., Catalán, P. A., Cienfuegos, R., Winckler, P., Kalligeris, N., Weiss, R.,
Barrientos, S. E., Meneses, G., Valderas-Bermejo, C., Ebeling, C., Papadopoulos, A., Contreras, M.,
Almar, R., Dominguez, J. C., & Synolakis, C. E. (2011a). Field Survey of the 27 February 2010 Chile
Tsunami. Pure and Applied Geophysics, 168(11), 1989–2010. https://doi.org/10.1007/s00024-011-
0283-5
Fritz, H. M., Petroff, C. M., Catalán, P. A., Cienfuegos, R., Winckler, P., Kalligeris, N., Weiss, R.,
Barrientos, S. E., Meneses, G., Valderas-Bermejo, C., Ebeling, C., Papadopoulos, A., Contreras, M.,
Almar, R., Dominguez, J. C., & Synolakis, C. E. (2011b). Field Survey of the 27 February 2010 Chile
Tsunami. Pure and Applied Geophysics, 168(11), 1989–2010. https://doi.org/10.1007/s00024-011-
0283-5
Fujii, Y., & Satake, K. (2013). Slip Distribution and Seismic Moment of the 2010 and 1960 Chilean
Earthquakes Inferred from Tsunami Waveforms and Coastal Geodetic Data. Pure and Applied
Geophysics, 170(9), 1493–1509. https://doi.org/10.1007/s00024-012-0524-2
Furlong, K. P., & Schwartz, S. Y. (2004). Influence of the Mendocino Triple Junction on the Tectonics of
Coastal California. Annual Review of Earth and Planetary Sciences, 32(1), 403–433.
https://doi.org/10.1146/annurev.earth.32.101802.120252

California North Coast Offshore Wind Studies
Overview of Geological Hazards 99
Gardner, J. V., Prior, D. B., & Field, M. E. (1999). Humboldt Slide—A large shear-dominated
retrogressive slope failure. Marine Geology, 154(1), 323–338. https://doi.org/10.1016/S0025-
3227(98)00121-2
Garrett, E., Shennan, I., Woodroffe, S. A., Cisternas, M., Hocking, E. P., & Gulliver, P. (2015).
Reconstructing paleoseismic deformation, 2: 1000 years of great earthquakes at Chucalén, south
central Chile. Quaternary Science Reviews, 113, 112–122.
https://doi.org/10.1016/j.quascirev.2014.10.010
Garrison-Laney, C. E. (1998). Diatom evidence for tsunami inundation from Lagoon Creek, a coastal
freshwater pond, Del Norte County, California [Masters Thesis, Humboldt State University].
http://dspace.calstate.edu/handle/10211.3/140561
Goff, J. A., Mayer, L. A., Hughes-Clarke, J., & Pratson, L. F. (1996). Swath Mapping on the Continental
Shelf and Slope: The Eel River Basin, Northern California. Oceanography, 9(3), 178–182. JSTOR.
Goldfinger, C., Morey, A. E., Black, B., Beeson, J., Nelson, C. H., & Patton, J. (2013). Spatially limited
mud turbidites on the Cascadia margin: Segmented earthquake ruptures? Natural Hazards and Earth
System Sciences, 13(8), 2109–2146. https://doi.org/10.5194/nhess-13-2109-2013
Goldfinger, C., Nelson, C. H., & Johnson, J. E. and. (2003). Holocene earthquake records from the
Cascadia subduction zone and northern San Andreas fault based on precise dating of offshore
turbidites. Annual Review of Earth and Planetary Sciences, 31(1), 555–577.
https://doi.org/10.1146/annurev.earth.31.100901.141246
Goldfinger, C., Nelson, C. H., Morey, A. E., Johnson, J. E., Patton, J. R., Karabanov, E., Gutiérrez-Pastor,
J., Eriksson, A. T., Gràcia, E., Dunhill, G., Enkin, R. J., Dallimore, A., & Vallier, T. (2012). Turbidite
event history—Methods and implications for Holocene paleoseismicity of the Cascadia subduction
zone (Professional Paper No. 1661-F; p. 170). U.S. Geological Survey Professional Paper.
González, F. I., Bernard, E. N., & Satake, K. (1995). The Cape Mendocino Tsunami, 25 April 1992. In Y.
Tsuchiya & N. Shuto (Eds.), Tsunami: Progress in Prediction, Disaster Prevention and Warning (pp.
151–158). Springer Netherlands. https://doi.org/10.1007/978-94-015-8565-1_10
Graehl, N. A., Kelsey, H. M., Witter, R. C., Hemphill-Haley, E., & Engelhart, S. E. (2015). Stratigraphic
and microfossil evidence for a 4500-year history of Cascadia subduction zone earthquakes and
tsunamis at Yaquina River estuary, Oregon, USA. Geological Society of America Bulletin, 127(1–2),
211–226.
Green, R. K., & Sawyer, T. L. (1993). Geotechnical Aspects of the Petrolia Earthquake. 5.
Griffin, W. (1984). Crescent City’s dark disaster: Tsunami, March 28, 1964. Crescent City Historical
Society.
Gulick, S. P. . S., & Meltzer, A. S. (2002). Effect of the northward-migrating Mendocino triple junction
on the Eel River forearc basin, California: Structural evolution. Geological Society of America
Bulletin, 15.
Gulick, S. P. S., Meltzer, A. M., & Clarke, S. H. (1998). Seismic structure of the southern Cascadia
subduction zone and accretionary prism north of the Mendocino triple junction. Journal of
Geophysical Research: Solid Earth, 103(B11), 27207–27222. https://doi.org/10.1029/98JB02526

California North Coast Offshore Wind Studies
Overview of Geological Hazards 100
Gulick, S. P. S., Meltzer, A. S., Henstock, T. J., & Levander, A. (2001). Internal deformation of the
southern Gorda plate: Fragmentation of a weak plate near the Mendocino triple junction. 4.
Haeussler, P. J., Lee, H. J., Ryan, H. F., Labay, K., Kayen, R. E., Hampton, M. A., & Suleimani, E.
(2007). Submarine Slope Failures Near Seward, Alaska, During The M9.2 1964 Earthquake. In V.
Lykousis, D. Sakellariou, & J. Locat (Eds.), Submarine Mass Movements and Their Consequences: 3
International Symposium (pp. 269–278). Springer Netherlands. https://doi.org/10.1007/978-1-4020-
6512-5_28
Haeussler, Peter J., Parsons, T., Finlayson, D. P., Hart, P., Chaytor, J. D., Ryan, H., Lee, H., Labay, K.,
Peterson, A., & Liberty, L. (2014). New Imaging of Submarine Landslides from the 1964 Earthquake
Near Whittier, Alaska, and a Comparison to Failures in Other Alaskan Fjords. In S. Krastel, J.-H.
Behrmann, D. Völker, M. Stipp, C. Berndt, R. Urgeles, J. Chaytor, K. Huhn, M. Strasser, & C. B.
Harbitz (Eds.), Submarine Mass Movements and Their Consequences: 6th International Symposium
(pp. 361–370). Springer International Publishing. https://doi.org/10.1007/978-3-319-00972-8_32
Hamilton, S., & Shennan, I. (2005). Late Holocene great earthquakes and relative sea-level change at
Kenai, southern Alaska. Journal of Quaternary Science, 20(2), 95–111.
https://doi.org/10.1002/jqs.903
Hartshorn, E. J., Hemphill-Haley, M., Michalak, M., & Crawford, B. (2017). Marine terrace formation
associated with northern migration of the Mendocino triple junction at Cape Mendocino, California.
304676. https://doi.org/10.1130/abs/2017AM-304676
Hautala, S. L., Solomon, E. A., Johnson, H. P., Harris, R. N., & Miller, U. K. (2014). Dissociation of
Cascadia margin gas hydrates in response to contemporary ocean warming. Geophysical Research
Letters, 41(23), 8486–8494. https://doi.org/10.1002/2014GL061606
Hawkes, A. D., Horton, B. P., Nelson, A. R., Vane, C. H., & Sawai, Y. (2011). Coastal subsidence in
Oregon, USA, during the giant Cascadia earthquake of AD 1700. Quaternary Science Reviews, 30(3–
4), 364–376. https://doi.org/10.1016/j.quascirev.2010.11.017
Hazarika, H., Kasama, K., Suetsugu, D., Kataoka, S., & Yasufuku, N. (2013). Damage to Geotechnical
Structures in Waterfront Areas of Northern Tohoku Due to the March 11, 2011 Tsunami Disaster.
Indian Geotechnical Journal, 43(2), 137–152. https://doi.org/10.1007/s40098-012-0021-7
Heaton, T. H., & Hartzell, S. H. (1986). Source characteristics of hypothetical subduction earthquakes in
the northwestern United States. Bulletin of the Seismological Society of America, 76(3), 675–708.
Heaton, T. H., & Hartzell, S. H. (1987). Earthquake Hazards on the Cascadia Subduction Zone. Science,
236(4798), 162–168.
Heaton, T. H., & Kanamori, H. (1984). Seismic potential associated with subduction in the northwestern
United States. Bulletin of the Seismological Society of America, 74(3), 933–941.
Hemphill-Haley, E. (2017). Observations on the distributions of modern benthic diatoms to improve
estimates of past coseismic land-level changes, Humboldt Bay, California. Seismological Research
Letters, 8(2B). https://www.seismosoc.org/wp-content/uploads/2018/09/srl-2017035.1.pdf
Hemphill-Haley, E., Kelsey, H. M., Graehl, N., Casso, M., Caldwell, Loofbourrow, C., Robinson, M.,
Vermeer, J., & Southwick, E. (2019). Recent sandy deposits at five northern California coastal

California North Coast Offshore Wind Studies
Overview of Geological Hazards 101
wetlands—Stratigraphy, diatoms, and implications for storm and tsunami hazards (USGS Numbered
Series No. 2018–5111; Scientific Investigations Report, p. 187). U.S. Geological Survey.
http://pubs.er.usgs.gov/publication/sir20185111
Hemphill-Haley, M. A., & Witter, R. C. (n.d.). Latest Pleistocene paleoseismology of the southern Little
Salmon fault, Strong’s Creek, Fortuna, California (NEHRP Final Technical Report No. 04HQGR004;
p. 19). U.S. Geological Survey, National Earthquake Hazards Reduction Program (NEHRP).
Hill, J. C., Watt, J. T., Brothers, D. S., & Kluesner, J. W. (2020). Submarine canyons, slope failures and
mass transport processes in southern Cascadia. Geological Society, London, Special Publications,
SP500-2019–2169. https://doi.org/10.1144/SP500-2019-169
Holzer, T. L. (1992). The Loma Prieta, California, Earthquake of October 17, 1989: Strong ground
motion and ground failure (USGS Professional Paper No. 1551). U.S. Geological Survey.
http://pubs.er.usgs.gov/publication/pp1551
Holzer, T. L. (Ed.). (1998). The Loma Prieta, California, Earthquake of October 17, 1989-Liquefaction.
U.S. Geological Survey.
Holzer, T. L., Noce, T. E., & Bennett, M. J. (2011). Liquefaction Probability Curves for Surficial
Geologic Deposits. Environmental and Engineering Geoscience, 17(1), 1–21.
https://doi.org/10.2113/gseegeosci.17.1.1
Huang, Y., & Yu, M. (2013). Review of soil liquefaction characteristics during major earthquakes of the
twenty-first century. Natural Hazards, 65(3), 2375–2384. https://doi.org/10.1007/s11069-012-0433-9
Humboldt County. (2017). Humboldt County General Plan Environmental Impact Report, SCH#
2007012089, Section 3.8 Geology and Soils. Humboldt 21st Century General Plan.
https://humboldtgov.org/DocumentCenter/View/58837/Section-38-Geology-and-Soils-Revised-
DEIR-PDF
Hyndman, R. D., & Wang, K. (1995). The rupture zone of Cascadia great earthquakes from current
deformation and the thermal regime. Journal of Geophysical Research: Solid Earth, 100(B11),
22133–22154. https://doi.org/10.1029/95JB01970
ICRAGEESD. (2001). Fourth International Conference on Recent Advances in Geotechnical Earthquake
Engineering and Soil Dynamics. International Conferences on Recent Advances in Geotechnical
Earthquake Engineering and Soil Dynamics. https://scholarsmine.mst.edu/icrageesd/04icrageesd/
ICRAGEESD. (2010). Fifth International Conference on Recent Advances in Geotechnical Earthquake
Engineering and Soil Dynamics. International Conferences on Recent Advances in Geotechnical
Earthquake Engineering and Soil Dynamics. https://scholarsmine.mst.edu/icrageesd/05icrageesd/
ICRAGEESD. (2016). 2016—Sixth International Conference on Recent Advances in Geotechnical
Earthquake Engineering and Soil Dynamics. International Conferences on Recent Advances in
Geotechnical Earthquake Engineering and Soil Dynamics.
https://scholarsmine.mst.edu/icrageesd/06icrageesd/
Idriss, I. M., & Boulanger, R. W. (2008). Soil Liquefaction During Earthquakes (2nd edition). Earthquake
Engineering Research Institute.

California North Coast Offshore Wind Studies
Overview of Geological Hazards 102
Ikehara, K., Irino, T., Usami, K., Jenkins, R., Omura, A., & Ashi, J. (2014). Possible submarine tsunami
deposits on the outer shelf of Sendai Bay, Japan resulting from the 2011 earthquake and tsunami off
the Pacific coast of Tohoku. Marine Geology, 358, 120–127.
https://doi.org/10.1016/j.margeo.2014.11.004
Imakiire, T., & Koarai, M. (2012a). Wide-area land subsidence caused by “the 2011 Off the Pacific Coast
of Tohoku Earthquake.” Soils and Foundations, 52(5), 842–855.
https://doi.org/10.1016/j.sandf.2012.11.007
Imakiire, T., & Koarai, M. (2012b). Wide-area land subsidence caused by “the 2011 Off the Pacific Coast
of Tohoku Earthquake.” Soils and Foundations, 52(5), 842–855.
https://doi.org/10.1016/j.sandf.2012.11.007
Imbsen, R. A. (1981). Highway structure damage caused by the Trinidad-offshore, California earthquake
of November 8, l980 (FHWA/RD-82/017; p. 35). EERI (Earthquake Engineering Research Institute).
https://trid.trb.org/view/177197
Ishihara, K. (1993). Liquefaction and flow failure during earthquakes. Géotechnique, 43(3), 351–451.
https://doi.org/10.1680/geot.1993.43.3.351
Ishihara, Kenji, Araki, K., & Toshiyuki, K. (2014). Liquefaction in Tokyo Bay and Kanto Regions in the
2011 Great East Japan Earthquake. In M. Maugeri & C. Soccodato (Eds.), Earthquake Geotechnical
Engineering Design (pp. 93–140). Springer International Publishing. https://doi.org/10.1007/978-3-
319-03182-8_4
Jacoby, G. C., Bunker, D. E., & Benson, B. E. (1997). Tree-ring evidence for an A.D. 1700 Cascadia
earthquake in Washington and northern Oregon. Geology, 25(11), 999–1002.
https://doi.org/10.1130/0091-7613(1997)025<0999:TREFAA>2.3.CO;2
Jacoby, G. C., Carver, G. A., & Wagner, W. (1995). Trees and herbs killed by an earthquake ∼300 yr ago
at Humboldt Bay, California. Geology, 23(1), 77–80. https://doi.org/10.1130/0091-
7613(1995)023<0077:TAHKBA>2.3.CO;2
Jennings, C. W., & Saucedo, G. J. (1994). Fault activity map of California and adjacent areas, with
locations and ages of recent volcanic eruptions. California Department of Conservation, Division of
Mines and Geology.
Kastens, K. A., & Cita, M. B. (1981). Tsunami-induced sediment transport in the abyssal Mediterranean
Sea. GSA Bulletin, 92(11), 845–857. https://doi.org/10.1130/0016-
7606(1981)92<845:TSTITA>2.0.CO;2
Kastner, M. (2001). Gas hydrates in convergent margins: Formation, occurrence, geochemistry, and
global significance. Washington DC American Geophysical Union Geophysical Monograph Series,
124, 67–86. https://doi.org/10.1029/GM124p0067
Keefer, D. K. (1984). Landslides caused by earthquakes. Geological Society of America Bulletin, 95(4),
406–421. https://doi.org/10.1130/0016-7606(1984)95&lt;406:LCBE&gt;2.0.CO;2
Kelsey, H. M., & Carver, G. A. (1988a). Late Neogene and Quaternary tectonics associated with
northward growth of the San Andreas Transform Fault, northern California. Journal of Geophysical
Research: Solid Earth, 93(B5), 4797–4819. https://doi.org/10.1029/JB093iB05p04797

California North Coast Offshore Wind Studies
Overview of Geological Hazards 103
Kelsey, H. M., & Carver, G. A. (1988b). Late Neogene and Quaternary tectonics associated with
northward growth of the San Andreas Transform Fault, northern California. Journal of Geophysical
Research: Solid Earth, 93(B5), 4797–4819. https://doi.org/10.1029/JB093iB05p04797
Kelsey, H. M., Nelson, A. R., Hemphill-Haley, E., & Witter, R. C. (2005a). Tsunami history of an
Oregon coastal lake reveals a 4600 yr record of great earthquakes on the Cascadia subduction zone.
Geological Society of America Bulletin, 117(7–8), 1009–1032.
Kelsey, H. M., Nelson, A. R., Hemphill-Haley, E., & Witter, R. C. (2005b). Tsunami history of an
Oregon coastal lake reveals a 4600 yr record of great earthquakes on the Cascadia subduction zone.
Geological Society of America Bulletin, 117(7), 1009. https://doi.org/10.1130/B25452.1
Kelsey, H. M., Witter, R. C., & Hemphill-Haley, E. (2002a). Plate-boundary earthquakes and tsunamis of
the past 5500 yr, Sixes River estuary, southern Oregon. Geological Society of America Bulletin, 17.
Kelsey, H. M., Witter, R. C., & Hemphill-Haley, E. (2002b). Plate-boundary earthquakes and tsunamis of
the past 5500 yr, Sixes River estuary, southern Oregon. Geological Society of America Bulletin, 17.
Kelson, K. I., Streig, A. R., Koehler, R. D., & Kang, K.-H. (2006). Timing of Late Holocene
paleoearthquakes on the northern San Andreas fault at the Fort Ross Orchard site, Sonoma County,
California. Bulletin of the Seismological Society of America, 96(3), 1012–1028.
https://doi.org/10.1785/0120050123
Kilbourne, R. T., & Saucedo, G. J. (1981). Gorda basin earthquake, northwestern California. California
Geology, 34(3), 53–57.
Kowalik, Z., Horillo, J., Knight, W., & Logan, T. (2008). Kuril Islands tsunami of November 2006: 1.
Impact at Crescent City by distant scattering. Journal of Geophysical Research.
https://agupubs.onlinelibrary.wiley.com/doi/full/10.1029/2007JC004402
Kurian, N. P., Pillai, A. P., Rajith, K., Krishnan, B. T. M., & Kalaiarasan, P. (2006). Inundation
characteristics and geomorphological impacts of December 2004 tsunami on Kerala coast. Current
Science, 90(2), 240–249. JSTOR.
Kvenvolden, K. A. (1993). A primer on gas hydrates. In D. G. Howell (Ed.), The Future of Energy Gases
(pp. 279–291). U.S. Geological Survey Professional Paper 1570.
https://pubs.er.usgs.gov/publication/pp1570
Kvenvolden, K.A., & McMenamin, M. A. (1980). Hydrates of Natural Gas: A Review of Their Geologic
Occurrence. US Geological Survey Circular 825, 11.
Kvenvolden, Keith A. (1993). Gas hydrates-geological perspective and global change. Reviews of
Geophysics, 31(2), 173–187. https://doi.org/10.1029/93RG00268
Lade, P. V., & Yamamuro, J. A. (2011). Evaluation of static liquefaction potential of silty sand slopes.
Canadian Geotechnical Journal, 48(2), 247–264. https://doi.org/10.1139/T10-063
Lajoie, K., & Keefer, D. (1981). Investigations of the 8 November 1980 earthquake in Humboldt County,
California (Open-File Report No. 81–397; p. 32). U.S. Geological Survey.
http://pubs.er.usgs.gov/publication/ofr81397

California North Coast Offshore Wind Studies
Overview of Geological Hazards 104
Lander, J. F., Lockridge, P. A., & Kozuch, M. J. (1993). Tsunamis affecting the West Coast of the United
States, 1806-1992. National Oceanic and Atmospheric Administration Publication.
Lawson, A. C. (1908). The California Earthquake of April 18, 1906 (p. 1643) [Report of the State
Earthquake Investigation Commission (reprinted 1969)]. Carnegie Institution.
Lawson, A. C., & Reid, H. F. (1908). The California Earthquake of April 18, 1906: Report of the State
Earthquake Investigation Commission (Vols. 1, 2). Carnegie Institution of Washington.
http://publicationsonline.carnegiescience.edu/publications_online/earthquake_volume.pdf
Lee, H.J., Schwab, W. C., & Booth, J. S. (1993). Submarine Landslides: An Introduction. In W. C.
Schwab, H. J. Lee, & D. C. Twichell (Eds.), Submarine landslides; selected studies in the U.S.
Exclusive Economic Zone (pp. 1–13). U.S. Geological Survey Bulletin 2002.
Lee, Homa J, Syvitski, J. P. M., Parker, G., Orange, D., Locat, J., Hutton, E. W. H., & Imran, J. (2002).
Distinguishing sediment waves from slope failure deposits: Field examples, including the ‘Humboldt
slide’, and modelling results. Marine Geology, 79–104.
Lemmons, R. (2016, March 30). Force of Tsunami Impact and Backwash—Plate Tectonics. Climate
Policy Watcher. https://www.climate-policy-watcher.org/plate-tectonics/force-of-tsunami-impact-
and-backwash.html
Leonard, L. J., Currie, C. A., Mazzotti, S., & Hyndman, R. D. (2010). Rupture area and displacement of
past Cascadia great earthquakes from coastal coseismic subsidence. GSA Bulletin, 122(11–12),
2079–2096. https://doi.org/10.1130/B30108.1
Li, A., Davies, R. J., & Yang, J. (2016). Gas trapped below hydrate as a primer for submarine slope
failures. Marine Geology, 380, 264–271. https://doi.org/10.1016/j.margeo.2016.04.010
Li, W.-H. (1992). Evidence for the late Holocene coseismic subsidence in the Lower Eel River valley,
Humboldt county, Northern California: An application of foraminiferal zonation to indicate tectonic
submergence [Masters Thesis]. Humboldt State University.
Liao, S. S. C., Veneziano, D., & Whitman, R. V. (1988). Regression Models For Evaluating Liquefaction
Probability. Journal of Geotechnical Engineering, 114(4), 389–411.
https://doi.org/10.1061/(ASCE)0733-9410(1988)114:4(389)
Lindenberg, J., van Rijn, L. C., & Winterwerp, J. C. (1989). Some Experiments on Wave-induced
Liquefaction of Soft Cohesive Soils. Journal of Coastal Research, 127–137. JSTOR.
Lomax, A. (2005). A reanalysis of the hypocentral location and related observations for the great 1906
California earthquake. Bulletin of the Seismological Society of America, 95(3), 861–877.
Løvholt, F., Pedersen, G., Harbitz, C. B., Glimsdal, S., & Kim, J. (2015). On the characteristics of
landslide tsunamis. Philosophical Transactions. Series A, Mathematical, Physical, and Engineering
Sciences, 373(2053). https://doi.org/10.1098/rsta.2014.0376
MacInnes, B. T., Bourgeois, J., Pinegina, T. K., & Kravchunovskaya, E. A. (2009). Tsunami
geomorphology: Erosion and deposition from the 15 November 2006 Kuril Island tsunami. Geology,
37(11), 995–998. https://doi.org/10.1130/G30172A.1

California North Coast Offshore Wind Studies
Overview of Geological Hazards 105
McAdoo, B.G., & Watts, P. (2004). Tsunami hazard from submarine landslides on the Oregon continental
slope. Marine Geology, 203(3–4), 235–245. https://doi.org/10.1016/S0025-3227(03)00307-4
McAdoo, Brian G., Ah-Leong, J. S., Bell, L., Ifopo, P., Ward, J., Lovell, E., & Skelton, P. (2011). Coral
reefs as buffers during the 2009 South Pacific tsunami, Upolu Island, Samoa. Earth-Science Reviews,
107(1), 147–155. https://doi.org/10.1016/j.earscirev.2010.11.005
McCrory, P. A. (2000). Upper plate contraction north of the migrating Mendocino triple junction,
northern California: Implications for partitioning of strain. Tectonics, 19(6), 1144–1160.
https://doi.org/10.1029/1999TC001177
McLaughlin, R. J., Ellen, S., Blake Jr, M., Jayko, A. S., Irwin, W., Aalto, K., Carver, G., & Clarke Jr, S.
(2000). Geology of the Cape Mendocino, Eureka, Garberville, and southwestern part of the Hayfork
30× 60 minute quadrangles and adjacent offshore area, northern California (Miscellaneous Field
Studies Map MF-2336). U.S. Geological Survey.
Meiburg, E., & Kneller, B. (2010). Turbidity Currents and Their Deposits. Annual Review of Fluid
Mechanics, 42(1), 135–156. https://doi.org/10.1146/annurev-fluid-121108-145618
Merritts, D. J. (1996). The Mendocino triple junction: Active faults, episodic coastal emergence, and
rapid uplift. Journal of Geophysical Research: Solid Earth, 101(B3), 6051–6070.
https://doi.org/10.1029/95JB01816
Milker, Y., Nelson, A. R., Horton, B. P., Engelhart, S. E., Bradley, L.-A., & Witter, R. C. (2016).
Differences in coastal subsidence in southern Oregon (USA) during at least six prehistoric megathrust
earthquakes. Quaternary Science Reviews, 142, 143–163.
https://doi.org/10.1016/j.quascirev.2016.04.017
Mori, N., Takahashi, T., Yasuda, T., & Yanagisawa, H. (2011). Survey of 2011 Tohoku earthquake
tsunami inundation and run‐up. Geophysical Research Letters, 38(7), 6.
https://doi.org/10.1029/[email protected]/(ISSN)1944-8007.MEGAQUAKE1
Murray, M. H., Marshall, G. A., Lisowski, M., & Stein, R. S. (1996). The 1992 M=7 Cape Mendocino,
California, earthquake: Coseismic deformation at the south end of the Cascadia megathrust. Journal
of Geophysical Research: Solid Earth, 101(B8), 17707–17725. https://doi.org/10.1029/95JB02623
Nakahara, S., & Ichikawa, M. (2013). Mortality in the 2011 Tsunami in Japan. Journal of Epidemiology,
23(1), 70–73. https://doi.org/10.2188/jea.JE20120114
NASA. (2011). Tohoku Earthquake Shaking Intensity [Text.Article]. NASA Earth Observator; NASA
Earth Observatory. https://earthobservatory.nasa.gov/images/49719/tohoku-earthquake-shaking-
intensity
NCEI. (2020). Southern Chile Earthquake and Tsunami, 22 May 1960. NOAA National Centers for
Environmental Information; U.S. Department of Commerce.
https://www.ngdc.noaa.gov/hazard/22may1960.html
NCSS. (2020). Northern California Seismic System. U.C. Berkeley, U.S. Geological Survey: Northern
California Seismic System. http://ncedc.org/ncss/
Nelson, A. R., Atwater, B. F., Bobrowsky, P. T., Bradley, L.-A., Clague, J. J., Carver, G. A., Darienzo,
M. E., Grant, W. C., Krueger, H. W., Sparks, R., Stafford, T. W., & Stuiver, M. (1995). Radiocarbon

California North Coast Offshore Wind Studies
Overview of Geological Hazards 106
evidence for extensive plate-boundary rupture about 300 years ago at the Cascadia subduction zone.
Nature, 378(6555), 371–374. https://doi.org/10.1038/378371a0
Nelson, A. R., Atwater, B. F., Bobrowsky, P. T., Bradley, L.-A., Darienzo, M. E., Grant, W. C., Krueger,
H. W., & Sparks, R. (1995). Extensive plate-boundary rupture about 300 years ago at. Nature, 378,
23.
Nelson, A. R., Kashima, K., & Bradley, L.-A. (2009). Fragmentary Evidence of Great-Earthquake
Subsidence during Holocene Emergence, Valdivia Estuary, South Central Chile. Bulletin of the
Seismological Society of America, 99(1), 71–86. https://doi.org/10.1785/0120080103
Nelson, A. R., Kelsey, H. M., & Witter, R. C. (2006). Great earthquakes of variable magnitude at the
Cascadia subduction zone. Quaternary Research, 65(3), 354–365.
https://doi.org/10.1016/j.yqres.2006.02.009
Nicolsky, D. J., Suleimani, E. N., & Hansen, R. A. (2013). Note on the 1964 Alaska Tsunami Generation
by Horizontal Displacements of Ocean Bottom. Numerical Modeling of the Runup in Chenega Cove,
Alaska. Pure and Applied Geophysics, 170(9), 1433–1447. https://doi.org/10.1007/s00024-012-0483-
7
Nicovich, S. R. (2015). Latest Pleistocene to Holocene river terrace deformation within the southernmost
extent of the Little Salmon fault zone; geomorphic insights to fault termination and rupture history,
Van Duzen river, northern California [MS]. Humboldt State University.
Niemi, T. M. (2010). Variable earthquake recurrence on the Northern San Andreas fault over the past
3,000 years at the Vedanta marsh site, Olema, CA (Abs.). AGU Fall Meeting Abstracts, 41, T41C-01.
NOAA. (2020). National Weather Service—Tsunami Hazards. NOAA / National Weather Service | U.S.
Tsunami Warning System. https://www.tsunami.gov/?page=tsunamiFAQ
O’Brien, M. K. (1992). A survey of damage to historic buildings and evaluation of disaster response
procedures following the Cape Mendocino earthquakes of April 1992 (Disasters and Cultural
Property, p. 198). Cornell Institute for Social and Economic Research.
https://www.bcin.ca/bcin/detail.app;jsessionid=794EA4C3D1379CC2F434C089DBC155BB?lang=en
&id=143241&asq=&csq=&csa=&ps=50&pId=1
Ogle, B. A. (1953). Geology of the Eel River Basin, Humboldt County, California. California Division of
Mines Bulletin 164. http://archives.datapages.com/data/bulletns/1953-
56/data/pg/0037/0012/2750/2777.htm
Okal, E. A., & Synolakis, C. E. (2016). Sequencing of tsunami waves: Why the first wave is not always
the largest. Geophysical Journal International, 204(2), 719–735. https://doi.org/10.1093/gji/ggv457
Oppenheimer, D., Eaton, J., Jayko, A., Lisowski, M., Marshall, G., Murray, M., Simpson, R., Stein, R.,
Beroza, G., Magee, M., Carver, G., Dengler, L. A., McPherson, R., Gee, L., Romanowicz, B.,
Gonzalez, F., Li, W. H., Satake, K., Somerville, P., & Valentine, D. (1993). The Cape Mendocino,
California, Earthquakes of April 1992: Subduction at the Triple Junction. Science, 261(5120), 433–
438. https://doi.org/10.1126/science.261.5120.433
California North Coast Offshore Wind Studies
Overview of Geological Hazards 107
Padgett, J. S., Engelhart, S. E., Kelsey, H. M., Witter, R. C., Cahill, N., & Hemphill-Haley, E. (in press).
Timing and amount of southern Cascadia earthquake subsidence over the past 1,700 years at northern
Humboldt Bay, California, USA. Geological Society of America Bulletin.
Padgett, J. S., Kelsey, H. M., & Lamphear, D. (2019). Upper-plate deformation of Late Pleistocene
marine terraces in the Trinidad, California, coastal area, southern Cascadia subduction zone.
Geosphere, 15(4), 1323–1341. https://doi.org/10.1130/GES02032.1
Page, W. D., & Swan, F. H. (2002). Seismic Hazard Assessment for the Humboldt Bay ISFSI Project:
Surface Faulting Potential (Technical Report TR-HBIP-2002-01, Section 8; p. 15).
Palermo, D., Nister, I., Saatcioglu, M., & Ghobarah, A. (2013). Impact and damage to structures during
the 27 February 2010 Chile tsunami—Canadian Journal of Civil Engineering. Canadian Journal of
Civil Engineering, 40, 750–758.
Patton, J. R. (2004a). Late Holocene coseismic subsidence and coincident tsunamis, southern Cascadia
subduction zone, Hookton Slough, Wigi (Humboldt Bay), California. Humboldt State University.
Patton, J. R. (2004b). Late Holocene coseismic subsidence and coincident tsunamis, Southern Cascadia
Subduction Zone, Hookton Slough, Wigi (Humboldt Bay), California [Masters Thesis, Humboldt
State University]. http://dspace.calstate.edu/handle/2148/518
Personius, S. F., & Nelson, A. R. (2006). Fault number 781, Cascadia megathrust. Quaternary Fault and
Fold Database of the United States: U.S. Geological Survey Website.
https://earthquake.usgs.gov/cfusion/qfault/show_report_AB_archive.cfm?fault_id=781§ion_id=
Petersen, M. D., Shumway, A. M., Powers, P. M., Mueller, C. S., Moschetti, M. P., Frankel, A. D.,
Rezaeian, S., McNamara, D. E., Luco, N., Boyd, O. S., Rukstales, K. S., Jaiswal, K. S., Thompson, E.
M., Hoover, S. M., Clayton, B. S., Field, E. H., & Zeng, Y. (2020). The 2018 update of the US
National Seismic Hazard Model: Overview of model and implications. Earthquake Spectra, 36(1), 5–
41. https://doi.org/10.1177/8755293019878199
Peterson, C. D., Carver, G. A., Clague, J. J., & Cruikshank, K. M. (2015). Maximum-recorded overland
run-ups of major nearfield paleotsunamis during the past 3000 years along the Cascadia margin,
USA, and Canada. Natural Hazards, 77(3), 2005–2026. https://doi.org/10.1007/s11069-015-1689-7
Peterson, C. D., Carver, G. A., Cruikshank, K. M., Abramson, H. F., Garrison-Laney, C. E., & Dengler,
L. A. (2011). Evaluation of the use of paleotsunami deposits to reconstruct inundation distance and
runup heights associated with prehistoric inundation events, Crescent City, southern Cascadia margin.
Earth Surface Processes and Landforms, 36(7), 967–980. https://doi.org/10.1002/esp.2126
Plafker, G., & Savage, J. C. (1970). Mechanism of the Chilean Earthquakes of May 21 and 22, 1960.
GSA Bulletin, 81(4), 1001–1030. https://doi.org/10.1130/0016-
7606(1970)81[1001:MOTCEO]2.0.CO;2
Plafker, George. (1969). Tectonics of the March 27, 1964 Alaska Earthquake (p. 74). U.S. Geological
Survey Professional Paper 543-I. https://pubs.usgs.gov/pp/0543i/
Plafker, George. (1972). Alaskan earthquake of 1964 and Chilean earthquake of 1960: Implications for
arc tectonics. Journal of Geophysical Research (1896-1977), 77(5), 901–925.
https://doi.org/10.1029/JB077i005p00901
California North Coast Offshore Wind Studies
Overview of Geological Hazards 108
Plafker, George. (2002). Seismic Hazard Assessment for the Humboldt Bay ISFSI Project: Comparison of
the southern Cascadia subduction zone with the tectonic setting of the 1964 Alaska earthquake
(Technical Report TR-HBIP-2002-01 Appendix 2a; p. 18). Pacific Gas and Electric Company.
PNSN. (2020). Cascadia Subduction Zone. Pacific Northwest Seismic Network.
https://pnsn.org//outreach/earthquakesources/csz
Potter, S. H., Becker, J. S., Johnston, D. M., & Rossiter, K. P. (2015). An overview of the impacts of the
2010-2011 Canterbury earthquakes. International Journal of Disaster Risk Reduction, 14, 6–14.
https://doi.org/10.1016/j.ijdrr.2015.01.014
Prentice, C. S., Merritts, D. J., Beutner, E. C., Bodin, P., & Schill, A. (1999). Northern San Andreas fault
near Shelter Cove, California. Geological Society of America Bulletin, 111(4), 512–523.
Priest, G. R., Witter, R. C., Zhang, Y. J., Goldfinger, C., Wang, K., & Allan, J. C. (2017). New
constraints on coseismic slip during southern Cascadia subduction zone earthquakes over the past
4600 years implied by tsunami deposits and marine turbidites. Natural Hazards, 88(1), 285–313.
https://doi.org/10.1007/s11069-017-2864-9
Pritchard, C. J. (2004). Late Holocene relative sea-level changes, Arcata Bay, California: Evaluation of
freshwater syncline movement using coseismically buried soil horizons [Masters Thesis, Humboldt
State University]. http://dspace.calstate.edu/handle/2148/883
Puig, P., Ogston, A. S., Mullenbach, B. L., Nittrouer, C. A., Parsons, J. D., & Sternberg, R. W. (2004).
Storm-induced sediment gravity flows at the head of the Eel submarine canyon, northern California
margin. Journal of Geophysical Research: Oceans, 109(C3). https://doi.org/10.1029/2003JC001918
Rahman, M. S., & Jaber, W. Y. (1991). Submarine landslides: Elements of analysis. Marine
Geotechnology, 10(1–2), 97–124. https://doi.org/10.1080/10641199109379885
Reagor, B. G., & Brewer, L. R. (1992). Cape Mendocino Earthquakes of April 25 and 26, 1992 (Open-
File Report No. 92–575; p. 31). U.S. Geological Survey.
Rollins, J. C., & Stein, R. S. (2010). Coulomb stress interactions among M ≥ 5.9 earthquakes in the Gorda
deformation zone and on the Mendocino Fault Zone, Cascadia subduction zone, and northern San
Andreas Fault. Journal of Geophysical Research, 115(B12), 1–19.
https://doi.org/10.1029/2009JB007117
Rosidi, D., & Wigginton, W. (1991). Liquefaction and Surface Settlement in the Marina District.
International Conferences on Recent Advances in Geotechnical Earthquake Engineering and Soil
Dynamics. https://scholarsmine.mst.edu/icrageesd/02icrageesd/session13/8
Rukstales, K. S., & Shumway, A. M. (2019). Data Release for 2018 Update of the U.S. National Seismic
Hazard Model [Data set]. U.S. Geological Survey. https://doi.org/10.5066/P9WT5OVB
SAFFR Tsunami Modeling Working Group. (2013). Modeling for the SAFRR Tsunami Scenario—
Generation, Propagation, Inundation, and Currents in Ports and Harbors. In S. L. Ross & L. M. Jones
(Eds.), The SAFRR (Science Application for Risk Reduction) Tsunami Scenario (p. 136). U.S.
Geological Survey Open-file Report 2013-1170-D. https://pubs.usgs.gov/of/2013/1170/d/
Sassa, S., & Sekiguchi, H. (1999). Wave-induced liquefaction of beds of sand in a centrifuge.
Géotechnique, 49(5), 621–638. https://doi.org/10.1680/geot.1999.49.5.621

California North Coast Offshore Wind Studies
Overview of Geological Hazards 109
Satake, K., & Atwater, B. F. (2007). Long-term perspectives on giant earthquakes and tsunamis at
subduction zones. In Annual Review of Earth and Planetary Sciences (Vol. 35, p. 26).
https://doi.org/10.1146/annurev.earth.35.031306.140302
Satake, K., Shimazaki, K., Tsuji, Y., & Ueda, K. (1996). Time and size of a giant earthquake in Cascadia
inferred from Japanese tsunami records of January 1700. Nature, 379, 246–249.
https://doi.org/10.1038/379246a0
Satake, K., Wang, K., & Atwater, B. F. (2003). Fault slip and seismic moment of the 1700 Cascadia
earthquake inferred from Japanese tsunami descriptions. Journal of Geophysical Research: Solid
Earth, 108(B11). https://doi.org/10.1029/2003JB002521
Savage, J. C., Lisowski, M., & Prescott, W. H. (1991). Strain accumulation in western Washington.
Journal of Geophysical Research: Solid Earth, 96(B9), 14493–14507.
https://doi.org/10.1029/91JB01274
Savage, J. C., & Plafker, G. (1991). Tide gage measurements of uplift along the south coast of Alaska.
Journal of Geophysical Research: Solid Earth, 96(B3), 4325–4335.
https://doi.org/10.1029/90JB02540
Scholz, N. A., Riedel, M., Spence, G. D., Hyndman, R. D., James, T., & Naegeli, K. (2011). Do
dissociating gas hydrates play a role in triggering submarine slope failures? A case study from the
northern Cascadia margin. Proceedings, 8.
Scholz, N. A., Riedel, M., Urlaub, M., Spence, G. D., & Hyndman, R. D. (2016). Submarine landslides
offshore Vancouver Island along the northern Cascadia margin, British Columbia: Why
preconditioning is likely required to trigger slope failure. Geo-Marine Letters, 36(5), 323–337.
https://doi.org/10.1007/s00367-016-0452-8
Schulz, S. S., & Wallace, R. E. (1997). The San Andreas Fault. U.S. Geological Survey General Interest
Publication 3. https://pubs.usgs.gov/gip/earthq3/
Schwartz, D. P., Lienkaemper, J. J., Hecker, S., Kelson, K. I., Fumal, T. E., Baldwin, J. N., Seitz, G. G.,
& Niemi, T. M. (2014). The Earthquake Cycle in the San Francisco Bay Region: A.D. 1600–2012.
Bulletin of the Seismological Society of America, 104(3), 1299–1328.
https://doi.org/10.1785/0120120322
Schwartz, S. Y., & Hubert, A. (1997). The state of stress near the Mendocino Triple Junction from
inversion of earthquake focal mechanisms. Geophysical Research Letters, 24(10), 1263–1266.
https://doi.org/10.1029/97GL01060
Scott, R., & Zuckerman, K. (1973). Sandblows and liquefaction (The Great Alaska Earthquake of 1964 -
Engineering Volume, pp. 179–189). Committee on the Alaska Earthquake, Division of Earth
Sciences, National Research Council, National Academy of Sciences.
Seed, H. B. (1968). Landslides during earthquakes due to soil liquefaction. Journal of the Soil Mechanics
and Foundations Division, ASCE, 94(SM), 1055–1122.
Seed, H. B., & Idriss, I. M. (1967). Analysis of Soil Liquefaction: Niigata Earthquake. Journal of the Soil
Mechanics and Foundations Division, 93(3), 83–108.

California North Coast Offshore Wind Studies
Overview of Geological Hazards 110
Seed, H. B., & Idriss, I. M. (1971). Simplified procedure for evaluating soil liquefaction potential. Journal
of Soil Mechanics & Foundations Div, 97(SM9), 1249–1273.
Seed, H. B., & Idriss, I. M. (1982). Ground motions and soil liquefaction during earthquakes. Earthquake
Engineering Research Institute.
Seed, H. B., & Lee, K. L. (1966). Liquefaction of saturated sands during cyclic loading. Journal of Soil
Mechanics & Foundations Div, 92(SM6), 105–134.
Seed, H. B., & Wilson, S. D. (1967). The Turnagain Heights landslide in Anchorage, Alaska (Soil
Mechanics and Bituminous Materials Research Laboratory, p. 57). University of California,
Department of Civil Engineering. https://www.arlis.org/docs/vol1/K/88356.pdf
Seed, R. B., Cetin, K., Moss, R., Kammerer, A., Wu, J., Pestana, J., & Reimer, M. (2001). Recent
Advances in Soil Liquefaction Engineering and Seismic Site Response Evaluation. Second
International Conferences on Recent Advances in Geotechnical Earthquake Engineering and Soil
Dynamics, 47. https://scholarsmine.mst.edu/icrageesd/04icrageesd/session14/2
Seed, R. B., Cetin, K., Moss, R., Kammerer, A., Wu, J., Pestana, J., Riemer, M., Sancio, R., Bray, J.,
Kayen, R., & Faris, A. (2003). Recent Advances in Soil Liquefaction Engineering: A Unified and
Consistent Framework (EERC 2003-06; p. 72). Earthquake Engineering Research Center.
https://digitalcommons.calpoly.edu/cenv_fac/8
Seed, R. B., Riemer, M. F., & Dickenson, S. E. (1991). Liquefaction of Soils in the 1989 Loma Prieta
Earthquake. Proceedings: Second International Conference on Recent Advances in Geotechnical
Earthquake Engineering and Soil Dynamics, 1575–1586.
https://scholarsmine.mst.edu/cgi/viewcontent.cgi?article=3580&context=icrageesd;Liquefaction
Shennan, I., Barlow, N., Carver, G., Davies, F., Garrett, E., & Hocking, E. (2014). Great tsunamigenic
earthquakes during the past 1000 yr on the Alaska megathrust. Geology, 42(8), 687–690.
https://doi.org/10.1130/G35797.1
Shennan, I., & Hamilton, S. (2006a). Coseismic and pre-seismic subsidence associated with great
earthquakes in Alaska. Quaternary Science Reviews, 25(1), 1–8.
https://doi.org/10.1016/j.quascirev.2005.09.002
Shennan, I., & Hamilton, S. (2006b). Coseismic and pre-seismic subsidence associated with great
earthquakes in Alaska. Quaternary Science Reviews, 25(1), 1–8.
https://doi.org/10.1016/j.quascirev.2005.09.002
Shepard, F. P. (1957). Northward continuation of the San Andreas Fault. Bulletin of the Seismological
Society of America, 47(3), 263–266.
Skarke, A., Ruppel, C., Kodis, M., Brothers, D., & Lobecker, E. (2014). Widespread methane leakage
from the sea floor on the northern US Atlantic margin. Nature Geoscience, 7(9), 657–661.
https://doi.org/10.1038/ngeo2232
Smith, S. W., Knapp, J. S., & McPherson, R. C. (1993). Seismicity of the Gorda Plate, structure of the
continental margin, and an eastward jump of the Mendocino Triple Junction. Journal of Geophysical
Research: Solid Earth, 98(B5), 8153–8171. https://doi.org/10.1029/93JB00026
California North Coast Offshore Wind Studies
Overview of Geological Hazards 111
Son, S., Lynett, P., & Ayca, A. (2020). Modelling scour and deposition in harbours due to complex
tsunami-induced currents. Earth Surface Processes and Landforms, 45(4), 978–998.
https://doi.org/10.1002/esp.4791
Song, S. G., Beroza, G. C., & Segall, P. (2008). A Unified Source Model for the 1906 San Francisco
Earthquake. Bulletin of the Seismological Society of America, 98(2), 823–831.
https://doi.org/10.1785/0120060402
Stewart, D., & Knox, R. (1995). What is the Maximum Depth Liquefaction Can Occur? Proceedings:
Third International Conference on Recent Advances in Geotechnical Earthquake Engineering and
Soil Dynamics, 1157–1161.
https://scholarsmine.mst.edu/cgi/viewcontent.cgi?referer=https://www.google.com/&httpsredir=1&ar
ticle=3136&context=icrageesd
Stoddard, P. R. (1991). A comparison of brittle deformation models for the Gorda plate. Tectonophysics,
187(1), 205–214. https://doi.org/10.1016/0040-1951(91)90420-W
Stoffer, P. W. (2005). The San Andreas Fault In The San Francisco Bay Area, California: A Geology
Fieldtrip Guidebook To Selected Stops On Public Lands (Open-File Report No. 2005–1127; p. 133).
U.S. Geological Survey. https://pubs.usgs.gov/of/2005/1127/
Storesund, R., Dengler, L. A., Mahin, S., Collins, B. D., Hanshaw, M., Turner, F., & Welsh, K. (2010).
M6.5 earthquake offshore Northern California, January 9, 2010: Field Reconnaissance Summary
(GEER Reconnaissance Report, February 12, 2010; p. 41). Geotechnical Extreme Events
Reconnaissance (GEER) Association.
Stover, C. W., & Coffman, J. L. (1993). Seismicity of the United States, 1568-1989 (Revised). U.S.
Geological Survey Professional Paper 1527.
Streig, A. R., Dawson, T. E., & Weldon, R. J. (2014). Paleoseismic Evidence of the 1890 and 1838
Earthquakes on the Santa Cruz Mountains Section of the San Andreas Fault, near Corralitos,
California. Bulletin of the Seismological Society of America, 104(1), 285–300.
https://doi.org/10.1785/0120130009
Suess, E., Torres, M. E., Bohrmann, G., Collier, R. W., Greinert, J., Linke, P., Rehder, G., Trehu, A.,
Wallmann, K., Winckler, G., & Zuleger, E. (1999). Gas hydrate destabilization: Enhanced
dewatering, benthic material turnover and large methane plumes at the Cascadia convergent margin.
Earth and Planetary Science Letters, 170(1–2), 1–15. https://doi.org/10.1016/S0012-821X(99)00092-
8
Sugawara, D., Minoura, K., & Imamura, F. (2008). Chapter Three—Tsunamis and Tsunami
Sedimentology. In T. Shiki, Y. Tsuji, T. Yamazaki, & K. Minoura (Eds.), Tsunamiites (pp. 9–49).
Elsevier. https://doi.org/10.1016/B978-0-444-51552-0.00003-5
Suleimani, E., Nicolsky, D. J., Haeussler, P. J., & Hansen, R. (2011). Combined Effects of Tectonic and
Landslide-Generated Tsunami Runup at Seward, Alaska During the MW 9.2 1964 Earthquake. Pure
and Applied Geophysics, 168(6), 1053–1074. https://doi.org/10.1007/s00024-010-0228-4
Sultan, N., Cochonat, P., Foucher, J.-P., & Mienert, J. (2004). Effect of gas hydrates melting on seafloor
slope instability. Marine Geology, 213(1–4), 379–401. https://doi.org/10.1016/j.margeo.2004.10.015

California North Coast Offshore Wind Studies
Overview of Geological Hazards 112
Sumer, B. M, Fredsøe, J., Christensen, S., & Lind, M. T. (1999). Sinking/floatation of pipelines and other
objects in liquefied soil under waves. Coastal Engineering, 38(2), 53–90.
https://doi.org/10.1016/S0378-3839(99)00024-1
Sumer, B. Mutlu, Ansal, A., Cetin, K. O., Damgaard, J., Gunbak, A. R., Hansen, N.-E. O., Sawicki, A.,
Synolakis, C. E., Yalciner, A. C., Yuksel, Y., & Zen, K. (2007). Earthquake-Induced Liquefaction
around Marine Structures. Journal of Waterway, Port, Coastal, and Ocean Engineering, 133(1), 55–
82. https://doi.org/10.1061/(ASCE)0733-950X(2007)133:1(55)
Suppasri, A., Fukutani, Y., Abe, Y., & Imamura, F. (2011). Relationship between earthquake magnitude
and tsunami height along the Tohoku coast based on historical tsunami trace database and the 2011
Great East Japan Tsunami. Report of Tsunami Engineering, 30, 37–49.
Suppasri, A., Koshimura, S., Imai, K., Mas, E., Gokon, H., Muhari, A., & Imamura, F. (2012). Damage
Characteristic and Field Survey of the 2011 Great East Japan Tsunami in Miyagi Prefecture. Coastal
Engineering Journal, 54(1), 1250005-1-1250005–1250030.
https://doi.org/10.1142/S0578563412500052
Swan, F. H., Carver, G. A., McLaren, M., & Page, W. D. (2002). Seismic Hazard Assessment for the
Humboldt Bay ISFSI Project: Regional Geology and Seismology (Technical Report TR-HBIP-2002-
01, Section 3; p. 83). Pacific Gas and Electric Company.
Swan, F. H., Carver, G. A., & Page, W. D. (2002). Seismic Hazard Assessment for the Humboldt Bay
ISFSI Project: Tectonic Framework (Technical Report TR-HBIP-2002-01, Section 2; p. 27). Pacific
Gas and Electric Company.
Szczuciński, W., Chaimanee, N., Niedzielski, P., Rachlewicz, G., Saisuttichai, D., Tepsuwan, T., Lorenc,
S., & Siepak, J. (2006). Environmental and Geological Impacts of the 26 December 2004 Tsunami in
Coastal Zone of Thailand – Overview of Short and Long-Term Effects. Polish Journal of
Environmental Studies, 15(5), 793–810.
Takada, K., & Atwater, B. F. (2004). Evidence for Liquefaction Identified in Peeled Slices of Holocene
Deposits along the Lower Columbia River, Washington. Bulletin of the Seismological Society of
America, 94(2), 550–575. https://doi.org/10.1785/0120020152
Tanaka, H., Tinh, N. X., Umeda, M., Hirao, R., Pradjoko, E., Mano, A., & Udo, K. (2012). Coastal and
Estuarine Morphology Changes Induced by the 2011 Great East Japan Earthquake Tsunami. Coastal
Engineering Journal, 54(1), 1–25. https://doi.org/10.1142/S0578563412500106
Teh, T. C., Palmer, A. C., Bolton, M. D., & Damgaard, J. S. (2006). Stability of Submarine Pipelines on
Liquefied Seabeds. Journal of Waterway, Port, Coastal, and Ocean Engineering, 132(4), 244–251.
https://doi.org/10.1061/(ASCE)0733-950X(2006)132:4(244)
Teh, T. E., Palmer, A. C., & Bolton, M. D. (2004). Wave-induced seabed liquefaction and the stability of
marine pipelines. In Th. Triantafyllidis (Ed.), Cyclic Behaviour of Soils and Liquefaction
Phenomena: Proceedings of the International Conference, Bochum, Germany, 31 March—2 April
2004 (pp. 449–453). A.A. Balkema / Taylor & Francis Group.
Thatcher, W., Marshall, G., & Lisowski, M. (1997). Resolution of fault slip along the 470-km-long
rupture of the great 1906 San Francisco earthquake and its implications. Journal of Geophysical
Research: Solid Earth, 102(B3), 5353–5367. https://doi.org/10.1029/96JB03486

California North Coast Offshore Wind Studies
Overview of Geological Hazards 113
Tobin, D. G., & Sykes, L. R. (1968). Seismicity and tectonics of the northeast Pacific Ocean. Journal of
Geophysical Research (1896-1977), 73(12), 3821–3845. https://doi.org/10.1029/JB073i012p03821
Toppozada, T., & Branum, D. (2004). California earthquake history. Annals of Geophysics, 47(2–3),
Article 2–3. https://doi.org/10.4401/ag-3317
Toppozada, T. R., & Borchardt, G. (1998). Re-evaluation of the 1836 “Hayward fault” and the 1838 San
Andreas fault earthquakes. Bulletin of the Seismological Society of America, 88(1), 140–159.
Towhata, I., Maruyama, S., Kasuda, K., Koseki, J., Wakamatsu, K., Kiku, H., Kiyota, T., Yasuda, S.,
Taguchi, Y., Aoyama, S., & Hayashida, T. (2014). Liquefaction in the Kanto region during the 2011
off the pacific coast of Tohoku earthquake. Soils and Foundations, 54(4), 859–873.
https://doi.org/10.1016/j.sandf.2014.06.016
Tsuji, Y., Satake, K., Ishibe, T., Harada, T., Nishiyama, A., & Kusumoto, S. (2014). Tsunami Heights
along the Pacific Coast of Northern Honshu Recorded from the 2011 Tohoku and Previous Great
Earthquakes. Pure and Applied Geophysics, 171(12), 3183–3215. https://doi.org/10.1007/s00024-
014-0779-x
Tsukamoto, Y., Kawabe, S., & Kokusho, T. (2012). Soil liquefaction observed at the lower stream of
Tonegawa river during the 2011 off the Pacific Coast of Tohoku Earthquake. Soils and Foundations,
52(5), 987–999. https://doi.org/10.1016/j.sandf.2012.11.016
Udo, K., Sugawara, D., Tanaka, H., Imai, K., & Mano, A. (2012). Impact of the 2011 tohoku earthquake
and tsunami on beach morphology along the northern sendai coast. Coastal Engineering Journal,
54(01), 1–15. https://doi.org/10.1142/S057856341250009X
Udo, K., Takeda, Y., & Tanaka, H. (2016). Coastal morphology change before and after 2011 off the
Pacific Coast of Tohoku earthquake tsunami at Rikuzen-Takata coast. Coastal Engineering Journal,
58(4), 1640016-1-1640016–16. https://doi.org/10.1142/S0578563416400167
USGS. (2020a). 1906 San Francisco Earthquake ShakeMaps. U.S. Geological Survey Earthquake
Hazards Program. https://earthquake.usgs.gov/earthquakes/events/1906calif/shakemap/
USGS. (2020b). Earthquake Magnitude, Energy Release, and Shaking Intensity. U.S. Geological Survey
Earthquake Hazards. https://www.usgs.gov/natural-hazards/earthquake-hazards/science/earthquake-
magnitude-energy-release-and-shaking-intensity?qt-science_center_objects=0#qt-
science_center_objects
USGS. (2020c). M 6.5—Northern California (1954-12-21 19:56:24 (UTC)). U.S. Geological Survey
Earthquake Hazards Program.
https://earthquake.usgs.gov/earthquakes/eventpage/ushis2000/executive
USGS. (2020d). M 6.5—Offshore Northern California (1992-04-26 07:41:40 (UTC)). U.S. Geological
Survey Earthquake Hazards Program.
https://earthquake.usgs.gov/earthquakes/eventpage/nc268031/executive
USGS. (2020e). M 6.5—Offshore Northern California (2010-01-10 00:27:39 (UTC)). U.S. Geological
Survey Earthquake Hazards Program.
https://earthquake.usgs.gov/earthquakes/eventpage/nc71338066/executive
California North Coast Offshore Wind Studies
Overview of Geological Hazards 114
USGS. (2020f). M 6.6—Offshore Northern California (1992-04-26 11:18:25 (UTC)). U.S. Geological
Survey Earthquake Hazards Program.
https://earthquake.usgs.gov/earthquakes/eventpage/nc268078/executive
USGS. (2020g). M 7.2—Offshore Northern California (1980-11-08 10:27:34 (UTC)). USGS Earthquake
Hazards Program. https://earthquake.usgs.gov/earthquakes/eventpage/usp0001aq1/executive
USGS. (2020h). M 7.9—The 1906 San Francisco Earthquake [U.S. Geological Survey Earthquake
Hazards Program]. https://earthquake.usgs.gov/earthquakes/eventpage/iscgem16957905/map
USGS. (2020i). M 9.3 Scenario Earthquake—Cascadia Megathrust—Whole CSZ Characteristic largest M
branch. USGS Earthquake Hazards Program.
https://earthquake.usgs.gov/scenarios/eventpage/bssc2014cascadia_sub0_m9p34_se/region-info
USGS. (2020j). Map of Gas Hydrates. USGS - Science for a Changing World.
https://www.usgs.gov/media/images/map-gas-hydrates
USGS. (2020k). Quaternary Fault and Fold Database of the United States. U.S. Geological Survey
Earthquake Hazards Program.
https://earthquake.usgs.gov/cfusion/qfault/query_main_AB.cfm?CFID=1745618&CFTOKEN=ec7c6
c09aace9196-0FB2AEA1-E28C-A3DA-5F4F5FE7FE077C63
USGS. (2020l). Search Earthquake Catalog. U.S. Geological Survey Earthquake Hazards Program.
https://earthquake.usgs.gov/earthquakes/search/
USGS. (2020m). The Great 1906 San Francisco Earthquake. U.S. Geological Survey Earthquake Hazards
Program. https://earthquake.usgs.gov/earthquakes/events/1906calif/18april/index.php
USGS. (2020n). The Modified Mercalli Intensity Scale. U.S. Geological Survey Earthquake Hazards.
https://www.usgs.gov/natural-hazards/earthquake-hazards/science/modified-mercalli-intensity-
scale?qt-science_center_objects=0#qt-science_center_objects
USGS. (2020o). Tsunamis and Tsunami Hazards. https://www.usgs.gov/special-topic/water-science-
school/science/tsunamis-and-tsunami-hazards?qt-science_center_objects=0#qt-
science_center_objects
Uslu, B., Borrero, J. C., Dengler, L., Synolakis, C. E., & Barberopoulou, A. (2008). Tsunami Inundation
from Great Earthquakes on the Cascadia Subduction Zone along the Northern California Coast.
Solutions to Coastal Disasters 2008, 204–214. https://doi.org/10.1061/40978(313)19
Vadurro, G. A. (2006). Amount and rate of deformation across the Little Salmon fault and Table Bluff
anticline within the onland portion of the Southern Cascadia Subduction Zone fold and thrust belt,
NW California. In Signatures of Quaternary crustal deformation and landscape evolution in the
Mendocino deformation zone, NW California (pp. 113–120). M. Hemphill-Haley, T. Leroy, B.
McPherson, J. Patton, J. Stallman, D. Sutherland and T. Williams, Friends of the Pleistocene eds.,
Pacific Cell.
Valentine, D. W. (1992). Late Holocene Stratigraphy, Humboldt Bay, California: Evidence for Late
Holocene Paleoseismicity of the Southern Cascadia Subduction Zone [Masters Thesis, Humboldt
State University]. https://escholarship.org/uc/item/7328g533
California North Coast Offshore Wind Studies
Overview of Geological Hazards 115
Valentine, D. W., Keller, E. A., Carver, G., Li, W.-H., Manhart, C., & Simms, A. R. (2012).
Paleoseismicity of the Southern End of the Cascadia Subduction Zone, Northwestern California.
Bulletin of the Seismological Society of America, 102(3), 1059–1078.
https://doi.org/10.1785/0120110103
van Dohlen, J. (2015). Liquefaction Hazard Zones: Humboldt County, California, 2015. EarthWorks.
https://earthworks.stanford.edu/catalog/stanford-nk595pg0743
Velasco, A. A., Ammon, C. J., & Lay, T. (1994). Recent large earthquakes near Cape Mendocino and in
the Gorda plate: Broadband source time functions, fault orientations, and rupture complexities.
Journal of Geophysical Research: Solid Earth, 99(B1), 711–728. https://doi.org/10.1029/93JB02390
Verdugo, R. (2012). Comparing liquefaction phenomena observed during the 2010 Maule, Chile
earthquake and 2011 Great East Japan earthquake. Proceedings of the International Symposium on
Engineering Lessons Learned from the 2011 Great East Japan Earthquake, 707–718.
Verdugo, R., & González, J. (2015). Liquefaction-induced ground damages during the 2010 Chile
earthquake. Soil Dynamics and Earthquake Engineering, 79, 280–295.
https://doi.org/10.1016/j.soildyn.2015.04.016
Vermeer, J., Crawford, B., & Hemphill-Haley, M. A. (2015). Vertical crustal stability in 23 years since
the 1992 Cape Mendocino M 7.1 earthquake: Benchmark survey results, interpretations and tectonic
implications. AGU Fall Meeting Abstracts, 31, T31B-2890.
Vermeer, J., & Hemphill-Haley, M. A. (2014). Interseismic lithospheric response of the southern end of
the Cascadia subduction zone following the 1992 Cape Mendocino earthquake. AGU Fall Meeting
Abstracts, 11, G11A-0474.
Vermeer, Jessica. (2016). Interseismic lithospheric response of the southern end of the Cascadia
subduction zone since the 1992 Cape Mendocino M 7.1 earthquake [Masters Thesis, Humboldt State
University]. http://humboldt-
dspace.calstate.edu/bitstream/handle/10211.3/175467/Vermeer_Jessica_Sp2016.pdf?sequence=1
Vick, G. (1988). Late Holocene Paleoseismicity and relative vertical crustal movements [Masters Thesis].
Humboldt State University.
Voit, S. S. (1987). Tsunamis. Annual Review of Fluid Mechanics, 19(1), 217–236.
https://doi.org/10.1146/annurev.fl.19.010187.001245
Waite, W. F., Santamarina, J. C., Cortes, D. D., Dugan, B., Espinoza, D. N., Germaine, J., Jang, J., Jung,
J. W., Kneafsey, T. J., Shin, H., Soga, K., Winters, W. J., & Yun, T.-S. (2009). Physical properties of
hydrate-bearing sediments. Reviews of Geophysics, 47(4), 1–38.
https://doi.org/10.1029/2008RG000279
Wallace, R. E. (Ed.). (1990). The San Andreas Fault System, California. U.S. Geological Survey
Professional Paper 1515. https://pubs.usgs.gov/pp/1990/1515/
Walsh, T. J., Combellick, R. A., & Black, G. L. (1995). Liquefaction Features from a Subduction Zone
Earthquake:Preserved Examples from the 1964 Alaska Earthquake (Report Investigations No. 32; p.
90). Washington State Department of Natural Resources, Division of Geology and Earth Resources.
California North Coast Offshore Wind Studies
Overview of Geological Hazards 116
Wang, K., & Tréhu, A. M. (2016). Invited review paper: Some outstanding issues in the study of great
megathrust earthquakes—The Cascadia example. Journal of Geodynamics, 98, 1–18.
https://doi.org/10.1016/j.jog.2016.03.010
Wang, K., Wells, R. E., Mazzotti, S., Hyndman, R. D., & Sagiya, T. (2003). A revised dislocation model
of interseismic deformation of the Cascadia subduction zone. In Journal of Geophysical Research B:
Solid Earth (Vol. 108, Issue B1). https://doi.org/10.1029/2001JB001227
Watt, J., Ponce, D., Parsons, T., & Hart, P. (2016). Missing link between the Hayward and Rodgers Creek
faults. Science Advances, 2(10), e1601441. https://doi.org/10.1126/sciadv.1601441
Watts, P. M. (2002). Probabilities and characteristics of tsunamigenic underwater landslides and slumps.
https://doi.org/10.3133/b2002
Weldon, R. J., Dawson, T. E., Biasi, G., Madden, C., & Streig, A. R. (2013). Appendix G—Paleoseismic
Sites Recurrence Database. In Uniform California Earthquake Rupture Forecast, Version 3
(UCERF3)—The Time-Independent Model (p. 73). U.S. Geological Survey Open-file Report 2013-
1165.
Wells, D. L., & Coppersmith, K. J. (1994). New empirical relationships among magnitude, rupture length,
rupture width, rupture area, and surface displacement. Bulletin of the Seismological Society of
America, 84(4), 974–1002.
Wilson, D. S. (1989). Deformation of the so-called Gorda Plate. Journal of Geophysical Research: Solid
Earth, 94(B3), 3065–3075. https://doi.org/10.1029/JB094iB03p03065
Wilson, D. S. (1993). Confidence intervals for motion and deformation of the Juan de Fuca Plate. Journal
of Geophysical Research: Solid Earth, 98(B9), 16053–16071. https://doi.org/10.1029/93JB01227
Wilson, D. S. (2012). Deformation of the so-called Gorda Plate. Journal of Geophysical Research: Solid
Earth, 3065–3075. https://doi.org/10.1029/[email protected]/(ISSN)2169-
9356.MENDOCINO1
Wilson, R., Davenport, C., & Jaffe, B. (2012). Sediment scour and deposition within harbors in California
(USA), caused by the March 11, 2011 Tohoku-oki tsunami. Sedimentary Geology, 282, 228–240.
https://doi.org/10.1016/j.sedgeo.2012.06.001
Wilson, R. I., Admire, A. R., Borrero, J. C., Dengler, L. A., Legg, M. R., Lynett, P., McCrink, T. P.,
Miller, K. M., Ritchie, A., Sterling, K., & Whitmore, P. M. (2013a). Observations and Impacts from
the 2010 Chilean and 2011 Japanese Tsunamis in California (USA). Pure and Applied Geophysics,
170(6), 1127–1147. https://doi.org/10.1007/s00024-012-0527-z
Wilson, R. I., Admire, A. R., Borrero, J. C., Dengler, L. A., Legg, M. R., Lynett, P., McCrink, T. P.,
Miller, K. M., Ritchie, A., Sterling, K., & Whitmore, P. M. (2013b). Observations and Impacts from
the 2010 Chilean and 2011 Japanese Tsunamis in California (USA). Pure and Applied Geophysics,
170(6), 1127–1147. https://doi.org/10.1007/s00024-012-0527-z
Witter, R. C., Kelsey, H. M., & Hemphill-Haley, E. (2001). Pacific storms, El Nino and tsunamis:
Competing mechanisms for sand deposition in a coastal marsh, Euchre Creek, Oregon. Journal of
Coastal Research, 563–583.

California North Coast Offshore Wind Studies
Overview of Geological Hazards 117
Witter, R. C., Kelsey, H. M., & Hemphill-Haley, E. (2003). Great Cascadia earthquakes and tsunamis of
the past 6700 years, Coquille River estuary, southern coastal Oregon. Geological Society of America
Bulletin, 115(10), 1289–1306.
Witter, R. C., Patton, J. R., Carver, G. A., Kelsey, H. M., Garrison, C., Koehler, R. D., & Hemphill-
Haley, E. (2001). Upper-plate earthquakes on the western Little Salmon fault and contemporaneous
subsidence of southern Humboldt Bay over the past 3,600 years, northwestern California (Final
Technical Report No. 01HQGR0125; p. 47). U.S. Geological Survey, National Earthquake Hazards
Reduction Program (NEHRP).
Witter, R. C., Patton, J. R., Carver, G. A., Kelsey, H. M., Garrison-Laney, C., Koehler, R. D., &
Hemphill-Haley, E. (2002). Upper Plate Earthquakes on the Western Little Salmon Fault and
Contemporaneous Subsidence of Southern Humboldt Bay Over the Past 3,600 Years (NEHRP Final
Technical Report No. 01HQGR0125). US Geological Survey National Earthquake Hazards
Reduction Program.
Witter, R. C., Zhang, Y., Wang, K., Goldfinger, C., Priest, G. R., & Allan, J. C. (2012). Coseismic slip on
the southern Cascadia megathrust implied by tsunami deposits in an Oregon lake and earthquake-
triggered marine turbidites. Journal of Geophysical Research: Solid Earth, 117(B10).
https://doi.org/10.1029/2012JB009404
Woodward-Clyde Consultants. (1980). Evaluation of the potential for resolving the geologic and seismic
issues at the HBPP Unit No. 3: Summary to Pacific Gas and Electric company, San Francisco, CA (p.
74, plus appendix).
Wotherspoon, L. M., Orense, R. P., Green, R. A., Bradley, B. A., Cox, B. R., & Wood, C. M. (2015).
Assessment of liquefaction evaluation procedures and severity index frameworks at Christchurch
strong motion stations. Soil Dynamics and Earthquake Engineering, 79, 335–346.
https://doi.org/10.1016/j.soildyn.2015.03.022
Yasuda, S., Harada, K., Ishikawa, K., & Kanemaru, Y. (2012). Characteristics of liquefaction in Tokyo
Bay area by the 2011 Great East Japan Earthquake. Soils and Foundations, 52(5), 793–810.
https://doi.org/10.1016/j.sandf.2012.11.004
Yelisetti, S., Spence, G. D., & Riedel, M. (2014). Role of gas hydrates in slope failure on frontal ridge of
northern Cascadia margin. Geophysical Journal International, 199(1), 441–458.
https://doi.org/10.1093/gji/ggu254
Youd, T. L. (1973). Liquefaction, flow, and associated ground failure. In Liquefaction, flow, and
associated ground failure (USGS Numbered Series No. 688; Circular, Vol. 688). U.S. Geological
Survey. https://doi.org/10.3133/cir688
Youd, T. L., & Hoose, S. N. (1978). Historic ground failures in northern California triggered by
earthquakes (USGS Professional Paper No. 998; p. 194). U.S. Geological Survey.
Young, Y. L., White, J. A., Xiao, H., & Borja, R. I. (2009). Liquefaction potential of coastal slopes
induced by solitary waves. Acta Geotechnica, 4(1), 17–34. https://doi.org/10.1007/s11440-009-0083-
6

California North Coast Offshore Wind Studies
Overview of Geological Hazards 118
Yun, J. W., Orange, D. L., & Field, M. E. (1999). Subsurface gas offshore of northern California and its
link to submarine geomorphology. Marine Geology, 154(1–4), 357–368.
https://doi.org/10.1016/S0025-3227(98)00123-6
Zhang, G., Robertson, P. K., & Brachman, R. W. I. (2004). Estimating Liquefaction-Induced Lateral
Displacements Using the Standard Penetration Test or Cone Penetration Test. Journal of Geotechnical
and Geoenvironmental Engineering, 130(8), 861–871. https://doi.org/10.1061/(ASCE)1090-
0241(2004)130:8(861)
Zhang, H., Niemi, T., & Fumal, T. (2006). A 3000-year record of earthquakes on the northern San
Andreas fault at the Vedanta marsh site, Olema, California. Seismological Research Letters, 77(2),
176.
Zhu, J., Baise, L. G., & Thompson, E. M. (2017). An Updated Geospatial Liquefaction Model for Global
Application. Bulletin of the Seismological Society of America, 107(3), 1365–1385.
https://doi.org/10.1785/0120160198
Zimmerman, R., Dreckman, G., Walsh, T., Bartoletti, S., Freitag, B., Amiri, F., Barton, B., Charvat, S.,
Crawford, G., D’Acci, T., Jonientz-Trisler, C., LeDuc, A., Mason, V., Mazurkiewicz, F., Park, M.,
Pearce, I., Rodgers, G., Savage, W., Savaglio, F., … Wilson, J. (2005). Cascadia subduction zone
earthquakes: A magnitude 9.0 earthquake scenario (p. 24). Oregon Department of Geology and
Mineral Industries, Cascadia Region Earthquake Workgroup.
Zong, Y., Shennan, I., Combellick, R. A., Hamilton, S. L., & Rutherford, M. M. (2003). Microfossil
evidence for land movements associated with the AD 1964 Alaska earthquake. The Holocene, 13(1),
7–20. https://doi.org/10.1191/0959683603hl590rp