Overview of fluvial and geotechnical processes for TMDL ... gully inset within larger ravine Channel...
45
Christian F Christian F Lenhart Lenhart , , Assistant Prof, MSU Assistant Prof, MSU Research Assoc., U of M Research Assoc., U of M Biosystems Biosystems Engineering Engineering Overview of fluvial and Overview of fluvial and geotechnical processes geotechnical processes for TMDL assessment for TMDL assessment
Transcript of Overview of fluvial and geotechnical processes for TMDL ... gully inset within larger ravine Channel...

Christian F Christian F LenhartLenhart , , Assistant Prof, MSU Assistant Prof, MSU
Research Assoc., U of M Research Assoc., U of M BiosystemsBiosystems EngineeringEngineering
Overview of fluvial and Overview of fluvial and geotechnical processesgeotechnical processesfor TMDL assessmentfor TMDL assessment

Fluvial processes in a glaciated landscape
Rocky Mountains (Rosgen)
Martin County, MN

Hillslope processes
� Surface erosion
� Land-use history & changes to load
� Rates have decreased, but…
� RUSLE and other models- well studied

Sediment delivery
� Sed. delivery poorly understood
� Small % of eroded sediment is carried all the way to river mouth
� Sdr = 63 Sm0.40 Rosgen (WARSSS pg. 2 – 3)

Sed delivery by slope
Sediment delivery by slope
-0.5
0
0.5
1
1.5
2
2.5
0.0% 10.0% 20.0% 30.0% 40.0% 50.0% 60.0% 70.0% 80.0% 90.0%
Sediment delivery ratio
Slo
pe

Case studies
� Driftless area: Coon Creek, WI� 5% of sediment eroded since European
settlement carried out to Mississippi River(Trimble, 1993 - Science article).
� Rush Creek, MN – 4-8 feet on floodplain
� Elm Creek, MN� Sediment measured at gage 8-13% of
estimated annual soil erosion (Lenhart 2008)

Legacy sediment
Where is the excess sediment from the past 150 years stored?� Stream valleys
� Wetlands and lakes� Stream reaches with low velocity and slope;
Overwidened reaches (ditches) low unit stream power ( ω )
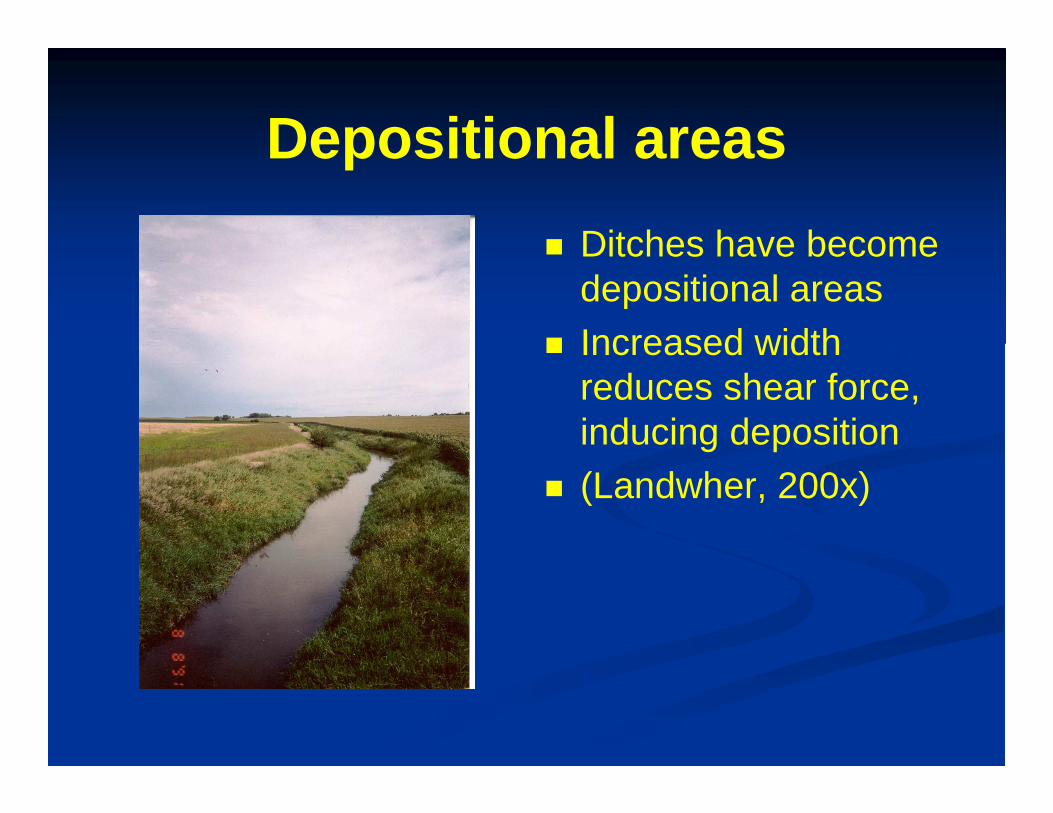
Depositional areas
� Ditches have become depositional areas
� Increased width reduces shear force, inducing deposition
� (Landwher, 200x)

Lakes and Wetlands

HillslopeHillslopeprocesses: processes: Mass soil Mass soil movementmovement
GravityGravity--driven movements:driven movements:Falls, slides, flows , soil creepFalls, slides, flows , soil creep
Bluffs are a major source of sediment by Bluffs are a major source of sediment by massmass--wasting in Minnesota River Basin wasting in Minnesota River Basin

Geomorphic categories
� Valley wall = Bluff� Streambank = Active channel boundary� Ravines = steep tributaries flowing over
the valley wall to larger rivers

Ravines

Ravines in Minnesota Basin

Hillslope Erosion: Gullies
•Sheet erosion
•Rill erosion
•Gullies

Gullies within ravines
CS2 Riffle
0
5
10
15
20
25
0 20 40 60 80 100 120 140 160
Width from River Left to Right (ft)
Ele
vatio
n (
ft)
Ravine
Gully
gully inset within larger ravine

Channel Processes
Patterns of erosion and deposition

Equilibrium Theory and Streams
� Idealized stream in equilibrium:� Sediment supply in balance with transport
� Deposition on point bars in balance with erosion on outer bend
� Are Minnesota streams in equilibrium?

Physical forces in streams� Force balance described by equation of motion
For channel with flowing water:
d(mV)/dt = F gravity + F pressure – F shear
expanded out: d(mV)/dt =( ρρρρ*g* A*∆∆∆∆x* SIN αααα S0) + (Fp1- Fp2) – ( ττττb *
wp* ∆∆∆∆x)
[where, ρ = density of water, g= gravitational constant, A= area, ∆x = change in distance over control volume, S0= channel bottom slope, Fp1 = force at point x, Fp2 = force at point x + ∆x.]

� Force balance: streams exist in a dynamic equilibrium
� Lane’s = predicts channel adjustment� Channel dimensions shaped by frequently
occurring floods – bankfull flows

Sediment Transport in channels
� Bedload
� Suspended load� Wash load

Entrainment equations
Shield’s Equation

Suspended Sediment
� Often estimated by TSS (total suspended solids) - organic matter and sediment
� Turbidity is regulated pollutant

Particle size of SS
� At most flows levels >70% is silt / clay
� At high flows fines are <30%
Particle size of suspended sediment on the Minnesot a River at Jordan, MN betweeen 1981 and 2006
0
5
10
15
20
25
30
35
90-100 80-90 70-80 60-70 50-60 40-50 30-40 20-30 10 to20
% of particles finer than sand (0.063mm)
freq
uenc
y
% silt and clay

Bedload sediment
� Moves by bouncing, rolling� In MN River basin, comprised mostly of
sand� Smaller component of total load

Threshold sediment size vs. Median Particle Size in Elm Creek
0
5
10
15
20
25
30
35
40
0 5 10 15
Median Bed Particle size - D 50 (mm)
Thre
shol
d se
dim
ent s
ize
(mm
)
Threshold = D50
Deposition
Mobilization
� bed sediment easily mobilized at high flows

Channel-forming flows
Dave Rosgen

Hydrologic-watershed processes
� More generally, Lane’s sediment balance
qs D50 ∞∞∞∞ qSqs = sediment discharge
D50 = average diameter of bed particle sizeq = stream flowS = slope

Changes to equilibrium
Changes to watershed hydrology and streamflow cause channel adjustment
in Minnesota � Recent drainage increases
� Private tile drainage expansion < 30 years
� Precipitation high in 1990s� Result: increased low and mean flows
(Zhang and Schilling, 2007)

Simon and SchummChannel Evolution Model
� Most southern Minnesota streams are in stages 3-5, especially 4 and 5

Sources of sediment in rivers
� Streambanks� Bluffs� Ravines/gullies� Legacy sediment

Channel erosion: streambank
Photo of Elm Creek by C. Lenhart

Sediment sources: streambanks
Soil Traits of MRB streambanks� Allluvium
� Minnesota River streambanks (high sand%)� Gullies within ravines
� Young glacial till� Des Moines Lobe Till (fine silts and clays)
� Old glacial till� Superior lobe- highly compressed, stable

Role of vegetation
Grazing effects on roots
Bank Erosion Hazard Index quantifies root influence
Hydraulic erosion
Hydrologic role – less mass wasting by lowering soil moisture

Grass vs. treesHeadwaters prairie
Riparian forests on larger rivers

Sediment sources: Bluffs (valley wall erosion)
� Dramatic examples of mass-wasting� High delivery ratio� Stability of denser tills?

Sediment sources: Ravines/gullies
� Hard to capture events from gullies� Active gully only a small % of ravines� Sediment delivery is lower than
streambanks and bluffs – dump out onto MN River floodplain

Sediment sources: Legacy sediment
� Mean depth of fine sediment in Elm Creek1.1 feet (n = 360)
� Little studied recently� Historically by SCS after Dust Bowl years

Current Research
� Ravine, Bluff, Streambank Erosion study in Minnesota River BasinBioproducts & Biosystems Engineering, U of M
Minnesota Pollution Control Agency
� Purpose: to quantify sediment loads from R, B and S sources; contribution to turbidity problem

Methods
� Ravines: runoff, TSS monitoring at gully outlets; geomorphic assessment� Stream classification, CEM assessment
� Physical property measurement: critical shear stress, particle size

Study sites

Bank stability and toe erosion model (BSTM)
� Critical shear stress
� Cohesive strength

Data
� Field-measured rates of bank erosion� Modeled erosion and transport using
CONCEPTS� Sediment loading from gullies/ravines� Historic rates of channel migration
estimated from photos

Preliminary findings
� Bluffs – major sources of sediment; some hard tills are stable (Gupta, Thoma, Mulla)
� Ravines (Mulla GIS work) ?� Gullies� Streambanks:

Conclusions
� Examine processes from watershed headwaters to river mouth using WARSSS framework + extra tools
� Some key processes are different in flat glaciated landscapes versus mountains
� Total sediment erosion from watershed far exceeds amount carried out
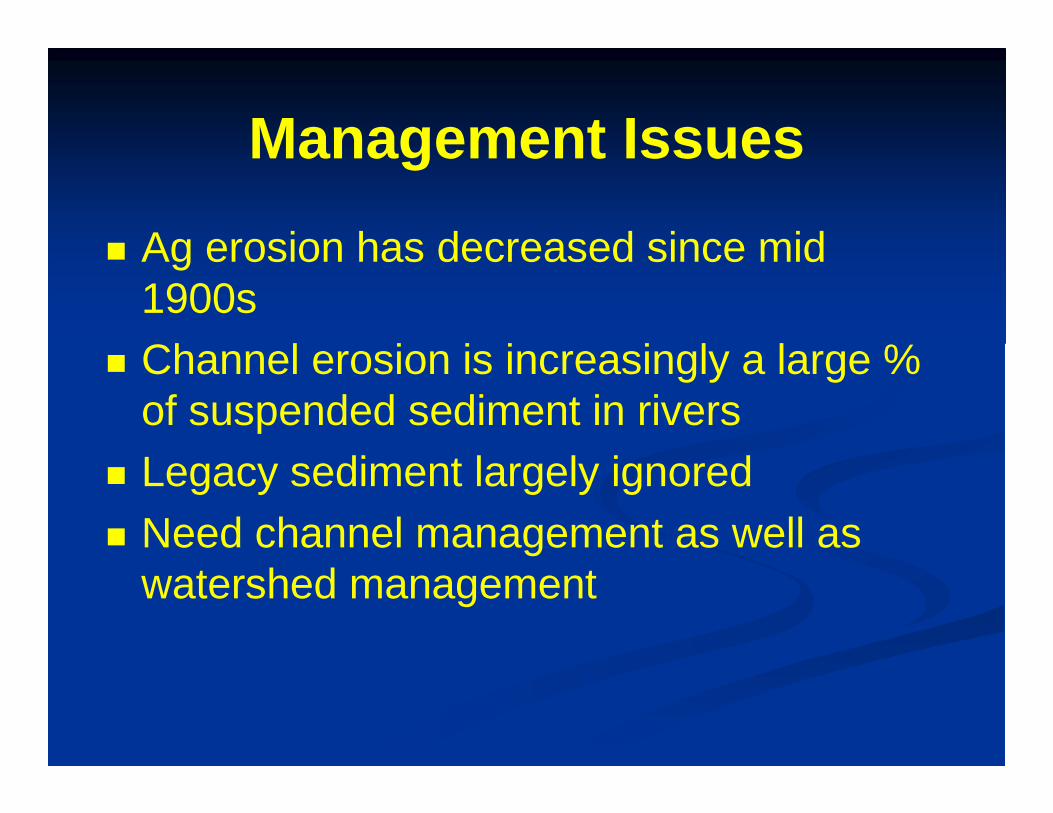
Management Issues
� Ag erosion has decreased since mid 1900s
� Channel erosion is increasingly a large % of suspended sediment in rivers
� Legacy sediment largely ignored� Need channel management as well as
watershed management