
Overview of EPA's ENERGY STAR Portfolio Manager®: A Tool ...€¦ · Overview of EPA's ENERGY STAR...
72
Overview of EPA's ENERGY STAR Portfolio Manager®: A Tool to Measure and Track Energy Consumption and Greenhouse Gas Emissions Wednesday, December 11, 2013 Presented by: Stephanie Plummer, National Program Manager, Retail, ENERGY STAR Commercial Buildings, U.S. EPA Jenna Tatum, Mayor's Carbon Challenge Coordinator, NYC Mayor's Office of Long-Term Planning and Sustainability Donna Hope, Policy Advisor, NYC Mayor's Office of Long-Term Planning and Sustainability Christopher J. Morgan, P.E., Energy Senior Manager, RE Design & Development, JCPenney
Transcript of Overview of EPA's ENERGY STAR Portfolio Manager®: A Tool ...€¦ · Overview of EPA's ENERGY STAR...

Overview of EPA's ENERGY STAR Portfolio
Manager®: A Tool to Measure and Track Energy Consumption and Greenhouse Gas Emissions
Wednesday, December 11, 2013
Presented by: Stephanie Plummer, National Program Manager, Retail, ENERGY STAR Commercial
Buildings, U.S. EPA
Jenna Tatum, Mayor's Carbon Challenge Coordinator, NYC Mayor's Office of Long-Term Planning and Sustainability
Donna Hope, Policy Advisor, NYC Mayor's Office of Long-Term Planning and Sustainability
Christopher J. Morgan, P.E., Energy Senior Manager, RE Design & Development, JCPenney

• Introduction and webinar logistics
• Guest Speakers: – Stephanie Plummer, National Program Manager, Retail, ENERGY STAR
Commercial Buildings, U.S. EPA
– Jenna Tatum, Mayor's Carbon Challenge Coordinator, NYC Mayor's Office of Long-Term Planning and Sustainability
– Donna Hope, Policy Advisor, NYC Mayor's Office of Long-Term Planning and Sustainability
– Christopher J. Morgan, P.E., Energy Senior Manager, RE Design & Development, JCPenney
• Q&A
• Post-webinar survey
Webinar Agenda

• EPA's ENERGY STAR Portfolio Manager is an online tool organizations can use to measure and track energy and water consumption, as well as GHG emissions. It can be used to benchmark the performance of one building or a whole portfolio of buildings, all in a secure online environment. Forty percent of commercial building space in the U.S., including 35% of the Fortune 500® are already benchmarking in Portfolio Manager.
• In this webinar, attendees will learn about the new, updated version of Portfolio Manager - what it is and how it can be used - as well as hear from guest speakers who have utilized the tool to help achieve their organizations' sustainability and carbon goals.

• Attendees are muted to reduce background noise. • Submit questions and comments in writing via the online control panel. • To minimize or maximize the control panel, click on the button at the top left of the tool bar. • Post-webinar survey on this webinar and topics for future webinars. • Today’s presentation will available at: http://www.epa.gov/climateleadership/events/
Webinar Logistics
• A resource launched in 2012 to support organizations of all sizes in measuring and managing GHG emissions.
• Provide technical tools, ground-tested guidance, educational resources, and opportunities for information sharing (e.g., Webinars) and a platform for peer exchange.
• Promote practices and innovative approaches drawing upon the successes of Climate Leadership Award recipients and former Climate Leaders partners.
• Support the implementation of E.O. 13514.
About the Center

ENERGY STAR Commercial Buildings Program
Stephanie Plummer National Program Manager, Retail
ENERGY STAR Commercial Buildings US EPA

Agenda
1. Introduction to ENERGY STAR 2. Introduction to Portfolio Manager 3. Benchmarking Mandates 4. Program Update – Multifamily Housing
Introduction to ENERGY STAR
• A voluntary energy efficiency & climate protection program administered by the US EPA
• ENERGY STAR for products, homes, buildings & plants
• 87% of Americans recognize the ENERGY STAR
20 years of partnership, promise, and progress

ENERGY STAR Commercial Buildings Program
• Offers a strategic approach to energy management
• Enables building owners, managers, and tenants to save money & protect the environment
• Provides organizations with measurable information on energy savings and greenhouse gas emissions reductions from commercial buildings
• ENERGY STAR on a building = Superior Energy Performance

Value of Benchmarking
Consistent benchmarking in buildings results in energy savings and improved performance
Source: http://www.energystar.gov/ia/business/downloads/datatrends/DataTrends_Savings_20121002.pdf?8d81-8322
http://www.energystar.gov/ia/business/downloads/datatrends/DataTrends_Savings_20121002.pdf?8d81-8322
http://www.energystar.gov/ia/business/downloads/datatrends/DataTrends_Savings_20121002.pdf?8d81-8322
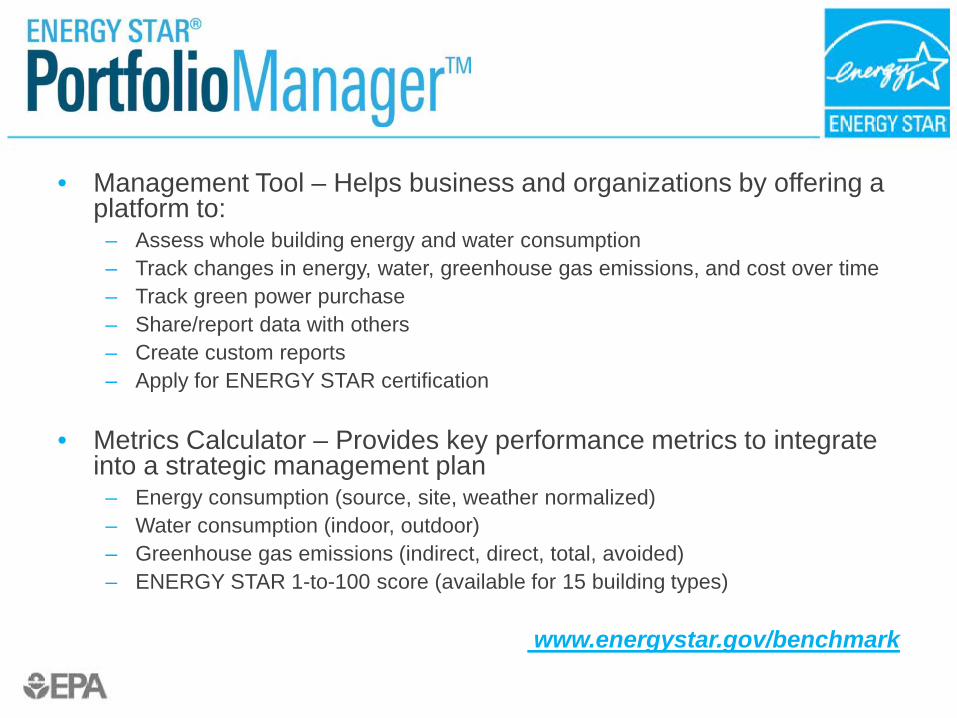
• Management Tool – Helps business and organizations by offering a platform to:
– Assess whole building energy and water consumption – Track changes in energy, water, greenhouse gas emissions, and cost over time – Track green power purchase – Share/report data with others – Create custom reports – Apply for ENERGY STAR certification
• Metrics Calculator – Provides key performance metrics to integrate into a strategic management plan
– Energy consumption (source, site, weather normalized) – Water consumption (indoor, outdoor) – Greenhouse gas emissions (indirect, direct, total, avoided) – ENERGY STAR 1-to-100 score (available for 15 building types)
www.energystar.gov/benchmark

Tremendous Growth in Benchmarking in Portfolio Manager
Understand Comparative Performance
• ALL buildings can be benchmarked • Benchmarking through Portfolio Manager enables
you to: – Compare one building against itself over time – Compare one building against a national sample of
similar buildings – Compare all of your buildings of a similar type to each
other – Set priorities and targets for the use of limited staff time
and/or investment capital
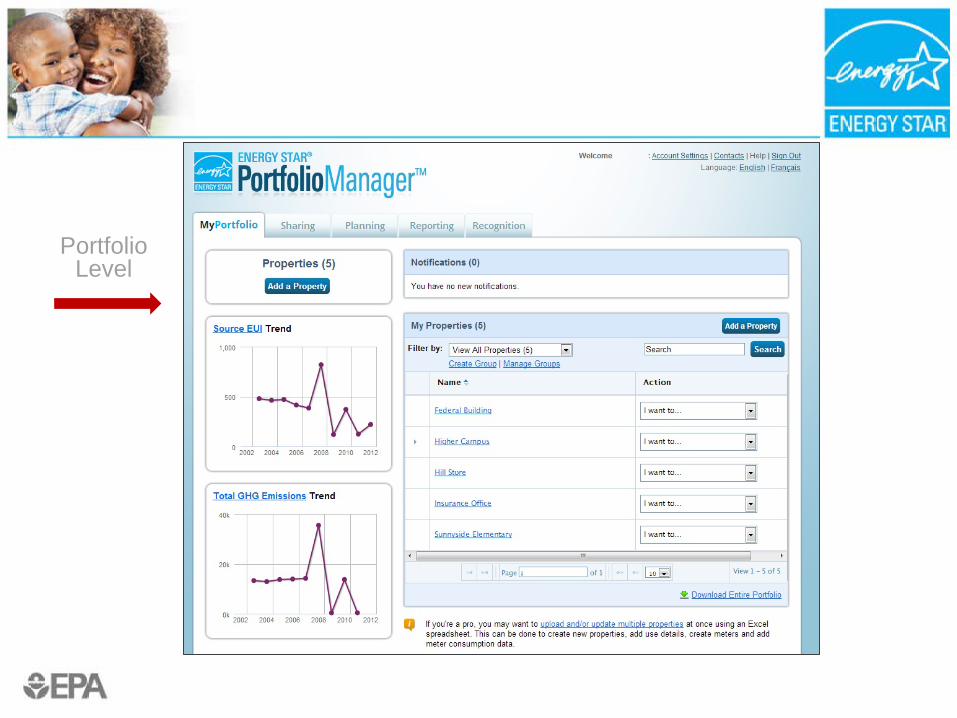
Portfolio Level

Property Level
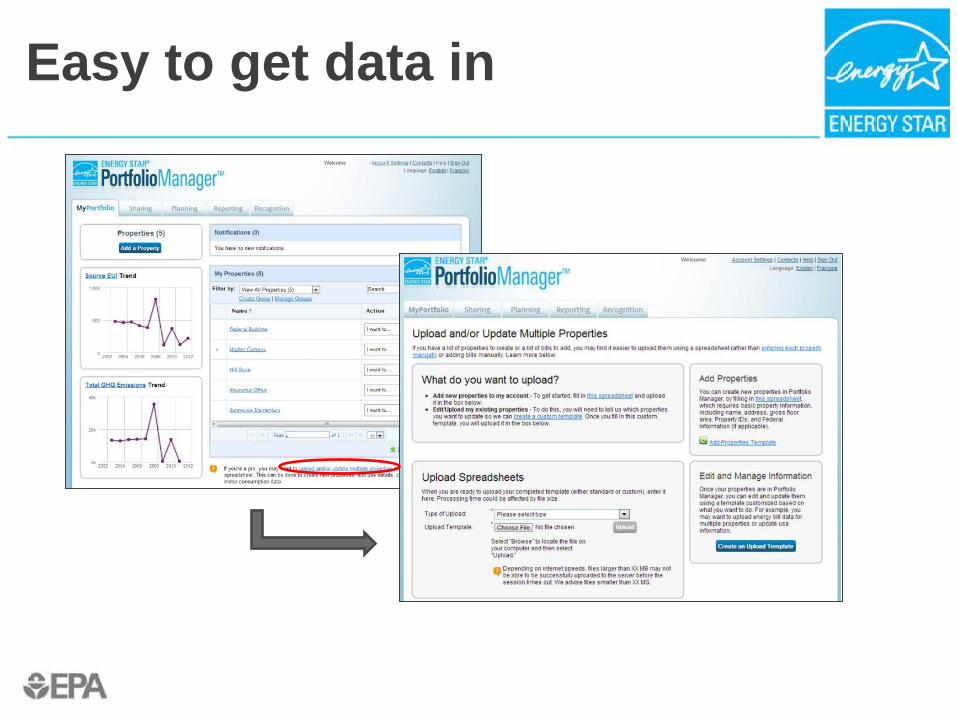
Easy to get data in

Share a property
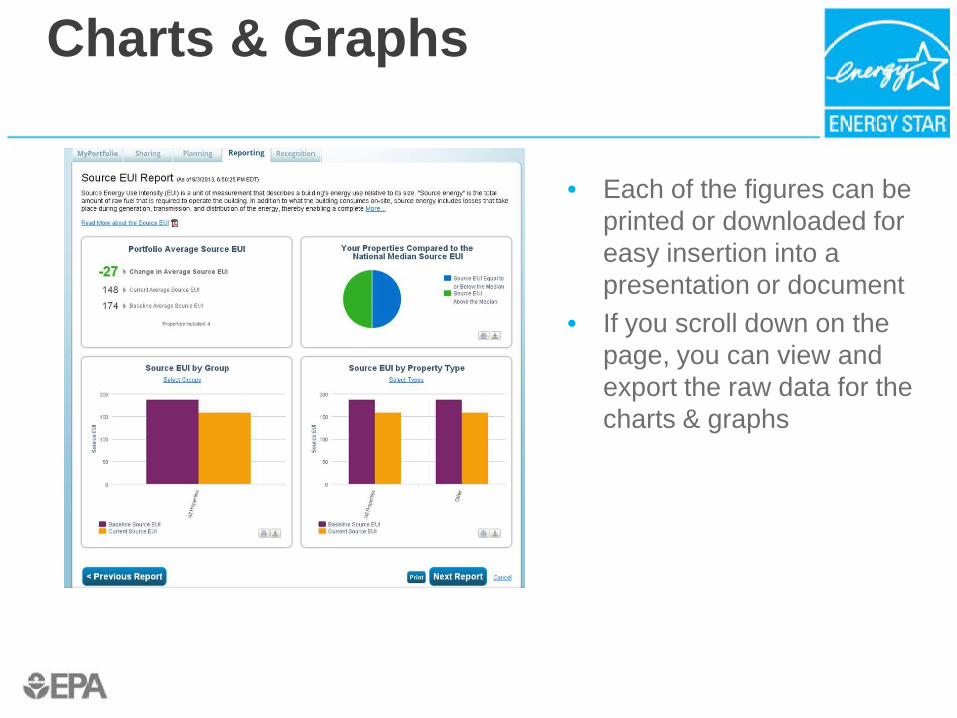
Charts & Graphs
• Each of the figures can be printed or downloaded for easy insertion into a presentation or document
• If you scroll down on the page, you can view and export the raw data for the charts & graphs

Create custom reports
Choose from Pre-set Chart
& Graph options
Download Performance Documents
Create and generate
Templates & Reports

Portfolio Manager in State and Local Building Energy Policy
• State and local energy benchmarking and disclosure policies on the rise
• Purpose of these laws: – Increase transparency of building performance data for a
better informed market (energy and water) – Incentivize improvements in public and private building – Grow clean energy job market
• All jurisdictions with benchmarking laws have specified the use of Portfolio Manager, EPA’s ENERGY STAR measurement and tracking tool

Jurisdiction Enacted Public Buildings
Private Buildings
Disclosure Utility Requirement
Connecticut July 11 √ √
Michigan April 05 √
Ohio Jan 07 √
Hawaii July 09 √
Denver, CO Oct 07 √
California Oct 07 √ √ Transactional √
Washington May 09 √ √ Transactional √
D.C. July 08 √ √ Annual
New York, NY Dec 09 √ √ Annual
Seattle, WA Jan 10 √ √ Transactional √
Austin, TX June 11 √ √ Transactional
San Francisco, CA Feb 11 √ √ Annual
Connecticut Pending √ √ Annual √
Philadelphia Pending √ Annual, Transactional
Vermont Pending √ √ Transactional
State and Local Benchmarking Policies

Developing a 1-100 ENERGY STAR Score for Multifamily Housing
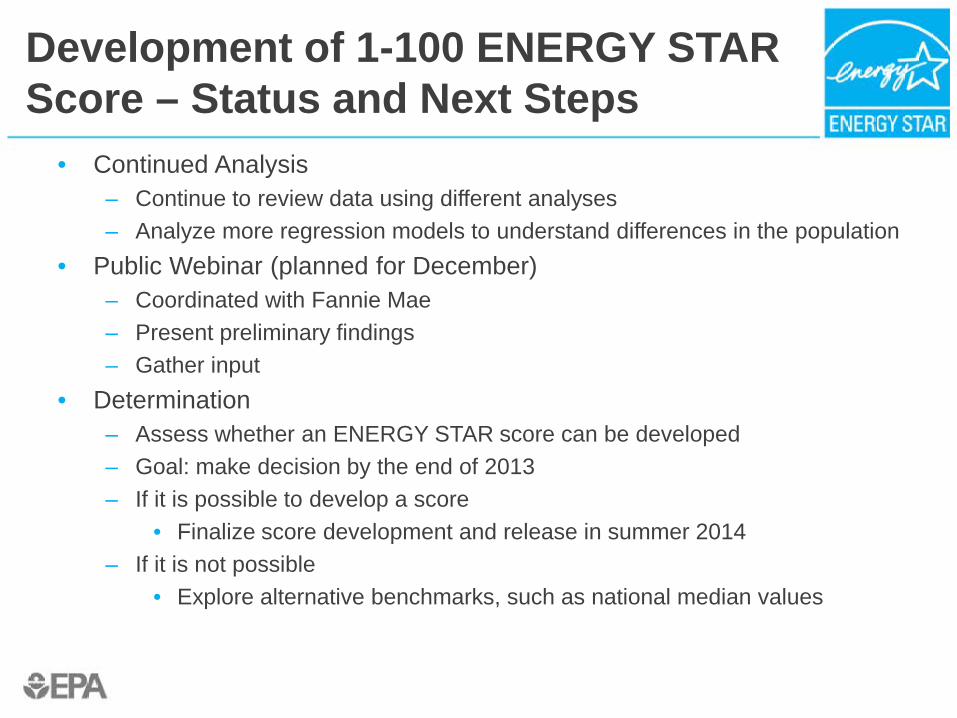
Development of 1-100 ENERGY STAR Score – Status and Next Steps
• Continued Analysis – Continue to review data using different analyses – Analyze more regression models to understand differences in the population
• Public Webinar (planned for December) – Coordinated with Fannie Mae – Present preliminary findings – Gather input
• Determination – Assess whether an ENERGY STAR score can be developed – Goal: make decision by the end of 2013 – If it is possible to develop a score
• Finalize score development and release in summer 2014 – If it is not possible
• Explore alternative benchmarks, such as national median values

New York City’s Energy Benchmarking Policy Wednesday, December 11, 2013
Donna Hope Policy Advisor NYC Mayor’s Office of Long-Term Planning and Sustainability & Institute for Market Transformation (IMT)
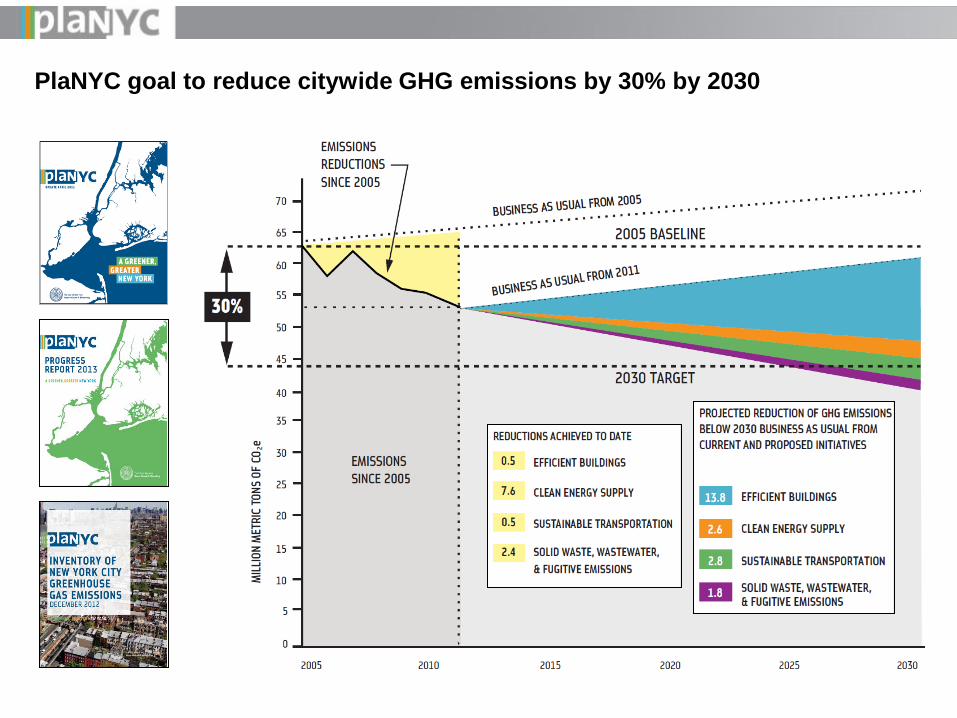
PlaNYC goal to reduce citywide GHG emissions by 30% by 2030
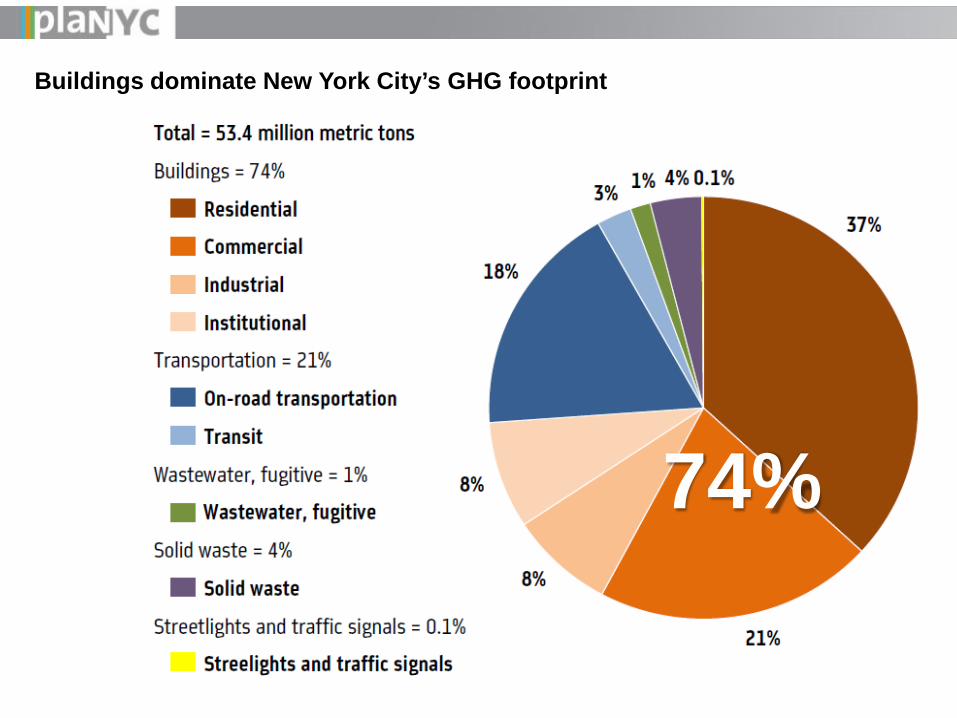
Buildings dominate New York City’s GHG footprint
74%
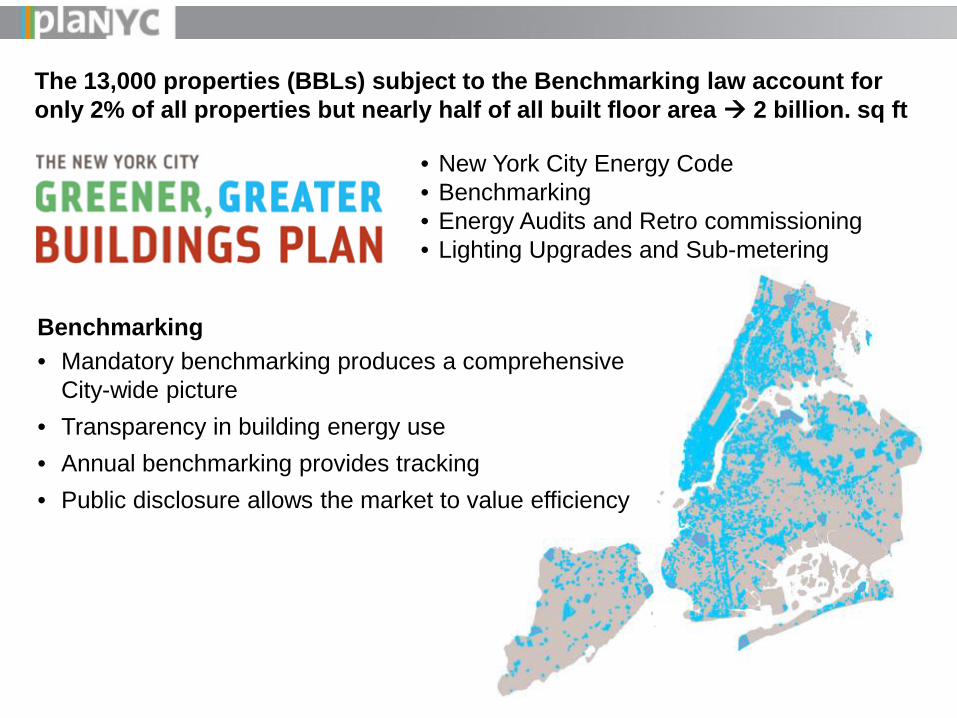
• New York City Energy Code • Benchmarking • Energy Audits and Retro commissioning • Lighting Upgrades and Sub-metering
The 13,000 properties (BBLs) subject to the Benchmarking law account for only 2% of all properties but nearly half of all built floor area 2 billion. sq ft
Benchmarking • Mandatory benchmarking produces a comprehensive
City-wide picture • Transparency in building energy use • Annual benchmarking provides tracking • Public disclosure allows the market to value efficiency
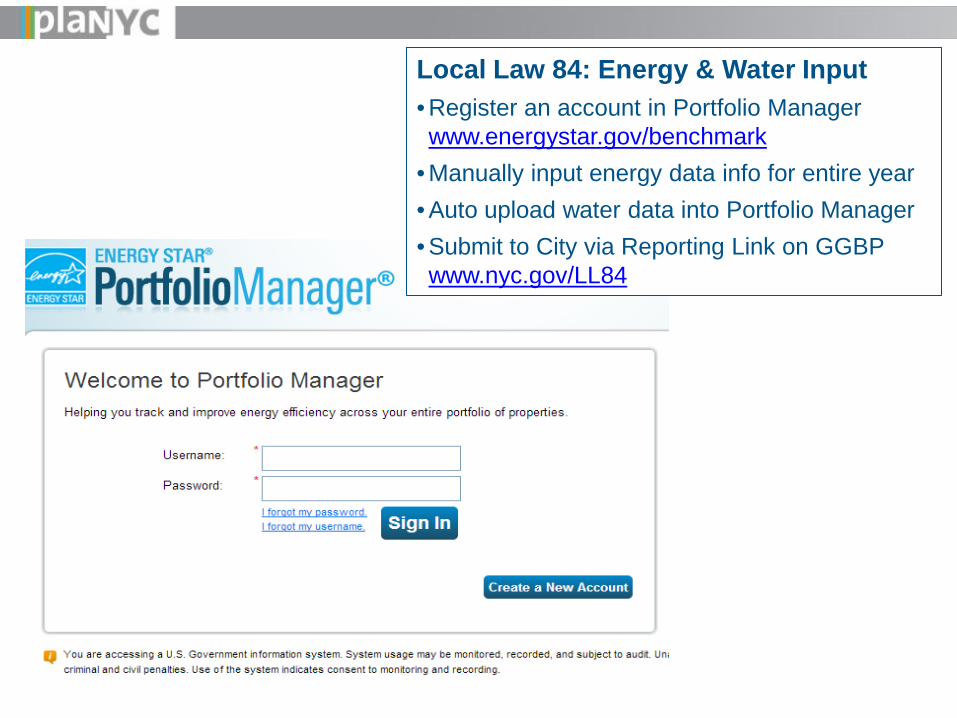
Local Law 84: Energy & Water Input • Register an account in Portfolio Manager www.energystar.gov/benchmark
• Manually input energy data info for entire year • Auto upload water data into Portfolio Manager • Submit to City via Reporting Link on GGBP www.nyc.gov/LL84
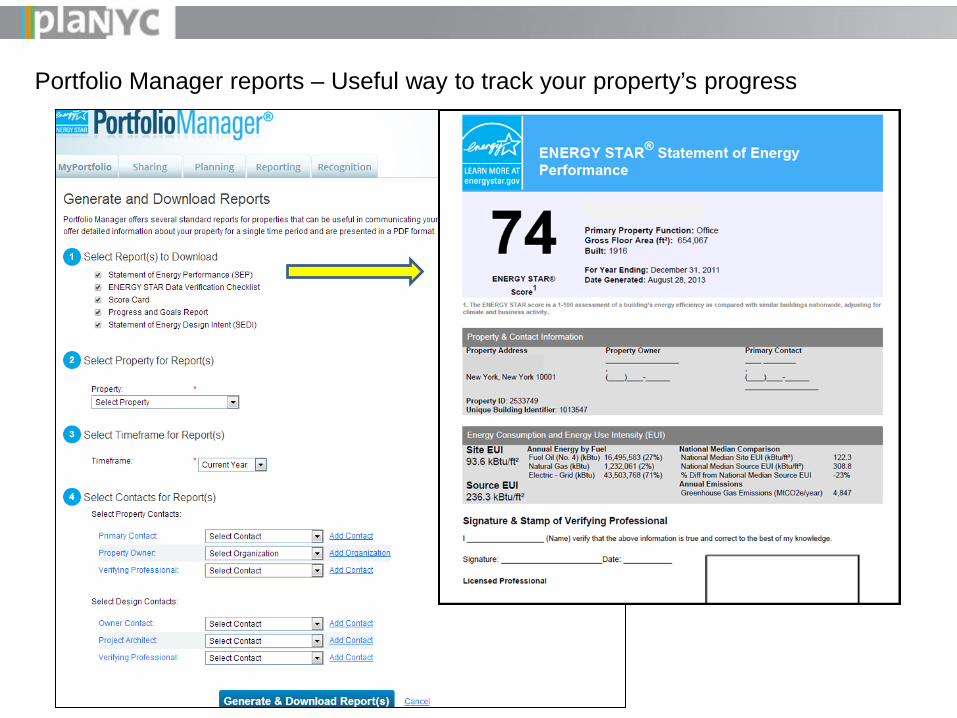
Portfolio Manager reports – Useful way to track your property’s progress

New York City’s 1st and 2nd Benchmarking Reports
• Released Year 2 report on CY 2011 data and Year 1 report on CY 2010 data
• Benchmarking data was merged with City records of building characteristics
• Included analysis conducted by New York University, University of Pennsylvania, and the NYC Mayor’s Office
• First disclosure of multi-family benchmarking data in September 2013, based on third year data (CY 2012)
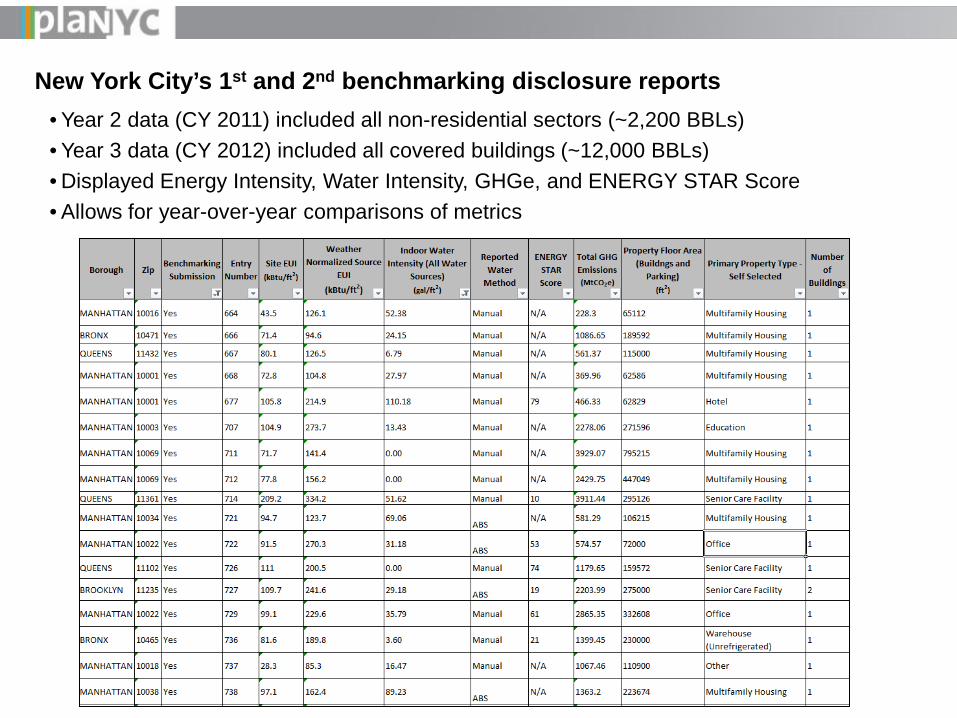
• Year 2 data (CY 2011) included all non-residential sectors (~2,200 BBLs) • Year 3 data (CY 2012) included all covered buildings (~12,000 BBLs) • Displayed Energy Intensity, Water Intensity, GHGe, and ENERGY STAR Score • Allows for year-over-year comparisons of metrics
New York City’s 1st and 2nd benchmarking disclosure reports

New York City’s benchmarking reports – high rate of compliance

New York City’s median ENERGY STAR score consistent with buildings in the Northeastern U.S. Year-over-year analysis of 2010 and 2011 data exhibit consistencies in reporting

Sector variations in energy use are most prevalent in office and retail

Energy use profile among NYC’s most dominant sectors
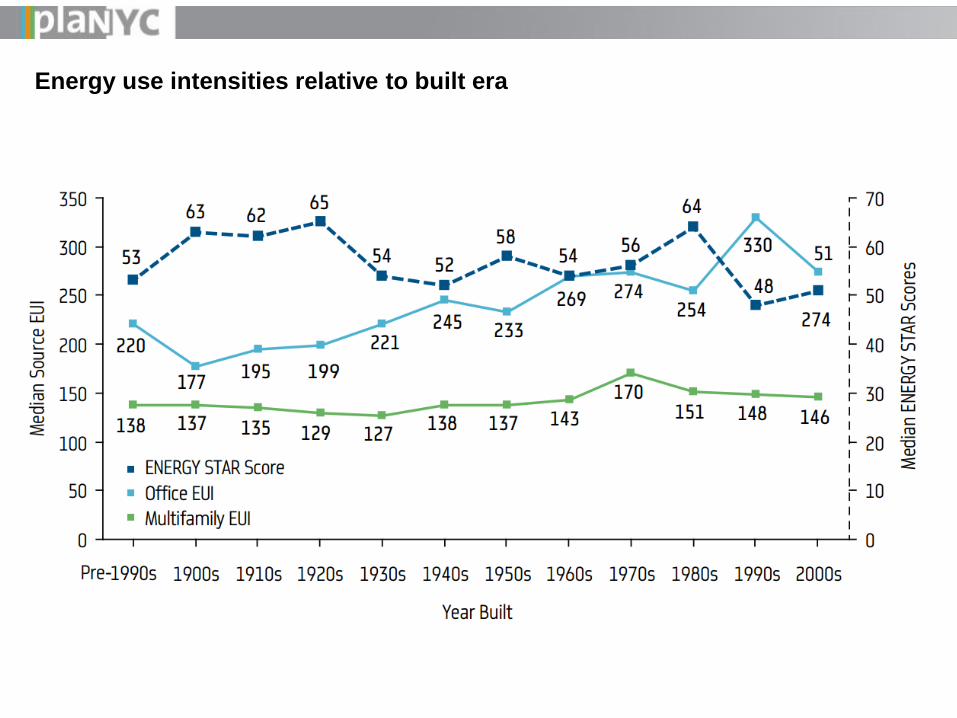
Energy use intensities relative to built era

Fuel use intensities relative to built era

New York City’s water utility was the first in the U.S. to utilize the automatic upload feature in Portfolio Manager

Improving NYC’s Benchmarking Policy:
• Continuous feedback with U.S. EPA about Portfolio Manager • NYC Benchmark Help Center assistance and outreach • Annual meeting with top NYC benchmarking service providers • Consideration of possible benchmark certification program • Outreach coordination with several key stakeholders (i.e. UGC, AEA, NYSERDA, etc.)
Partnerships with U.S. Department of Energy on several data sharing initiatives: • Building Performance Database (BPD)
– Online platform allowing for statistical comparisons of performance trends across peer groups of properties, utilizing anonymized LL84 datasets.
• Standard Energy Efficiency Database (SEED) – Developing a NYC specific instance of a secure data repository for building characteristics and energy
consumption, utilizing LL84 and LL87 datasets.
• Benchmarking and Disclosure Evaluation Handbook – Developing an impact evaluation handbook on direct and indirect economic impacts of B&D, and create a toolkit of
best practices for other jurisdictions developing their own B&D polices.
• Better Buildings Energy Data Accelerator – Direct engagement with local utilities and other Accelerator partners to improve access to whole-building energy
aggregated data for multifamily and commercial sectors.
New York City & Energy Efficient Policies and Programs around ESPM

New York City’s Energy Benchmarking Policy Wednesday, December 11, 2013
Donna Hope Policy Advisor NYC Mayor’s Office of Long-Term Planning and Sustainability & Institute for Market Transformation (IMT)

NYC Mayor’s Carbon Challenge Using Energy Use Benchmarking to Drive Carbon Reductions
December 11, 2013
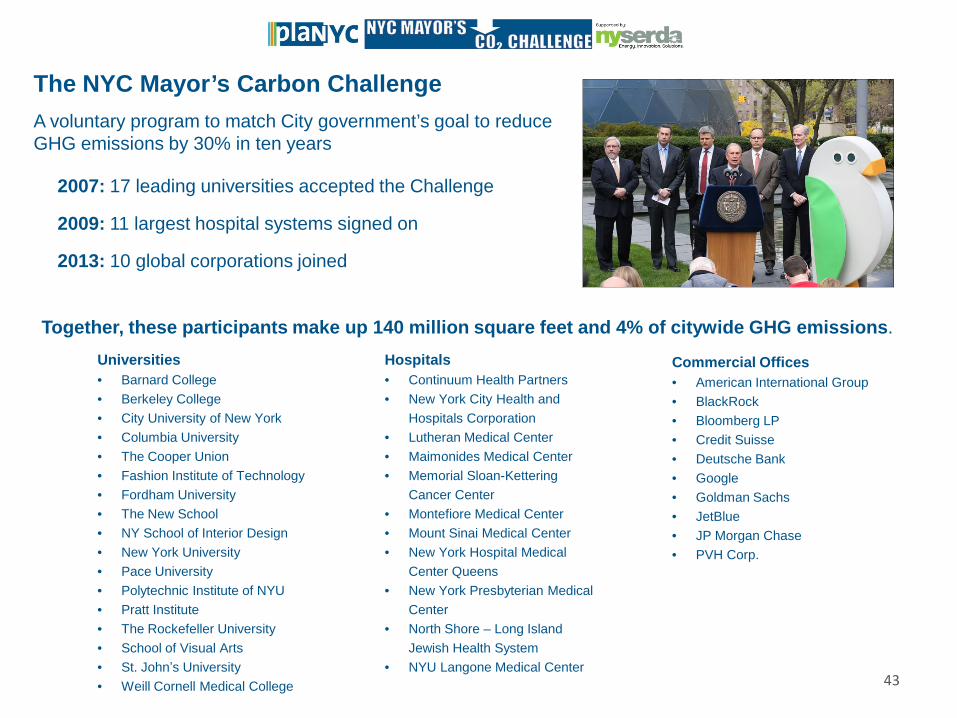
Together, these participants make up 140 million square feet and 4% of citywide GHG emissions.
2007: 17 leading universities accepted the Challenge
2009: 11 largest hospital systems signed on
2013: 10 global corporations joined
The NYC Mayor’s Carbon Challenge
Hospitals • Continuum Health Partners • New York City Health and
Hospitals Corporation • Lutheran Medical Center • Maimonides Medical Center • Memorial Sloan-Kettering
Cancer Center • Montefiore Medical Center • Mount Sinai Medical Center • New York Hospital Medical
Center Queens • New York Presbyterian Medical
Center • North Shore – Long Island
Jewish Health System • NYU Langone Medical Center
Universities • Barnard College • Berkeley College • City University of New York • Columbia University • The Cooper Union • Fashion Institute of Technology • Fordham University • The New School • NY School of Interior Design • New York University • Pace University • Polytechnic Institute of NYU • Pratt Institute • The Rockefeller University • School of Visual Arts • St. John’s University • Weill Cornell Medical College
Commercial Offices • American International Group • BlackRock • Bloomberg LP • Credit Suisse • Deutsche Bank • Google • Goldman Sachs • JetBlue • JP Morgan Chase • PVH Corp.
A voluntary program to match City government’s goal to reduce GHG emissions by 30% in ten years
43

Tracking Emissions for the Challenge • Each participant reports energy use and emissions annually to track progress toward the goal
• Beginning in 2010, all participants started using Portfolio Manager to benchmark under NYC Local Law 84—although many began using the tool before the law
• Portfolio Manager allows participants to aggregate the information they need to report emissions in the Carbon Challenge Inventory
44
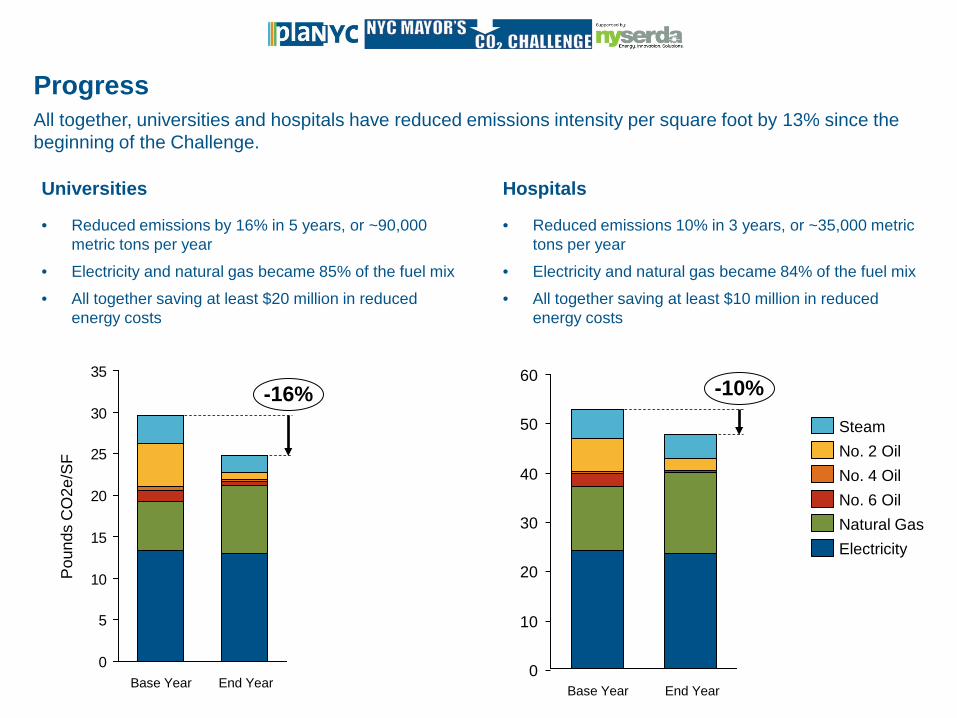
Universities
• Reduced emissions by 16% in 5 years, or ~90,000 metric tons per year
• Electricity and natural gas became 85% of the fuel mix
• All together saving at least $20 million in reduced energy costs
Hospitals
• Reduced emissions 10% in 3 years, or ~35,000 metric tons per year
• Electricity and natural gas became 84% of the fuel mix
• All together saving at least $10 million in reduced energy costs
0
5
10
15
20
25
30
35-16%
End Year Base Year
Pou
nds
CO
2e/S
F
60
50
40
30
20
10
0
-10%
End Year Base Year
Electricity Natural Gas No. 6 Oil No. 4 Oil No. 2 Oil Steam
Progress All together, universities and hospitals have reduced emissions intensity per square foot by 13% since the beginning of the Challenge.
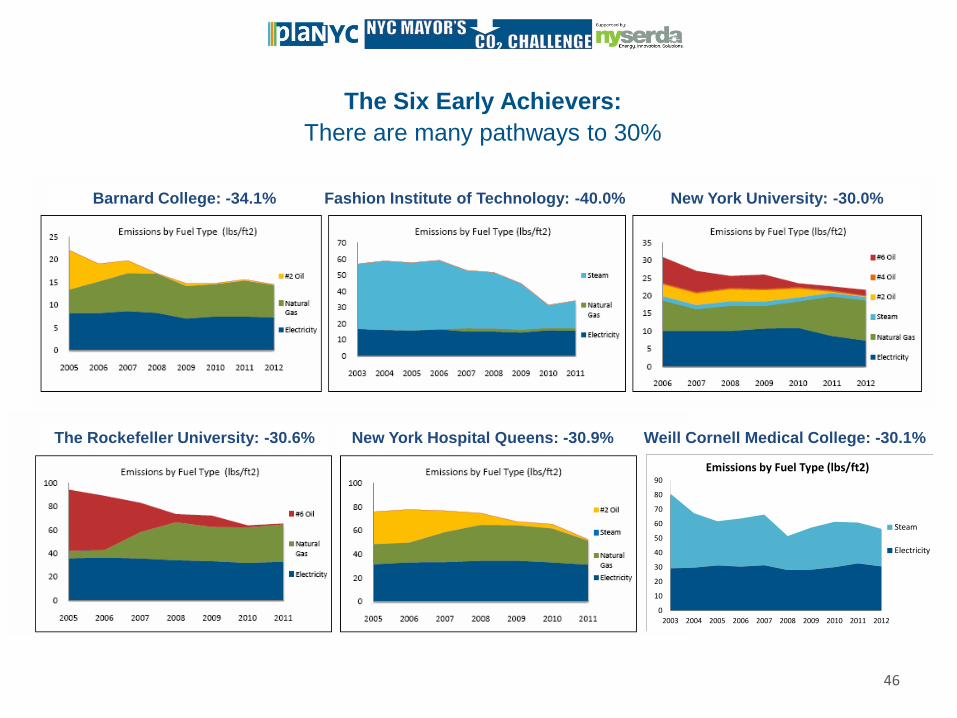
The Six Early Achievers: There are many pathways to 30%
Barnard College: -34.1% Fashion Institute of Technology: -40.0% New York University: -30.0%
The Rockefeller University: -30.6% New York Hospital Queens: -30.9% Weill Cornell Medical College: -30.1%
0
10
20
30
40
50
60
70
80
90
2003 2004 2005 2006 2007 2008 2009 2010 2011 2012
Emissions by Fuel Type (lbs/ft2)
Steam
Electricity
46
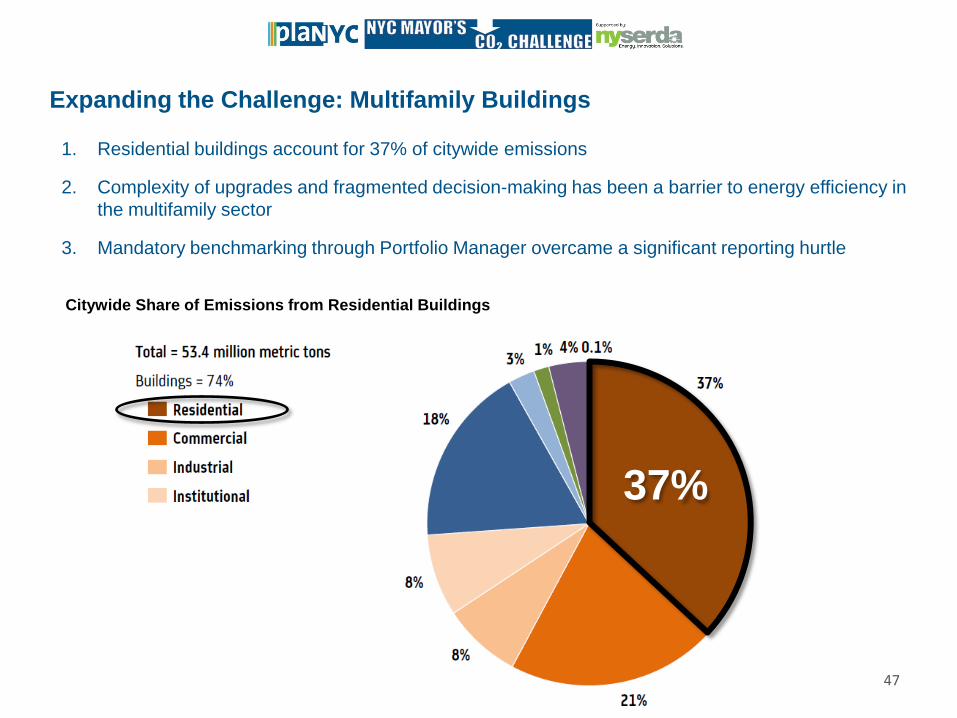
Expanding the Challenge: Multifamily Buildings
1. Residential buildings account for 37% of citywide emissions
2. Complexity of upgrades and fragmented decision-making has been a barrier to energy efficiency in the multifamily sector
3. Mandatory benchmarking through Portfolio Manager overcame a significant reporting hurtle
37%
Citywide Share of Emissions from Residential Buildings
47

Jenna Tatum Mayor’s Carbon Challenge Coordinator NYC Mayor’s Office [email protected] [email protected] www.nyc.gov/carbonchallenges

Chris Morgan JCPenney Energy Senior Manager December 11, 2013
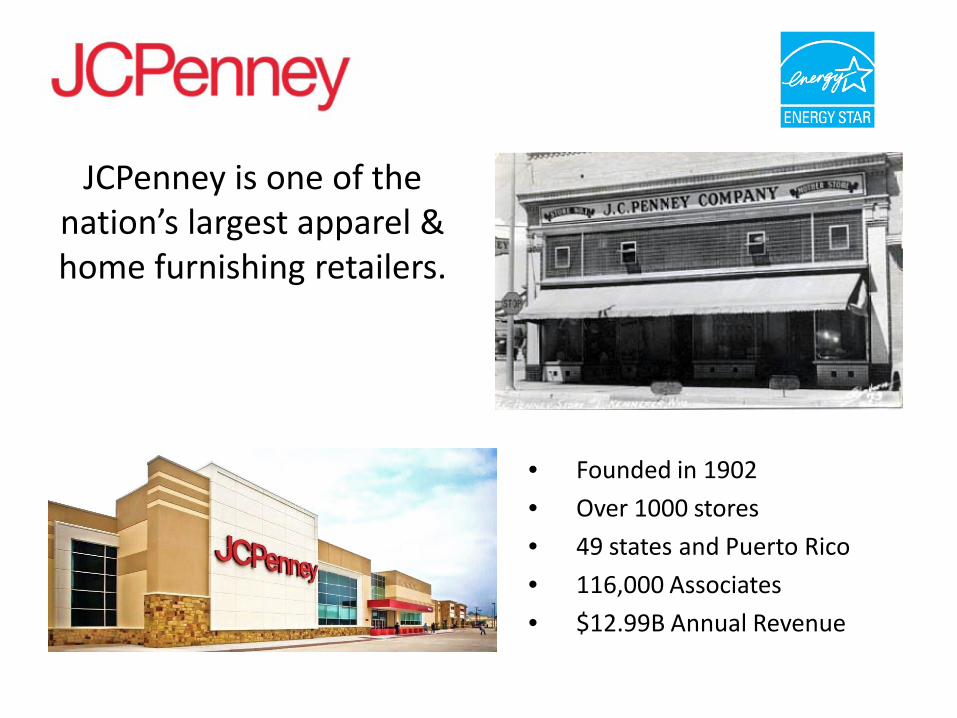
JCPenney is one of the nation’s largest apparel & home furnishing retailers.
• Founded in 1902
• Over 1000 stores
• 49 states and Puerto Rico
• 116,000 Associates
• $12.99B Annual Revenue
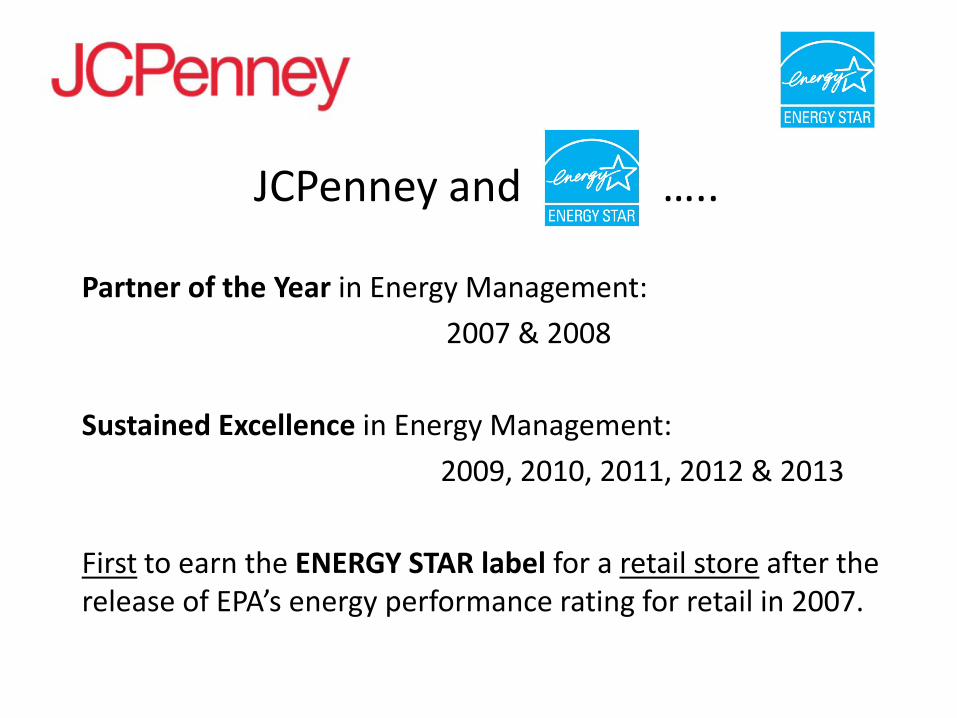
JCPenney and …..
Partner of the Year in Energy Management:
2007 & 2008
Sustained Excellence in Energy Management:
2009, 2010, 2011, 2012 & 2013
First to earn the ENERGY STAR label for a retail store after the release of EPA’s energy performance rating for retail in 2007.


…….
1. Certifications
2. Communication
3. Reporting
4. Compliance
JCPenney and
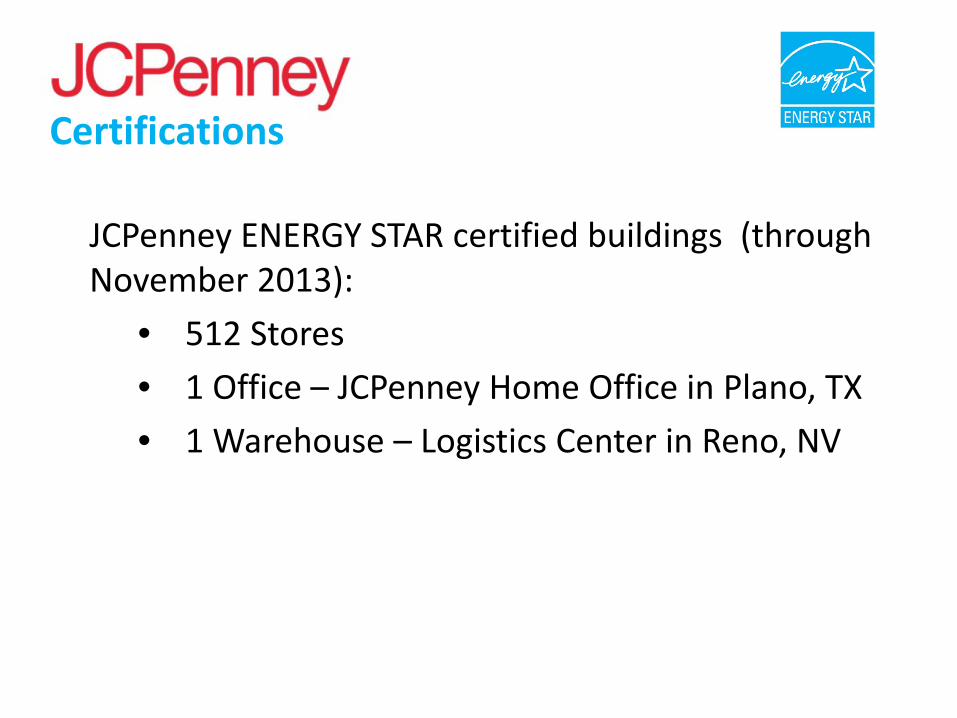
JCPenney ENERGY STAR certified buildings (through November 2013):
• 512 Stores
• 1 Office – JCPenney Home Office in Plano, TX
• 1 Warehouse – Logistics Center in Reno, NV
Certifications

Maplewood, MN (1 of 512 certified stores)
Reno, NV Logistics Center
Plano, TX Home Office
Certifications

• Establish list of stores for certification using Portfolio Manager • Generate Statement of Energy Performance (SEP’s) in Portfolio Manager • Contract Professional Engineers for independent third party verification • Receive verified/stamped SEP’s and submit for certification
Certifications

Communication

• ENERGY STAR Ratings • ENERGY STAR Ratings History • ENERGY STAR Ranking
o By Store o By District o By Region o By other groups
Communication
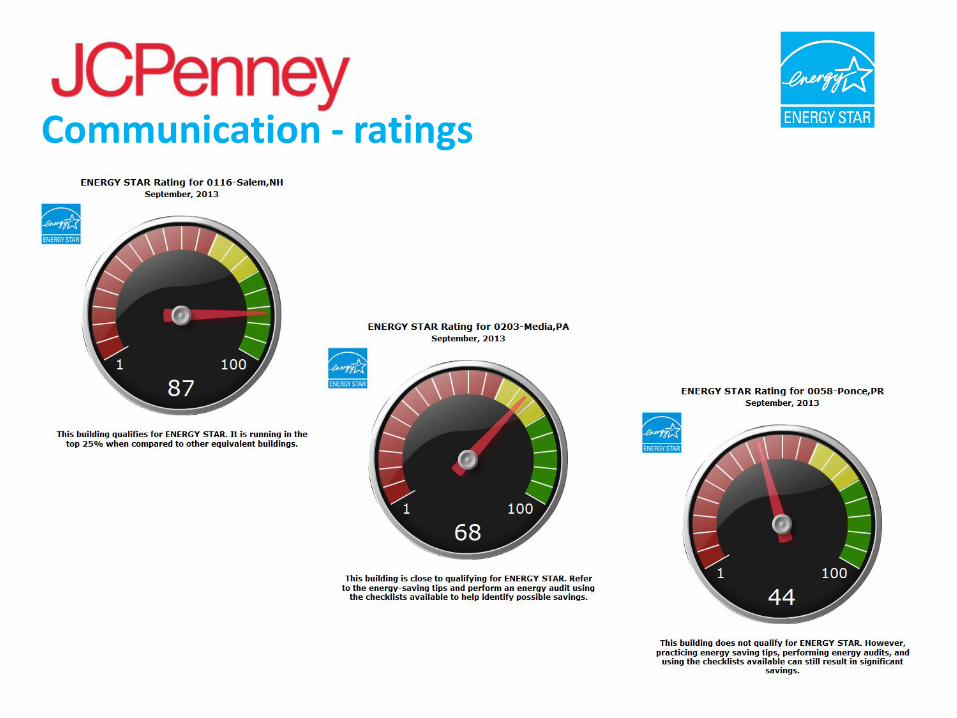
Communication - ratings
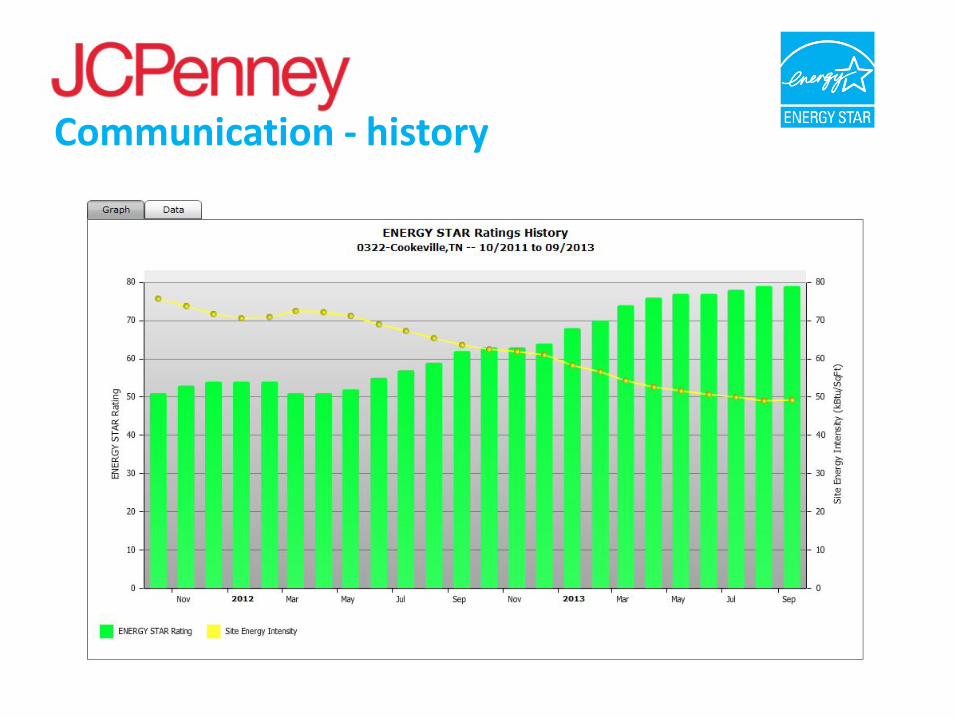
Communication - history
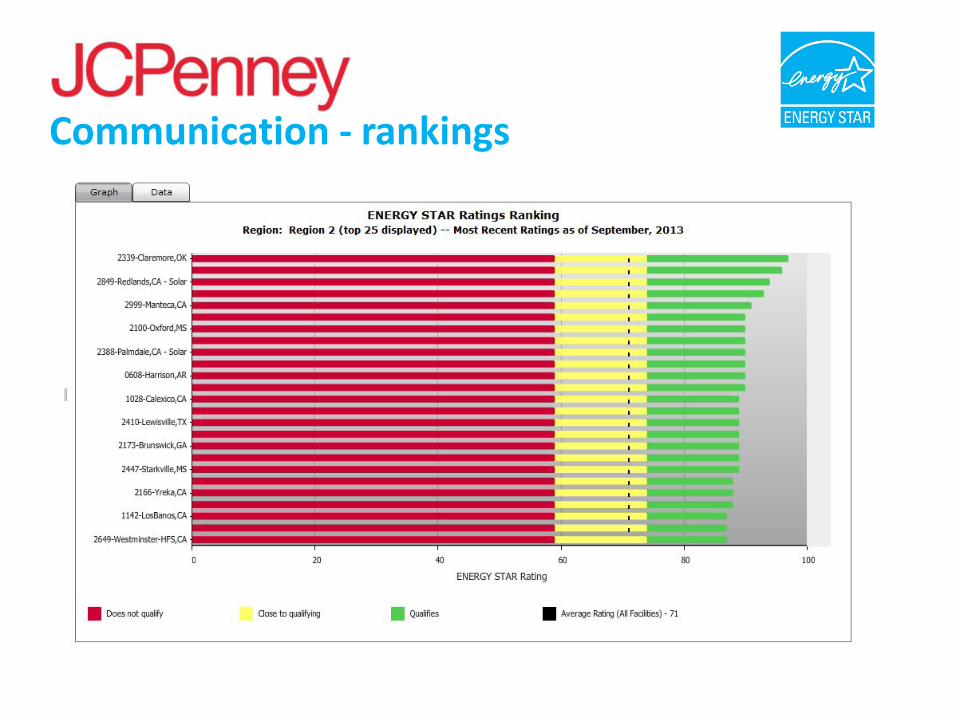
Communication - rankings
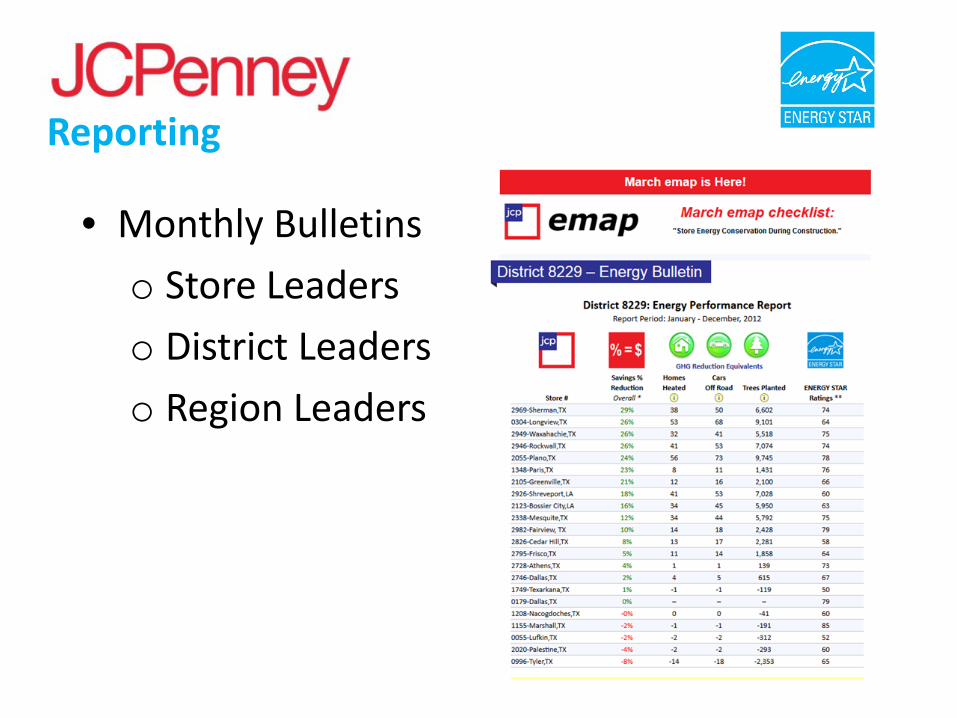
• Monthly Bulletins
o Store Leaders
o District Leaders
o Region Leaders
Reporting
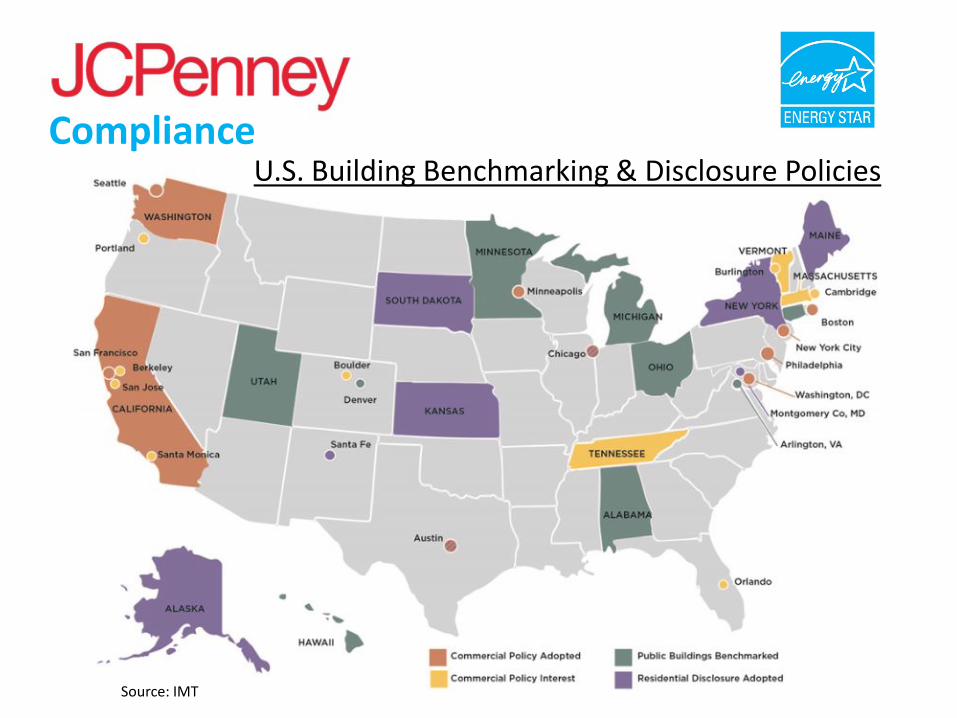
U.S. Building Benchmarking & Disclosure Policies
Source: IMT
Compliance
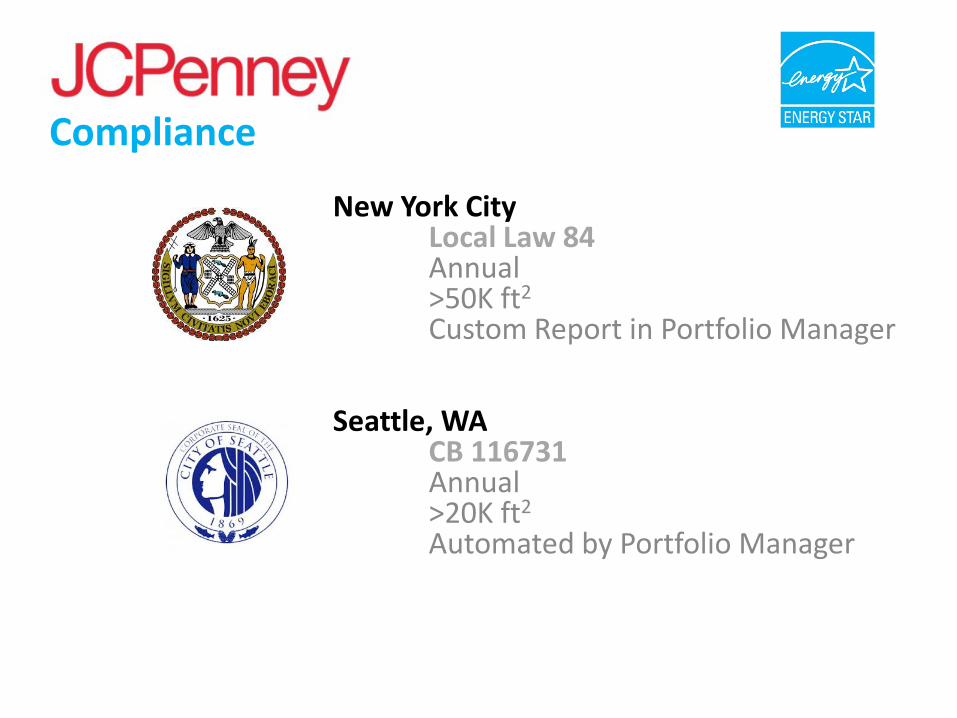
New York City Local Law 84 Annual >50K ft2 Custom Report in Portfolio Manager Seattle, WA CB 116731 Annual >20K ft2 Automated by Portfolio Manager
Compliance

Austin, TX Energy Conservation & Disclosure Ordinance Annual >10k ft2
Report generated from Portfolio Manager California AB 1103 Upon Sale or Lease >5k ft2 Washington (state) Efficiency First SB 5854 Upon Sale or Lease >10k ft2
Compliance

In Conclusion …….
1. Certifications – ENERGY STAR certified buildings
2. Communication – Ongoing through JCPenney EnergyCenter
3. Reporting – Monthly Energy Bulletins to track and
report progress
4. Compliance - Benchmarking & Disclosure Policies throughout the U.S.
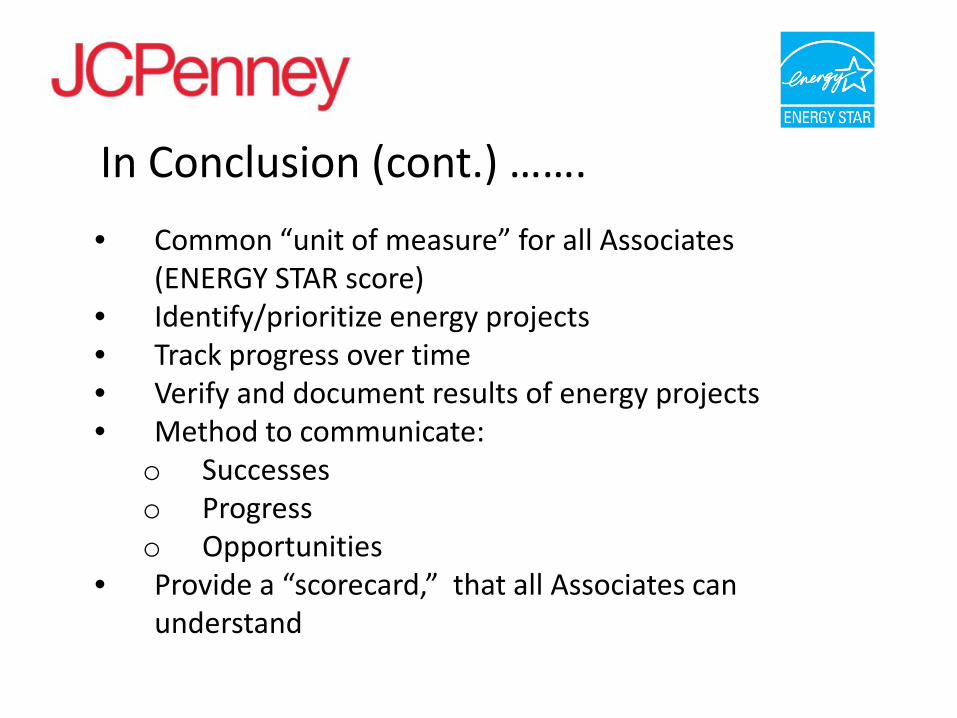
• Common “unit of measure” for all Associates (ENERGY STAR score)
• Identify/prioritize energy projects • Track progress over time • Verify and document results of energy projects • Method to communicate:
o Successes o Progress o Opportunities
• Provide a “scorecard,” that all Associates can understand
In Conclusion (cont.) …….

The Results…….
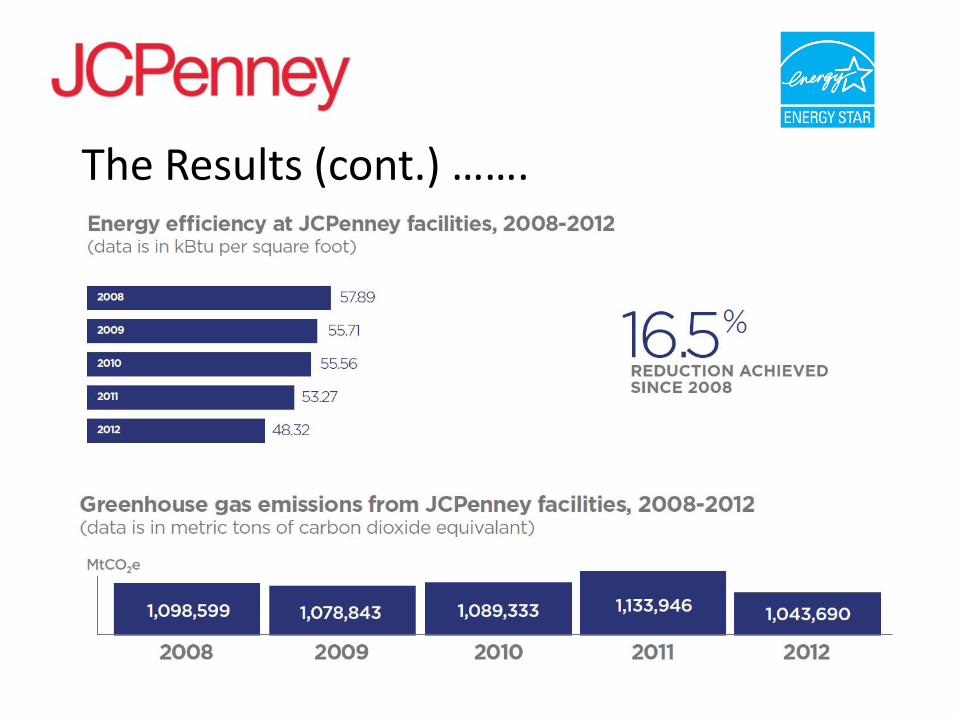
The Results (cont.) …….

Thank You!

Q&A

Melissa Klein
Communications Director
Center for Corporate Climate Leadership, U.S. EPA
(202) 343-9207
For more information, visit www.epa.gov/climateleadership
Follow us on Twitter: @EPAClimateCTR
Contact Us