Overview of Downscaling David Bright NOAA/NWS/Storm Prediction Center Norman, OK AMS Short Course on...
89
Overview of Downscaling Overview of Downscaling David Bright NOAA/NWS/Storm Prediction Center Norman, OK AMS Short Course on Methods and Problems of Downscaling Weather and Climate Variables January 29, 2006 Atlanta, GA Where Americas Climate and Weather Services Begin
Transcript of Overview of Downscaling David Bright NOAA/NWS/Storm Prediction Center Norman, OK AMS Short Course on...

Overview of Downscaling Overview of Downscaling
David BrightNOAA/NWS/Storm Prediction Center
Norman, OK
AMS Short Course on Methods and Problems of Downscaling
Weather and Climate VariablesJanuary 29, 2006
Atlanta, GA
Where Americas Climate and Weather Services Begin

ObjectiveObjective
• To provide an overview of downscaling and its applications. – Subject matter experts will provide details in
their respective areas of expertise

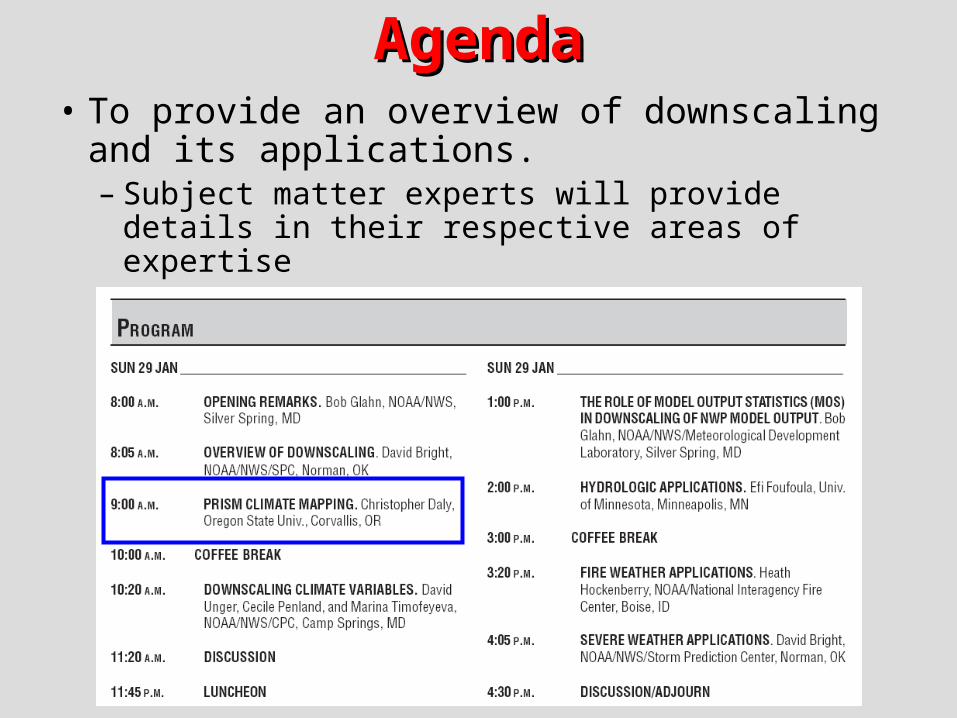
AgendaAgenda• To provide an overview of downscaling
and its applications. – Subject matter experts will provide details in
their respective areas of expertise

What is What is downscalingdownscaling??
downscale

What is What is downscalingdownscaling??

What is What is downscalingdownscaling??
resolution
Examine an optical system

25 km2
Global ScaleGlobal Scale

25 km2
Regional ScaleRegional Scale

25 km2
State ScaleState Scale

25 km2
City ScaleCity Scale

25 km2
Suburban ScaleSuburban Scale

1 km
Block ScaleBlock Scale

0.1 km
Traffic ScaleTraffic Scale

0.05 km
Pedestrian ScalePedestrian Scale

What is What is downscalingdownscaling??
resolution
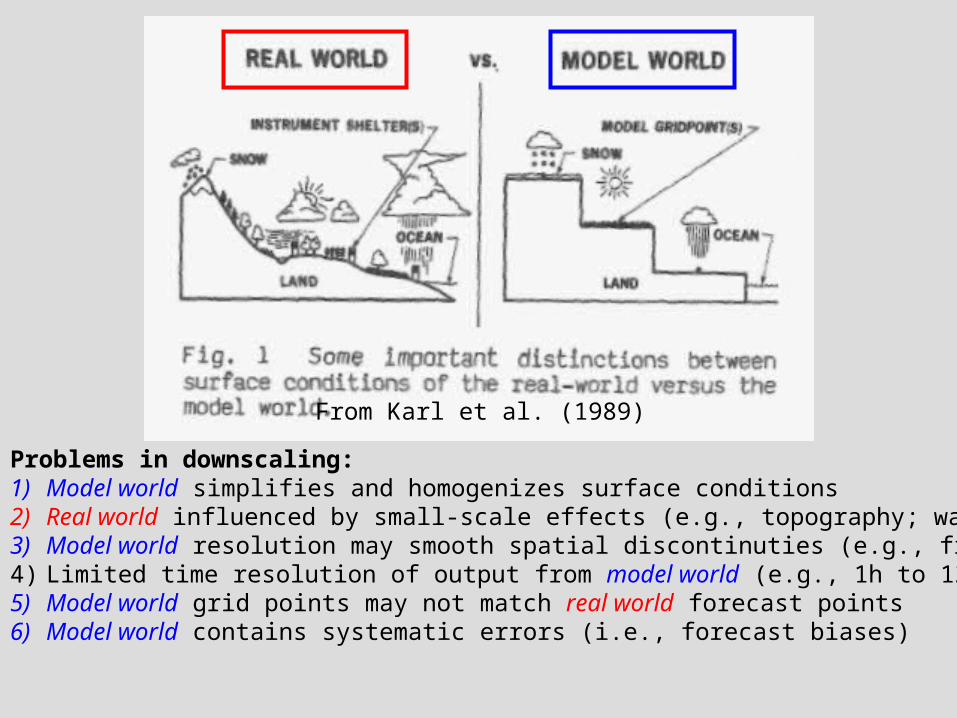
Problems in downscaling:1) Model world simplifies and homogenizes surface conditions2) Real world influenced by small-scale effects (e.g., topography; water)3) Model world resolution may smooth spatial discontinuties (e.g., fronts)4) Limited time resolution of output from model world (e.g., 1h to 12h)5) Model world grid points may not match real world forecast points6) Model world contains systematic errors (i.e., forecast biases)
From Karl et al. (1989)

Bilinear InterpolationBilinear Interpolation
f(x,y) = x’y’(B-A+C-D) + x’(D-C) + y’(A-C) + C
x’ = (x-X1)/(X2-X1)f(x,y)
C=f(X1,Y1) D=f(X2,Y1)
B=f(X2,Y2)A=f(X1,Y2)
y’ = (y-Y1)/(Y2-Y1)
Simply interpolating data to finer grids or point values does not add resolution

Definition of DownscalingDefinition of Downscaling
• Downscaling: Enhancing the spatial and/or temporal resolution of some measurable quantity by implicitly or explicitly projecting variables to smaller resolvable scales
• Historically, humans have produced local forecasts from large-scale data as an implicit part of weather and water forecasting (i.e., downscaling)

Overview: Methods of DownscalingOverview: Methods of Downscaling
Methods of downscaling…• Prognostic Models• Diagnostic Models• Statistical Relationships• Objective Analysis
Elements… • Climate• Weather• Hydrology
SCALE

ClimateClimate

Begin with the big picture…Begin with the big picture…
• Climate Downscaling: Climate downscaling deals with both changes in the expected frequency of weather-related events and with enhancements to spatial resolution
“Climate is what you expect, weather is what you get.” –Robert A. Heinlein (1907-1988) from “Time Enough for Love” (1973)

• Teleconnections are one-point correlation maps most commonly applied to variability on monthly or longer time scales– Long-time tool used as a linkage between
climate/weather anomalies on widely separated regions of the globe
– Contouring of Pearson correlation coefficient (looking for significant positive or negative values)
– Famous example: ENSO phenomenon• ENSO events
– tropical precipitation shift eastward into the central Pacific – above average surface pressure at Darwin and below average
surface pressure at Tahiti (large, negative value of SOI index)
TeleconnectionsTeleconnections

Teleconnection ExampleTeleconnection ExampleLarge-scale CorrelationsLarge-scale Correlations
From Bjerknes (1969)
Easter Island

Created by Dr. Michael Pidwirny, University of British Columbia - Okanagan
Example: Downscale climate signal (ENSO) into Example: Downscale climate signal (ENSO) into “ “sensible” hydro-meteorological informationsensible” hydro-meteorological information

A few significant events can makeA few significant events can makeor break the forecastor break the forecast
i.e., the expected frequency of weather events

Source: http://www.iphc.washington.edu/staff/hare/html/1997ENSO/press_feb.htmlThe 1997/98 El Nino Southern OscillationFebruary 1998 Press ArticlesThis page last updated June 10, 1999 by Steven R. Hare
2/28/98 Golfweek - El Nino rains washing away profits; Warm water in the Pacific Ocean disrupts business on, off courses 2/27/98 San Diego Daily Tribune - Emergency Services Chief Tours El Nino Storm Damage In California 2/26/98 CNN - El Niño clouds Florida's 'sunshine state' image 2/26/98 Washington Post - El Nino Fluctuations May Follow Warm Water Flow 2/26/98 San Francisco Chronicle - Experiments Flying Into El Nino Are Big Success, Scientists Say 2/26/98 San Francisco Chronicle - El Niño yields weather secrets 2/25/98 channel 2000 - Sick Of El Niño? Try La Niña 2/25/98 BBC - El Niño batters both US coasts 2/25/98 Washington Post - At Least 7 Reported Dead As Rain Drenches California; El Nino-Driven Storms Taking Toll on State 2/25/98 ABC - Tales to Warm, Chill the Heart: ABCNEWS.com Users Tell Their El Niño Stories 2/24/98 Orange County Register - Research aircraft plays a major role in predicting size of El Nino storms 2/24/98 CNN - Allergies worse than usual? Blame El Niño 2/24/98 San Diego Daily Transcript - El Nino-Powered Torrent Brings Tornado, Deaths, Mudslides 2/24/98 CNN - El Niño-driven storm turns California into disaster zone 2/24/98 Washington Post - El Nino Was Major Factor In Tornadoes; Effects Have Become Stronger During February 2/24/98 ABC - El Niño Packs Double Wallop 2/24/98 Washington Post - Tornadoes, Rain Linked to El Nino 2/23/98 CNN - CARE announces El Nino relief project in Bolivia 2/23/98 San Diego Daily Transcript - El Nino Floods Streets Of Peru's Capital 2/23/98 MSNBC - El Niño’s punch clogs region 2/23/98 USA Today - El Nino triggers sneezing season 2/23/98 Sacramento Bee - UCD to hone weather skills on El Nino 2/23/98 ABC - El Niño Attacks California 2/23/98 Detroit News - El Nino kicks up allergy season 2/23/98 Trib.com - El Nino storminess washing away Golden State's winter tourism business 2/23/98 San Francisco Gate - Food too pricey? Blame El Niño 2/23/98 Washington Post - Potent El Nino Storm Wallops Calif 2/23/98 Washington Post - El Nino Jet Streams Give Soggy Weather a Powerful Push 2/23/98 CNN - Rain drenches Southeast; El Niño returning to West Coast 2/21/98 CNN - A new role for the microwave ... Drying out checks soaked by El Niño 2/21/98 Washington Post - El Nino Dries Up Hawaiian Island 2/21/98 Washington Post - El Nino Storms Devastate Honduras 2/21/98 CNN - El Niño dries up island of Hawaii 2/21/98 CNN - UN reports intensifying El Nino over Peru 2/20/98 Christian Science Monitor - Strange Days: Life With El Niño 2/20/98 Space Online - El Niño warm water pool is thinning 2/20/98 USA Today - El Niño smiles on Tahoe skiers 2/19/98 MSNBC - El Niño threatens NW snow pack 2/19/98 CNN - Honduras chicken deaths blamed on El Nino 2/19/98 CNN - El Nino forces sea lions to land on Chile beaches 2/19/98 San Francisco Gate - El Niño storms back on track 2/17/98 Reuters - Calif. Rain Breaks El Nino Record 2/17/98 Washington Post - New El Nino Storm Sloshes Into Soggy California 2/17/98 CNN - From California to Florida, El Niño hits again 2/16/98 CNN - Peru leader's popularity rises with El Nino work 2/16/98 ABC - The Southland Prepares For the Next El Nino Driven Storm 2/16/98 Mail&Guardian (South Africa) - El Niño unleashes floods, plagues 2/16/98 MSNBC - El Niño drenches region anew 2/16/98 Time Magazine - The Fury Of El Nino 2/15/98 MSNBC - What’s ahead for El Niño? Forecasters are predicting a cold front in next few months 2/15/98 CNN - Sea lion pups struggle against El Niño's wrath 2/14/98 CNN - El Niño brings flamingos back to lake in Kenya 2/13/98 Washington Post - El Nino to Last Through April, Forecasters Predict 2/13/98 CNN - Computer models were right about El Niño 2/13/98 Trib.com - Mudslides the next El Nino threat in California 2/12/98 CNN - El Niño to continue wreaking havoc into summer 2/12/98 USA Today - El Niño will continue into summer 2/12/98 MSNBC - El Niño expected to linger in U.S. 2/12/98 ABC - El Niño Sticking Around - Forecast Through Early Summer 2/11/98 MSNBC - El Niño batters northern Peru 2/9/98 CNN - El Nino effect suspected in China whale beachings 2/9/98 CNN - El Niño rings drought to Colombia 2/9/98 ABC - El Niño Pulls Punch - But More Storms on the Way 2/9/98 ABC - Did El Niño Beach Whales? 2/9/98 Reuters - California Braces for Another El Nino Storm 2/8/98 Sun Herald - El Nino can dampen gardening 2/7/98 CNN - Peru's Fujimori defends his fight against El Nino 2/4/98 Irish Times - El Nino effect to peak in coming weeks 2/4/98 CNN - What a winter: El Niño's double-whammy 2/4/98 CNN - El Niño sparks flamingos' return to Kenya lake 2/4/98 CNN - El Niño predictions on target -- so far 2/4/98 Washington Post - El Niño Storms Slam U.S. Coasts 2/3/98 BBC - El Niño to slow economic growth 2/3/98 MSNBC - El Niño storm shocks Southland 2/3/98 MSNBC - El Niño-powered rainstorm drenches San Diego 2/3/98 MSNBC - El Nino arrives on Central Coast 2/2/98 CNN - Fever spreads in El Niño's path, killing 14 in Peru 2/2/98 ABC - El Nino Delivers More Rain, Heavy Winds & High Surf 2/2/98 BBC - El Nino encourages mosquitoes in South America 2/2/98 Philadelphia Daily News - Some urge El Nino: Cool it 2/1/98 San Francisco Chronicle - Rain got you down? El Niño has Californians bumming out. 2/1/98 San Jose Mercury News - El Nino still lurking in the Pacific 2/1/98 CNNSI - Blame it on El Niño. Soggy Pebble Beach Pro-Am suspended until Monday

Total Precipitation
Precipitation Anomaly
Total PrecipitationTotal Precipitation Feb 1998Feb 1998

Parameter-elevation RegressionsParameter-elevation Regressionson Independent Slopes Model (PRISM)on Independent Slopes Model (PRISM)
• PRISM uses point data, DEM, and other spatial data sets to generate estimates of annual, monthly, and event-based climate elements
• Vertical extrapolation in complex terrain through simple linear climate-elevation regression

AgendaAgenda• To provide an overview of downscaling
and its applications. – Subject matter experts will provide details in
their respective areas of expertise

PredictabilityPredictability

Downscaling and PredictabilityDownscaling and Predictability• Predictability: The time evolution of uncertainty
associated with the initial state• Small scales lose predictability more rapidly than large
scales. Lorenz (1969) provided early estimates…
Wavelength (km) Predictability 8000 ~5 days 1000 ~1 day
100 ~5 hours 10 ~1 hour
• Doubling time of small initial errors is 1 to 2 days• Predictability of large-scale waves 10 to 14 days• The exception to the rule…
– Strong boundary effects (topography; land/sea contrast) enhance predictability

Downscaling and PredictabilityDownscaling and Predictability
• Forced mode: Develop as a result of large-scale interaction with surface boundary forcing– Forced-mode phenomena generally enhance
predictability and are therefore inherently easier to downscale
• Free mode: Develop in-situ from the large-scale background environment

Examples of forced-mode Examples of forced-mode phenomenaphenomena
• Puget Sound Convergence Zone (PSCZ)• Denver cyclone vorticity zone (DCVZ)• Gap winds• Barrier jets and cold air damming• Terrain modulation of precipitation• Lee wind storms• Select gravity waves• Lake effect snow storms

Puget Sound Convergence Zone
TERRAIN (meters)
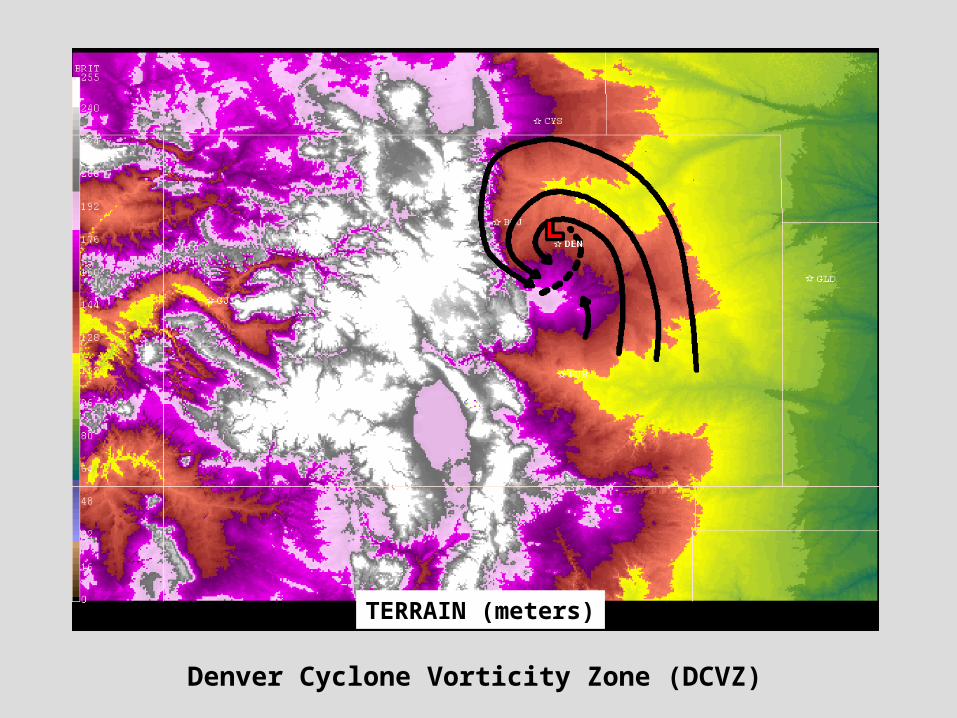
Denver Cyclone Vorticity Zone (DCVZ)
TERRAIN (meters)
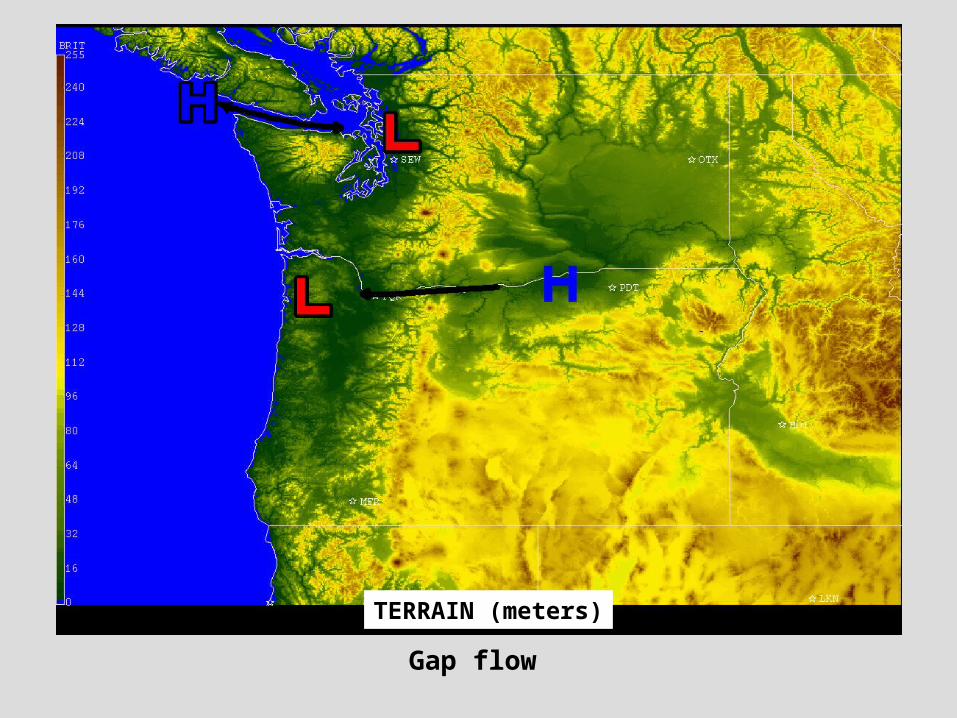
Gap flow
TERRAIN (meters)

Cold air damming and Barrier Jet
TERRAIN (meters)

Examples of free-mode Examples of free-mode phenomenaphenomena
• Precipitation bands (CSI; frontogenesis)
• Convective complexes and squall lines
• Jet streaks
• Polar lows (Arctic hurricanes)
• Gravity waves
• Tropical storms and hurricanes

Precipitation Banding
Composite Reflectivity (dbz) 18 UTC 14 March 2002

Jet Streak
Water Vapor Imagery 1743 UTC 14 March 2002

IR Imagery 0345 UTC 31 May 1998
Mesoscale Convective System (MCS)

Polar Lows

Prognostic ModelsPrognostic Models

• “Easiest” way to downscale: run a higher resolution model• High-resolution simulations using prognostic models
– Resolution dependent on operational/research requirement
• Computationally expensive – Time consuming to produce– CPU resources unavailable for other uses (e.g., ensembles)
• Huge quantities of output – Slow data transfer and interrogation
• Higher temporal and spatial resolution always desirable• Examples
– Downscaled GFS with Eta Extension (DGEX)– WFO/University controlled WRF, MM5, WS-Eta, RSM, RAMS, etc.
Prognostic ModelsPrognostic Models
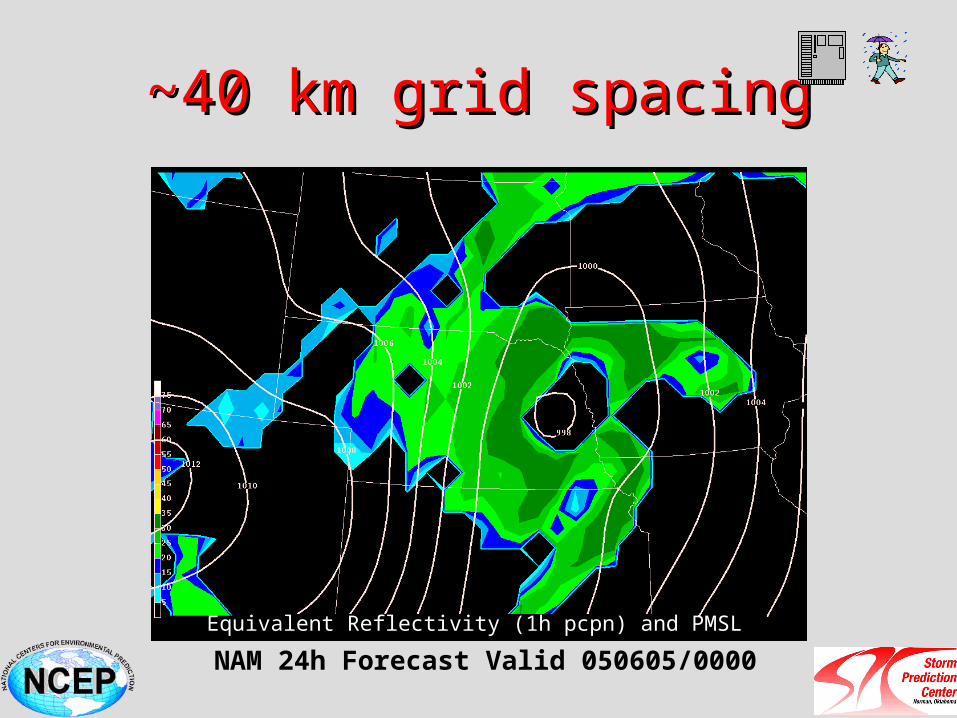
~40 km grid spacing~40 km grid spacing
Equivalent Reflectivity (1h pcpn) and PMSL
NAM 24h Forecast Valid 050605/0000

WRF (2 KM) 24h Forecast Valid 050605/0000
1 KM AGL Reflectivity and PMSL
~2 km grid spacing~2 km grid spacing

Nested ModelsNested Models
• Downscaled GFS with Eta Extension (DGEX)– F084 through F192 (to assist with NDFD)– Eta (12 km grid spacing) one-way nested over
North America with GFS LBCs
GFS F180 Valid 18 UTC 20 Jan 2006 DGEX F180 Valid 18 UTC 20 Jan 2006

Copyright ©2005 by the National Academy of Sciences
Diffenbaugh, Noah S. et al. (2005) Proc. Natl. Acad. Sci. USA 102, 15774-15778
(a) Anomalies (A2 - RF) in T95 event frequency (days/year), (b) T95 mean heat-wave length (days/event),(c) T05 event frequency (days/year) , and (d) 95th-percentile cold-event value (degC)
High-Res Climate ModelingHigh-Res Climate Modeling
Longer heatwaves (days)
Less severecold outbreaks(degC)
Less cold days(days/year)
More hot days (days/year)

• Perhaps the “easiest” way to downscale: run a higher resolution model– Often, not a practical approach
• Examine some of the other methods
Summary Prognostic ModelsSummary Prognostic Models

Diagnostic ModelsDiagnostic Modelsandand
HydrometeorologicalHydrometeorologicalElementsElements

Downscaling TemperatureDownscaling Temperature
Standard Atmosphere
Lapse Rates
Dry Adiabatic: 10.0o C/km
Moist Adiabatic: ~5.5o C/km
Standard Atmosphere: 6.5o C/km
This very simple approach fails to account for inversions or non-standard layers
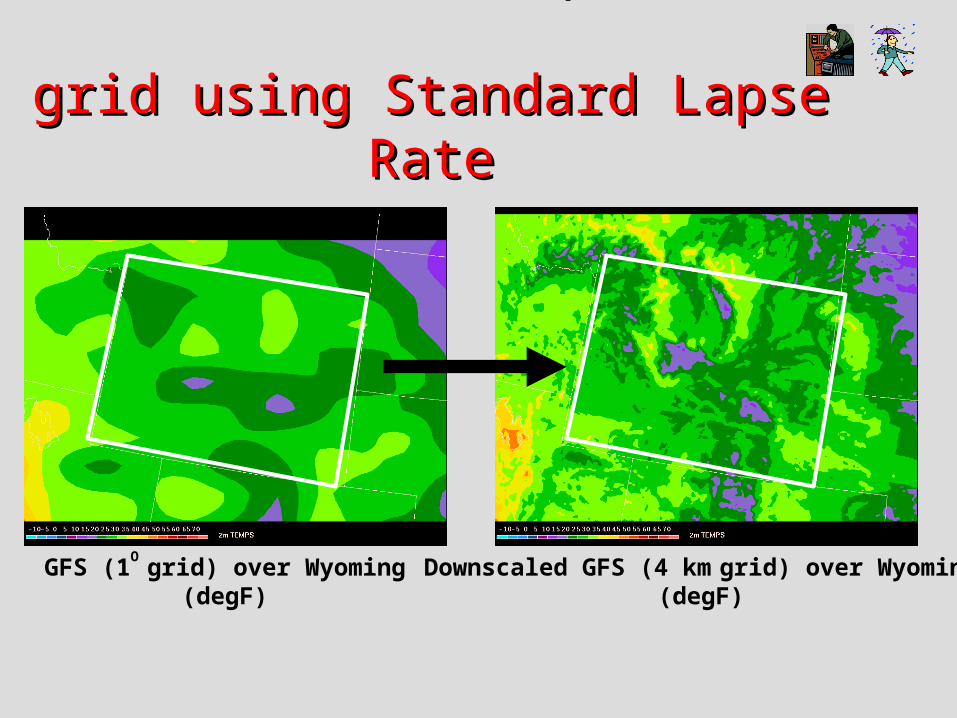
Downscale GFS Temp to 4 km Downscale GFS Temp to 4 km grid using Standard Lapse Rategrid using Standard Lapse Rate
GFS (1O
grid) over Wyoming(degF)
Downscaled GFS (4 km grid) over Wyoming
(degF)

Example: HPC Downscaling of Example: HPC Downscaling of Temp. and Precip.Temp. and Precip.
• Downscale to 5 km grid
• Begin with point forecast at 380 sites
NCEP/HPC example from Pete Manousos
http://www.hpc.ncep.noaa.gov/5km_grids/5km_gridsbody.html

How does HPC derive 5km detail How does HPC derive 5km detail from 380 points?from 380 points?
• 5km PRISM data is used as a starting point
• Difference between HPC and PRISM data taken at all HPC forecast points (380)
• A “difference grid” is generated– Results in a fairly smooth
5km grid showing departure from normal
• The “difference grid” is then added back to the PRISM data– Restores the PRISM
resolution to the forecast
AgendaAgenda• To provide an overview of downscaling
and its applications. – Subject matter experts will provide details in
their respective areas of expertise
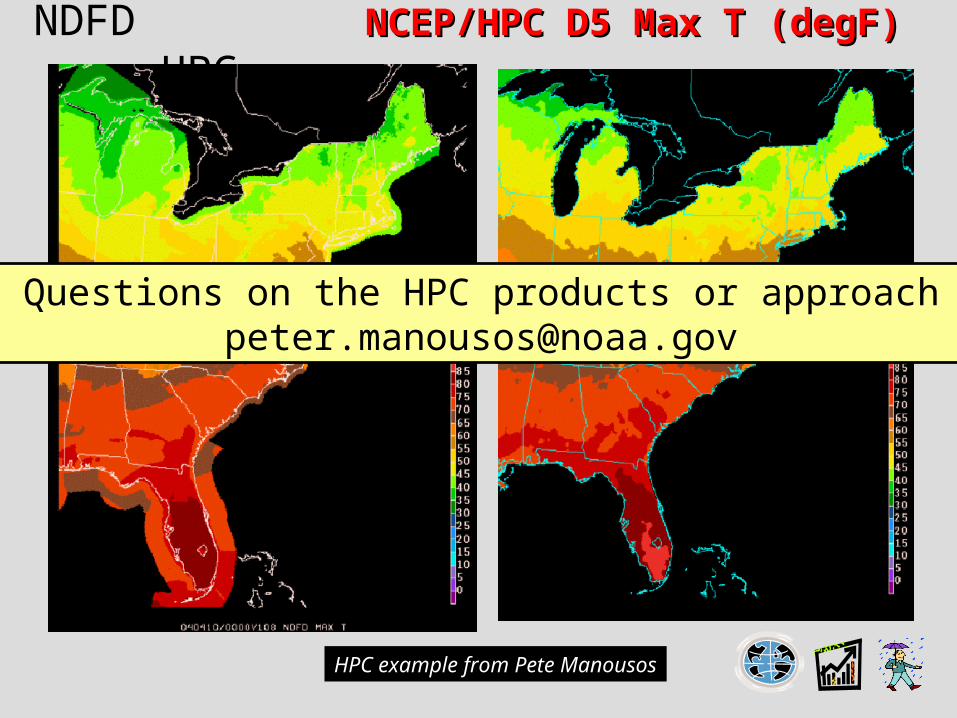
NDFD NCEP/HPC D5 Max T (degF)NCEP/HPC D5 Max T (degF) HPC
HPC example from Pete Manousos
??? Questions on the HPC products or approach [email protected]

Downscaling PrecipitationDownscaling Precipitation
Elevation (m) Precipitation (in)PRISM annual pcpn fromhttp://www.ocs.orst.edu/prism/

NCEP/HPC 40 km accum grid downscaled to 5km using PRISM dataNCEP/HPC 40 km accum grid downscaled to 5km using PRISM data
Day 1 HPC 5 km Snowfall
Forecast (inches)
http://www.hpc.ncep.noaa.gov/wwd/winter_wx.shtml
HPC example from Pete Manousos
Minimal changeover smoothterrain
Considerable detail introducedover complexterrain
Area average preserving interpolation: Mesinger (1996); Accadia et al. (2003)
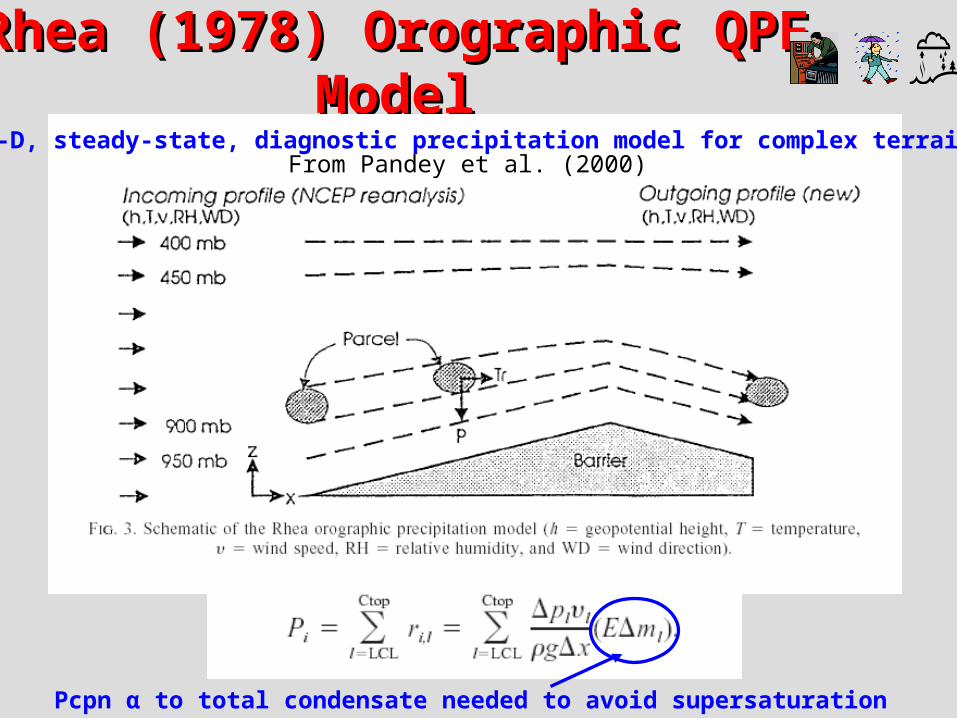
Rhea (1978) Orographic QPFRhea (1978) Orographic QPF Model Model
2-D, steady-state, diagnostic precipitation model for complex terrainFrom Pandey et al. (2000)
Pcpn α to total condensate needed to avoid supersaturation

Mountain Mapper Mountain Mapper (Precipitation analysis in complex (Precipitation analysis in complex
terrain)terrain)
• Used by RFCs in Western U.S.
• Spatial analysis of gage precipitation amounts to determine basin average QPFs or QPEs
• Objective analysis [inverse distance weight (1/r2)] applied to fraction of normal pcpn at gage sites
PRISM data then used to downscale fraction of normal analysis
Mountain Mapper info: See Schaake et al. (2004)

RFC Example: RFC Example: Mountain Mapper QPEMountain Mapper QPE

From the CNRFC(California Nevada RiverForecast Center)

AgendaAgenda• To provide an overview of downscaling
and its applications. – Subject matter experts will provide details in
their respective areas of expertise

Downscaling WindDownscaling Wind
• Predictability (spatial and temporal) enhanced for thermally driven wind systems in complex terrain– Water/land winds– Slope winds– Valley winds

W > 0
W < 0
Water/Land BreezesWater/Land Breezes(No large scale flow)(No large scale flow)
Figures from Pielke (1984)
Idealized sea and land breeze Idealized divergence dueto coastline configuration

WRF-NMM 4.5 KMWRF-NMM 4.5 KM
10 m winds and mass divergenceF019 Valid 19 UTC 18 May 2005

Climatology of ThunderstormsClimatology of ThunderstormsAlong CoastlineAlong Coastline
From Watson et al. (2005); See also Lericos et al. (2002)May – September 1989-2003 (2.5 km grid)

AgendaAgenda• To provide an overview of downscaling
and its applications. – Subject matter experts will provide details in
their respective areas of expertise

Wind System TerminologyWind System Terminology
From Whiteman (1990)
Up-Valley Wind
Up-Slope Wind
Down-Valley Wind
Down-Slope Wind
DAY NIGHT

Diurnal Variation of Slope/Valley Diurnal Variation of Slope/Valley Wind SystemWind System
From Whiteman (1990); Adapted from Hawkes 1947
Morning Afternoon
EveningLate night
AfternoonMorning
Late night
Evening

MesoWest Wind ClimatologyMesoWest Wind Climatology
00 UTC (4 PM LST)Western U.S. available at:
http://www.met.utah.edu/jimsteen/jstewart/mtnwind.htmlStewart et al. (2002)

Downscaling Wind in Complex Downscaling Wind in Complex TerrainTerrain
• Winds on Critical Streamlines (WOCSS)– Ludwig et al. (1991); Bridger et al. (1994); Ludwig and
Sinton (1998)– WOCSS is a diagnostic model (or objective analysis)
based on horizontal mass conservation– The vertical displacement of a parcel is a balance
between kinetic energy of the flow and potential energy gained by displacement against stable stratification
• Input: Soundings of wind and temperature• Output: High-resolution, 3-D wind fields

WOCSS ExampleWOCSS Example
Example of downscaledwind analysis to 1 kmgrid using the WOCSSMethod (Drake et al. 2006) - Soundings from Oakland and Vandenberg AF Base - Obs from stations as shown
Without radar winds
With radar winds

AgendaAgenda• To provide an overview of downscaling
and its applications. – Subject matter experts will provide details in
their respective areas of expertise

Statistical MethodsStatistical Methods

• Computationally efficient method of downscaling
• Sometimes difficult to capture rare events
• Examples: MOS
Statistical MethodsStatistical Methods

Applications of Linear RegressionApplications of Linear Regression
• MOS (Model Output Statistics): Regression equations between model forecast variables and observed variables to correct or predict wether elements. Separate MOS equations are developed for different forecast projections.
• PP (Perfect Prognosis): As above, but makes no effort to account for model errors or biases; assumes forecast is perfect; i.e., a single equation serves all forecast times.
(see Glahn and Lowry 1972)
(see Klein et al. 1959)

AgendaAgenda• To provide an overview of downscaling
and its applications. – Subject matter experts will provide details in
their respective areas of expertise
Popular Statistical MethodsPopular Statistical Methods
• Quadratic regression
• Nonlinear or Logistic regression
• Neural networks

Example: Quadratic RegressionExample: Quadratic Regression
E.g., Shear vs. Precipitation Efficiency (Marwitz 1972)

Example: Example: Logistic RegressionLogistic Regression
Perfect prog approach using logistic regression is one tool available for 3h thunderstormguidance at the SPC Bothwell (2005)
Probability of thunderstorm valid 10 Jan 06 12-15 UTC
Use with a discrete dependent variable (0 or 1)
E.g., Perfect prog thunder forecast (Bothwell 2005)

Example: Example: Neural NetworksNeural Networks
Photo by Randy Baum, www.nps.gov
http://sanders.math.uwm.edu/cgi-bin-snowratio/sr_intro.pl
Neural networks area form of artificial intelligence that usepattern matching topredict an outcome.
Training may beslow; after training, an arithmetic expression is used toto predict outputs.
Roebber et al. (2003)Neural network used for snow density forecasts

Analog MethodsAnalog Methods
Analog methods: Methods of forecasting that involve searching historical meteorological records for previous events or flow patterns similar to the current situation, then making aprediction based on those past events or patterns.

Analog MethodsAnalog Methods
http://www.cdc.noaa.gov/reforecast/narr
Information on reforecasting, see Hamill et al. (2004)

Analog MethodsAnalog Methods
24h probability of > 2.5 mm precipitationValid time ending 00 UTC 15 Jan 2006
See: http://www.cdc.noaa.gov/people/jeffrey.s.whitaker/Manuscripts/reforecast_bams4.pdf

Analog MethodsAnalog Methods
Verification of 24h probability of > 2.5 mm precipitation ending at Day 3

• Real-Time Mesoscale Analysis (RTMA)
• Analysis of Record (AOR)
Slide from Brad Colman
• RTMA / AOR details… http://www.nws.noaa.gov/ost/ifps_sst/presentations/AOR-RTMA_SeminarDiMego100505.ppt

References included in your notebook

AgendaAgenda• To provide an overview of downscaling and its
applications. – Subject matter experts will provide details in their respective
areas of expertise