Overview of Dietary Reference Intakes for Japanese (2015) · PDF fileOverview of Dietary...
42
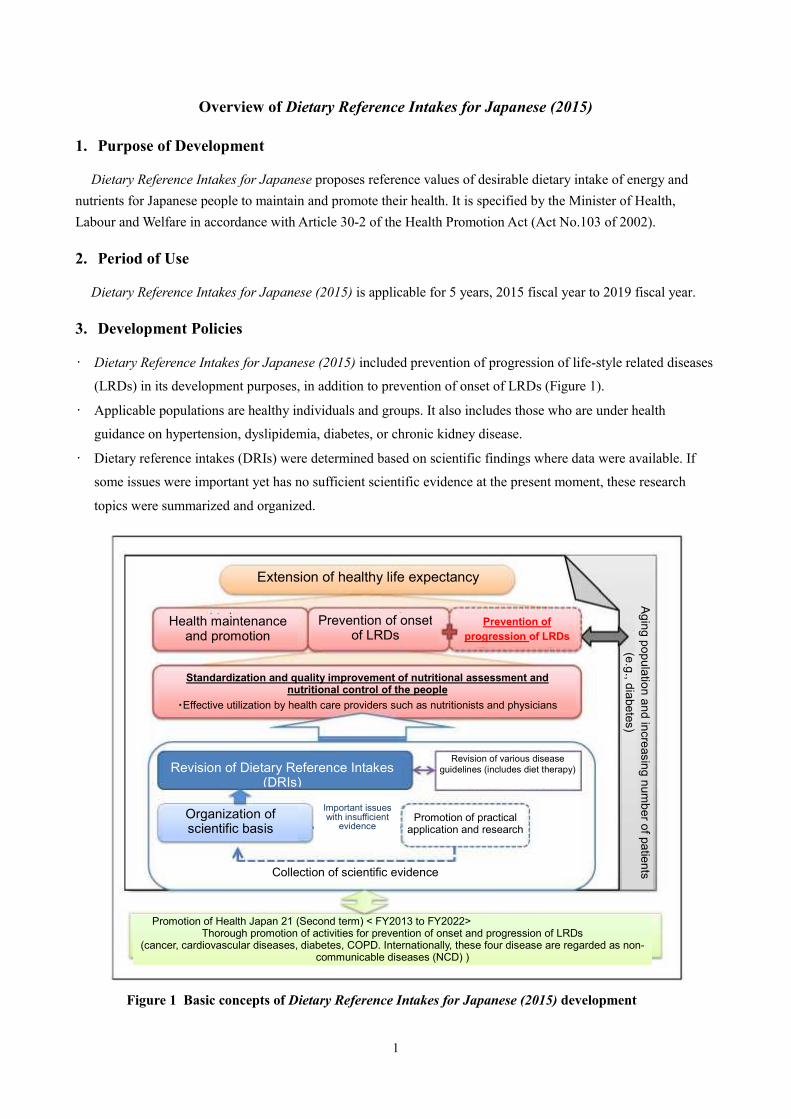
1 Overview of Dietary Reference Intakes for Japanese (2015) 1. Purpose of Development Dietary Reference Intakes for Japanese proposes reference values of desirable dietary intake of energy and nutrients for Japanese people to maintain and promote their health. It is specified by the Minister of Health, Labour and Welfare in accordance with Article 30-2 of the Health Promotion Act (Act No.103 of 2002). 2. Period of Use Dietary Reference Intakes for Japanese (2015) is applicable for 5 years, 2015 fiscal year to 2019 fiscal year. 3. Development Policies • Dietary Reference Intakes for Japanese (2015) included prevention of progression of life-style related diseases (LRDs) in its development purposes, in addition to prevention of onset of LRDs (Figure 1). • Applicable populations are healthy individuals and groups. It also includes those who are under health guidance on hypertension, dyslipidemia, diabetes, or chronic kidney disease. • Dietary reference intakes (DRIs) were determined based on scientific findings where data were available. If some issues were important yet has no sufficient scientific evidence at the present moment, these research topics were summarized and organized. Figure 1 Basic concepts of Dietary Reference Intakes for Japanese (2015) development Extension of healthy life expectancy Health maintenance and promotion Revision of Dietary Reference Intakes (DRIs) Revision of various disease guidelines (includes diet therapy) Organization of scientific basis Important issues with insufficient evidence Promotion of practical application and research Collection of scientific evidence Promotion of Health Japan 21 (Second term) < FY2013 to FY2022> Thorough promotion of activities for prevention of onset and progression of LRDs (cancer, cardiovascular diseases, diabetes, COPD. Internationally, these four disease are regarded as non- communicable diseases (NCD) ) Aging population and increasing number of patients (e.g., diabetes) Prevention of onset of LRDs Prevention of progression of LRDs Standardization and quality improvement of nutritional assessment and nutritional control of the people ・Effective utilization by health care providers such as nutritionists and physicians
Transcript of Overview of Dietary Reference Intakes for Japanese (2015) · PDF fileOverview of Dietary...
1
Overview of Dietary Reference Intakes for Japanese (2015) 1. Purpose of Development
Dietary Reference Intakes for Japanese proposes reference values of desirable dietary intake of energy and nutrients for Japanese people to maintain and promote their health. It is specified by the Minister of Health, Labour and Welfare in accordance with Article 30-2 of the Health Promotion Act (Act No.103 of 2002). 2. Period of Use
Dietary Reference Intakes for Japanese (2015) is applicable for 5 years, 2015 fiscal year to 2019 fiscal year. 3. Development Policies
• Dietary Reference Intakes for Japanese (2015) included prevention of progression of life-style related diseases
(LRDs) in its development purposes, in addition to prevention of onset of LRDs (Figure 1).
• Applicable populations are healthy individuals and groups. It also includes those who are under health
guidance on hypertension, dyslipidemia, diabetes, or chronic kidney disease.
• Dietary reference intakes (DRIs) were determined based on scientific findings where data were available. If
some issues were important yet has no sufficient scientific evidence at the present moment, these research
topics were summarized and organized.
Figure 1 Basic concepts of Dietary Reference Intakes for Japanese (2015) development
Extension of healthy life expectancy
Health maintenance and promotion
Revision of Dietary Reference Intakes (DRIs)
Revision of various disease guidelines (includes diet therapy)
Organization of scientific basis
Important issues with insufficient
evidence
Promotion of practical application and research
Collection of scientific evidence
Promotion of Health Japan 21 (Second term) < FY2013 to FY2022> Thorough promotion of activities for prevention of onset and progression of LRDs
(cancer, cardiovascular diseases, diabetes, COPD. Internationally, these four disease are regarded as non-communicable diseases (NCD) )
Aging population and increasing num
ber of patients (e.g., diabetes)
Prevention of onset of LRDs
Prevention of progression of LRDs
Standardization and quality improvement of nutritional assessment and nutritional control of the people
・Effective utilization by health care providers such as nutritionists and physicians
2
4. Basic Matters of Development
1) Reference values For Energy
Body mass index (BMI) was adopted as the reference of the balance of energy intake and consumption (energy balance).
BMI = body weight(kg) ÷(body height (m))2 For Nutrients
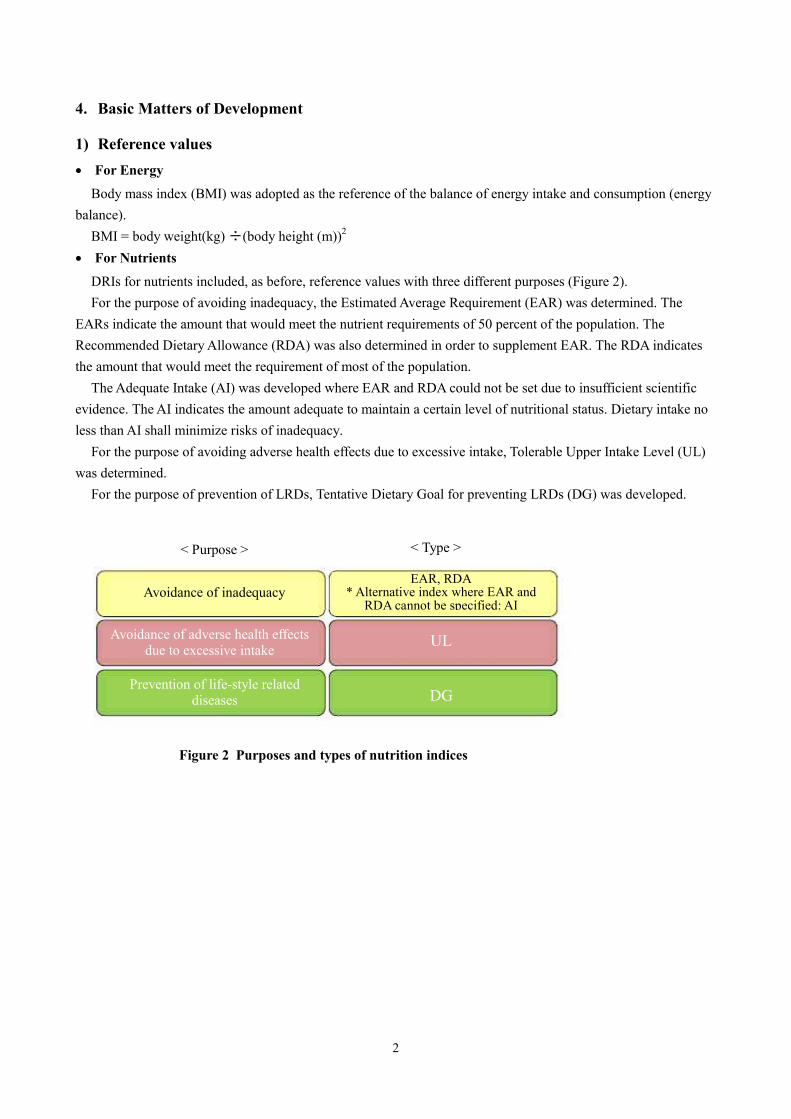
DRIs for nutrients included, as before, reference values with three different purposes (Figure 2). For the purpose of avoiding inadequacy, the Estimated Average Requirement (EAR) was determined. The
EARs indicate the amount that would meet the nutrient requirements of 50 percent of the population. The Recommended Dietary Allowance (RDA) was also determined in order to supplement EAR. The RDA indicates the amount that would meet the requirement of most of the population.
The Adequate Intake (AI) was developed where EAR and RDA could not be set due to insufficient scientific evidence. The AI indicates the amount adequate to maintain a certain level of nutritional status. Dietary intake no less than AI shall minimize risks of inadequacy.
For the purpose of avoiding adverse health effects due to excessive intake, Tolerable Upper Intake Level (UL) was determined.
For the purpose of prevention of LRDs, Tentative Dietary Goal for preventing LRDs (DG) was developed.
Figure 2 Purposes and types of nutrition indices
< Purpose > < Type >
Avoidance of inadequacy EAR, RDA
* Alternative index where EAR and RDA cannot be specified: AI
Avoidance of adverse health effects due to excessive intake UL
Prevention of life-style related diseases DG
3
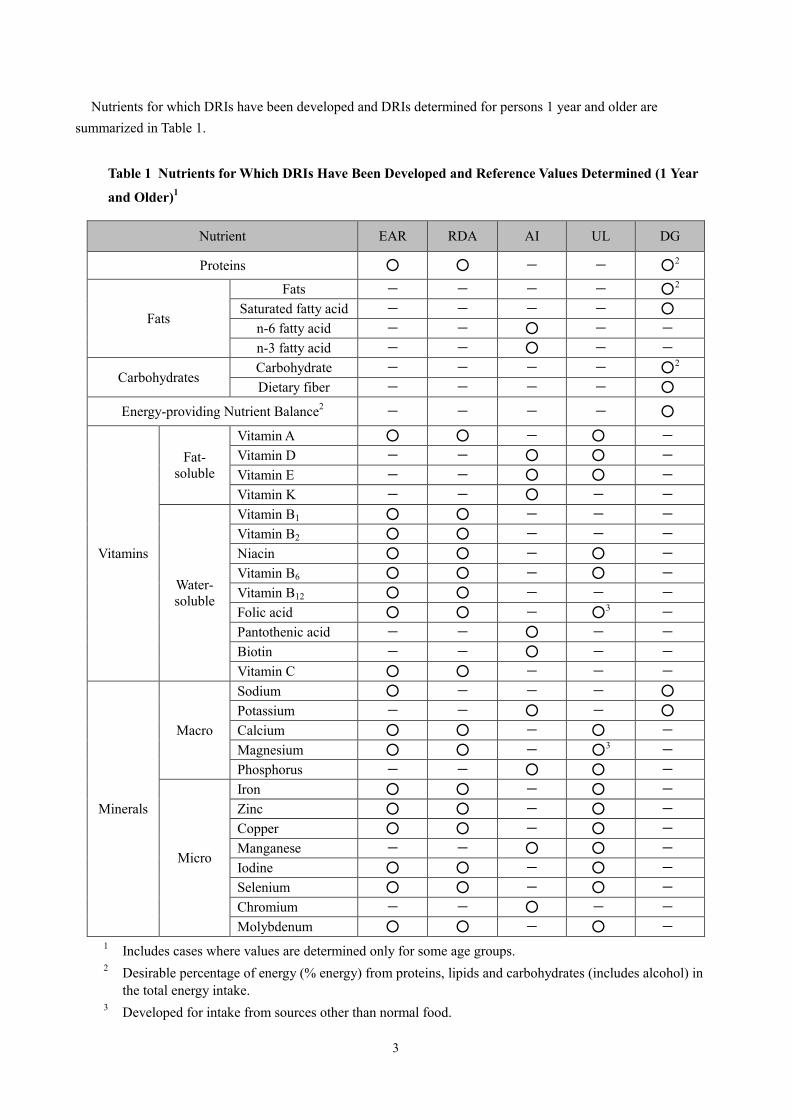
Nutrients for which DRIs have been developed and DRIs determined for persons 1 year and older are summarized in Table 1.
Table 1 Nutrients for Which DRIs Have Been Developed and Reference Values Determined (1 Year
and Older)1
Nutrient EAR RDA AI UL DG
Proteins ○ ○ — — ○2
Fats
Fats — — — — ○2
Saturated fatty acid — — — — ○
n-6 fatty acid — — ○ — —
n-3 fatty acid — — ○ — —
Carbohydrates Carbohydrate — — — — ○2
Dietary fiber — — — — ○
Energy-providing Nutrient Balance2 — — — — ○
Vitamins
Fat-soluble
Vitamin A ○ ○ — ○ —
Vitamin D — — ○ ○ —
Vitamin E — — ○ ○ —
Vitamin K — — ○ — —
Water-soluble
Vitamin B1 ○ ○ — — —
Vitamin B2 ○ ○ — — —
Niacin ○ ○ — ○ —
Vitamin B6 ○ ○ — ○ —
Vitamin B12 ○ ○ — — —
Folic acid ○ ○ — ○3 —
Pantothenic acid — — ○ — —
Biotin — — ○ — —
Vitamin C ○ ○ — — —
Minerals
Macro
Sodium ○ — — — ○
Potassium — — ○ — ○
Calcium ○ ○ — ○ —
Magnesium ○ ○ — ○3 —
Phosphorus — — ○ ○ —
Micro
Iron ○ ○ — ○ —
Zinc ○ ○ — ○ —
Copper ○ ○ — ○ —
Manganese — — ○ ○ —
Iodine ○ ○ — ○ —
Selenium ○ ○ — ○ —
Chromium — — ○ — —
Molybdenum ○ ○ — ○ — 1 Includes cases where values are determined only for some age groups. 2 Desirable percentage of energy (% energy) from proteins, lipids and carbohydrates (includes alcohol) in
the total energy intake. 3 Developed for intake from sources other than normal food.
4
2) Review methods and reference value revision policy • In the review of scientific data about energy and nutrients, intensive reviews were conducted for the items that
had been specified as pending issues in the previous version, Dietary Reference Intakes for Japanese (2010).
Especially, energy was reviewed in terms of energy balance, BMI and weight control.
• Associations between energy or each nutrient and prevention of onset or progression of LRDs (hypertension,
dyslipidemia, diabetes, chronic kidney diseases) were reviewed.
• Policies of reference value revisions are clearly described.
3) Age groups Age groups are the same as before (refer to the Age column of Table 2).
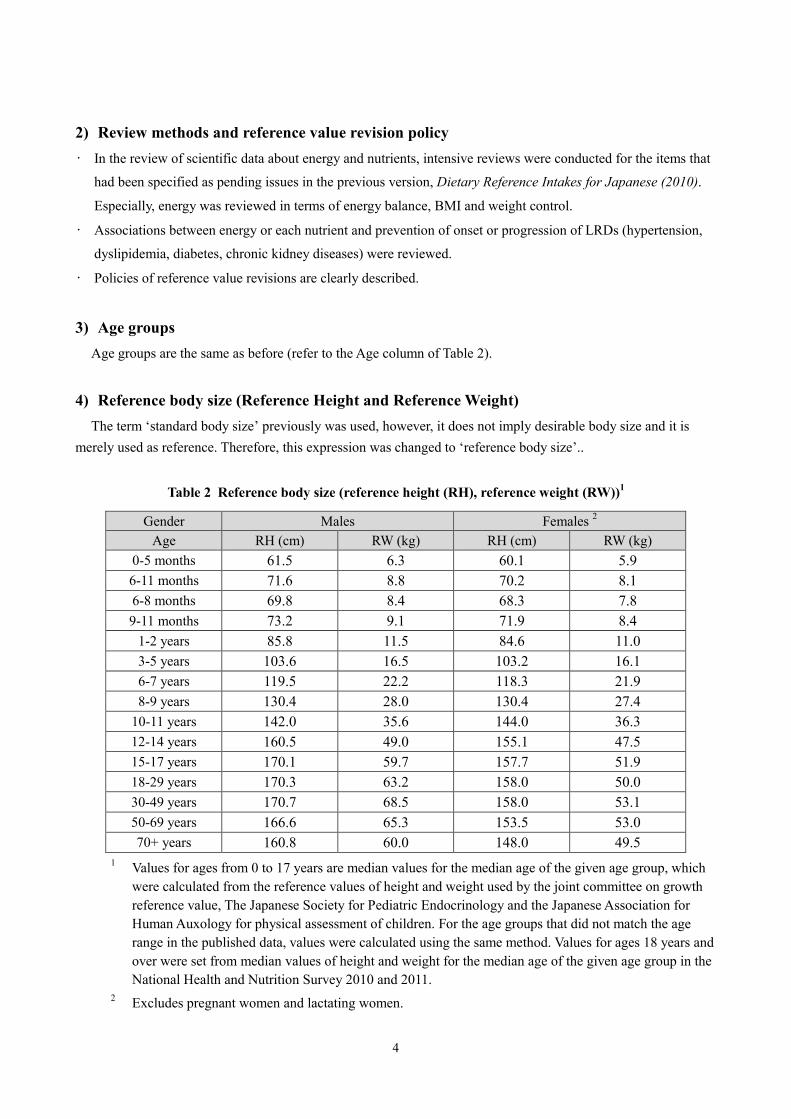
4) Reference body size (Reference Height and Reference Weight) The term ‘standard body size’ previously was used, however, it does not imply desirable body size and it is
merely used as reference. Therefore, this expression was changed to ‘reference body size’..
Table 2 Reference body size (reference height (RH), reference weight (RW))1
Gender Males Females 2 Age RH (cm) RW (kg) RH (cm) RW (kg)
0-5 months 61.5 6.3 60.1 5.9 6-11 months 71.6 8.8 70.2 8.1 6-8 months 69.8 8.4 68.3 7.8 9-11 months 73.2 9.1 71.9 8.4
1-2 years 85.8 11.5 84.6 11.0 3-5 years 103.6 16.5 103.2 16.1 6-7 years 119.5 22.2 118.3 21.9 8-9 years 130.4 28.0 130.4 27.4
10-11 years 142.0 35.6 144.0 36.3 12-14 years 160.5 49.0 155.1 47.5 15-17 years 170.1 59.7 157.7 51.9 18-29 years 170.3 63.2 158.0 50.0 30-49 years 170.7 68.5 158.0 53.1 50-69 years 166.6 65.3 153.5 53.0 70+ years 160.8 60.0 148.0 49.5
1 Values for ages from 0 to 17 years are median values for the median age of the given age group, which were calculated from the reference values of height and weight used by the joint committee on growth reference value, The Japanese Society for Pediatric Endocrinology and the Japanese Association for Human Auxology for physical assessment of children. For the age groups that did not match the age range in the published data, values were calculated using the same method. Values for ages 18 years and over were set from median values of height and weight for the median age of the given age group in the National Health and Nutrition Survey 2010 and 2011.
2 Excludes pregnant women and lactating women.
5
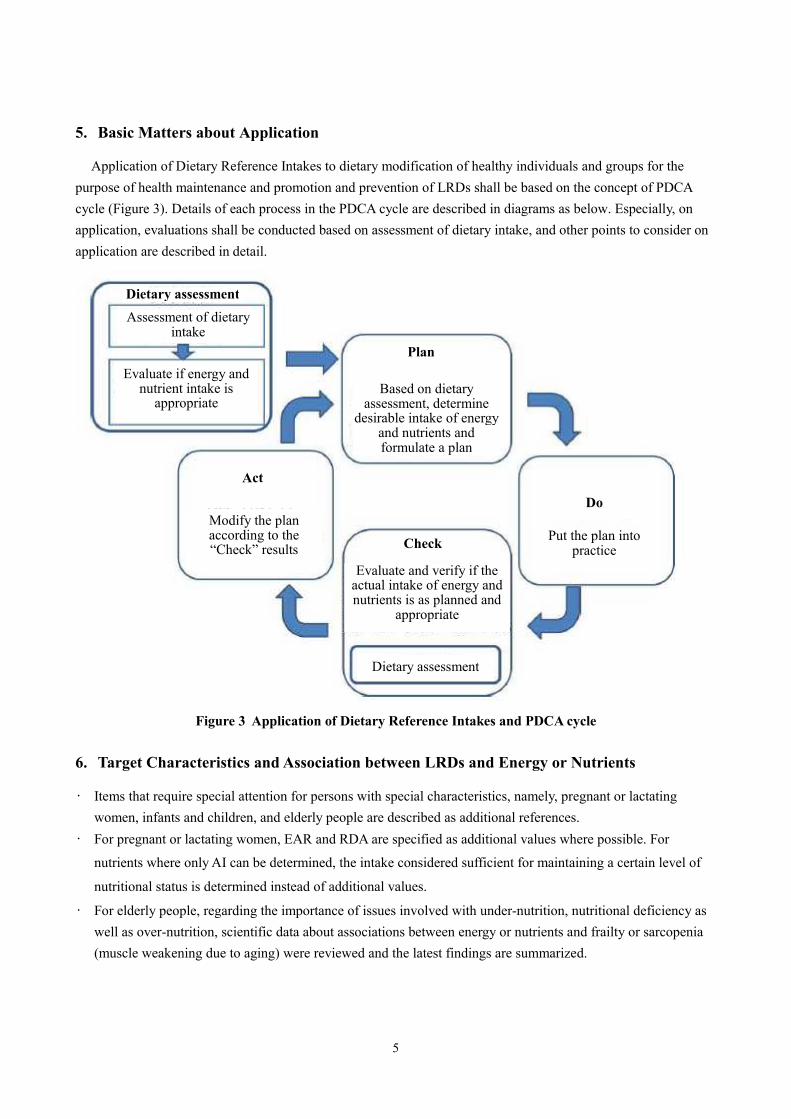
5. Basic Matters about Application
Application of Dietary Reference Intakes to dietary modification of healthy individuals and groups for the purpose of health maintenance and promotion and prevention of LRDs shall be based on the concept of PDCA cycle (Figure 3). Details of each process in the PDCA cycle are described in diagrams as below. Especially, on application, evaluations shall be conducted based on assessment of dietary intake, and other points to consider on application are described in detail.
Figure 3 Application of Dietary Reference Intakes and PDCA cycle
6. Target Characteristics and Association between LRDs and Energy or Nutrients
• Items that require special attention for persons with special characteristics, namely, pregnant or lactating women, infants and children, and elderly people are described as additional references.
• For pregnant or lactating women, EAR and RDA are specified as additional values where possible. For
nutrients where only AI can be determined, the intake considered sufficient for maintaining a certain level of
nutritional status is determined instead of additional values.
• For elderly people, regarding the importance of issues involved with under-nutrition, nutritional deficiency as well as over-nutrition, scientific data about associations between energy or nutrients and frailty or sarcopenia (muscle weakening due to aging) were reviewed and the latest findings are summarized.
Dietary assessment
Evaluate if energy and nutrient intake is
appropriate
Assessment of dietary intake
Plan
Based on dietary assessment, determine
desirable intake of energy and nutrients and formulate a plan
Act
Modify the plan according to the “Check” results Check
Evaluate and verify if the actual intake of energy and nutrients is as planned and
appropriate
Dietary assessment
Do Put the plan into
practice

6
• Regarding associations between nutritional intake and hypertension, dyslipidemia, diabetes, or chronic kidney diseases, especially important matters found through scientific reviews were summarized in diagrams and they are shown as additional references along with explanations.
7
7. Dietary Reference Intakes Developed
Energy
• Body mass index (BMI) was adopted as the reference to maintain the balance of energy intake and
consumption (energy balance). Target BMI was defined for 3 age categories of adults, according to
comprehensive investigation of BMI ranges with the lowest all-cause mortality reported in epidemiological
observational studies and actual BMI of Japanese people. Prevention and elimination of obesity as well as
prevention of under-nutrition (especially for elderly people) are important when attempting to achieve a target
BMI.
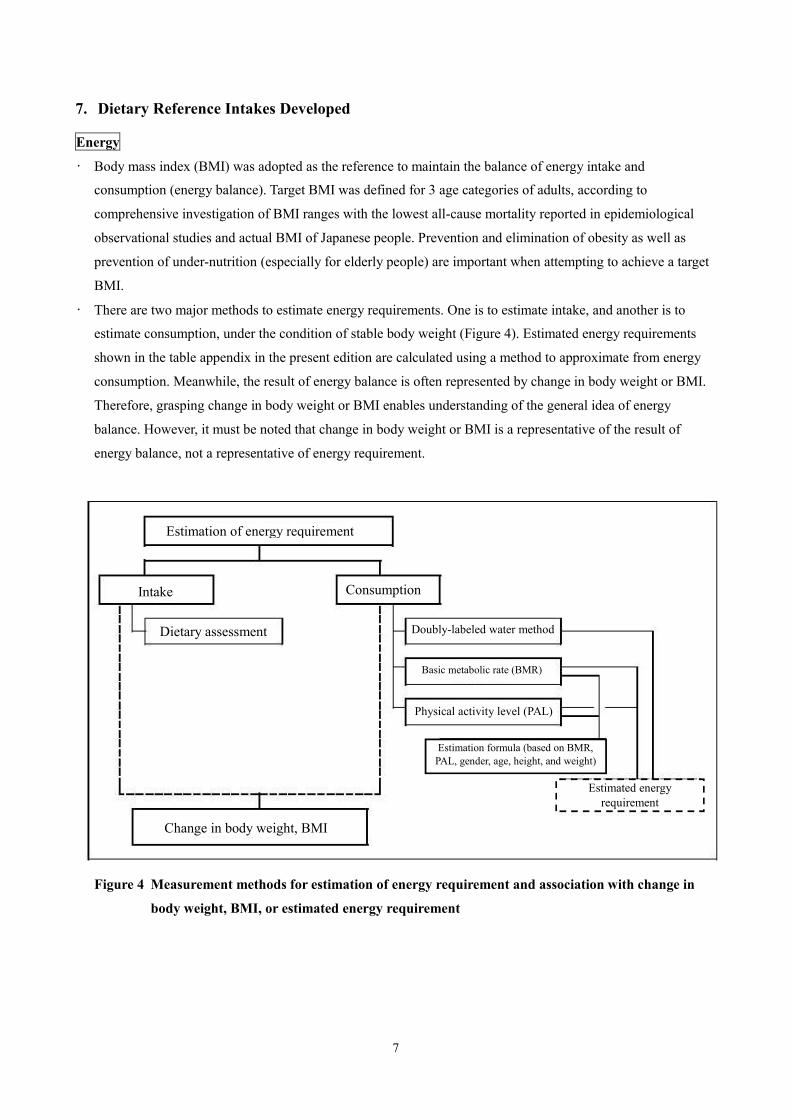
• There are two major methods to estimate energy requirements. One is to estimate intake, and another is to
estimate consumption, under the condition of stable body weight (Figure 4). Estimated energy requirements
shown in the table appendix in the present edition are calculated using a method to approximate from energy
consumption. Meanwhile, the result of energy balance is often represented by change in body weight or BMI.
Therefore, grasping change in body weight or BMI enables understanding of the general idea of energy
balance. However, it must be noted that change in body weight or BMI is a representative of the result of
energy balance, not a representative of energy requirement.
Figure 4 Measurement methods for estimation of energy requirement and association with change in
body weight, BMI, or estimated energy requirement
Estimation of energy requirement
Intake
Dietary assessment
Change in body weight, BMI
Consumption
Doubly-labeled water method
Basic metabolic rate (BMR)
Physical activity level (PAL)
Estimation formula (based on BMR, PAL, gender, age, height, and weight)
Estimated energy requirement
8
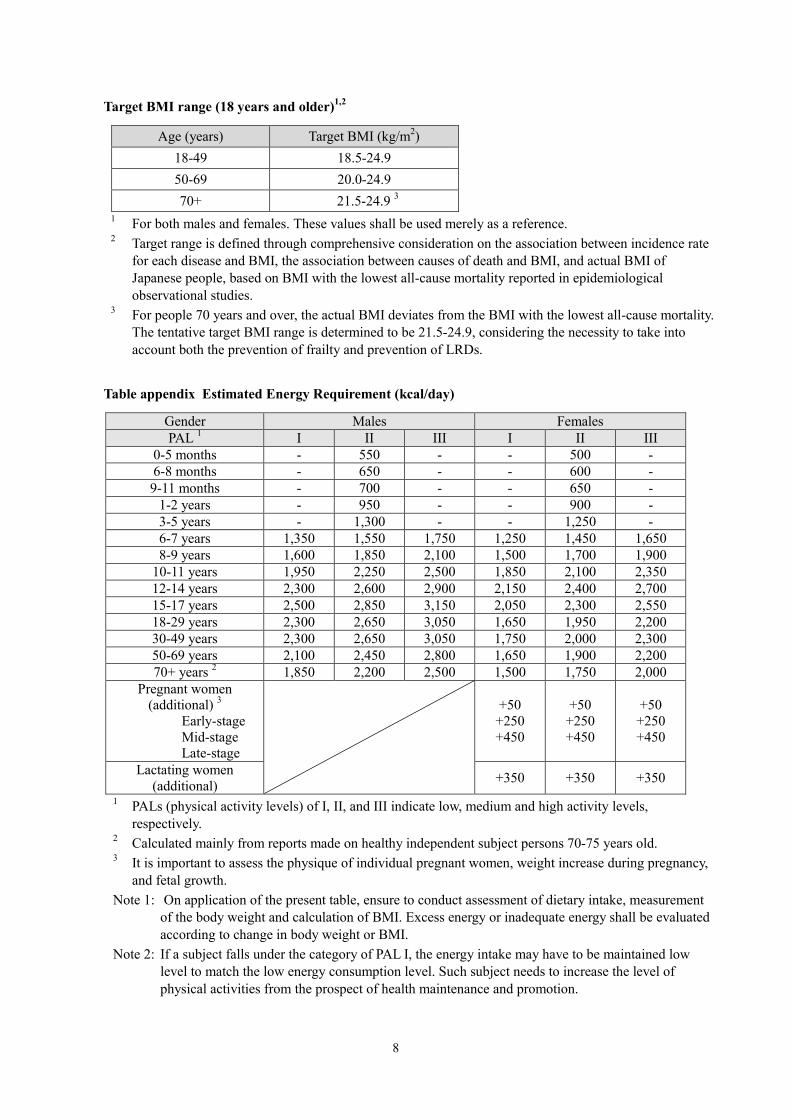
Target BMI range (18 years and older)1,2
Age (years) Target BMI (kg/m2) 18-49 18.5-24.9 50-69 20.0-24.9 70+ 21.5-24.9 3
1 For both males and females. These values shall be used merely as a reference. 2 Target range is defined through comprehensive consideration on the association between incidence rate
for each disease and BMI, the association between causes of death and BMI, and actual BMI of Japanese people, based on BMI with the lowest all-cause mortality reported in epidemiological observational studies.
3 For people 70 years and over, the actual BMI deviates from the BMI with the lowest all-cause mortality. The tentative target BMI range is determined to be 21.5-24.9, considering the necessity to take into account both the prevention of frailty and prevention of LRDs.
Table appendix Estimated Energy Requirement (kcal/day)
Gender Males Females PAL 1 I II III I II III
0-5 months - 550 - - 500 - 6-8 months - 650 - - 600 - 9-11 months - 700 - - 650 -
1-2 years - 950 - - 900 - 3-5 years - 1,300 - - 1,250 - 6-7 years 1,350 1,550 1,750 1,250 1,450 1,650 8-9 years 1,600 1,850 2,100 1,500 1,700 1,900
10-11 years 1,950 2,250 2,500 1,850 2,100 2,350 12-14 years 2,300 2,600 2,900 2,150 2,400 2,700 15-17 years 2,500 2,850 3,150 2,050 2,300 2,550 18-29 years 2,300 2,650 3,050 1,650 1,950 2,200 30-49 years 2,300 2,650 3,050 1,750 2,000 2,300 50-69 years 2,100 2,450 2,800 1,650 1,900 2,200 70+ years 2 1,850 2,200 2,500 1,500 1,750 2,000
Pregnant women (additional) 3
Early-stage Mid-stage Late-stage
+50 +250 +450
+50 +250 +450
+50 +250 +450
Lactating women (additional) +350 +350 +350
1 PALs (physical activity levels) of I, II, and III indicate low, medium and high activity levels, respectively.
2 Calculated mainly from reports made on healthy independent subject persons 70-75 years old. 3 It is important to assess the physique of individual pregnant women, weight increase during pregnancy,
and fetal growth. Note 1: On application of the present table, ensure to conduct assessment of dietary intake, measurement
of the body weight and calculation of BMI. Excess energy or inadequate energy shall be evaluated according to change in body weight or BMI.
Note 2: If a subject falls under the category of PAL I, the energy intake may have to be maintained low level to match the low energy consumption level. Such subject needs to increase the level of physical activities from the prospect of health maintenance and promotion.
9
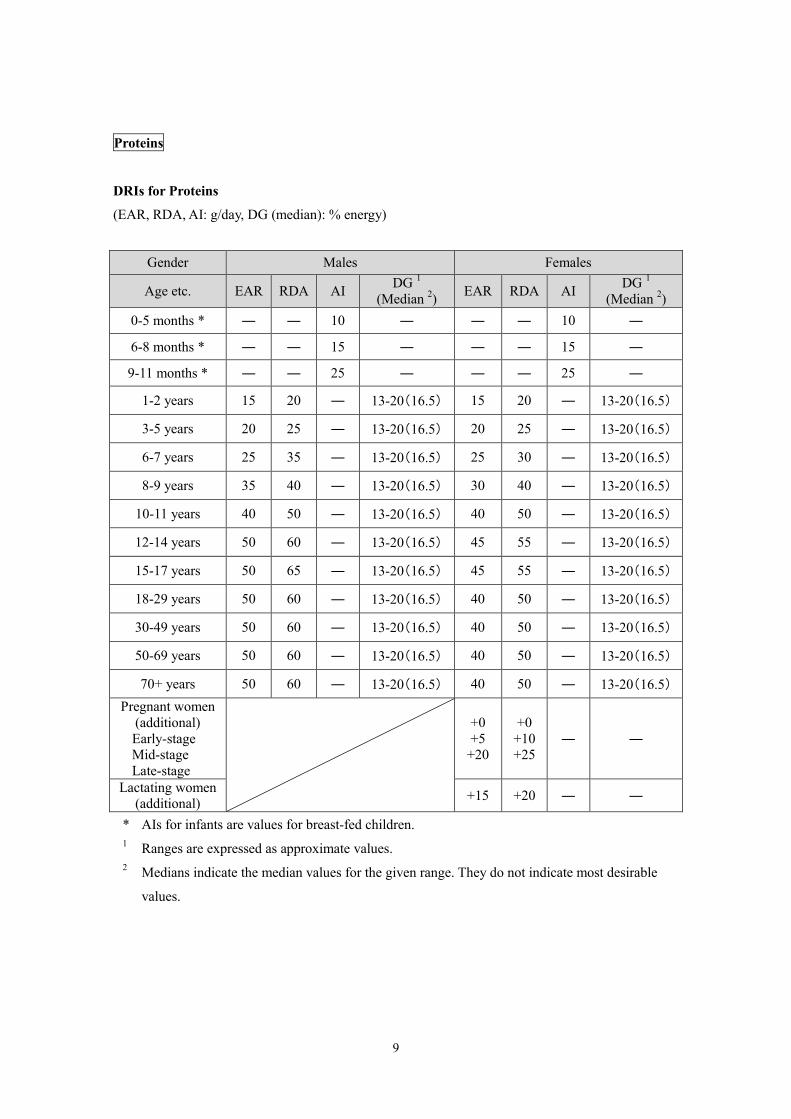
Proteins
DRIs for Proteins
(EAR, RDA, AI: g/day, DG (median): % energy)
Gender Males Females
Age etc. EAR RDA AI DG 1 (Median 2) EAR RDA AI DG 1
(Median 2) 0-5 months * ― ― 10 ― ― ― 10 ―
6-8 months * ― ― 15 ― ― ― 15 ―
9-11 months * ― ― 25 ― ― ― 25 ―
1-2 years 15 20 ― 13-20(16.5) 15 20 ― 13-20(16.5)
3-5 years 20 25 ― 13-20(16.5) 20 25 ― 13-20(16.5)
6-7 years 25 35 ― 13-20(16.5) 25 30 ― 13-20(16.5)
8-9 years 35 40 ― 13-20(16.5) 30 40 ― 13-20(16.5)
10-11 years 40 50 ― 13-20(16.5) 40 50 ― 13-20(16.5)
12-14 years 50 60 ― 13-20(16.5) 45 55 ― 13-20(16.5)
15-17 years 50 65 ― 13-20(16.5) 45 55 ― 13-20(16.5)
18-29 years 50 60 ― 13-20(16.5) 40 50 ― 13-20(16.5)
30-49 years 50 60 ― 13-20(16.5) 40 50 ― 13-20(16.5)
50-69 years 50 60 ― 13-20(16.5) 40 50 ― 13-20(16.5)
70+ years 50 60 ― 13-20(16.5) 40 50 ― 13-20(16.5) Pregnant women
(additional)
Early-stage Mid-stage Late-stage
+0 +5
+20
+0 +10 +25
― ―
Lactating women (additional) +15 +20 ― ―
* AIs for infants are values for breast-fed children. 1 Ranges are expressed as approximate values. 2 Medians indicate the median values for the given range. They do not indicate most desirable
values.
10
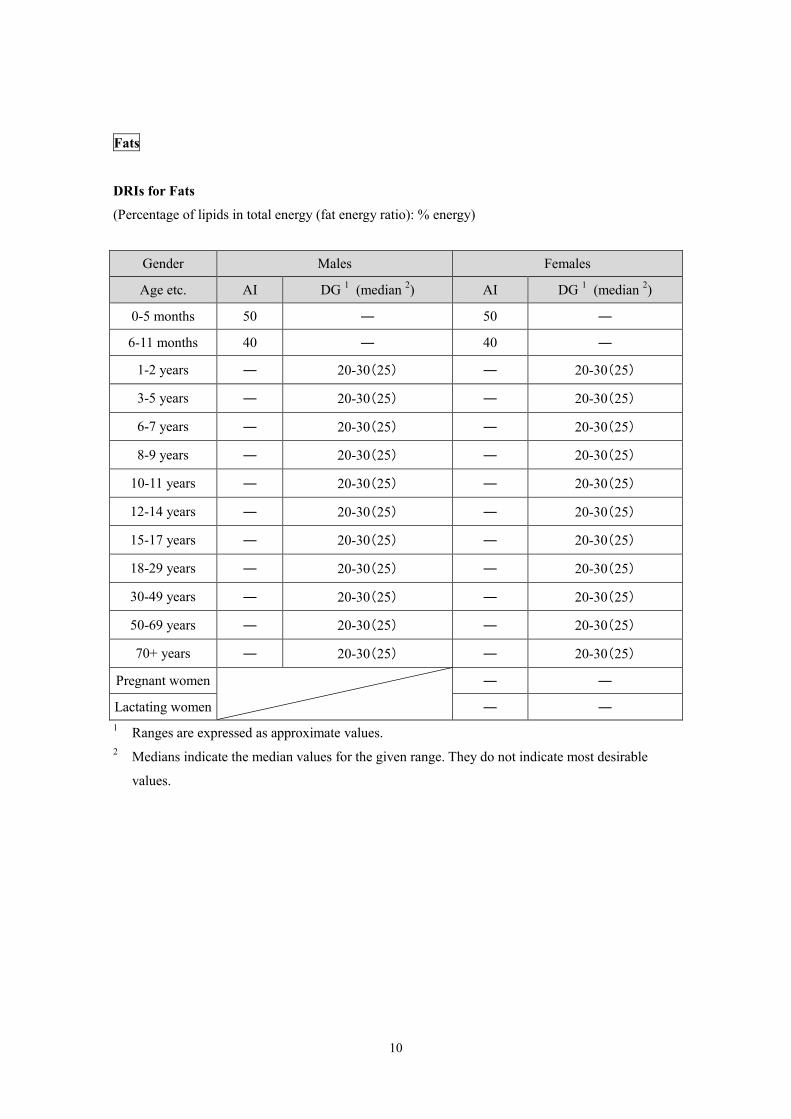
Fats
DRIs for Fats
(Percentage of lipids in total energy (fat energy ratio): % energy)
Gender Males Females
Age etc. AI DG 1 (median 2) AI DG 1 (median 2)
0-5 months 50 ― 50 ―
6-11 months 40 ― 40 ―
1-2 years ― 20-30(25) ― 20-30(25)
3-5 years ― 20-30(25) ― 20-30(25)
6-7 years ― 20-30(25) ― 20-30(25)
8-9 years ― 20-30(25) ― 20-30(25)
10-11 years ― 20-30(25) ― 20-30(25)
12-14 years ― 20-30(25) ― 20-30(25)
15-17 years ― 20-30(25) ― 20-30(25)
18-29 years ― 20-30(25) ― 20-30(25)
30-49 years ― 20-30(25) ― 20-30(25)
50-69 years ― 20-30(25) ― 20-30(25)
70+ years ― 20-30(25) ― 20-30(25)
Pregnant women
― ―
Lactating women ― ― 1 Ranges are expressed as approximate values. 2 Medians indicate the median values for the given range. They do not indicate most desirable
values.

11
DRIs for Saturated Fatty Acid (% energy)
Gender Males Females
Age etc. DG DG
0-5 months ― ―
6-11 months ― ―
1-2 years ― ―
3-5 years ― ―
6-7 years ― ―
8-9 years ― ―
10-11 years ― ―
12-14 years ― ―
15-17 years ― ―
18-29 years ≤ 7 ≤ 7
30-49 years ≤ 7 ≤ 7
50-69 years ≤ 7 ≤ 7
70+ years ≤ 7 ≤ 7
Pregnant women
―
Lactating women ―
12
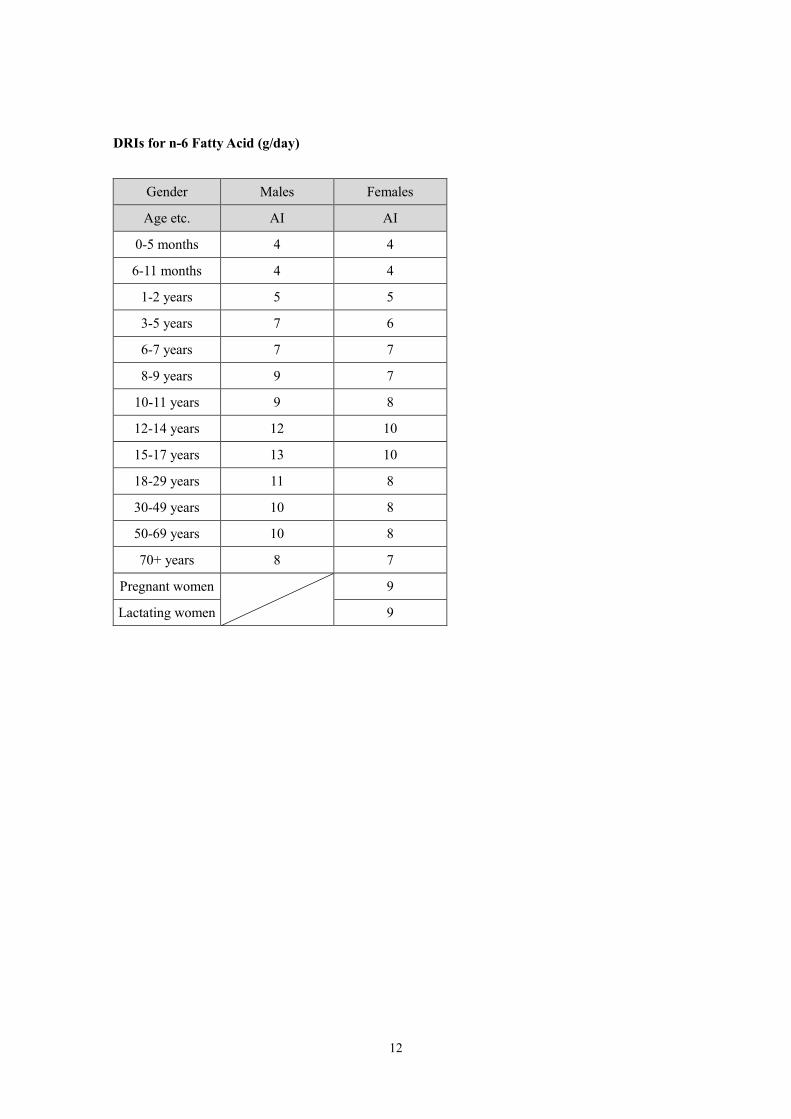
DRIs for n-6 Fatty Acid (g/day)
Gender Males Females
Age etc. AI AI
0-5 months 4 4
6-11 months 4 4
1-2 years 5 5
3-5 years 7 6
6-7 years 7 7
8-9 years 9 7
10-11 years 9 8
12-14 years 12 10
15-17 years 13 10
18-29 years 11 8
30-49 years 10 8
50-69 years 10 8
70+ years 8 7
Pregnant women
9
Lactating women 9
13
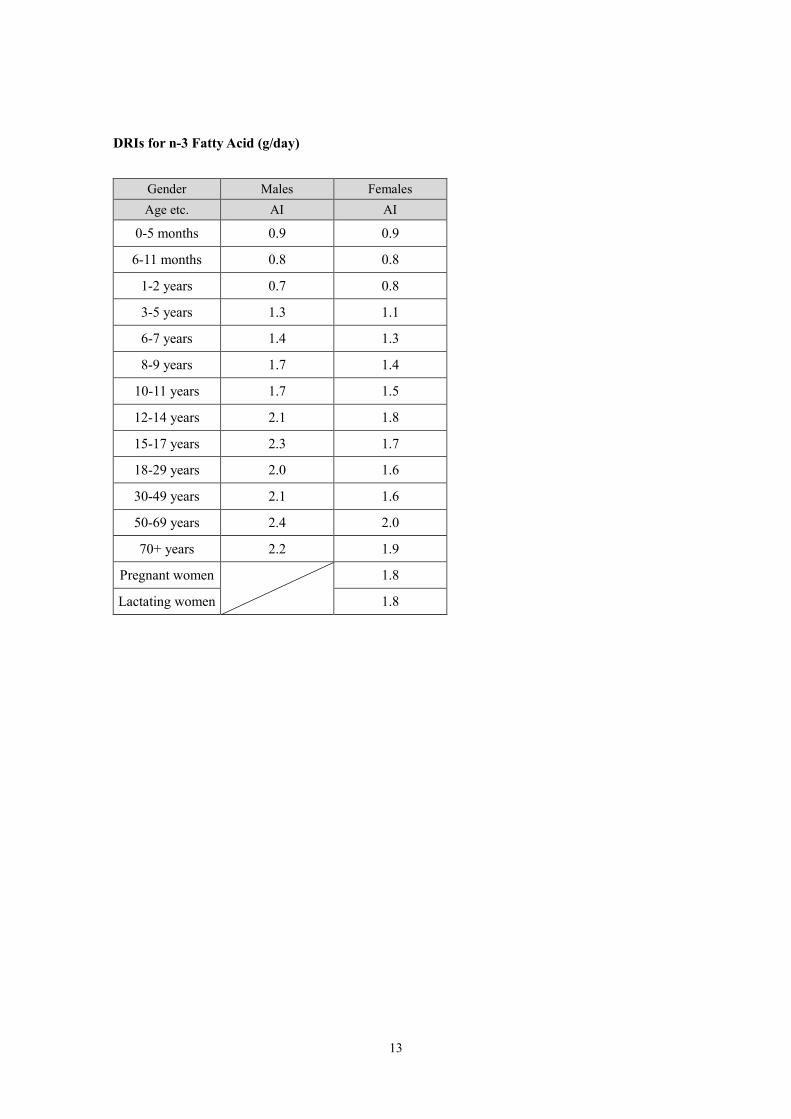
DRIs for n-3 Fatty Acid (g/day)
Gender Males Females Age etc. AI AI
0-5 months 0.9 0.9
6-11 months 0.8 0.8
1-2 years 0.7 0.8
3-5 years 1.3 1.1
6-7 years 1.4 1.3
8-9 years 1.7 1.4
10-11 years 1.7 1.5
12-14 years 2.1 1.8
15-17 years 2.3 1.7
18-29 years 2.0 1.6
30-49 years 2.1 1.6
50-69 years 2.4 2.0
70+ years 2.2 1.9
Pregnant women 1.8
Lactating women 1.8
14
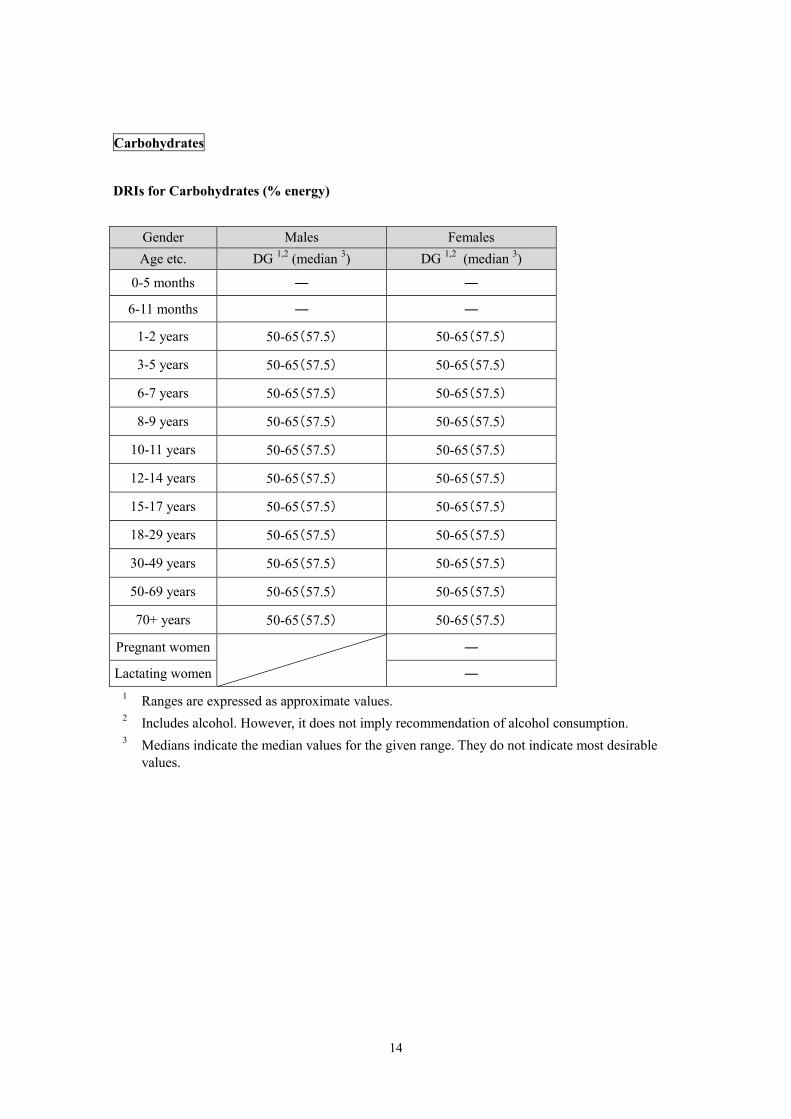
Carbohydrates
DRIs for Carbohydrates (% energy)
Gender Males Females Age etc. DG 1,2 (median 3) DG 1,2 (median 3)
0-5 months ― ―
6-11 months ― ―
1-2 years 50-65(57.5) 50-65(57.5)
3-5 years 50-65(57.5) 50-65(57.5)
6-7 years 50-65(57.5) 50-65(57.5)
8-9 years 50-65(57.5) 50-65(57.5)
10-11 years 50-65(57.5) 50-65(57.5)
12-14 years 50-65(57.5) 50-65(57.5)
15-17 years 50-65(57.5) 50-65(57.5)
18-29 years 50-65(57.5) 50-65(57.5)
30-49 years 50-65(57.5) 50-65(57.5)
50-69 years 50-65(57.5) 50-65(57.5)
70+ years 50-65(57.5) 50-65(57.5)
Pregnant women ―
Lactating women ― 1 Ranges are expressed as approximate values. 2 Includes alcohol. However, it does not imply recommendation of alcohol consumption. 3 Medians indicate the median values for the given range. They do not indicate most desirable
values.
15
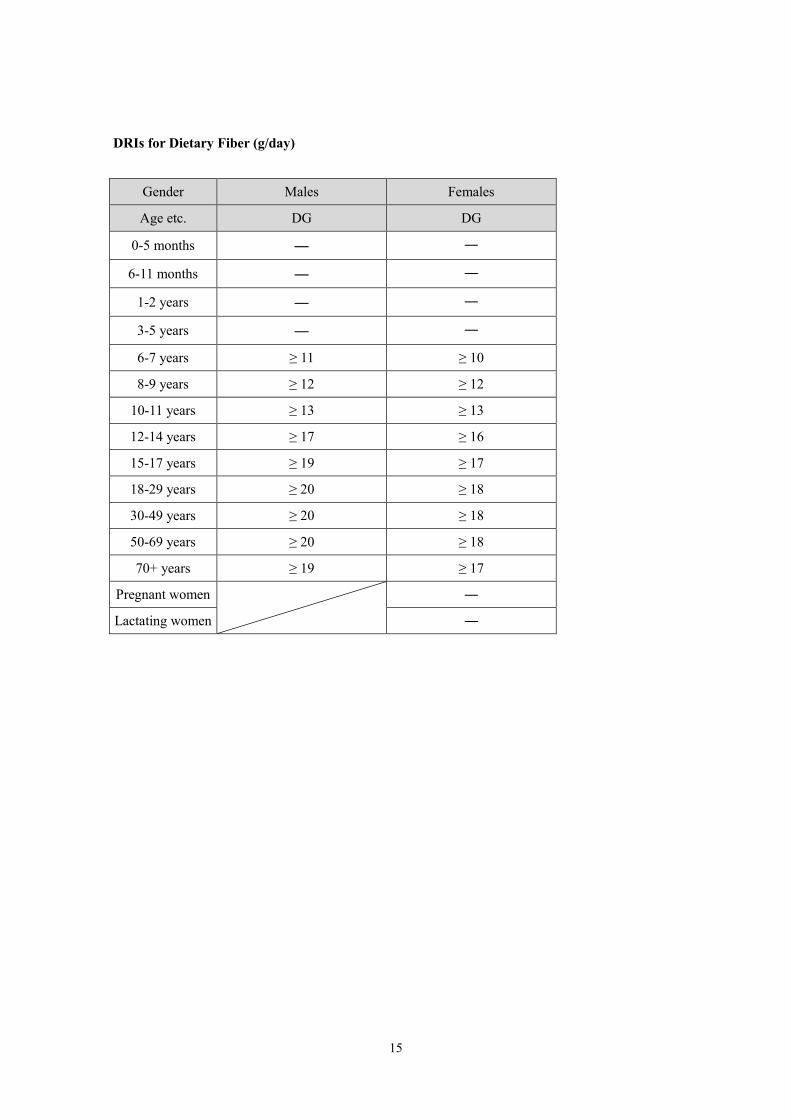
DRIs for Dietary Fiber (g/day)
Gender Males Females
Age etc. DG DG
0-5 months ― ―
6-11 months ― ―
1-2 years ― ―
3-5 years ― ―
6-7 years ≥ 11 ≥ 10
8-9 years ≥ 12 ≥ 12
10-11 years ≥ 13 ≥ 13
12-14 years ≥ 17 ≥ 16
15-17 years ≥ 19 ≥ 17
18-29 years ≥ 20 ≥ 18
30-49 years ≥ 20 ≥ 18
50-69 years ≥ 20 ≥ 18
70+ years ≥ 19 ≥ 17
Pregnant women
―
Lactating women ―
16
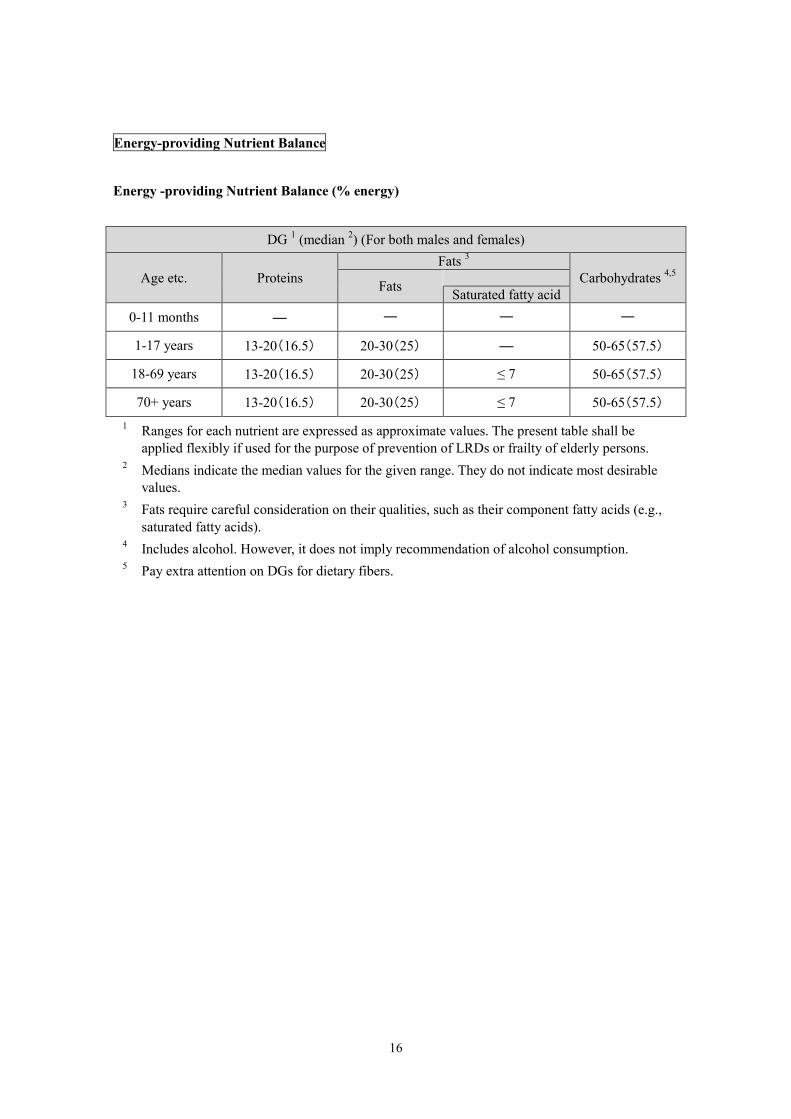
Energy-providing Nutrient Balance
Energy -providing Nutrient Balance (% energy)
DG 1 (median 2) (For both males and females)
Age etc. Proteins Fats 3
Carbohydrates 4,5 Fats Saturated fatty acid
0-11 months ― ― ― ―
1-17 years 13-20(16.5) 20-30(25) ― 50-65(57.5)
18-69 years 13-20(16.5) 20-30(25) ≤ 7 50-65(57.5)
70+ years 13-20(16.5) 20-30(25) ≤ 7 50-65(57.5) 1 Ranges for each nutrient are expressed as approximate values. The present table shall be
applied flexibly if used for the purpose of prevention of LRDs or frailty of elderly persons. 2 Medians indicate the median values for the given range. They do not indicate most desirable
values. 3 Fats require careful consideration on their qualities, such as their component fatty acids (e.g.,
saturated fatty acids). 4 Includes alcohol. However, it does not imply recommendation of alcohol consumption. 5 Pay extra attention on DGs for dietary fibers.
17
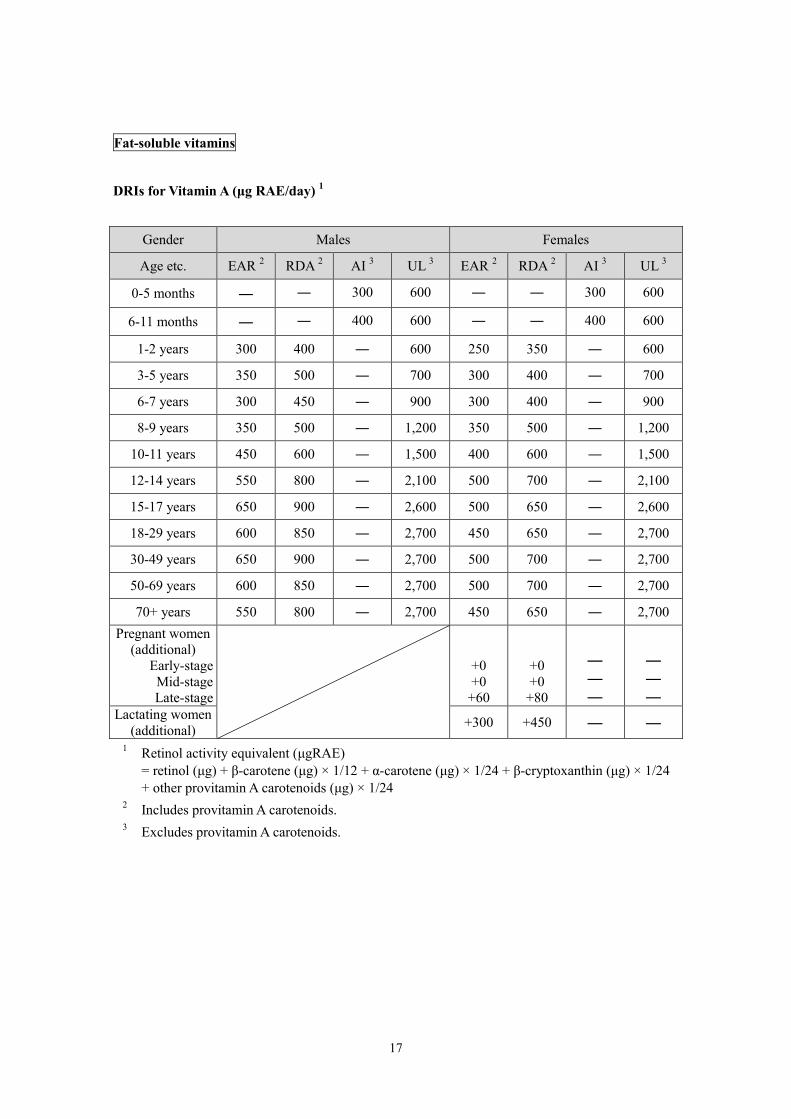
Fat-soluble vitamins
DRIs for Vitamin A (μg RAE/day) 1
Gender Males Females
Age etc. EAR 2 RDA 2 AI 3 UL 3 EAR 2 RDA 2 AI 3 UL 3
0-5 months ― ― 300 600 ― ― 300 600
6-11 months ― ― 400 600 ― ― 400 600
1-2 years 300 400 ― 600 250 350 ― 600
3-5 years 350 500 ― 700 300 400 ― 700
6-7 years 300 450 ― 900 300 400 ― 900
8-9 years 350 500 ― 1,200 350 500 ― 1,200
10-11 years 450 600 ― 1,500 400 600 ― 1,500
12-14 years 550 800 ― 2,100 500 700 ― 2,100
15-17 years 650 900 ― 2,600 500 650 ― 2,600
18-29 years 600 850 ― 2,700 450 650 ― 2,700
30-49 years 650 900 ― 2,700 500 700 ― 2,700
50-69 years 600 850 ― 2,700 500 700 ― 2,700
70+ years 550 800 ― 2,700 450 650 ― 2,700 Pregnant women
(additional)
Early-stage Mid-stage Late-stage
+0 +0 +60
+0 +0
+80
― ― ―
― ― ―
Lactating women (additional) +300 +450 ― ―
1 Retinol activity equivalent (μgRAE) = retinol (μg) + β-carotene (μg) × 1/12 + α-carotene (μg) × 1/24 + β-cryptoxanthin (μg) × 1/24 + other provitamin A carotenoids (μg) × 1/24
2 Includes provitamin A carotenoids. 3 Excludes provitamin A carotenoids.
18
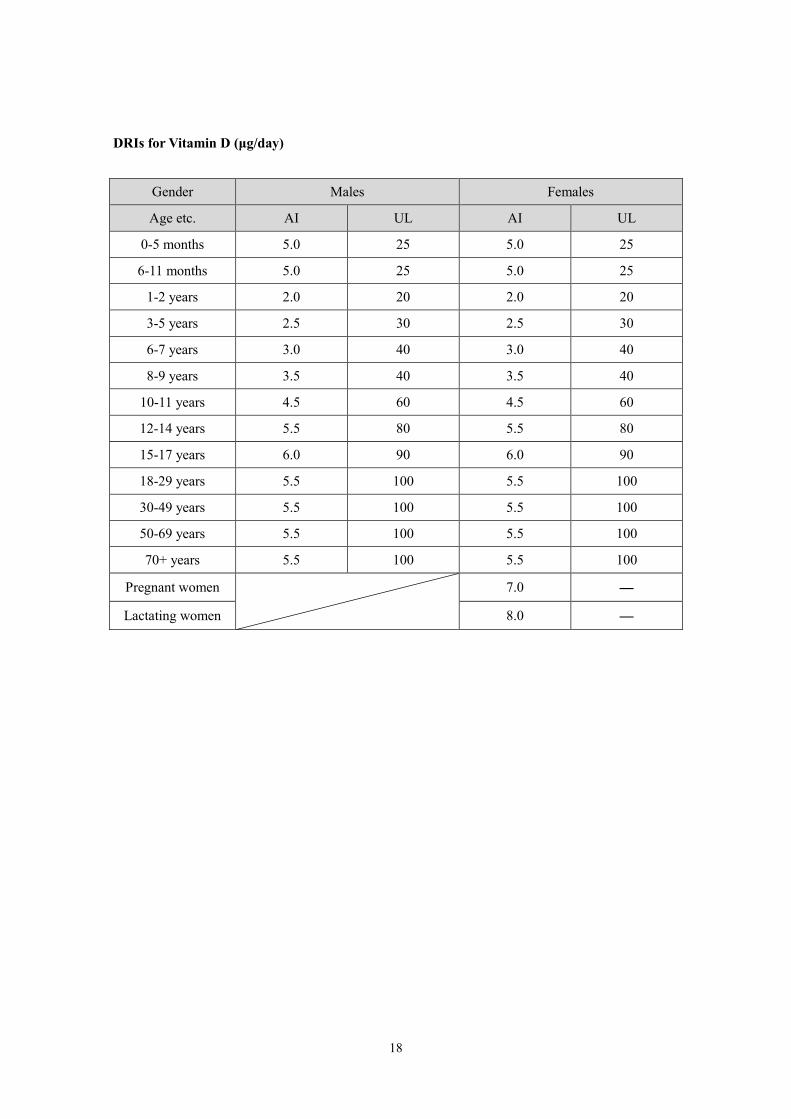
DRIs for Vitamin D (μg/day)
Gender Males Females
Age etc. AI UL AI UL
0-5 months 5.0 25 5.0 25
6-11 months 5.0 25 5.0 25
1-2 years 2.0 20 2.0 20
3-5 years 2.5 30 2.5 30
6-7 years 3.0 40 3.0 40
8-9 years 3.5 40 3.5 40
10-11 years 4.5 60 4.5 60
12-14 years 5.5 80 5.5 80
15-17 years 6.0 90 6.0 90
18-29 years 5.5 100 5.5 100
30-49 years 5.5 100 5.5 100
50-69 years 5.5 100 5.5 100
70+ years 5.5 100 5.5 100
Pregnant women
7.0 ―
Lactating women 8.0 ―
19
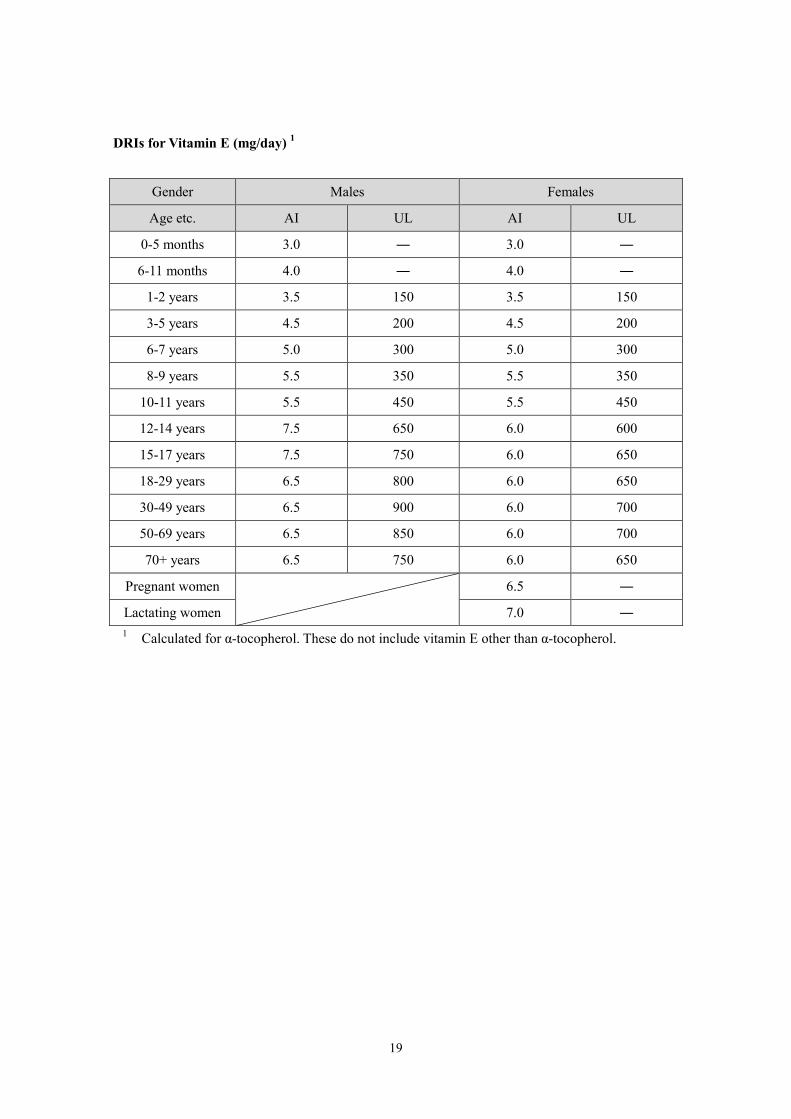
DRIs for Vitamin E (mg/day) 1
Gender Males Females
Age etc. AI UL AI UL
0-5 months 3.0 ― 3.0 ―
6-11 months 4.0 ― 4.0 ―
1-2 years 3.5 150 3.5 150
3-5 years 4.5 200 4.5 200
6-7 years 5.0 300 5.0 300
8-9 years 5.5 350 5.5 350
10-11 years 5.5 450 5.5 450
12-14 years 7.5 650 6.0 600
15-17 years 7.5 750 6.0 650
18-29 years 6.5 800 6.0 650
30-49 years 6.5 900 6.0 700
50-69 years 6.5 850 6.0 700
70+ years 6.5 750 6.0 650
Pregnant women
6.5 ―
Lactating women 7.0 ― 1 Calculated for α-tocopherol. These do not include vitamin E other than α-tocopherol.

20
DRIs for Vitamin K (μg/day)
Gender Males Females
Age etc. AI AI
0-5 months 4 4
6-11 months 7 7
1-2 years 60 60
3-5 years 70 70
6-7 years 85 85
8-9 years 100 100
10-11 years 120 120
12-14 years 150 150
15-17 years 160 160
18-29 years 150 150
30-49 years 150 150
50-69 years 150 150
70+ years 150 150
Pregnant women
150
Lactating women 150
21
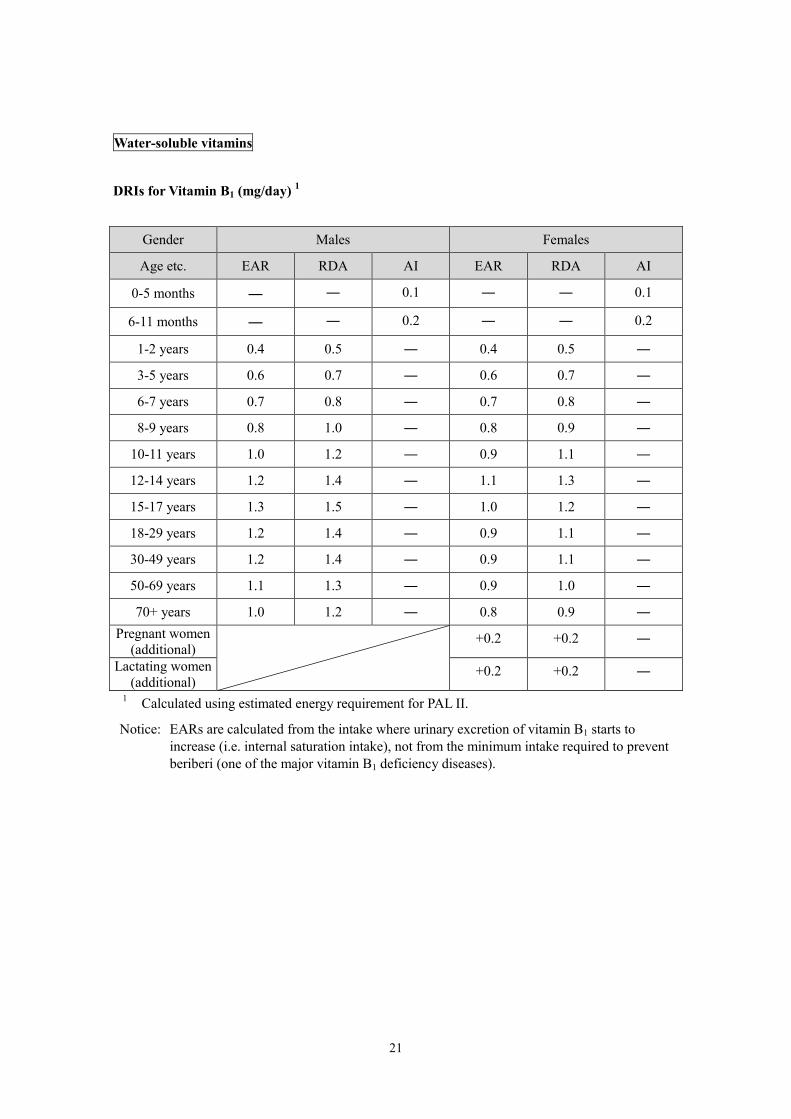
Water-soluble vitamins
DRIs for Vitamin B1 (mg/day) 1
Gender Males Females
Age etc. EAR RDA AI EAR RDA AI
0-5 months ― ― 0.1 ― ― 0.1
6-11 months ― ― 0.2 ― ― 0.2
1-2 years 0.4 0.5 ― 0.4 0.5 ―
3-5 years 0.6 0.7 ― 0.6 0.7 ―
6-7 years 0.7 0.8 ― 0.7 0.8 ―
8-9 years 0.8 1.0 ― 0.8 0.9 ―
10-11 years 1.0 1.2 ― 0.9 1.1 ―
12-14 years 1.2 1.4 ― 1.1 1.3 ―
15-17 years 1.3 1.5 ― 1.0 1.2 ―
18-29 years 1.2 1.4 ― 0.9 1.1 ―
30-49 years 1.2 1.4 ― 0.9 1.1 ―
50-69 years 1.1 1.3 ― 0.9 1.0 ―
70+ years 1.0 1.2 ― 0.8 0.9 ― Pregnant women
(additional) +0.2 +0.2 ―
Lactating women (additional)
+0.2 +0.2 ―
1 Calculated using estimated energy requirement for PAL II.
Notice: EARs are calculated from the intake where urinary excretion of vitamin B1 starts to increase (i.e. internal saturation intake), not from the minimum intake required to prevent beriberi (one of the major vitamin B1 deficiency diseases).
22
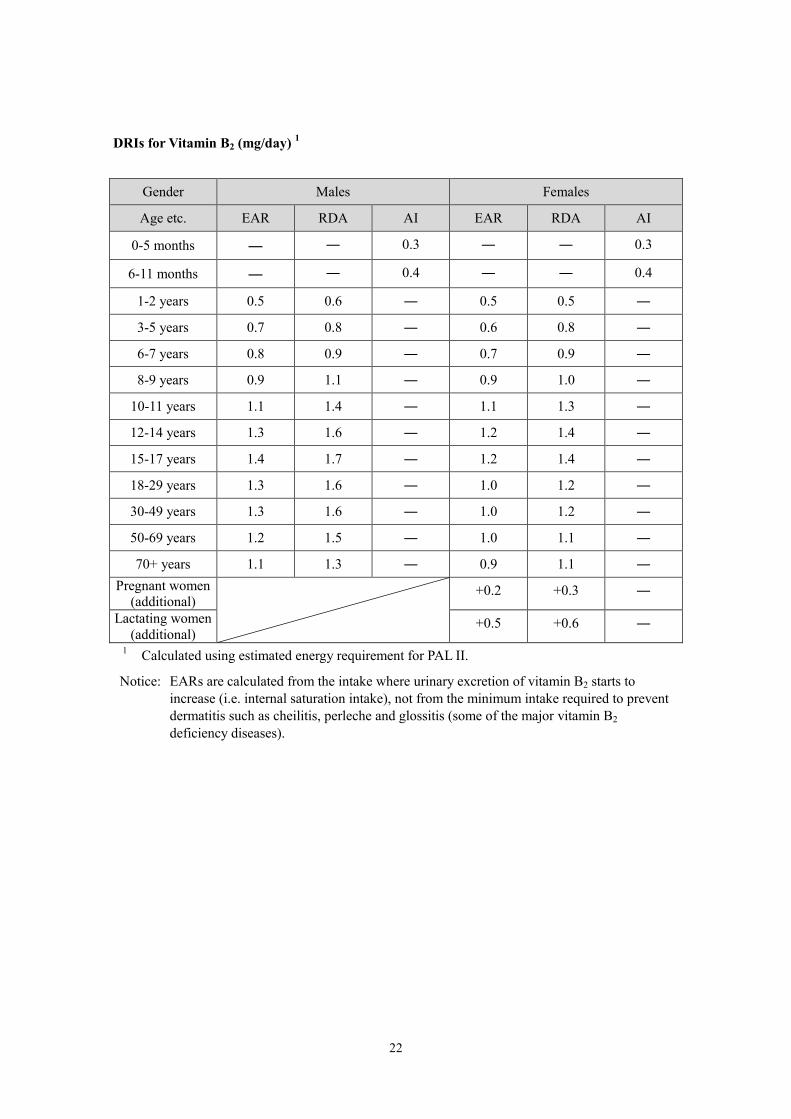
DRIs for Vitamin B2 (mg/day) 1
Gender Males Females
Age etc. EAR RDA AI EAR RDA AI
0-5 months ― ― 0.3 ― ― 0.3
6-11 months ― ― 0.4 ― ― 0.4
1-2 years 0.5 0.6 ― 0.5 0.5 ―
3-5 years 0.7 0.8 ― 0.6 0.8 ―
6-7 years 0.8 0.9 ― 0.7 0.9 ―
8-9 years 0.9 1.1 ― 0.9 1.0 ―
10-11 years 1.1 1.4 ― 1.1 1.3 ―
12-14 years 1.3 1.6 ― 1.2 1.4 ―
15-17 years 1.4 1.7 ― 1.2 1.4 ―
18-29 years 1.3 1.6 ― 1.0 1.2 ―
30-49 years 1.3 1.6 ― 1.0 1.2 ―
50-69 years 1.2 1.5 ― 1.0 1.1 ―
70+ years 1.1 1.3 ― 0.9 1.1 ― Pregnant women
(additional) +0.2 +0.3 ―
Lactating women (additional)
+0.5 +0.6 ―
1 Calculated using estimated energy requirement for PAL II.
Notice: EARs are calculated from the intake where urinary excretion of vitamin B2 starts to increase (i.e. internal saturation intake), not from the minimum intake required to prevent dermatitis such as cheilitis, perleche and glossitis (some of the major vitamin B2 deficiency diseases).
23
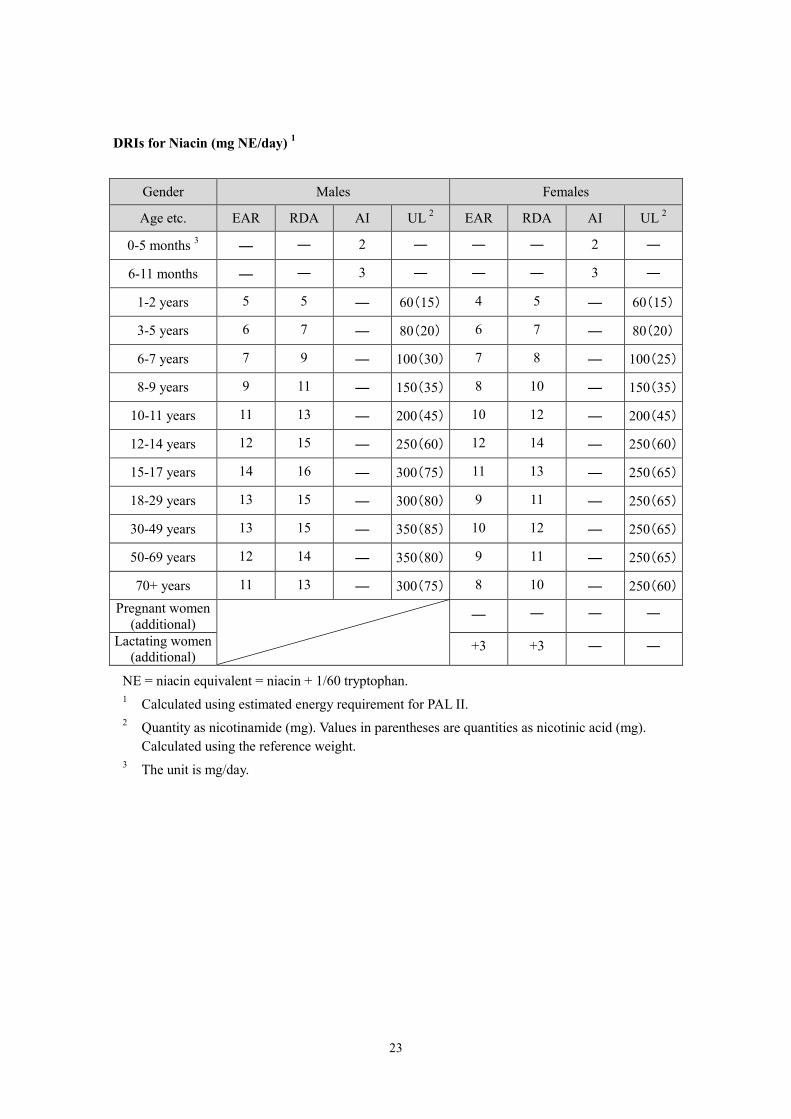
DRIs for Niacin (mg NE/day) 1
Gender Males Females
Age etc. EAR RDA AI UL 2 EAR RDA AI UL 2
0-5 months 3 ― ― 2 ― ― ― 2 ―
6-11 months ― ― 3 ― ― ― 3 ―
1-2 years 5 5 ― 60(15) 4 5 ― 60(15)
3-5 years 6 7 ― 80(20) 6 7 ― 80(20)
6-7 years 7 9 ― 100(30) 7 8 ― 100(25)
8-9 years 9 11 ― 150(35) 8 10 ― 150(35)
10-11 years 11 13 ― 200(45) 10 12 ― 200(45)
12-14 years 12 15 ― 250(60) 12 14 ― 250(60)
15-17 years 14 16 ― 300(75) 11 13 ― 250(65)
18-29 years 13 15 ― 300(80) 9 11 ― 250(65)
30-49 years 13 15 ― 350(85) 10 12 ― 250(65)
50-69 years 12 14 ― 350(80) 9 11 ― 250(65)
70+ years 11 13 ― 300(75) 8 10 ― 250(60) Pregnant women
(additional) ― ― ― ―
Lactating women (additional)
+3 +3 ― ―
NE = niacin equivalent = niacin + 1/60 tryptophan. 1 Calculated using estimated energy requirement for PAL II. 2 Quantity as nicotinamide (mg). Values in parentheses are quantities as nicotinic acid (mg).
Calculated using the reference weight. 3 The unit is mg/day.
24
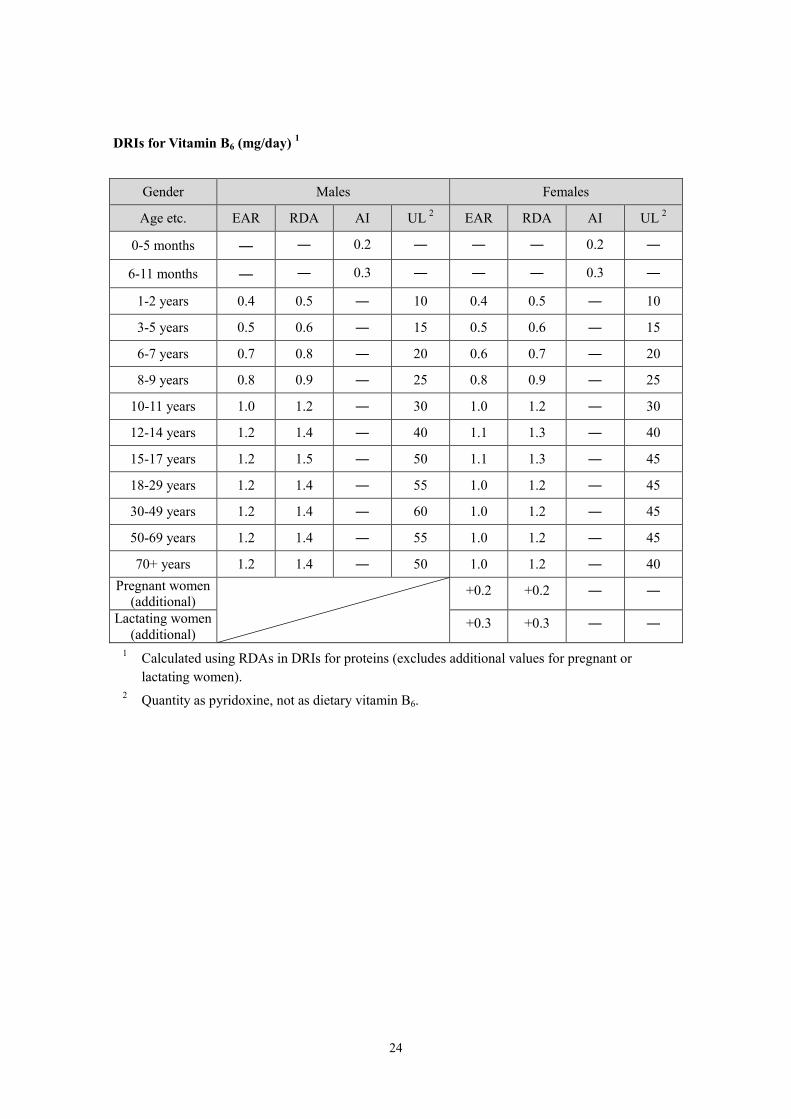
DRIs for Vitamin B6 (mg/day) 1
Gender Males Females
Age etc. EAR RDA AI UL 2 EAR RDA AI UL 2
0-5 months ― ― 0.2 ― ― ― 0.2 ―
6-11 months ― ― 0.3 ― ― ― 0.3 ―
1-2 years 0.4 0.5 ― 10 0.4 0.5 ― 10
3-5 years 0.5 0.6 ― 15 0.5 0.6 ― 15
6-7 years 0.7 0.8 ― 20 0.6 0.7 ― 20
8-9 years 0.8 0.9 ― 25 0.8 0.9 ― 25
10-11 years 1.0 1.2 ― 30 1.0 1.2 ― 30
12-14 years 1.2 1.4 ― 40 1.1 1.3 ― 40
15-17 years 1.2 1.5 ― 50 1.1 1.3 ― 45
18-29 years 1.2 1.4 ― 55 1.0 1.2 ― 45
30-49 years 1.2 1.4 ― 60 1.0 1.2 ― 45
50-69 years 1.2 1.4 ― 55 1.0 1.2 ― 45
70+ years 1.2 1.4 ― 50 1.0 1.2 ― 40 Pregnant women
(additional) +0.2 +0.2 ― ―
Lactating women (additional)
+0.3 +0.3 ― ―
1 Calculated using RDAs in DRIs for proteins (excludes additional values for pregnant or lactating women).
2 Quantity as pyridoxine, not as dietary vitamin B6.
25
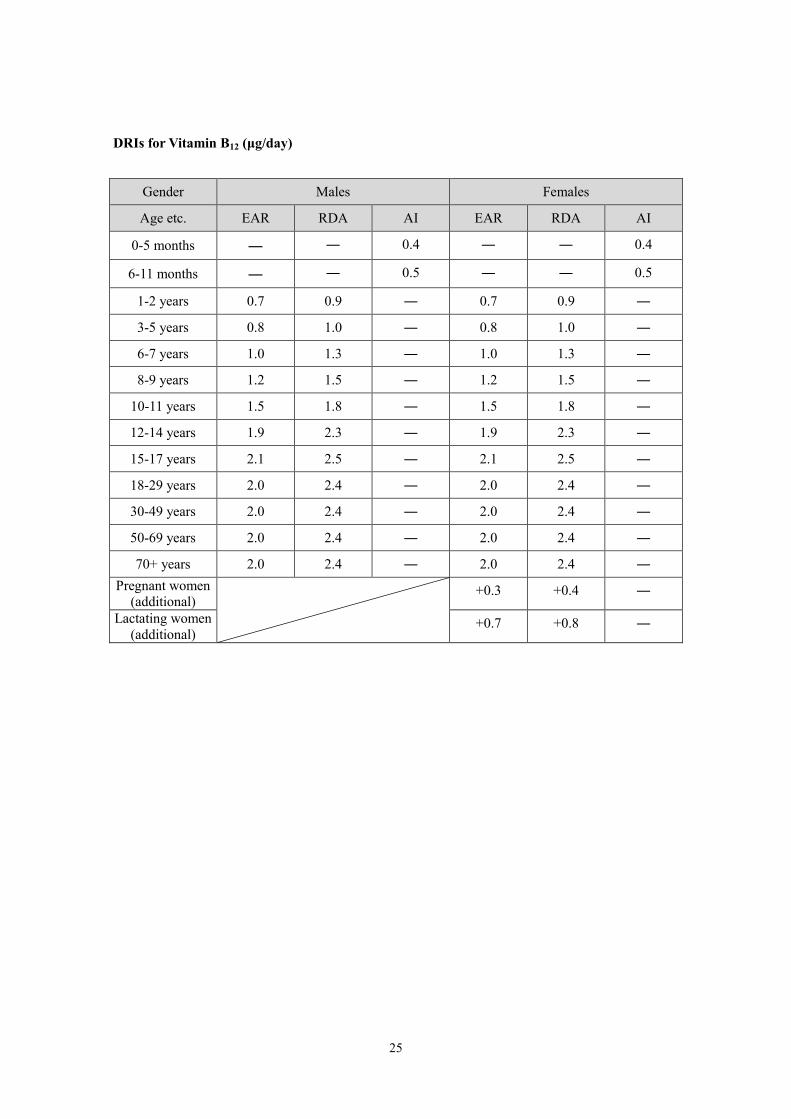
DRIs for Vitamin B12 (μg/day)
Gender Males Females
Age etc. EAR RDA AI EAR RDA AI
0-5 months ― ― 0.4 ― ― 0.4
6-11 months ― ― 0.5 ― ― 0.5
1-2 years 0.7 0.9 ― 0.7 0.9 ―
3-5 years 0.8 1.0 ― 0.8 1.0 ―
6-7 years 1.0 1.3 ― 1.0 1.3 ―
8-9 years 1.2 1.5 ― 1.2 1.5 ―
10-11 years 1.5 1.8 ― 1.5 1.8 ―
12-14 years 1.9 2.3 ― 1.9 2.3 ―
15-17 years 2.1 2.5 ― 2.1 2.5 ―
18-29 years 2.0 2.4 ― 2.0 2.4 ―
30-49 years 2.0 2.4 ― 2.0 2.4 ―
50-69 years 2.0 2.4 ― 2.0 2.4 ―
70+ years 2.0 2.4 ― 2.0 2.4 ― Pregnant women
(additional) +0.3 +0.4 ―
Lactating women (additional)
+0.7 +0.8 ―
26
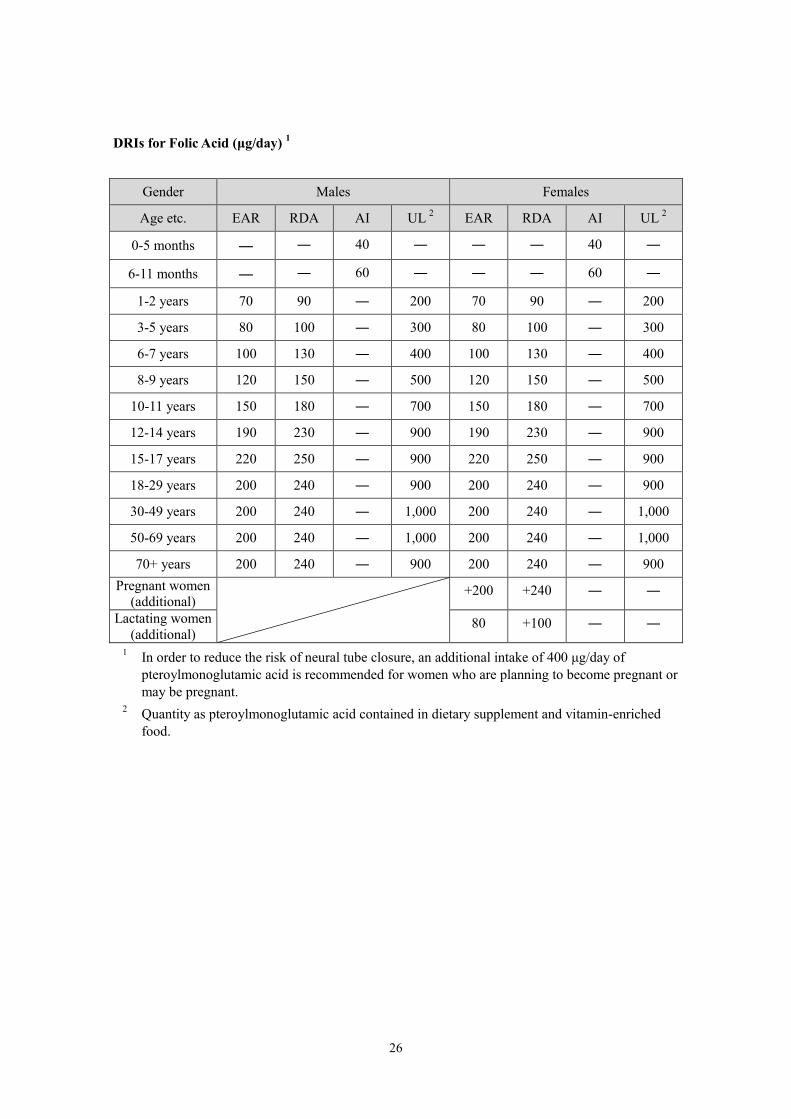
DRIs for Folic Acid (μg/day) 1
Gender Males Females
Age etc. EAR RDA AI UL 2 EAR RDA AI UL 2
0-5 months ― ― 40 ― ― ― 40 ―
6-11 months ― ― 60 ― ― ― 60 ―
1-2 years 70 90 ― 200 70 90 ― 200
3-5 years 80 100 ― 300 80 100 ― 300
6-7 years 100 130 ― 400 100 130 ― 400
8-9 years 120 150 ― 500 120 150 ― 500
10-11 years 150 180 ― 700 150 180 ― 700
12-14 years 190 230 ― 900 190 230 ― 900
15-17 years 220 250 ― 900 220 250 ― 900
18-29 years 200 240 ― 900 200 240 ― 900
30-49 years 200 240 ― 1,000 200 240 ― 1,000
50-69 years 200 240 ― 1,000 200 240 ― 1,000
70+ years 200 240 ― 900 200 240 ― 900 Pregnant women
(additional) +200 +240 ― ―
Lactating women (additional)
80 +100 ― ―
1 In order to reduce the risk of neural tube closure, an additional intake of 400 μg/day of pteroylmonoglutamic acid is recommended for women who are planning to become pregnant or may be pregnant.
2 Quantity as pteroylmonoglutamic acid contained in dietary supplement and vitamin-enriched food.
27
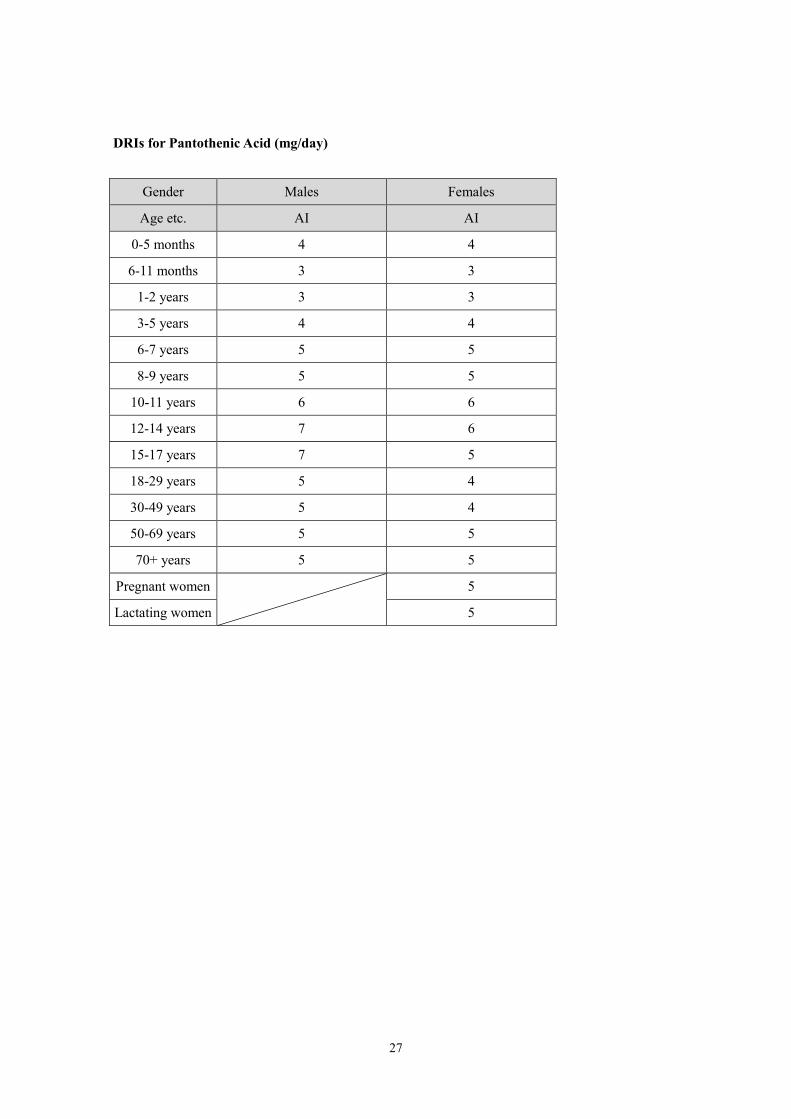
DRIs for Pantothenic Acid (mg/day)
Gender Males Females
Age etc. AI AI
0-5 months 4 4
6-11 months 3 3
1-2 years 3 3
3-5 years 4 4
6-7 years 5 5
8-9 years 5 5
10-11 years 6 6
12-14 years 7 6
15-17 years 7 5
18-29 years 5 4
30-49 years 5 4
50-69 years 5 5
70+ years 5 5
Pregnant women
5
Lactating women 5
28
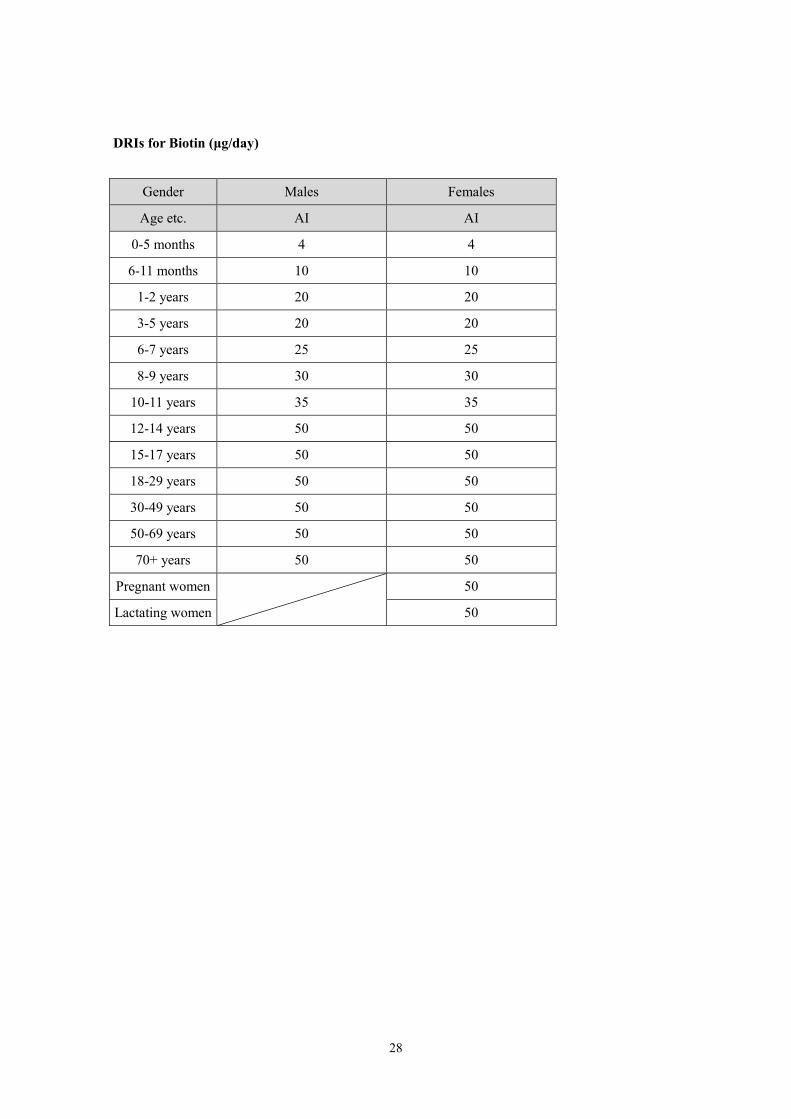
DRIs for Biotin (μg/day)
Gender Males Females
Age etc. AI AI
0-5 months 4 4
6-11 months 10 10
1-2 years 20 20
3-5 years 20 20
6-7 years 25 25
8-9 years 30 30
10-11 years 35 35
12-14 years 50 50
15-17 years 50 50
18-29 years 50 50
30-49 years 50 50
50-69 years 50 50
70+ years 50 50
Pregnant women
50
Lactating women 50
29
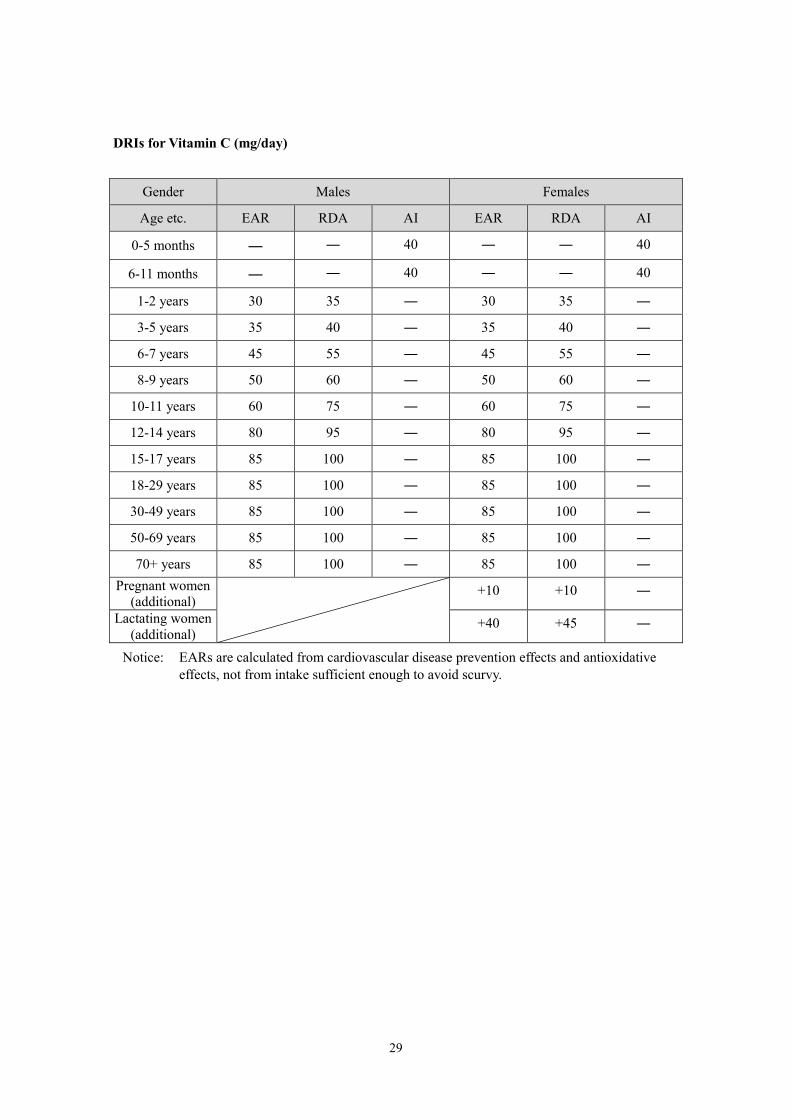
DRIs for Vitamin C (mg/day)
Gender Males Females
Age etc. EAR RDA AI EAR RDA AI
0-5 months ― ― 40 ― ― 40
6-11 months ― ― 40 ― ― 40
1-2 years 30 35 ― 30 35 ―
3-5 years 35 40 ― 35 40 ―
6-7 years 45 55 ― 45 55 ―
8-9 years 50 60 ― 50 60 ―
10-11 years 60 75 ― 60 75 ―
12-14 years 80 95 ― 80 95 ―
15-17 years 85 100 ― 85 100 ―
18-29 years 85 100 ― 85 100 ―
30-49 years 85 100 ― 85 100 ―
50-69 years 85 100 ― 85 100 ―
70+ years 85 100 ― 85 100 ― Pregnant women
(additional) +10 +10 ―
Lactating women (additional)
+40 +45 ―
Notice: EARs are calculated from cardiovascular disease prevention effects and antioxidative effects, not from intake sufficient enough to avoid scurvy.
30
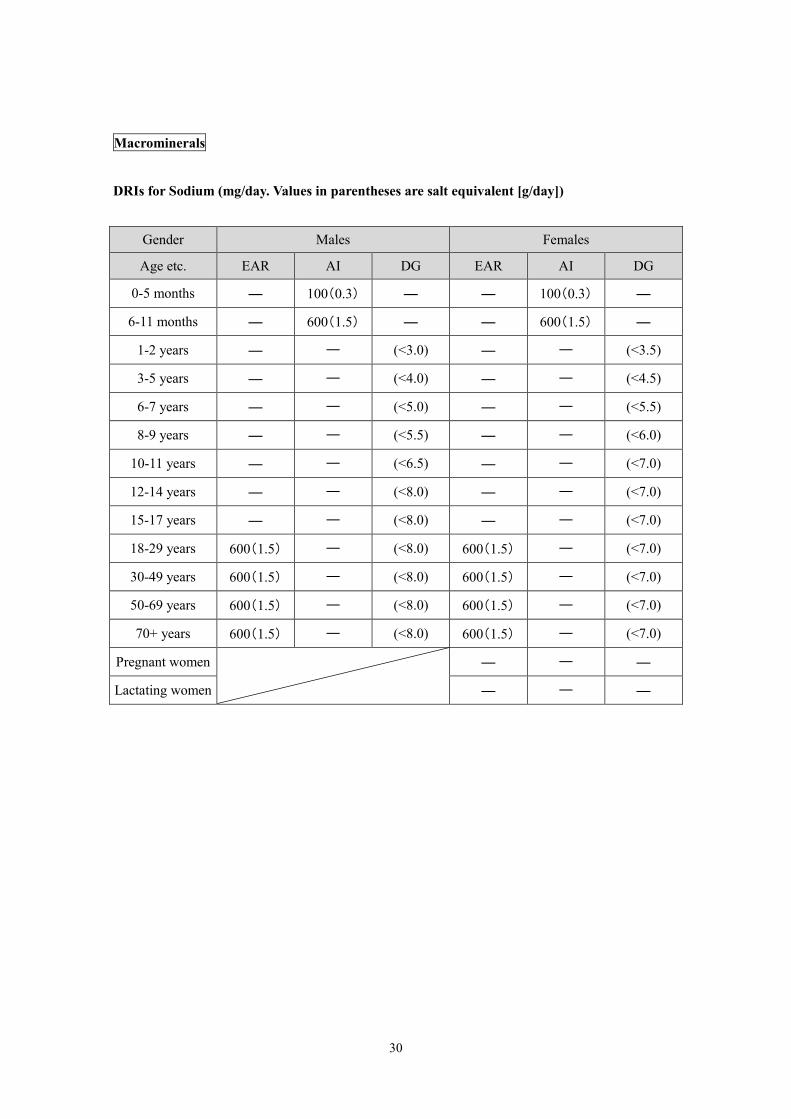
Macrominerals
DRIs for Sodium (mg/day. Values in parentheses are salt equivalent [g/day])
Gender Males Females
Age etc. EAR AI DG EAR AI DG
0-5 months ― 100(0.3) ― ― 100(0.3) ―
6-11 months ― 600(1.5) ― ― 600(1.5) ―
1-2 years ― ― (<3.0) ― ― (<3.5)
3-5 years ― ― (<4.0) ― ― (<4.5)
6-7 years ― ― (<5.0) ― ― (<5.5)
8-9 years ― ― (<5.5) ― ― (<6.0)
10-11 years ― ― (<6.5) ― ― (<7.0)
12-14 years ― ― (<8.0) ― ― (<7.0)
15-17 years ― ― (<8.0) ― ― (<7.0)
18-29 years 600(1.5) ― (<8.0) 600(1.5) ― (<7.0)
30-49 years 600(1.5) ― (<8.0) 600(1.5) ― (<7.0)
50-69 years 600(1.5) ― (<8.0) 600(1.5) ― (<7.0)
70+ years 600(1.5) ― (<8.0) 600(1.5) ― (<7.0)
Pregnant women
― ― ―
Lactating women ― ― ―
31
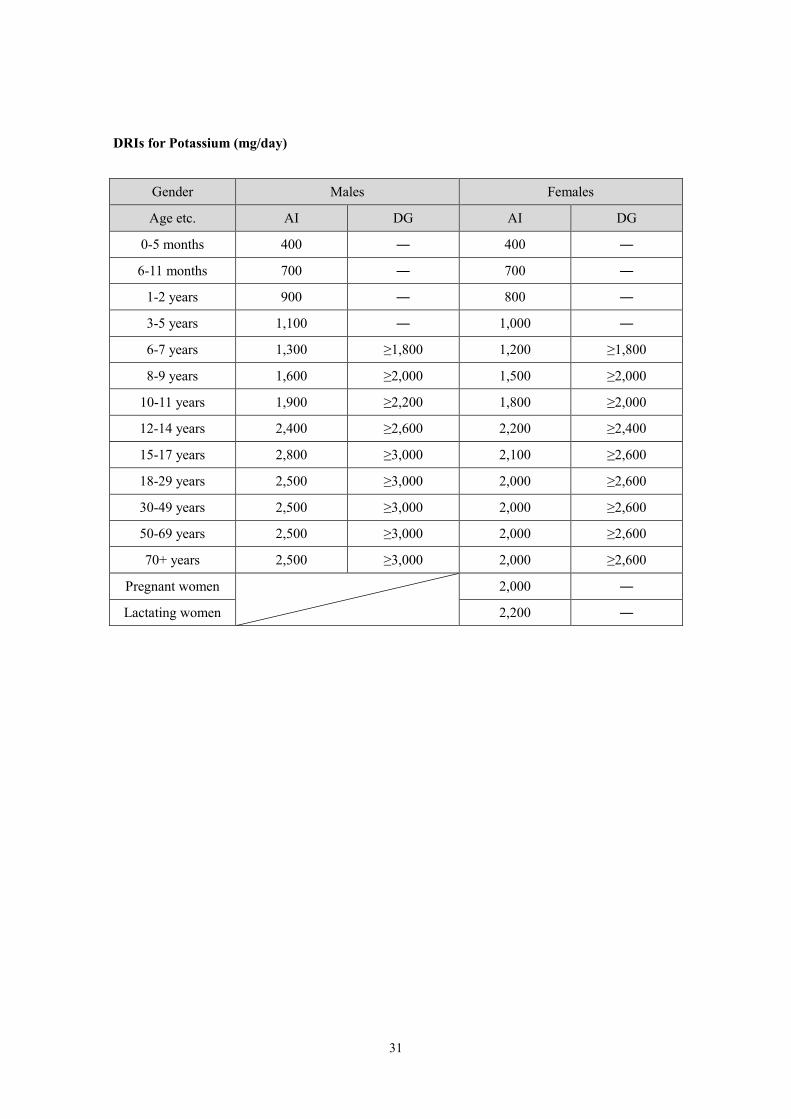
DRIs for Potassium (mg/day)
Gender Males Females
Age etc. AI DG AI DG
0-5 months 400 ― 400 ―
6-11 months 700 ― 700 ―
1-2 years 900 ― 800 ―
3-5 years 1,100 ― 1,000 ―
6-7 years 1,300 ≥1,800 1,200 ≥1,800
8-9 years 1,600 ≥2,000 1,500 ≥2,000
10-11 years 1,900 ≥2,200 1,800 ≥2,000
12-14 years 2,400 ≥2,600 2,200 ≥2,400
15-17 years 2,800 ≥3,000 2,100 ≥2,600
18-29 years 2,500 ≥3,000 2,000 ≥2,600
30-49 years 2,500 ≥3,000 2,000 ≥2,600
50-69 years 2,500 ≥3,000 2,000 ≥2,600
70+ years 2,500 ≥3,000 2,000 ≥2,600
Pregnant women
2,000 ―
Lactating women 2,200 ―
32
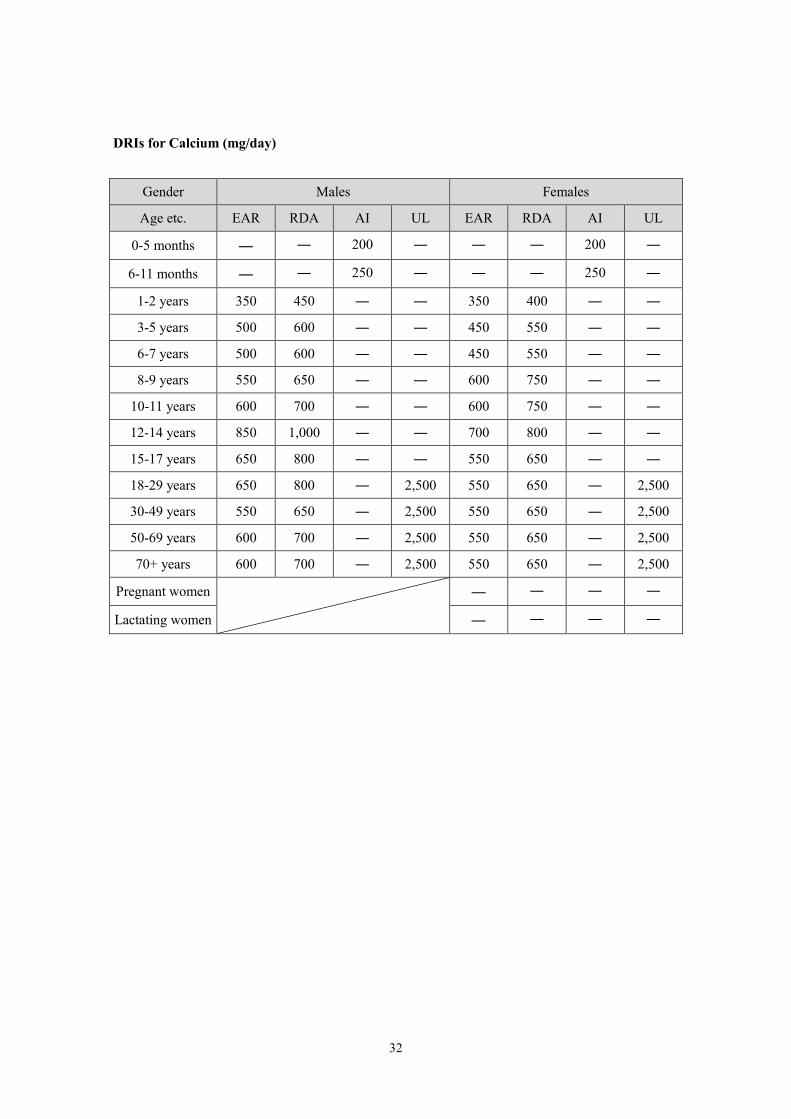
DRIs for Calcium (mg/day)
Gender Males Females
Age etc. EAR RDA AI UL EAR RDA AI UL
0-5 months ― ― 200 ― ― ― 200 ―
6-11 months ― ― 250 ― ― ― 250 ―
1-2 years 350 450 ― ― 350 400 ― ―
3-5 years 500 600 ― ― 450 550 ― ―
6-7 years 500 600 ― ― 450 550 ― ―
8-9 years 550 650 ― ― 600 750 ― ―
10-11 years 600 700 ― ― 600 750 ― ―
12-14 years 850 1,000 ― ― 700 800 ― ―
15-17 years 650 800 ― ― 550 650 ― ―
18-29 years 650 800 ― 2,500 550 650 ― 2,500
30-49 years 550 650 ― 2,500 550 650 ― 2,500
50-69 years 600 700 ― 2,500 550 650 ― 2,500
70+ years 600 700 ― 2,500 550 650 ― 2,500
Pregnant women
― ― ― ―
Lactating women ― ― ― ―
33
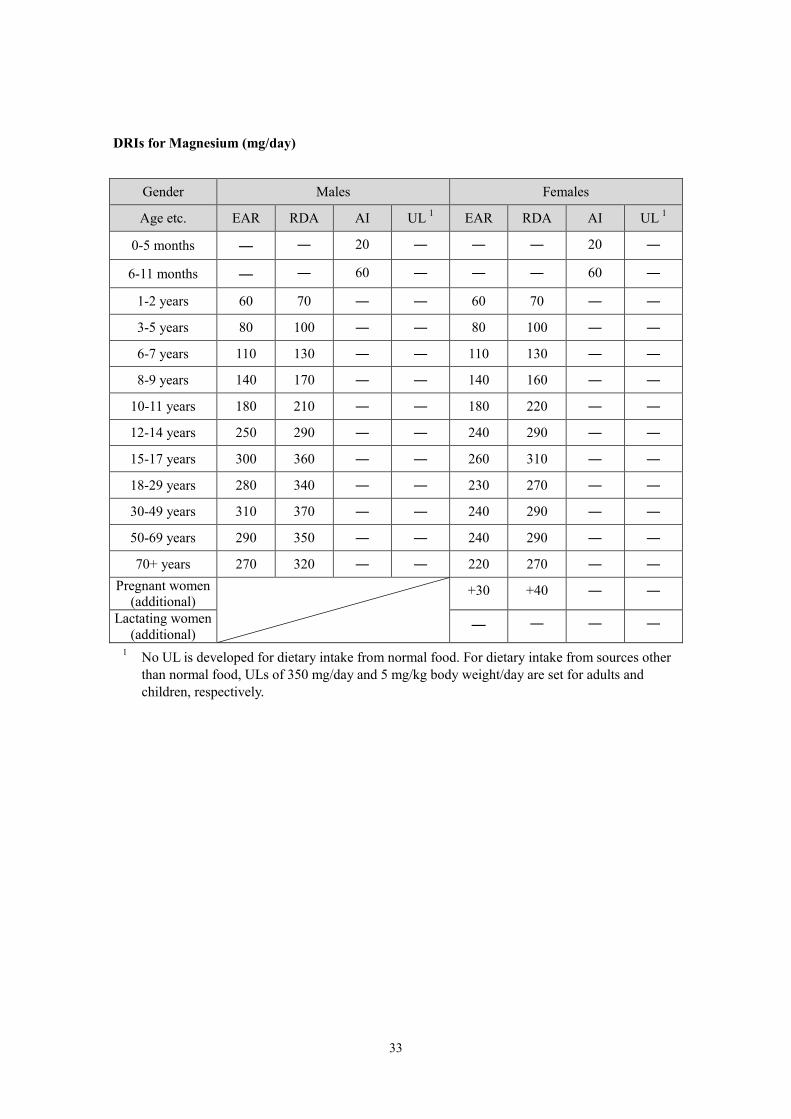
DRIs for Magnesium (mg/day)
Gender Males Females
Age etc. EAR RDA AI UL 1 EAR RDA AI UL 1
0-5 months ― ― 20 ― ― ― 20 ―
6-11 months ― ― 60 ― ― ― 60 ―
1-2 years 60 70 ― ― 60 70 ― ―
3-5 years 80 100 ― ― 80 100 ― ―
6-7 years 110 130 ― ― 110 130 ― ―
8-9 years 140 170 ― ― 140 160 ― ―
10-11 years 180 210 ― ― 180 220 ― ―
12-14 years 250 290 ― ― 240 290 ― ―
15-17 years 300 360 ― ― 260 310 ― ―
18-29 years 280 340 ― ― 230 270 ― ―
30-49 years 310 370 ― ― 240 290 ― ―
50-69 years 290 350 ― ― 240 290 ― ―
70+ years 270 320 ― ― 220 270 ― ― Pregnant women
(additional) +30 +40 ― ―
Lactating women (additional)
― ― ― ―
1 No UL is developed for dietary intake from normal food. For dietary intake from sources other than normal food, ULs of 350 mg/day and 5 mg/kg body weight/day are set for adults and children, respectively.
34
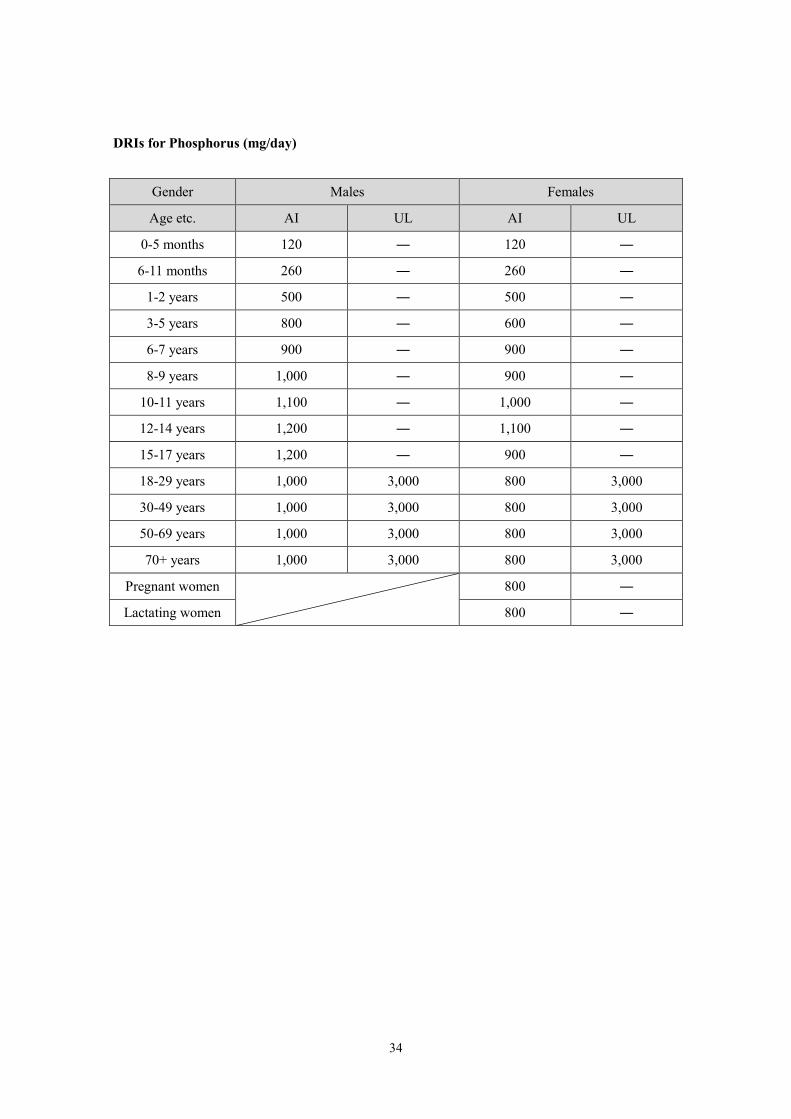
DRIs for Phosphorus (mg/day)
Gender Males Females
Age etc. AI UL AI UL
0-5 months 120 ― 120 ―
6-11 months 260 ― 260 ―
1-2 years 500 ― 500 ―
3-5 years 800 ― 600 ―
6-7 years 900 ― 900 ―
8-9 years 1,000 ― 900 ―
10-11 years 1,100 ― 1,000 ―
12-14 years 1,200 ― 1,100 ―
15-17 years 1,200 ― 900 ―
18-29 years 1,000 3,000 800 3,000
30-49 years 1,000 3,000 800 3,000
50-69 years 1,000 3,000 800 3,000
70+ years 1,000 3,000 800 3,000
Pregnant women
800 ―
Lactating women 800 ―
35
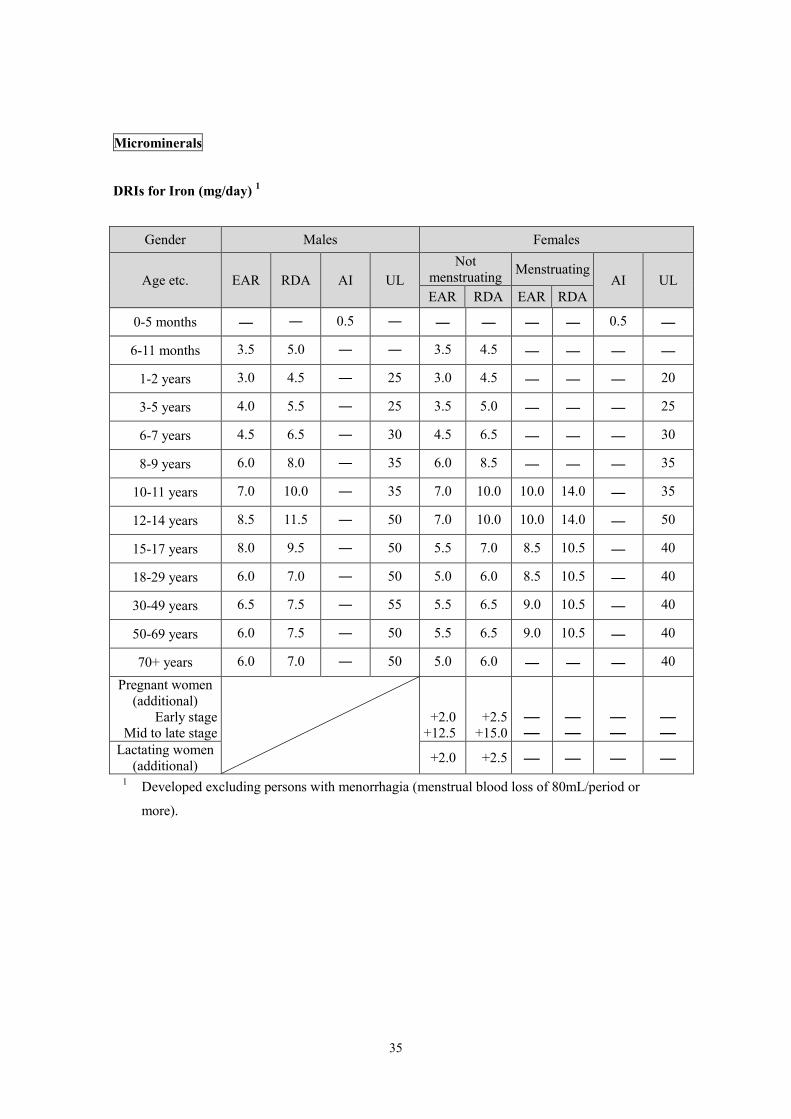
Microminerals
DRIs for Iron (mg/day) 1
Gender Males Females
Age etc. EAR RDA AI UL Not
menstruating Menstruating AI UL
EAR RDA EAR RDA
0-5 months ― ― 0.5 ― ― ― ― ― 0.5 ―
6-11 months 3.5 5.0 ― ― 3.5 4.5 ― ― ― ―
1-2 years 3.0 4.5 ― 25 3.0 4.5 ― ― ― 20
3-5 years 4.0 5.5 ― 25 3.5 5.0 ― ― ― 25
6-7 years 4.5 6.5 ― 30 4.5 6.5 ― ― ― 30
8-9 years 6.0 8.0 ― 35 6.0 8.5 ― ― ― 35
10-11 years 7.0 10.0 ― 35 7.0 10.0 10.0 14.0 ― 35
12-14 years 8.5 11.5 ― 50 7.0 10.0 10.0 14.0 ― 50
15-17 years 8.0 9.5 ― 50 5.5 7.0 8.5 10.5 ― 40
18-29 years 6.0 7.0 ― 50 5.0 6.0 8.5 10.5 ― 40
30-49 years 6.5 7.5 ― 55 5.5 6.5 9.0 10.5 ― 40
50-69 years 6.0 7.5 ― 50 5.5 6.5 9.0 10.5 ― 40
70+ years 6.0 7.0 ― 50 5.0 6.0 ― ― ― 40
Pregnant women (additional)
Early stage Mid to late stage +2.0
+12.5 +2.5
+15.0 ― ―
― ―
― ―
― ―
Lactating women (additional) +2.0 +2.5 ― ― ― ―
1 Developed excluding persons with menorrhagia (menstrual blood loss of 80mL/period or
more).
36
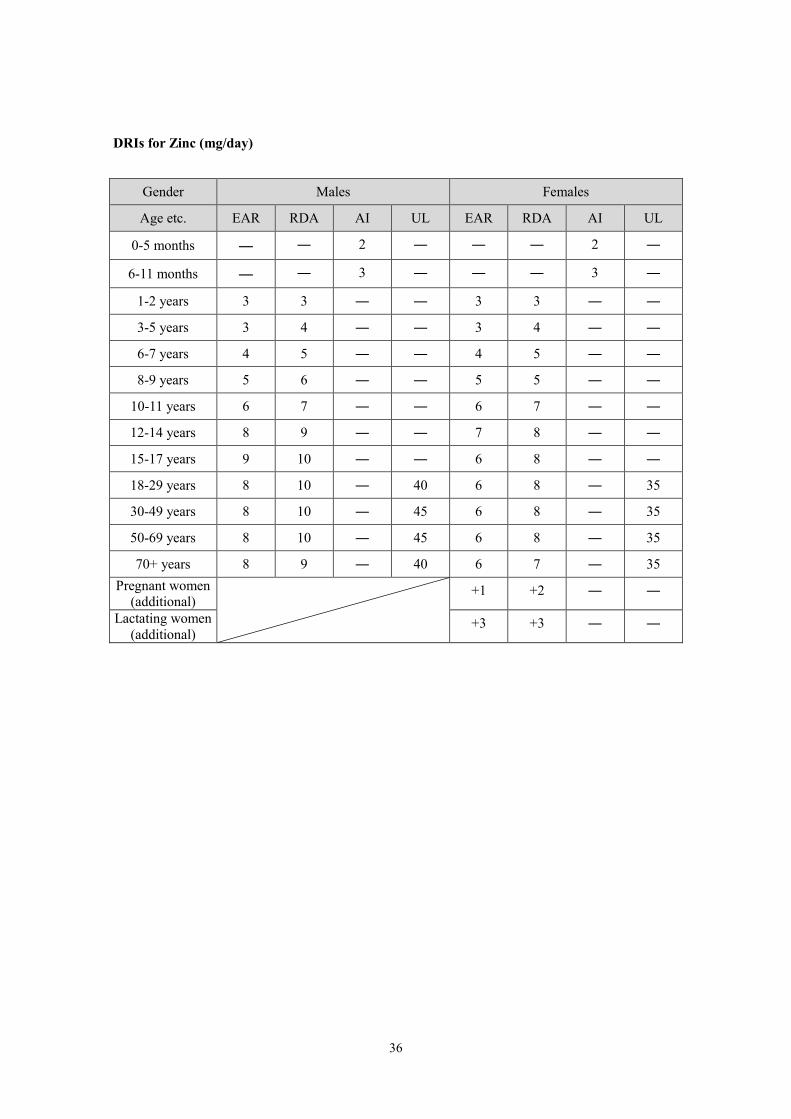
DRIs for Zinc (mg/day)
Gender Males Females
Age etc. EAR RDA AI UL EAR RDA AI UL
0-5 months ― ― 2 ― ― ― 2 ―
6-11 months ― ― 3 ― ― ― 3 ―
1-2 years 3 3 ― ― 3 3 ― ―
3-5 years 3 4 ― ― 3 4 ― ―
6-7 years 4 5 ― ― 4 5 ― ―
8-9 years 5 6 ― ― 5 5 ― ―
10-11 years 6 7 ― ― 6 7 ― ―
12-14 years 8 9 ― ― 7 8 ― ―
15-17 years 9 10 ― ― 6 8 ― ―
18-29 years 8 10 ― 40 6 8 ― 35
30-49 years 8 10 ― 45 6 8 ― 35
50-69 years 8 10 ― 45 6 8 ― 35
70+ years 8 9 ― 40 6 7 ― 35 Pregnant women
(additional) +1 +2 ― ―
Lactating women (additional)
+3 +3 ― ―
37
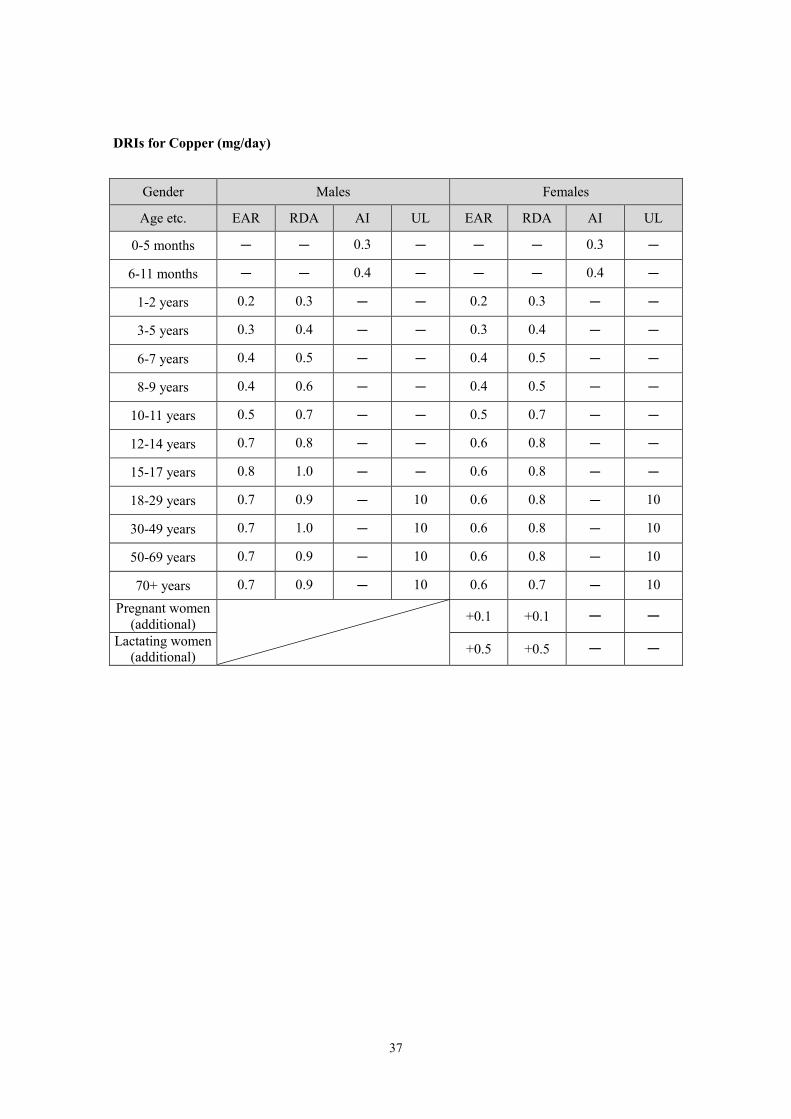
DRIs for Copper (mg/day)
Gender Males Females
Age etc. EAR RDA AI UL EAR RDA AI UL
0-5 months - - 0.3 - - - 0.3 -
6-11 months - - 0.4 - - - 0.4 -
1-2 years 0.2 0.3 - - 0.2 0.3 - -
3-5 years 0.3 0.4 - - 0.3 0.4 - -
6-7 years 0.4 0.5 - - 0.4 0.5 - -
8-9 years 0.4 0.6 - - 0.4 0.5 - -
10-11 years 0.5 0.7 - - 0.5 0.7 - -
12-14 years 0.7 0.8 - - 0.6 0.8 - -
15-17 years 0.8 1.0 - - 0.6 0.8 - -
18-29 years 0.7 0.9 - 10 0.6 0.8 - 10
30-49 years 0.7 1.0 - 10 0.6 0.8 - 10
50-69 years 0.7 0.9 - 10 0.6 0.8 - 10
70+ years 0.7 0.9 - 10 0.6 0.7 - 10
Pregnant women (additional)
+0.1 +0.1 - - Lactating women
(additional) +0.5 +0.5 - -
38
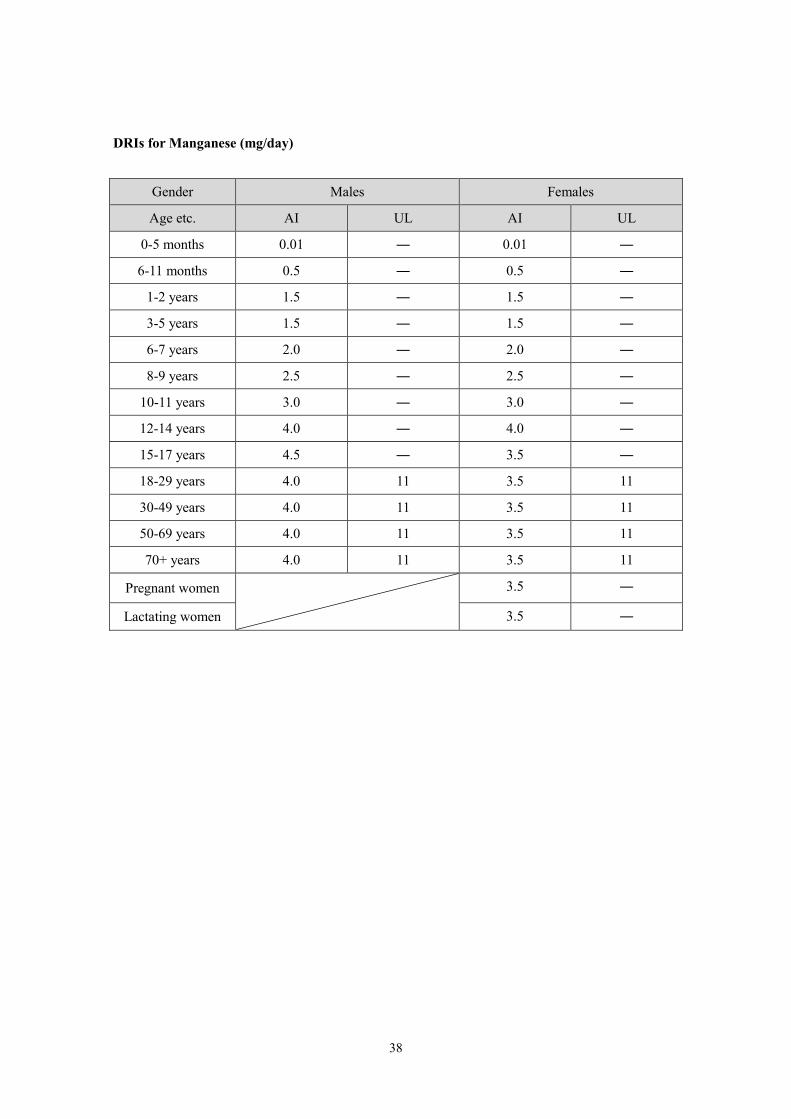
DRIs for Manganese (mg/day)
Gender Males Females
Age etc. AI UL AI UL
0-5 months 0.01 ― 0.01 ―
6-11 months 0.5 ― 0.5 ―
1-2 years 1.5 ― 1.5 ―
3-5 years 1.5 ― 1.5 ―
6-7 years 2.0 ― 2.0 ―
8-9 years 2.5 ― 2.5 ―
10-11 years 3.0 ― 3.0 ―
12-14 years 4.0 ― 4.0 ―
15-17 years 4.5 ― 3.5 ―
18-29 years 4.0 11 3.5 11
30-49 years 4.0 11 3.5 11
50-69 years 4.0 11 3.5 11
70+ years 4.0 11 3.5 11
Pregnant women
3.5 ―
Lactating women 3.5 ―
39
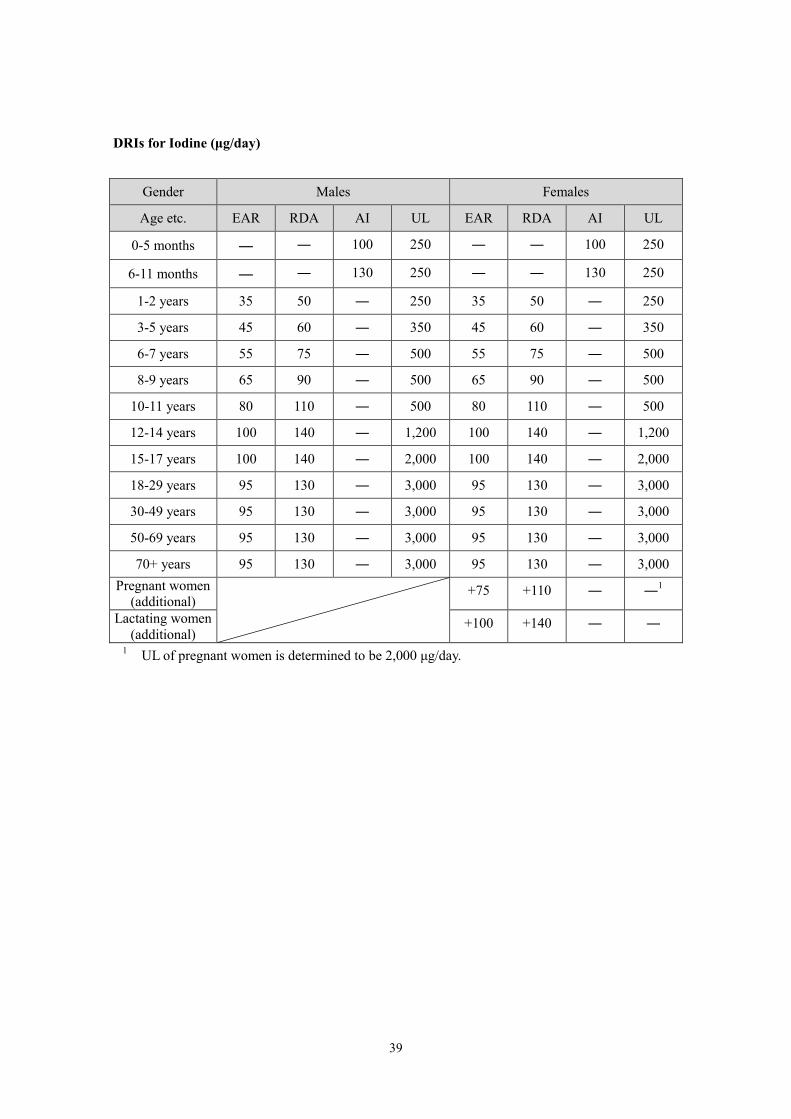
DRIs for Iodine (μg/day)
Gender Males Females
Age etc. EAR RDA AI UL EAR RDA AI UL
0-5 months ― ― 100 250 ― ― 100 250
6-11 months ― ― 130 250 ― ― 130 250
1-2 years 35 50 ― 250 35 50 ― 250
3-5 years 45 60 ― 350 45 60 ― 350
6-7 years 55 75 ― 500 55 75 ― 500
8-9 years 65 90 ― 500 65 90 ― 500
10-11 years 80 110 ― 500 80 110 ― 500
12-14 years 100 140 ― 1,200 100 140 ― 1,200
15-17 years 100 140 ― 2,000 100 140 ― 2,000
18-29 years 95 130 ― 3,000 95 130 ― 3,000
30-49 years 95 130 ― 3,000 95 130 ― 3,000
50-69 years 95 130 ― 3,000 95 130 ― 3,000
70+ years 95 130 ― 3,000 95 130 ― 3,000 Pregnant women
(additional) +75 +110 ― ―1
Lactating women (additional)
+100 +140 ― ―
1 UL of pregnant women is determined to be 2,000 μg/day.
40
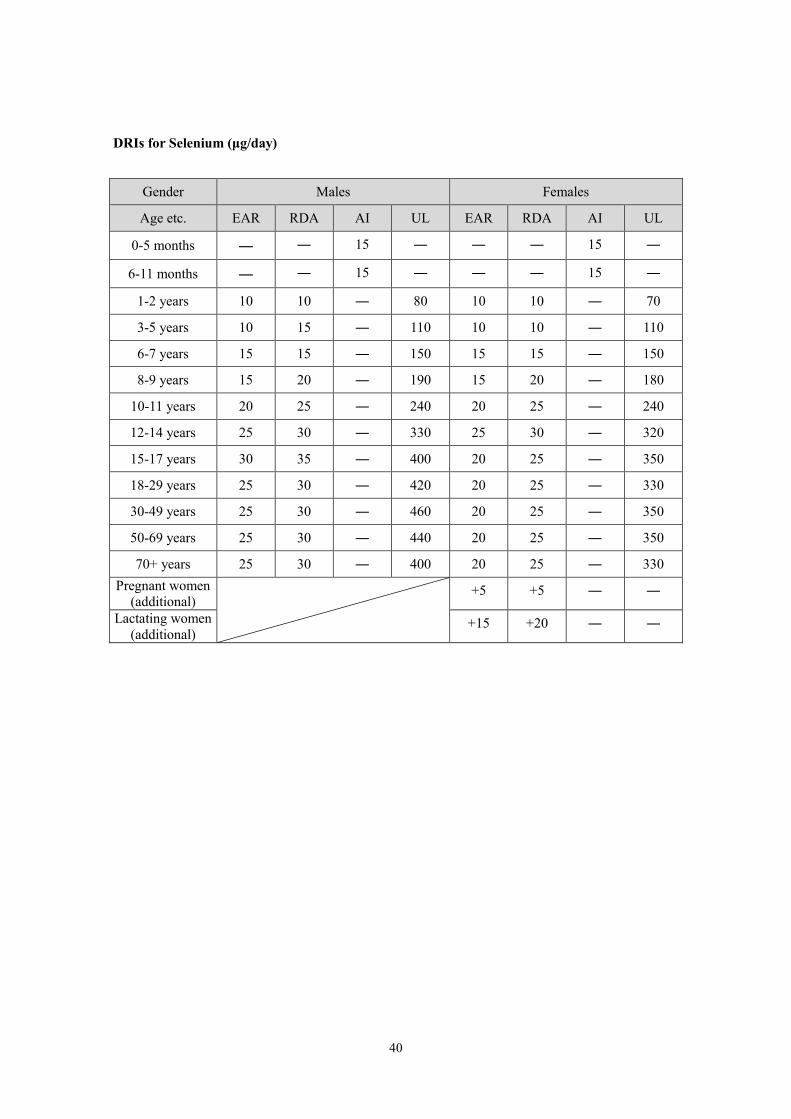
DRIs for Selenium (μg/day)
Gender Males Females
Age etc. EAR RDA AI UL EAR RDA AI UL
0-5 months ― ― 15 ― ― ― 15 ―
6-11 months ― ― 15 ― ― ― 15 ―
1-2 years 10 10 ― 80 10 10 ― 70
3-5 years 10 15 ― 110 10 10 ― 110
6-7 years 15 15 ― 150 15 15 ― 150
8-9 years 15 20 ― 190 15 20 ― 180
10-11 years 20 25 ― 240 20 25 ― 240
12-14 years 25 30 ― 330 25 30 ― 320
15-17 years 30 35 ― 400 20 25 ― 350
18-29 years 25 30 ― 420 20 25 ― 330
30-49 years 25 30 ― 460 20 25 ― 350
50-69 years 25 30 ― 440 20 25 ― 350
70+ years 25 30 ― 400 20 25 ― 330 Pregnant women
(additional) +5 +5 ― ―
Lactating women (additional)
+15 +20 ― ―
41
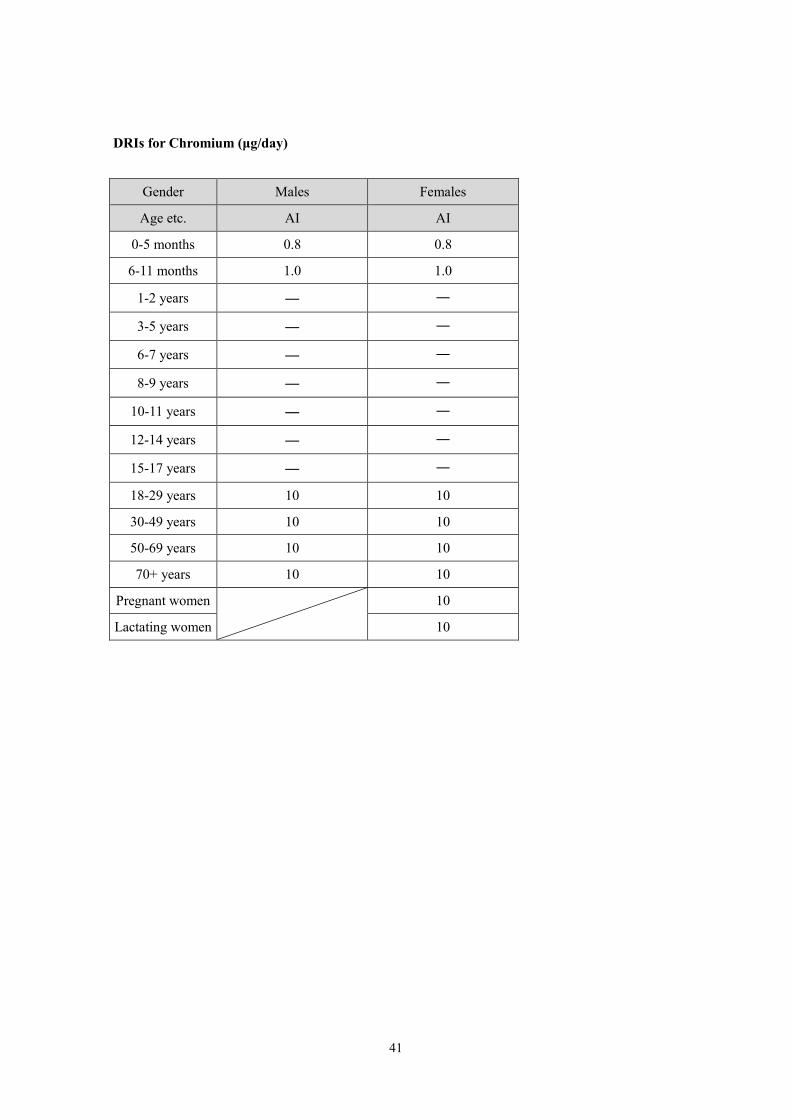
DRIs for Chromium (μg/day)
Gender Males Females
Age etc. AI AI
0-5 months 0.8 0.8
6-11 months 1.0 1.0
1-2 years ― ―
3-5 years ― ―
6-7 years ― ―
8-9 years ― ―
10-11 years ― ―
12-14 years ― ―
15-17 years ― ―
18-29 years 10 10
30-49 years 10 10
50-69 years 10 10
70+ years 10 10
Pregnant women
10
Lactating women 10
42
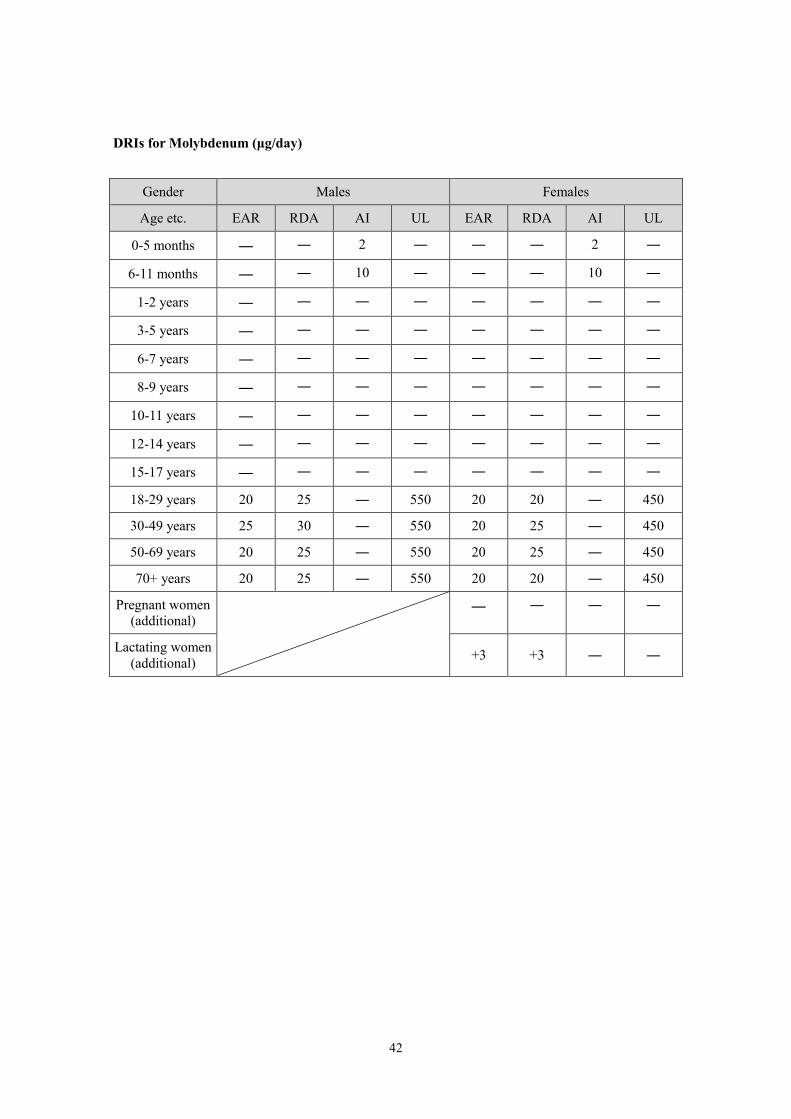
DRIs for Molybdenum (μg/day)
Gender Males Females
Age etc. EAR RDA AI UL EAR RDA AI UL
0-5 months ― ― 2 ― ― ― 2 ―
6-11 months ― ― 10 ― ― ― 10 ―
1-2 years ― ― ― ― ― ― ― ―
3-5 years ― ― ― ― ― ― ― ―
6-7 years ― ― ― ― ― ― ― ―
8-9 years ― ― ― ― ― ― ― ―
10-11 years ― ― ― ― ― ― ― ―
12-14 years ― ― ― ― ― ― ― ―
15-17 years ― ― ― ― ― ― ― ―
18-29 years 20 25 ― 550 20 20 ― 450
30-49 years 25 30 ― 550 20 25 ― 450
50-69 years 20 25 ― 550 20 25 ― 450
70+ years 20 25 ― 550 20 20 ― 450
Pregnant women (additional)
― ― ― ―
Lactating women (additional) +3 +3 ― ―