
Overview of Control Area / Balancing Authority Functional ... · 1 MAY 2010 PRELIMINARY TECHNICAL...
33
1 MAY 2010 PRELIMINARY TECHNICAL CONFERENCE REPORT – WORK IN PROGRESS Overview of Control Area / Balancing Authority Functional Requirements Matt Wolf Manager – Operations Support May 5, 2010
Transcript of Overview of Control Area / Balancing Authority Functional ... · 1 MAY 2010 PRELIMINARY TECHNICAL...

1
MAY 2010 PRELIMINARY TECHNICAL CONFERENCE REPORT – WORK IN PROGRESS
Overview of Control Area / Balancing AuthorityFunctional Requirements
Matt WolfManager – Operations Support
May 5, 2010
2
MAY 2010 PRELIMINARY TECHNICAL CONFERENCE REPORT – WORK IN PROGRESS
Outline of Presentation
• Importance of “balancing” power production with powerdemand.
• Overview of Balancing Authorities (BAs).
• Describe how an EAI Balancing Area is projected to look asa stand-alone balancing authority.
• Overview of the cost of establishing a BA.
• Implications for EAI generation requirements.

3
MAY 2010 PRELIMINARY TECHNICAL CONFERENCE REPORT – WORK IN PROGRESS
General
• For purposes of this presentation the following terms areinterchangeable:– Control Area - (old terminology)
– Balancing Area - (generators, loads, transmission within a metered boundary)
– Balancing Authority - (responsible entity)
• This presentation is focused on generation operation aspects of abalancing area.– It is not addressing the transmission operations aspects of the
balancing area.
• The information specific to the Entergy Arkansas area presentedbelow is preliminary and based on current historical sources ofinformation and current NERC standards.

4
MAY 2010 PRELIMINARY TECHNICAL CONFERENCE REPORT – WORK IN PROGRESS
The Importance of “Balancing”
• Maintain Interconnection Frequency– The power grids in the US and Canada are designed to
operate at or near 60 Hz.– If there is more generation than demand, frequency goes up.– If there is less generation than demand, frequency goes
down.
• Control the flow of power.– Avoided overloading transmission lines.– Avoided the inadvertent exchange of energy.

5
MAY 2010 PRELIMINARY TECHNICAL CONFERENCE REPORT – WORK IN PROGRESS
Major US “Interconnections”
172,000 MW610,000 MW
64,000 MW

6
MAY 2010 PRELIMINARY TECHNICAL CONFERENCE REPORT – WORK IN PROGRESS
NERC Balancing Authorities

7
MAY 2010 PRELIMINARY TECHNICAL CONFERENCE REPORT – WORK IN PROGRESS
Entergy Area Balancing Authorities
• Over 100 balancing authoritiesin the US and Canada
• Largest: 136,000 MW Peak
• Smallest: 38 MW Peak
• The load on the Entergytransmission system iscurrently served byapproximately 12 differentbalancing authorities.

8
MAY 2010 PRELIMINARY TECHNICAL CONFERENCE REPORT – WORK IN PROGRESS
What is a Balancing Authority?
• NERC definition of Balancing Authority“One of the regional functions contributing to the reliable planningand operation of the bulk power system. The Balancing Authorityintegrates resource plans ahead of time, and maintains in real timethe balance of electricity resources and electricity demand.”
• Basically, what does a Balancing Authority do?
1. Continuously balances the Control Area’s net scheduledinterchange with its actual interchange by dispatching generationunits used for regulation.
2. Helps the entire Interconnection regulate and stabilize thealternating current frequency.

9
MAY 2010 PRELIMINARY TECHNICAL CONFERENCE REPORT – WORK IN PROGRESS
Entergy Arkansas
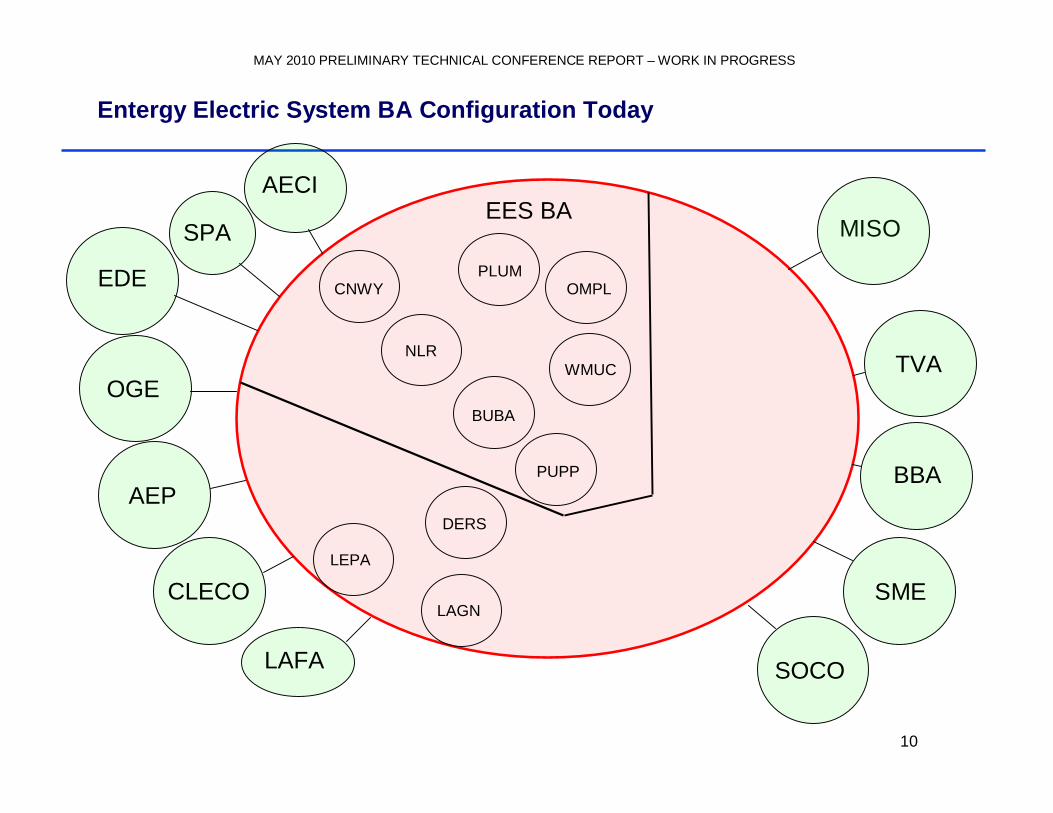
• EAI is currently in the Entergy Electric System (EES)Balancing Authority (BA).
• EAI must provide a BA solution by December 19, 2013.
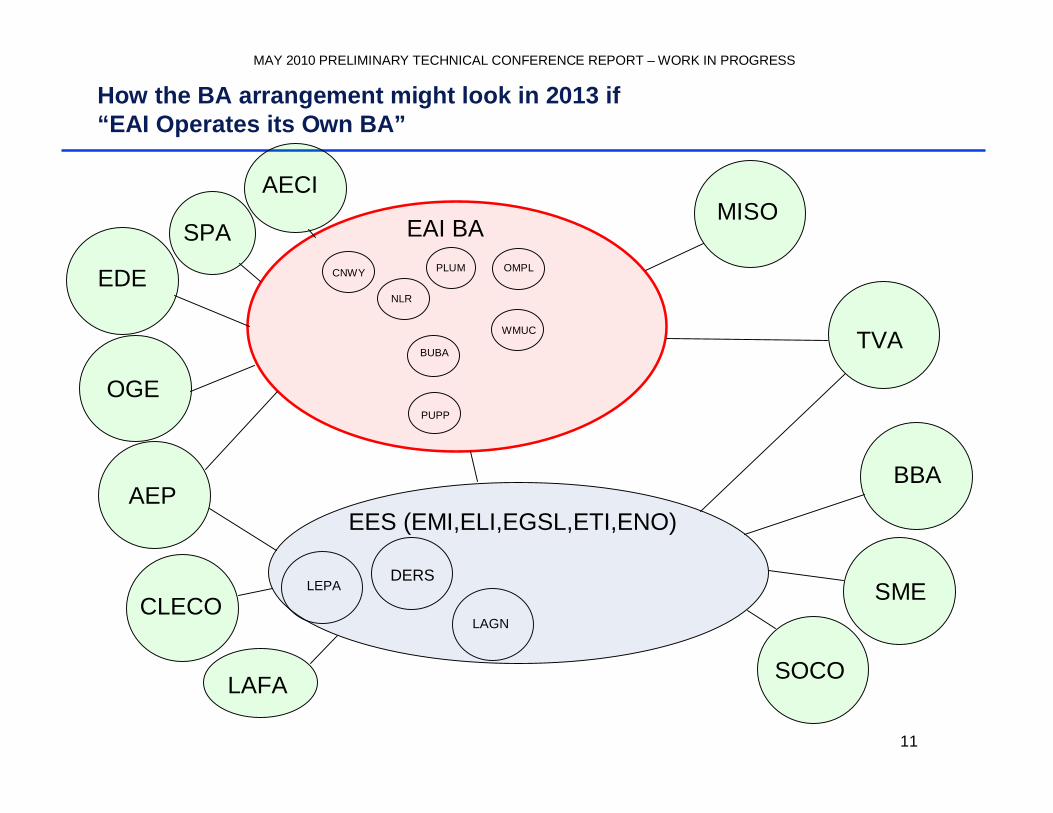
• One strategy EAI is considering for post-2013operations would require it to operate in a new BA thatis separate from the EES BA.
• EAI plans to explore other alternatives for providing BAfunctions over the next year.
• The schedule and risk of other alternatives such as theSPP consolidated BA will be considered.
• Regardless of the final decision, EAI’s generation planshould provide resources that are capable of serving itsload as if it operated a Balancing Authority.
10
MAY 2010 PRELIMINARY TECHNICAL CONFERENCE REPORT – WORK IN PROGRESS
Entergy Electric System BA Configuration Today
CNWY
LEPA
LAGN
OMPL
NLR
BUBA
WMUC
PUPP
AECI
EDE
OGE
AEP
CLECO
LAFA
MISO
TVA
BBA
SME
SOCO
SPAEES BA
PLUM
DERS
11
MAY 2010 PRELIMINARY TECHNICAL CONFERENCE REPORT – WORK IN PROGRESS
How the BA arrangement might look in 2013 if“EAI Operates its Own BA”
CNWY
LEPA
LAGN
OMPL
NLR
BUBA
WMUC
PUPP
AECI
EDE
OGE
AEP
CLECO
LAFA
MISO
TVA
BBA
SME
SOCO
SPA EAI BA
EES (EMI,ELI,EGSL,ETI,ENO)
PLUM
DERS

12
MAY 2010 PRELIMINARY TECHNICAL CONFERENCE REPORT – WORK IN PROGRESS
Key point
CNWY
LEPALAGN
OMPL
NLR
BUBA
WMUC
PUPP
EAI BA
EES (EMI,ELI,EGSL,ETI,ENO)
Single OATT
PLUM
DERS
If EAI continues tooperate under the ETROATT, EAItransmission facilitieswould be planned andoperated under theETR OATT and ICTalong with thetransmission facilitiesof the other ETROperating Companies

13
MAY 2010 PRELIMINARY TECHNICAL CONFERENCE REPORT – WORK IN PROGRESS
SPP Option
LEPALAGN
EES (EMI,ELI,EGSL,ETI,ENO)
ETR OATT
CNWY OMPL
NLR
BUBA
WMUC
PUPP
EAI BAPLUM
DERS
If EAI moves to theSPP OATT, EAItransmission facilitieswould be planned andoperated under theSPP OATT along withthe transmissionfacilities of the otherSPP Companies.
The EAI BA may justbecome a “BalancingZone” in the SPPConsolidate BalancingAuthority.
SPP OATT

14
MAY 2010 PRELIMINARY TECHNICAL CONFERENCE REPORT – WORK IN PROGRESS
What would it take to set up an EAI BA?
• Preliminary estimates were developed in 2008 and 2009.
• Conservative assumptions were used in order to bound the cost.– Build and equip a new building.– Duplicate almost all functions that are currently being conducted by the System
Planning and Operations department in Entergy Services, Inc.– Buy and install a new generation management system.– Upgrade some tie line meters.
• Results ($ 2009)Startup Cost: $23 MMRun Cost: $14 MM/yearLess ESI Charges: ($ 6) MM/year============================================Net Run Cost: $8 MM/year
Employees: 64 FTEs
• The implementation of this plan for EAI self provision of BA functions is expected totake approximately two years.

15
MAY 2010 PRELIMINARY TECHNICAL CONFERENCE REPORT – WORK IN PROGRESS
Implications for Generation Supply

16
MAY 2010 PRELIMINARY TECHNICAL CONFERENCE REPORT – WORK IN PROGRESS
Area Control Error or “ACE”
• Dispatchers have a single real-time measure that tells themhow well they are doing.
• It incorporates both balance and frequency control.
• The goal of a generation dispatcher is to maintain “ACE” asclose to zero as possible.

17
MAY 2010 PRELIMINARY TECHNICAL CONFERENCE REPORT – WORK IN PROGRESS
Three key NERC Metrics based on ACE
• Control Performance Standard 1 or CPS1– Uses 1 minute averages of ACE in the calculation.– Measure whether a BA is doing their part to help control frequency over the long-term.
• Control Performance Standard 2 or CPS 2– Uses 10 minute averages of ACE in the calculation.– Measure how well a BA is balancing over a period of a month.– 90% of the ten minute periods in a month must be within a certain tolerance.
• Disturbance Control Standard or DCS– Uses two ACE readings (before and after).– Measures how well a BA or a group of BAs respond to sudden loss of supply.– Basically, a BA or reserve sharing group has 15 minutes to replace the sudden loss of
supply.
• The current standards are not carved in stone and may change over time. Forexample, the Entergy BA is currently participating in a proof-of-concept field trial thatmay lead to a replacement for CPS 2.
18
MAY 2010 PRELIMINARY TECHNICAL CONFERENCE REPORT – WORK IN PROGRESS
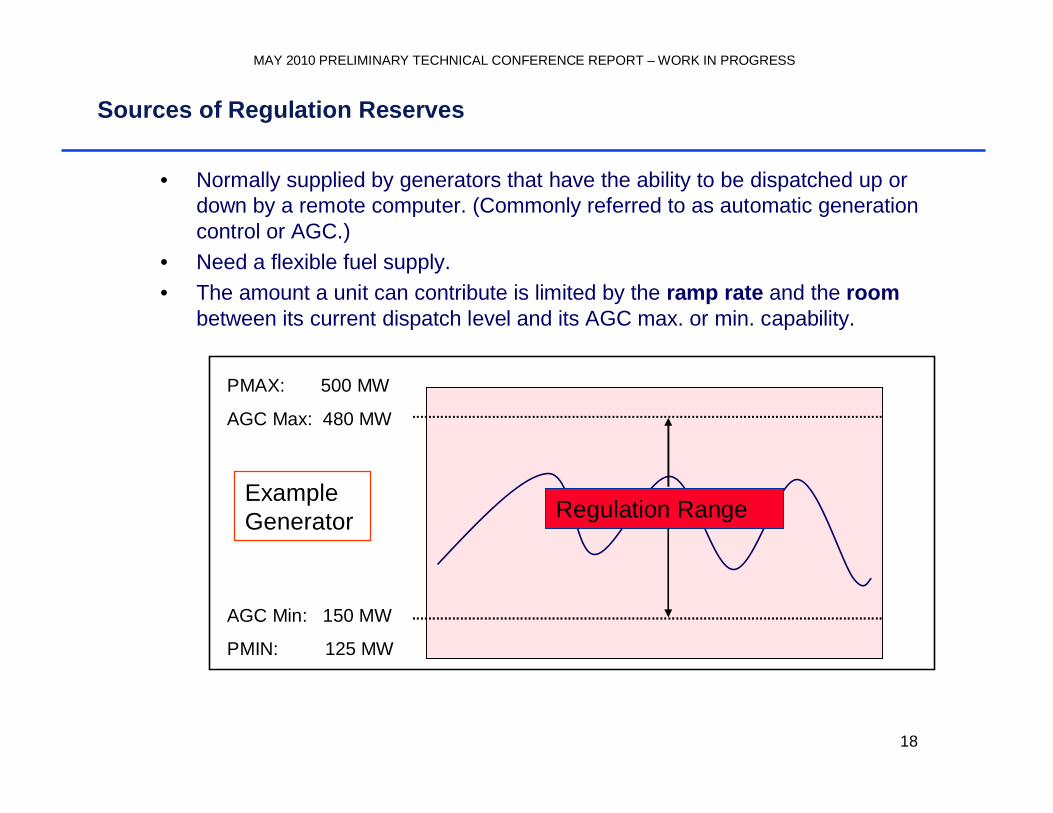
Sources of Regulation Reserves
• Normally supplied by generators that have the ability to be dispatched up ordown by a remote computer. (Commonly referred to as automatic generationcontrol or AGC.)
• Need a flexible fuel supply.• The amount a unit can contribute is limited by the ramp rate and the room
between its current dispatch level and its AGC max. or min. capability.
PMAX: 500 MW
AGC Max: 480 MW
AGC Min: 150 MW
PMIN: 125 MW
ExampleGenerator Regulation Range

19
MAY 2010 PRELIMINARY TECHNICAL CONFERENCE REPORT – WORK IN PROGRESS
Sources of Contingency Reserves
• Can be supplied by generators that are online (spinning) and have room to move up.• Can also be supplied by “quick-start” generators that can be started and turned up within 15
minutes.• Also need a flexible fuel supply.• The amount generator can contribute is also limited by ramp rate and the room between its
current dispatch level and its maximum capability.• Can be supplied by demand response controlled by the system operator.
ExampleGenerator
PMAX: 500 MW
AGC Max: 480 MW
AGC Min: 150 MW
PMIN: 125 MW
Contingency Reserves

20
MAY 2010 PRELIMINARY TECHNICAL CONFERENCE REPORT – WORK IN PROGRESS
Contingency Reserves
• Today, the Entergy BA participates in the SPP Reserve Sharing Groupwhereby it shares contingency reserves with other member of thegroup. If a large unit trips off-line in the Entergy BA, it receivesassistance from other BAs that are members of the RSG and viceversa.
• For an EAI BA, providing contingency reserves to cover its singlelargest contingency would be difficult.(Approximately 1,000 MW in 15 minutes.)
• Continued participation in a contingency reserve sharing group canreduce the amount of contingency reserves EAI would need to carry byas much as 85%.
21
MAY 2010 PRELIMINARY TECHNICAL CONFERENCE REPORT – WORK IN PROGRESS
What would an EAI BA look like?(based on the current general configuration)
– Peak load of approximately 6,000 MW.» The demand will be mostly comprised of the customers of EAI and
AECC.» The Entergy OATT would have provision for load imbalance service for
other wholesale customers that may be in the BA.
– There would be four generators in the BA that would not bedispatched by the EAI dispatcher.
» These independently dispatched generators would, at times, createadditional imbalances by over or under generating.
» The Entergy OATT would have provision for providing regulation andimbalance energy to these generators.

22
MAY 2010 PRELIMINARY TECHNICAL CONFERENCE REPORT – WORK IN PROGRESS
EAI BA Characteristics
– A significant regulation burden due to one highly varyingindustrial customer.
» Increases the need for more regulation reserves.
– Six EAI dispatched generators with a maximum capability of over800 MW.
» Increases the need for access to contingency reserves.

23
MAY 2010 PRELIMINARY TECHNICAL CONFERENCE REPORT – WORK IN PROGRESS
August 2009 Actual Load Data (Includes AECC)
0
1000
2000
3000
4000
5000
6000
7000
Hours
MW
1 2 3 4 5 6 7 8 9 10 11 12 13 14 15 16 17 18 19 20 21 22 23 24 25 26 27 28 29 30 31DAY

24
MAY 2010 PRELIMINARY TECHNICAL CONFERENCE REPORT – WORK IN PROGRESS
August 4, 2009
3000
4000
5000
6000
MW Load Following
Requirement
Regulation
1 2 3 4 5 6 7 8 9 10 11 12 13 14 15 16 17 18 19 20 21 22 23 24Hour

25
MAY 2010 PRELIMINARY TECHNICAL CONFERENCE REPORT – WORK IN PROGRESS
3000
4000
5000
6000
7000
MW
August 4, 2009
Load FollowingRequirement
Regulation
Flexible Generation
Flexible Fuel Contingency Reserves
1 2 3 4 5 6 7 8 9 10 11 12 13 14 15 16 17 18 19 20 21 22 23 24Hour
26
MAY 2010 PRELIMINARY TECHNICAL CONFERENCE REPORT – WORK IN PROGRESS
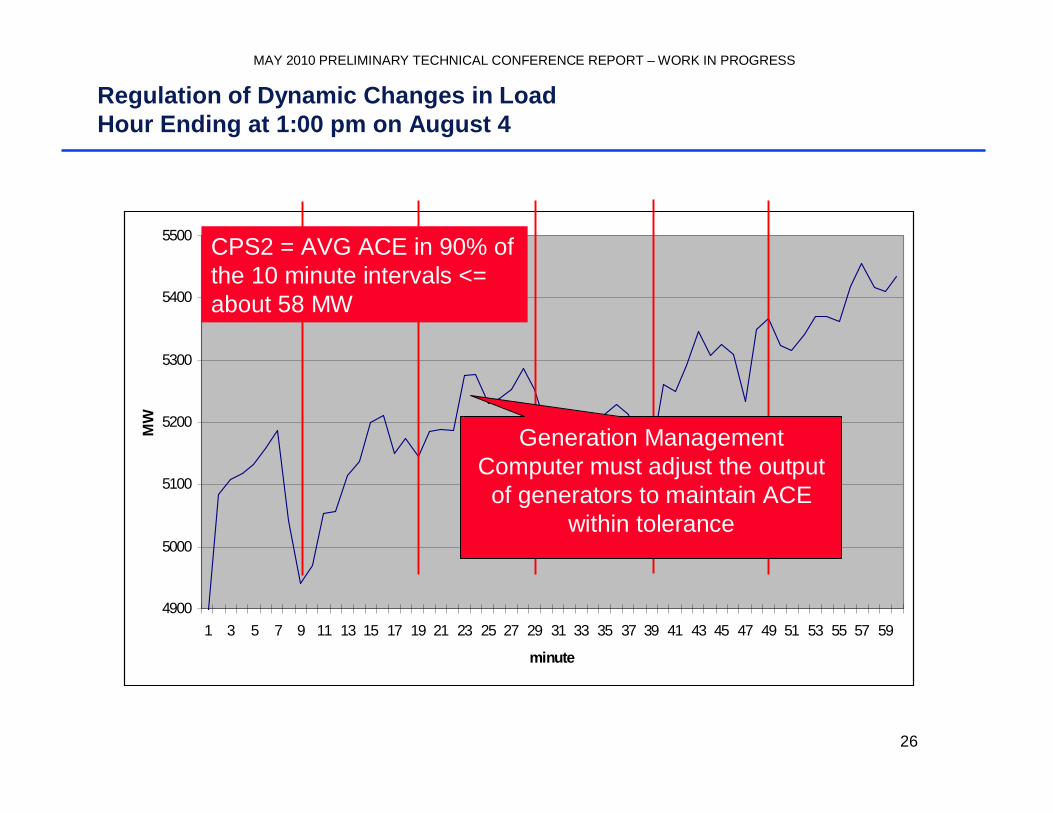
Regulation of Dynamic Changes in LoadHour Ending at 1:00 pm on August 4
4900
5000
5100
5200
5300
5400
5500
1 3 5 7 9 11 13 15 17 19 21 23 25 27 29 31 33 35 37 39 41 43 45 47 49 51 53 55 57 59
minute
MW
CPS2 = AVG ACE in 90% ofthe 10 minute intervals <=about 58 MW
Generation ManagementComputer must adjust the output
of generators to maintain ACEwithin tolerance

27
MAY 2010 PRELIMINARY TECHNICAL CONFERENCE REPORT – WORK IN PROGRESS
Example Industrial Load
0
100
200
300
400
500
600
MW
1 2 3 4 5 6 7 8 9 10 11 12 13 14 15 16 17 18 19 20 21 22 23 24
Hour

28
MAY 2010 PRELIMINARY TECHNICAL CONFERENCE REPORT – WORK IN PROGRESS
Factors that Affect the Generation Supply Plan toMeet the Requirements for BA Performance
• Frequency Support for the eastern Interconnection
• Changes in transactions (ramp periods) with other balancingareas.– Must be managed carefully.– Changes in transactions by third parties can be very problematic.
• Imbalances from independently dispatched generators.
• Imbalances from internal third party loads.
• Changes in the output of Qualified Facilities (QFs).
29
MAY 2010 PRELIMINARY TECHNICAL CONFERENCE REPORT – WORK IN PROGRESS
Other Considerations
• Contingencies will happen:– Generators trip or become constrained due to
electromechanical/mechanical issues– Generator response times can vary– Telemetry can fail– Transmission and fuel supply constraints will occur
• There will also be planned outages of both transmission andgeneration resources.
• It is important that contingency and regulation reserves beproperly dispersed among multiple generators.
• To ensure adequate supply in real time, a higher planning targetwill be used on a day-ahead basis.

30
MAY 2010 PRELIMINARY TECHNICAL CONFERENCE REPORT – WORK IN PROGRESS
Preliminary Estimates
• Regulation Capacity Needs for Load
– Need to be able to achieve a system ramp of approximately 20MW/minute.
– Need to maintain regulation room of about +/- 200 MW.
• Contingency Reserves Needs
– Assuming current Contingency Reserve Sharing Arrangements» Estimated to be approximately 150 MW / 15 minutes.
• Again, flexible fuel supplies are critical.
31
MAY 2010 PRELIMINARY TECHNICAL CONFERENCE REPORT – WORK IN PROGRESS
Summary
• EAI will continue to analyze the functional requirements for a balancingauthority as the study continues
• EAI’s Transition Plan will include provisions for the supply for generationresources and fuel supply arrangements that will allow EAI to meet therequired performance levels for providing EAI’s BA functions
• EAI will monitor developments in SPP– Consolidated balancing area– ACE diversity Interchange
• EAI will be investigating the feasibility of other third party arrangements.– Other reserve sharing groups– Purchases of regulation service

32
MAY 2010 PRELIMINARY TECHNICAL CONFERENCE REPORT – WORK IN PROGRESS
Supplemental

33
MAY 2010 PRELIMINARY TECHNICAL CONFERENCE REPORT – WORK IN PROGRESS
ACE - Simple Balancing Authority Example
AdjacentBA 1
AdjacentBA 2
M
M
BalancingAuthority
Schedule to BA 1 = 100 MW
Schedule to BA 2 = -50 MW
=====================
Net schedule = +50 MW
If Actual Interchange = 0 MW
And
Frequency = 60 Hz
Then
ACE = -50 MW
100 MW
-50 MW


