Česká spořitelna – FY 201 3 consolidated results (unaudited IFRS) 28 February 20 14 , Praha

Overview of Consolidated Financial Results for FY 3/2009and Full-term Forecasts for FY 3/2010
22
Caution concerning forward-looking statements
Forward-Looking and Cautionary Statements
This presentation contains forward-looking statements about our industry, business, plans and objectives, financial conditions and results of operations based on current expectations, assumptions, estimates and projections. These statements reflect future expectations, identify strategies, discuss market trends, contain projections of operational results and financial conditions, and state other forward-looking information. These forward-looking statements are subject to various known and unknown risks, uncertainties and other factors that could cause our actual results to differ from those suggested by any forward-looking statement. We assume no duty or obligation to update any forward-looking statement or to advise of any change in the assumptions and factors on which they are based. Risks, uncertainties or other factors that could cause actual results to differ materially from those expressed in any forward-looking statement include, without limitation:
(1) health concerns related to the use of tobacco products;(2) legal or regulatory developments and changes; including, without limitation, tax increases and restrictions
on sales, marketing and use of tobacco products, governmental investigations and privately imposed smoking restrictions;
(3) litigation in Japan and elsewhere;(4) our ability to further diversify our business beyond the tobacco industry;(5) our ability to successfully expand internationally and make investments outside Japan;(6) competition and changing consumer preferences;(7) the impact of any acquisitions or similar transactions;(8) local and global economic conditions; and(9) fluctuations in foreign exchange rates and the costs of raw materials.
1
Overview of Consolidated Financial Results for FY 3/2009
4
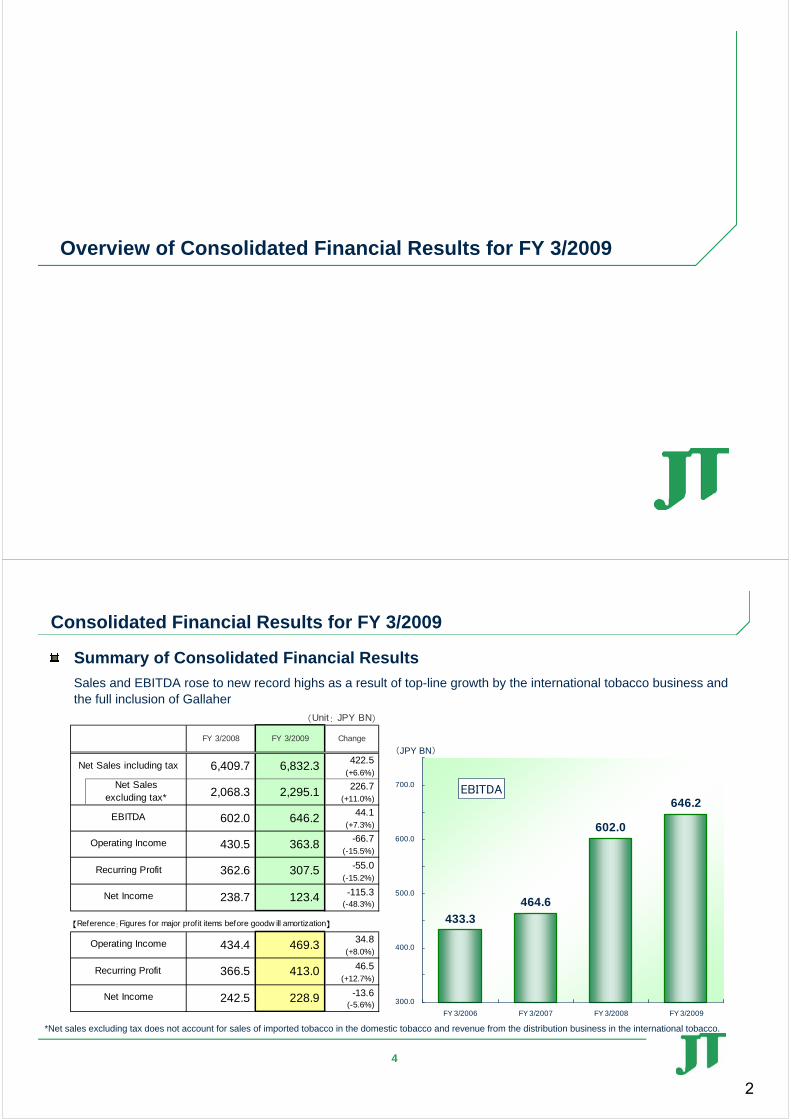
Summary of Consolidated Financial Results
Sales and EBITDA rose to new record highs as a result of top-line growth by the international tobacco business and the full inclusion of Gallaher
EBITDA
433.3
464.6
602.0
646.2
300.0
400.0
500.0
600.0
700.0
FY 3/2006 FY 3/2007 FY 3/2008 FY 3/2009
(JPY BN)
(Unit: JPY BN)
FY 3/2008 FY 3/2009 Change
422.5(+6.6%)
226.7(+11.0%)
44.1(+7.3%)
-66.7(-15.5%)
-55.0(-15.2%)
-115.3(-48.3%)
【Reference:Figures for major prof it items before goodw ill amortization】
34.8(+8.0%)
46.5(+12.7%)
-13.6(-5.6%)
363.8
307.5
123.4
228.9
469.3
413.0
Operating Income
Recurring Profit
Net Income 238.7
362.6
430.5
6,832.3
2,295.1
602.0
Net Sales including tax
Net Salesexcluding tax* 2,068.3
6,409.7
EBITDA 646.2
Operating Income
Recurring Profit
Net Income
434.4
366.5
242.5
Consolidated Financial Results for FY 3/2009
*Net sales excluding tax does not account for sales of imported tobacco in the domestic tobacco and revenue from the distribution business in the international tobacco.
2
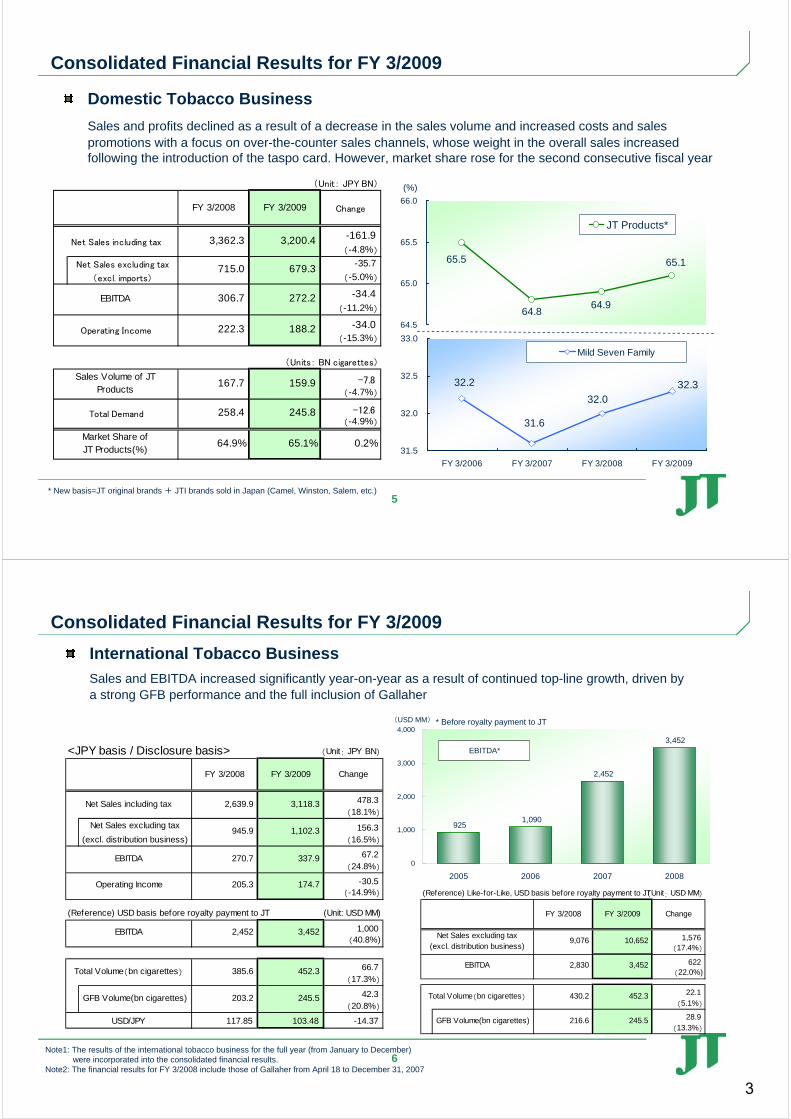
5
(Unit: JPY BN)
FY 3/2008 FY 3/2009 Change
-161.9
(-4.8%)
Net Sales excluding tax -35.7
(excl. imports) (-5.0%)
-34.4
(-11.2%)
-34.0(-15.3%)
(Units: BN cigarettes)
-7.8
(-4.7%)
-12.6(-4.9%)
Market Share ofJT Products(%)
Net Sales including tax
679.3
258.4 245.8Total Demand
3,362.3 3,200.4
306.7 272.2
Operating Income
Sales Volume of JTProducts
EBITDA
715.0
0.2%
167.7 159.9
222.3 188.2
64.9% 65.1%
Domestic Tobacco Business
Sales and profits declined as a result of a decrease in the sales volume and increased costs and sales promotions with a focus on over-the-counter sales channels, whose weight in the overall sales increased following the introduction of the taspo card. However, market share rose for the second consecutive fiscal year
(%)
32.2
31.6
32.032.3
31.5
32.0
32.5
33.0
FY 3/2006 FY 3/2007 FY 3/2008 FY 3/2009
Mild Seven Family
65.1
64.964.8
65.5
64.5
65.0
65.5
66.0
JT Products*
Consolidated Financial Results for FY 3/2009
* New basis=JT original brands + JTI brands sold in Japan (Camel, Winston, Salem, etc.)
6
(USD MM)
Consolidated Financial Results for FY 3/2009
3,452
9251,090
2,452
0
1,000
2,000
3,000
4,000
2005 2006 2007 2008
EBITDA*<JPY basis / Disclosure basis> (Unit: JPY BN)
FY 3/2008 FY 3/2009 Change
478.3
(18.1%)
Net Sales excluding tax 156.3 (excl. distribution business) (16.5%)
67.2
(24.8%)
-30.5
(-14.9%)
(Reference) USD basis before royalty payment to JT (Unit: USD MM)
1,000
(40.8%)
66.7
(17.3%)
42.3
(20.8%)
117.85 103.48 -14.37
452.3
203.2 245.5
205.3 174.7
3,452
USD/JPY
Operating Income
EBITDA 2,452
Total Volume(bn cigarettes)
GFB Volume(bn cigarettes)
385.6
Net Sales including tax
945.9 1,102.3
270.7 337.9
2,639.9 3,118.3
EBITDA
International Tobacco Business
Sales and EBITDA increased significantly year-on-year as a result of continued top-line growth, driven by a strong GFB performance and the full inclusion of Gallaher
Note1: The results of the international tobacco business for the full year (from January to December) were incorporated into the consolidated financial results.
Note2: The financial results for FY 3/2008 include those of Gallaher from April 18 to December 31, 2007
* Before royalty payment to JT
(Reference) Like-for-Like, USD basis before royalty payment to JT(Unit: USD MM)
FY 3/2008 FY 3/2009 Change
1,576
(17.4%)
622
(22.0%)
22.1
(5.1%)
28.9
(13.3%)
Net Sales excluding tax(excl. distribution business)
9,076 10,652
EBITDA 2,830
Total Volume(bn cigarettes)
GFB Volume(bn cigarettes)
430.2 452.3
216.6 245.5
3,452
3
7
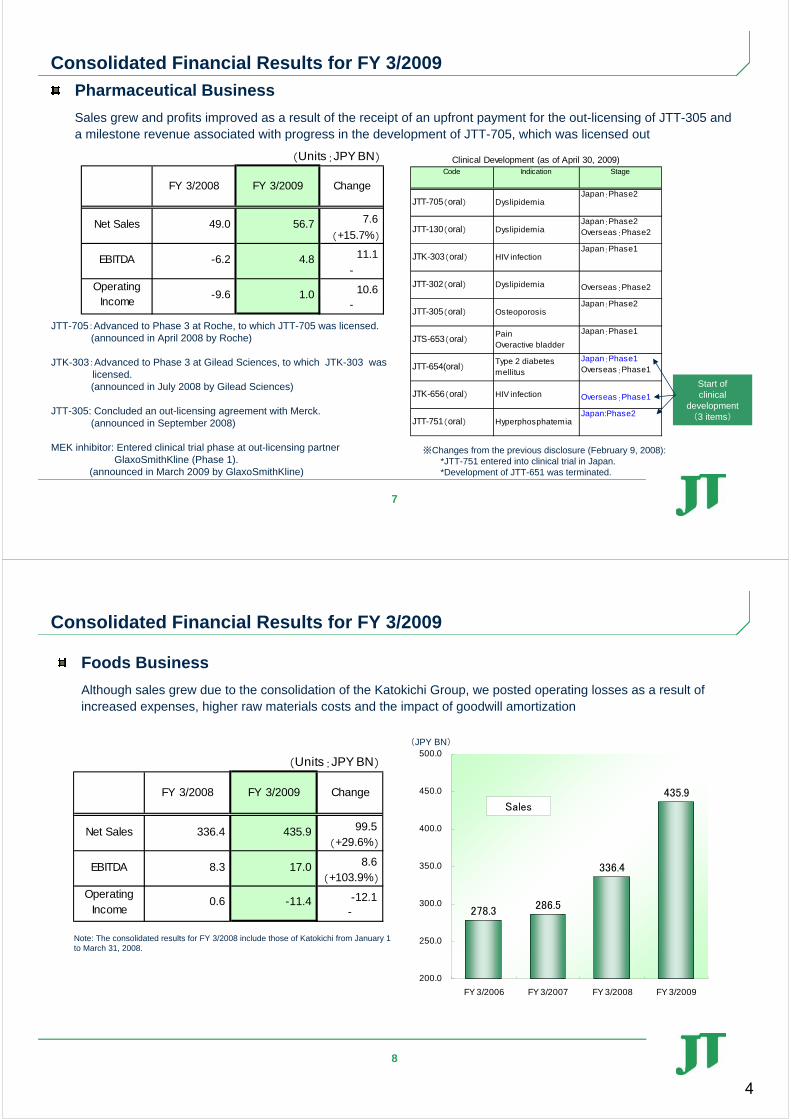
(Units:JPY BN)
FY 3/2008 FY 3/2009 Change
7.6
(+15.7%)
11.1
-
10.6-
OperatingIncome
-9.6 1.0
Net Sales 49.0 56.7
EBITDA -6.2 4.8
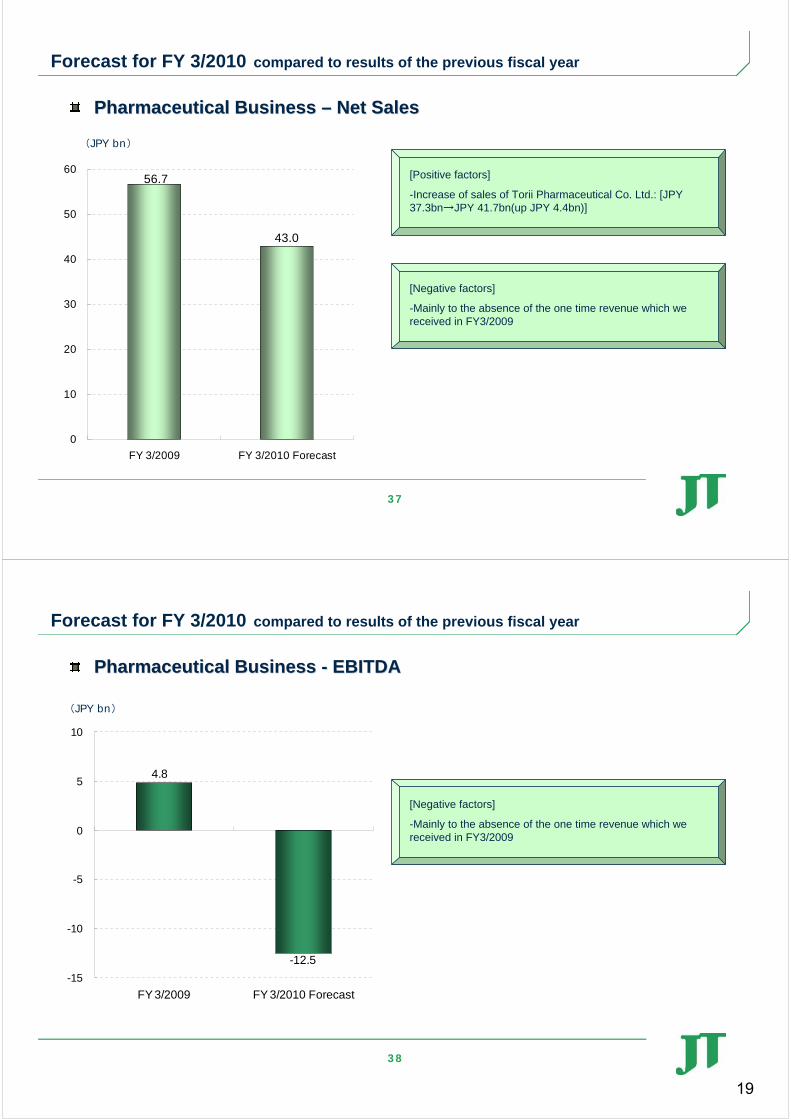
Pharmaceutical Business
Sales grew and profits improved as a result of the receipt of an upfront payment for the out-licensing of JTT-305 and a milestone revenue associated with progress in the development of JTT-705, which was licensed out
Start of clinical
development(3 items)
Consolidated Financial Results for FY 3/2009
JTT-705:Advanced to Phase 3 at Roche, to which JTT-705 was licensed.(announced in April 2008 by Roche)
JTK-303:Advanced to Phase 3 at Gilead Sciences, to which JTK-303 waslicensed.(announced in July 2008 by Gilead Sciences)
JTT-305: Concluded an out-licensing agreement with Merck.(announced in September 2008)
MEK inhibitor: Entered clinical trial phase at out-licensing partnerGlaxoSmithKline (Phase 1).
(announced in March 2009 by GlaxoSmithKline)
Code Indication Stage
JTT-705(oral) DyslipidemiaJapan:Phase2
JTT-130(oral) DyslipidemiaJapan:Phase2Overseas:Phase2
JTK-303(oral) HIV infectionJapan:Phase1
JTT-302(oral) Dyslipidemia Overseas:Phase2
JTT-305(oral) OsteoporosisJapan:Phase2
JTS-653(oral)PainOveractive bladder
Japan:Phase1
JTT-654(oral)Type 2 diabetesmellitus
Japan:Phase1Overseas:Phase1
JTK-656(oral) HIV infection Overseas:Phase1
JTT-751(oral) HyperphosphatemiaJapan:Phase2
Clinical Development (as of April 30, 2009)
※Changes from the previous disclosure (February 9, 2008):*JTT-751 entered into clinical trial in Japan.*Development of JTT-651 was terminated.
8
(Units:JPY BN)
FY 3/2008 FY 3/2009 Change
99.5
(+29.6%)
8.6
(+103.9%)
-12.1-
OperatingIncome
0.6 -11.4
Net Sales 336.4 435.9
EBITDA 8.3 17.0
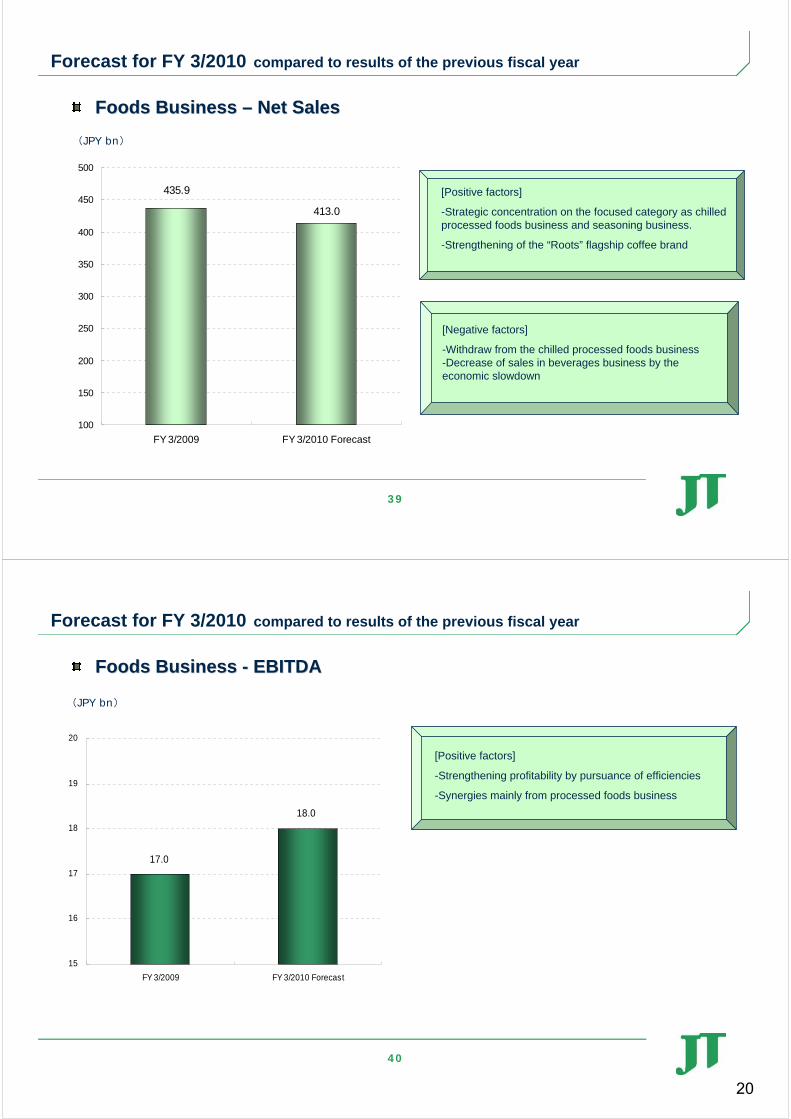
Foods Business
Although sales grew due to the consolidation of the Katokichi Group, we posted operating losses as a result of increased expenses, higher raw materials costs and the impact of goodwill amortization
Sales あ
278.3 286.5
336.4
435.9
200.0
250.0
300.0
350.0
400.0
450.0
500.0
FY 3/2006 FY 3/2007 FY 3/2008 FY 3/2009
(JPY BN)
Consolidated Financial Results for FY 3/2009
Note: The consolidated results for FY 3/2008 include those of Katokichi from January 1 to March 31, 2008.
4

9
1,4001,800
2,2002,600
1,800
2,200
2,600
2,800
19.0
18.0
15.1
22.6
0
1,000
2,000
3,000
4,000
5,000
6,000
FY 3/2006* FY 3/2007 FY 3/2008 FY 3/2009
0.0
5.0
10.0
15.0
20.0
25.0Per-share interim dividend Per-share year-end dividendPayout ratio
(Yen per share)
Changes in dividend payout ratio excluding the impact of goodwill amortization and dividend per share
(%)
Return of Profits to Shareholders◆ Achieved a steady increase in dividends, with the dividend payout ratio excluding the impact of
goodwill amortization exceeding 20%
Consolidated Financial Results for FY 3/2009
* A five-for-one stock split was implemented effective on April 1, 2006. Accordingly, the dividend figures for the fiscal year ended March 2006 were revised retroactively.
10
[This slide intentionally left blank]
5
Full-term Forecasts for FY 3/2010
12
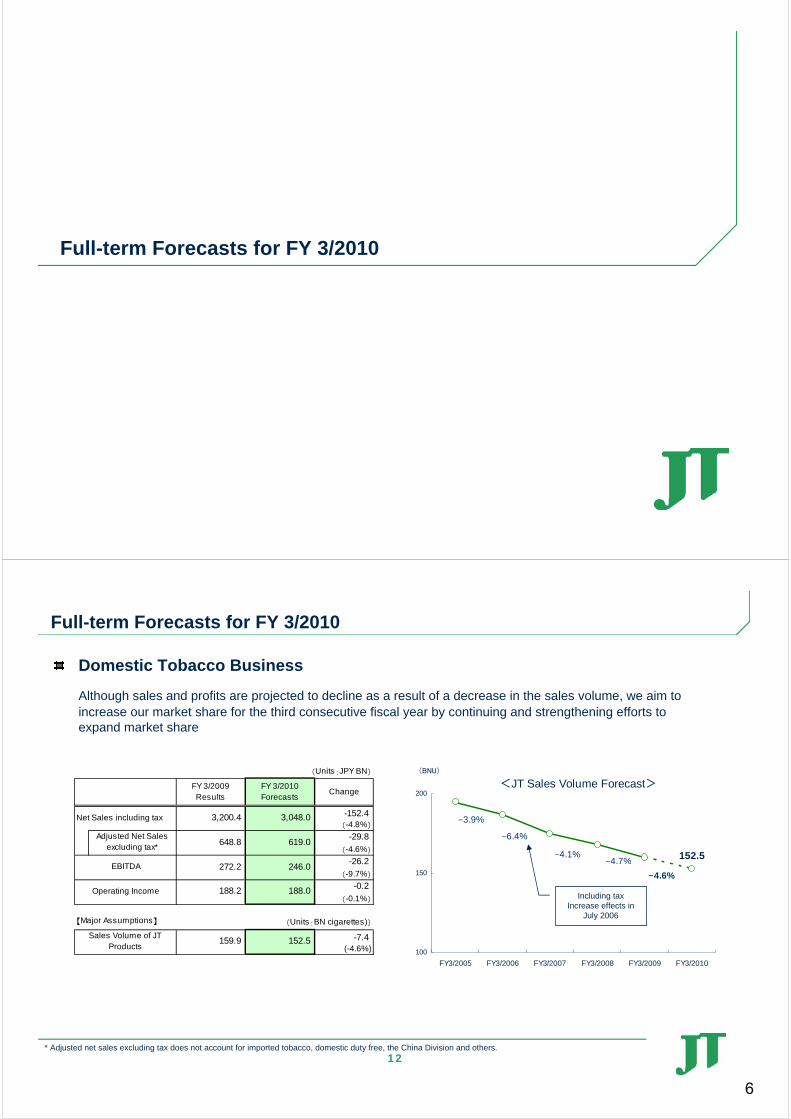
(Units:JPY BN)
FY 3/2009Results
FY 3/2010Forecasts
Change
-152.4(-4.8%)
-29.8
(-4.6%)
-26.2
(-9.7%)
-0.2
(-0.1%)
【Major Assumptions】 (Units:BN cigarettes))
-7.4(-4.6%)
Net Sales including tax 3,200.4 3,048.0
Operating Income 188.2 188.0
EBITDA 272.2 246.0
619.0648.8
152.5Sales Volume of JT
Products159.9
Adjusted Net Salesexcluding tax*
Domestic Tobacco Business
Although sales and profits are projected to decline as a result of a decrease in the sales volume, we aim to increase our market share for the third consecutive fiscal year by continuing and strengthening efforts to expand market share
<JT Sales Volume Forecast>
152.5
100
150
200
FY3/2005 FY3/2006 FY3/2007 FY3/2008 FY3/2009 FY3/2010
(BNU)
-3.9%
-6.4%
-4.1%-4.7%
-4.6%
Including taxIncrease effects in
July 2006
Full-term Forecasts for FY 3/2010
* Adjusted net sales excluding tax does not account for imported tobacco, domestic duty free, the China Division and others.
6

13
Sales of the International Tobacco Business in Jan-Mar 2009(preliminary)
Excluding extraordinary factors, total volume was higher than prior year and the growth of GFB continued
FY 3/2009 FY 3/2010Jan-Mar Jan-Mar
100.9
(Bn units) (-1.4%)
GFB Volume 57.1
(Bn units) (2.6%)
102.4
55.6
Total Volume*
* Total volume includes cigars, pipe tobacco and snus, but does not include private label products
【Sales Volume growth rate for each cluster*】
Full-term Forecasts for FY 3/2010
Total volume GFB volume
South & West Europe +0.8% +3.2%North & Central Europe +3.0% -0.1%CIS+ -3.6% +1.4%Rest of the World -0.5% +4.6%
14
* Adjusted net sales excluding tax does not account for revenue from the distribution, private label, contract manufacturing and other peripheral businesses.**Adjusted net sales per thousand cigarettes based on total volume, including cigars, pipe tobacco and snus, but excluding private label products
and joint ventures, whose revenues are not accounted for.
FY 3/2009 FY 3/2010Jan-Mar Jan-Mar
2,145
(-11.4%)
21.5
(-11.8%)24.3
2,421 Adjusted Net Sales
excluding tax* (USD MM)
Adjusted Net Salesper 1000 cigarettes**
excluding tax (USD MM)
Sales of the International Tobacco Business in Jan-Mar 2009(preliminary)
Price/Mix is improving
Full-term Forecasts for FY 3/2010
Adjusted Net Sales* excl excise taxFY 3/2010 Jan-Mar
2,4212,145
-463+200
-12
1,500
1,700
1,900
2,100
2,300
2,500
2,700
2,900
FY 3/2009 Jan-Mar
Vol Price/Mix FX FY 3/2010 Jan-Mar
(USD MM)
Note: The company has been including revenue from cigars, pipe tobacco and snus into its net sales figure, while sales volume for those products is accounted for as of January 1, 2009.
7

15
International Tobacco Business
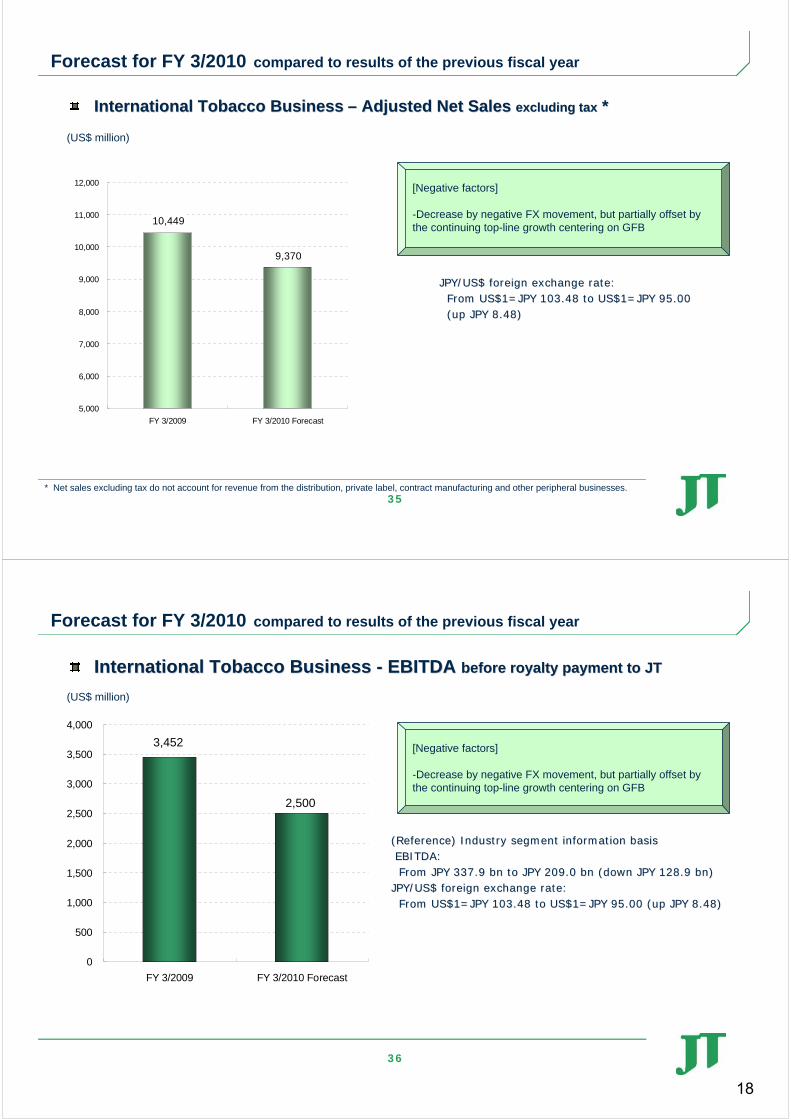
We will aim to significantly exceed 10% EBITDA growth (at constant rates of exchange) through top-line growth and an expansion of our business foundation.
<JPY basis / Disclosure basis> (Unit: JPY BN)
FY 3/2009Results
FY 3/2010Forecasts Change
-643.3(-20.6%)
-191.2(-17.7%)
-128.9(-38.2%)
-103.7(-59.4%)
【Major assumptions】
-8.48(8.9%)
Net Sales including tax
95.00JPY/USD
3,118.3 2,475.0
Operating Income
890.01,081.2
174.7
Adjusted Net Sales
excluding tax*
EBITDA
103.48
71.0
337.9 209.0
* Adjusted net sales excluding tax does not account for revenue from the distribution, private label, contract manufacturing and other peripheral businesses.
**Total volume includes cigars, pipe tobacco and snus, but does not include private label products.
<USD basis> (Units: USD MM)
FY 3/2009Results
FY 3/2010Forecasts
Change
-1,079
(-10.3%)
-951(-27.6%)
【Major assumptions】
10.1(2.3%)
16.5
(6.7%)
11.16 (-31.0%)
0.20 (-27.4%)
0.13
(-16.0%)
EBITDABefore royalty payment to JT
3,452 2,500
Adjusted Net Salesexcluding tax*
10,449 9,370
GFB Volume(Bn units)
245.5 262.0
456.0Total Volume**
(Bn units)445.9
RUB/USD
GBP/USD
EUR/USD
24.84
0.53
0.68
36.00
0.73
0.81
Foreign Exchange Exposure(USD vs. all key currencies excl JPY)
If USD shifts by 1% then EBITA moves by USD 35MM / Ruble is 40% and GBP 15% of aforementioned EBITA sensitivity
Full-term Forecasts for FY 3/2010
16
International Tobacco Business
2,500
-1,600
4,100
+350
+500
+150
-350
3,452
1,000 2,000 3,000 4,000 5,000
FY 3/2009
Costs
Integration synergy
Business momentum
Additional initiatives
FY 3/2010 forecast
(excluding FX impact)
FX impact
FY 3/2010 forecast
(USD MM)
【EBITDA* Roadmap : USD basis】
* Before royalty payment to JT
Full-term Forecasts for FY 3/2010
8

17
(Units:JPY BN)
FY 3/2009Results
FY 3/2010Forecasts
Change
-13.7
(-24.2%)
-17.3
-
-17.5
-
OperatingIncome
1.0 -16.5
Net Sales 56.7 43.0
4.8 -12.5EBITDA
Foods business
EBITDA is projected to grow as a result of increased profitability realized by the pursuit of efficiency in each business segment and the synergy effects, mainly in the processed foods business
Pharmaceutical business
Despite an increase in sales at Torii Pharmaceutical, sales and profits are projected to decline as a result of the absence of an upfront payment related to drug out-licensing
(Units:JPY BN)
FY 3/2009Results
FY 3/2010Forecasts
Change
-22.9
(-5.3%)
0.9
(+5.7%)
3.4
-
OperatingIncome
-11.4 -8.0
Net Sales 435.9 413.0
17.0 18.0EBITDA
Full-term Forecasts for FY 3/2010
18
(Units:JPY BN)
FY 3/2009Results
FY 3/2010Forecasts Change
-832.3
(-12.2%)
-258.6(-11.5%)
-171.2
(-26.5%)
-119.8
(-32.9%)
-80.5
(-26.2%)
-23.4
(-19.0%)
6.8% 6.2% -0.6%
240.1 169.0 -71.1
646.2
6,000.0
475.0
6,832.3
2,243.6 1,985.0
363.8
307.5
244.0
227.0
100.0123.4
Adjusted Net Sales
excluding tax*
Net Sales including tax
EBITDA
FCF
Operating Income
Recurring Profit
Net Income
ROE(%)
Full-term forecasts for consolidated financial resultsSales and profits are projected to decline as a result of a decrease in the sales volume for the domestic tobacco business and a foreign exchange impact to be suffered by the international tobacco business
【Reference:Net income, EPS and Payout Ratio before goodw ill amortization】
FY 3/2009Results
FY 3/2010Forecast
Change
Net Income -31.9
(JPY BN) (-13.9%)
EPS(JPY) 23,894.55 20,563.50 -3,331.05
Per-share dividend(JPY) 5,400 5,600 200
Payout Ratio(%) 22.6% 27.2% 4.6%
228.9 197.0
*Adjusted net sales excluding tax does not account for imported tobacco, domestic duty free, the China Division and others in the domestic tobacco business,in addition to the distribution, private label, contract manufacturing and other peripheral businesses in the international tobacco business.
Full-term Forecasts for FY 3/2010
9

[Reference Material]
Analysis of Consolidated Financial Results for FY 3/2009and Full-term Forecast for FY 3/2010
20
Caution concerning forward-looking statements
Forward-Looking and Cautionary Statements
This presentation contains forward-looking statements about our industry, business, plans and objectives, financial conditions and results of operations based on current expectations, assumptions, estimates and projections. These statements discuss future expectations, identify strategies, discuss market trends, contain projections of operational results and financial condition and state other forward-looking information. These forward-looking statements are subject to various known and unknown risks, uncertainties and other factors that could cause our actual results to differ from those suggested by any forward-looking statement. We assume no duty or obligation to update any forward-looking statement or to advise of any change in the assumptions and factors on which they are based. Risks, uncertainties or other factors that could cause actual results to differ materially from those expressed in any forward-looking statement include, without limitation:
(1) health concerns relating to the use of tobacco products;(2) legal or regulatory developments and changes; including, without limitation, tax increases and restrictions on the sale,
marketing and usage of tobacco products, governmental investigations and privately imposed smoking restrictions;(3) litigation in Japan and elsewhere;(4) our ability to further diversify our business beyond the tobacco industry;(5) our ability to successfully expand internationally and make investments outside of Japan;(6) competition and changing consumer preferences;(7) the impact of any acquisitions or similar transactions;(8) local and global economic conditions; and(9) fluctuations in foreign exchange rates and the costs of raw materials.
10

21
679.3
-3.8
-0
-31.7
715.0
600 640 680 720
FY 3/2008
Volume effect
Unit price effect
Others
FY 3/2009
Results for FY 3/2009
Domestic Tobacco Business Domestic Tobacco Business –– Net SalesNet Sales excluding tax *excluding tax *
(JPY bn)
* Excluding imported tobacco
22
272.2
-3.3
0
-7.0
-0
-24.0
306.7
250 270 290 310
FY 3/2008
Volume effect
Unit price effect
Cost increase
Leaf tobacco reappraisal
gain/loss
Sales Promotion and Others
FY 3/2009
Domestic Tobacco Business Domestic Tobacco Business –– EBITDAEBITDA
(JPY bn)
Results for FY 3/2009
11
23
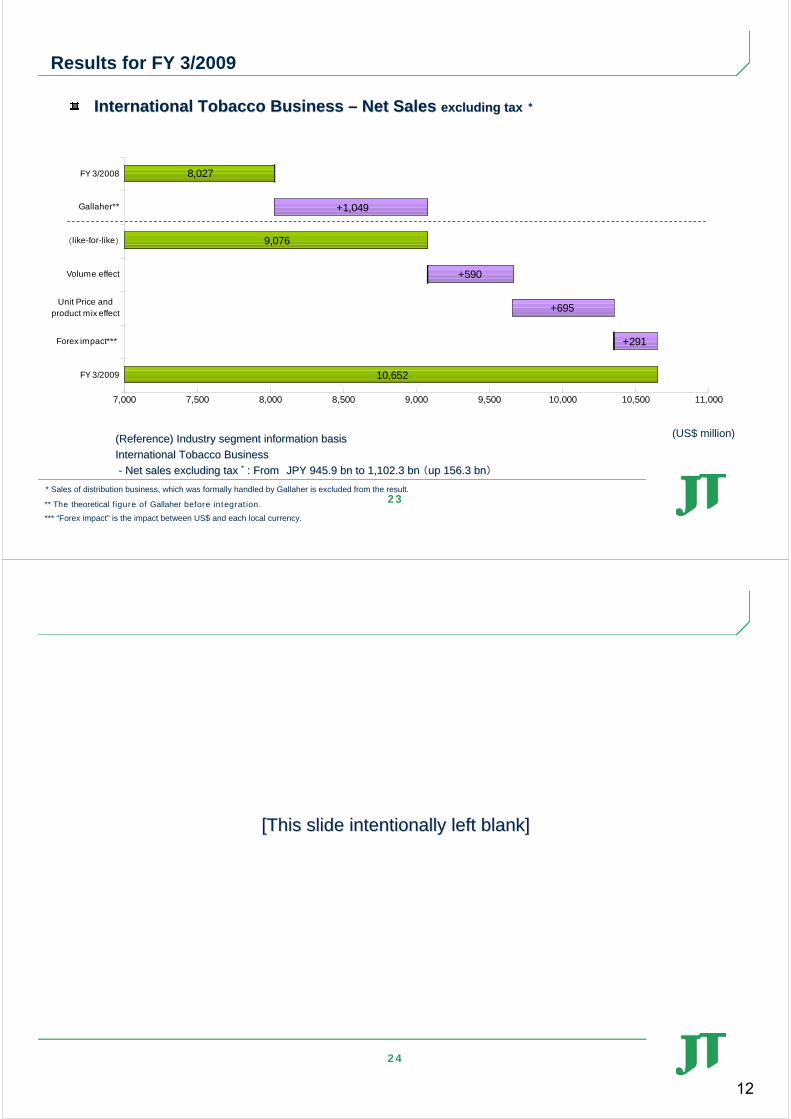
10,652
+291
+695
+590
9,076
+1,049
8,027
7,000 7,500 8,000 8,500 9,000 9,500 10,000 10,500 11,000
FY 3/2008
Gallaher**
(like-for-like)
Volume effect
Unit Price andproduct mix effect
Forex impact***
FY 3/2009
Results for FY 3/2009
International Tobacco Business International Tobacco Business –– Net Sales Net Sales excluding tax excluding tax **
(Reference) Industry segment information basis(Reference) Industry segment information basis
International Tobacco BusinessInternational Tobacco Business
-- Net sales excluding tax Net sales excluding tax ** : : FromFrom JPY 945.9JPY 945.9 bn to 1,102.3 bn bn to 1,102.3 bn ((up 156.3 bnup 156.3 bn))
(US$ million)
* Sales of distribution business, which was formally handled by Gallaher is excluded from the result.
*** “Forex impact” is the impact between US$ and each local currency.
** The theoretical figure of Gallaher before integration.
24
[This slide intentionally left blank][This slide intentionally left blank]
12

25
56.7
+11.0
-3.4
49.0
40 42 44 46 48 50 52 54 56 58
FY 3/2008
Torii Pharmaceutical Co.Ltd(non-consolidated)
Royalty income, etc.
FY 3/2009
Pharmaceutical Business Pharmaceutical Business –– Net SalesNet Sales
(JPY bn)
Results for FY 3/2009
26
4.8
+11.6
-0.2
-0.3
-6.2
-8 -6 -4 -2 0 2 4 6
FY 3/2008
R&D expenses(non-consolidated)
Operating income ofTorii Pharmaceutical Co.Ltd
(non-consolidated)
Royalty income, etc.
FY 3/2009
Results for FY 3/2009
Pharmaceutical Business Pharmaceutical Business –– EBITDAEBITDA
(JPY bn)
13

27
435.9
+107.1
-7.5
336.4
300 330 360 390 420 450
FY 3/2008
Beverages
Processed foods
FY 3/2009
Foods Business Foods Business –– Net SalesNet Sales
(JPY bn)
Results for FY 3/2009
28
Results for FY 3/2009
Foods Business Foods Business –– Operating IncomeOperating Income
(JPY bn)
-11.4
+0.1
-9
-3.1
0.6
-12 -10 -8 -6 -4 -2 0 2
FY 3/2008
Beverages
Processed foods
Overhead costs
FY 3/2009
14

29
307.5
+11.6
-66.7
362.6
200 250 300 350 400
FY 3/2008
Operating
income
Non-operating
income/loss
FY 3/2009
Recurring Profit Recurring Profit
123.4
-60.3
-55.0
238.7
50 100 150 200 250
FY 3/2008
Recurring
profit
Extraordinary
profit/loss,
income tax, etc.
FY 3/2009
(JPY bn) (JPY bn)
Results for FY 3/2009
Positive factorsPositive factors::-Decrease of loss on foreign exchange(9.9bn)-Decrease of ffinancial support for domestic leaf tobacco growers (1.2bn)etc.
Negative factorsNegative factors::-Increase of interest payment (9.5bn)-Decrease of interest income(1.1bn) etc.
Positive factorsPositive factors::-Decrease of loss on sale of property, plant and equipment (1.0bn) etc.
Negative factorsNegative factors::-Decrease of profit on sale of property, plant and equipment (20.2bn)-Increase of business restructuring cost(17.9bn)-Increase of impairment loss(12.5bn)
Net IncomeNet Income
30
[This slide intentionally left blank][This slide intentionally left blank]
15

31
Summary of Consolidated B/S as of Mar. 31, 2009
1,234.6
1,095.6
3,852.5
2,784.1
0
1,000
2,000
3,000
4,000
5,000
6,000
as of Mar. 31, 2008 as of Mar. 31, 2009
Current Assets
Fixed Assets
3,879.83,879.8
5,087.25,087.2
ASSETS ASSETS Compared to B/S as of Mar. 31, 2008Compared to B/S as of Mar. 31, 2008
Current Assets Current Assets –– down JPY 139.0down JPY 139.0 bnbn
Fixed Assets Fixed Assets –– down JPYdown JPY 1,068.3 bn1,068.3 bn
◆◆ Decrease of Goodwill:Decrease of Goodwill: down JPY 652.9 bndown JPY 652.9 bn
◆◆ Decrease of Trademarks:Decrease of Trademarks: down JPY 266.1 bndown JPY 266.1 bn
(JPY bn)
32
2,154.61,624.2
2,932.5
2,255.5
0
1,000
2,000
3,000
4,000
5,000
6,000
as of Mar. 31, 2008 as of Mar. 31, 2009
Total Liabilities
Total Net Assets
33,879.8,879.8
LIABILITIES & NET ASSETSLIABILITIES & NET ASSETS
Compared to B/S as of Mar. 31, 2008Compared to B/S as of Mar. 31, 2008
Total Liabilities Total Liabilities –– down JPY 677.0down JPY 677.0 bnbn
Total Net Assets Total Net Assets –– down JPY 530.3 bndown JPY 530.3 bn◆◆ Retained earnings:Retained earnings: down JPY 119.5down JPY 119.5 bnbn
◆◆ Foreign currency translation adjustments:Foreign currency translation adjustments:down JPY 382.4down JPY 382.4 bnbn
Ratio of equity capital: Ratio of equity capital: 4400..8%8%→→ 4400..0%0%
(JPY bn)
Summary of Consolidated B/S as of Mar. 31, 2009
5,087.25,087.2
16

33
Forecast for FY 3/2010 compared to results of the previous fiscal year
Domestic Tobacco Business Domestic Tobacco Business –– Adjusted Net SalesAdjusted Net Sales excluding tax *excluding tax *
648.8
619.0
500
520
540
560
580
600
620
640
660
FY 3/2009 FY 3/2010 Forecast
(JPY bn)
[Negative factors]-Decrease of JT sales volume159.9 bn units → 152.5 bn units, down 7.4 bn units
* Adjusted net sales excluding tax does not account for imported tobacco, domestic duty-free, the China division and others.
34
Domestic Tobacco Business Domestic Tobacco Business -- EBITDAEBITDA
246.0
272.2
100
150
200
250
300
FY 3/2009 FY 3/2010 Forecast
(JPY bn)
Forecast for FY 3/2010 compared to results of the previous fiscal year
[Negative factors]
-Decrease of JT sales volume (down 7.4 bn cigarettes, approx. JPY 23.0 bn)
-Increase of costs and others (approx. JPY 3.0bn)
17
35
Forecast for FY 3/2010 compared to results of the previous fiscal year
International Tobacco BusinessInternational Tobacco Business –– Adjusted Net Sales Adjusted Net Sales excluding taxexcluding tax **
10,449
9,370
5,000
6,000
7,000
8,000
9,000
10,000
11,000
12,000
FY 3/2009 FY 3/2010 Forecast
JPY/US$ foreign exchange rate:JPY/US$ foreign exchange rate:From US$1=JPY 103.48 to US$1=JPY 95.00 From US$1=JPY 103.48 to US$1=JPY 95.00 (up(up JPY 8.48)JPY 8.48)
[Negative factors]
-Decrease by negative FX movement, but partially offset by the continuing top-line growth centering on GFB
(US$ million)
* Net sales excluding tax do not account for revenue from the distribution, private label, contract manufacturing and other peripheral businesses.
36
International Tobacco Business International Tobacco Business -- EBITDAEBITDA before royalty payment to JTbefore royalty payment to JT
2,500
3,452
0
500
1,000
1,500
2,000
2,500
3,000
3,500
4,000
FY 3/2009 FY 3/2010 Forecast
Forecast for FY 3/2010 compared to results of the previous fiscal year
((Reference) Industry segment information basisReference) Industry segment information basisEBITDA:EBITDA:From JPY 337.9 bn to JPY 209.0 bn (down JPY 128.9 bn)From JPY 337.9 bn to JPY 209.0 bn (down JPY 128.9 bn)
JPY/US$ foreign exchange rate:JPY/US$ foreign exchange rate:From US$1=JPY 103.48 to US$1=JPY 95.00 (upFrom US$1=JPY 103.48 to US$1=JPY 95.00 (up JPY 8.48)JPY 8.48)
(US$ million)
[Negative factors]
-Decrease by negative FX movement, but partially offset by the continuing top-line growth centering on GFB
18
37
Pharmaceutical Business Pharmaceutical Business –– Net SalesNet Sales
56.7
43.0
0
10
20
30
40
50
60
FY 3/2009 FY 3/2010 Forecast
(JPY bn)
Forecast for FY 3/2010 compared to results of the previous fiscal year
[Positive factors]
-Increase of sales of Torii Pharmaceutical Co. Ltd.: [JPY 37.3bn→JPY 41.7bn(up JPY 4.4bn)]
[Negative factors]
-Mainly to the absence of the one time revenue which we received in FY3/2009
38
Pharmaceutical Business Pharmaceutical Business -- EBITDAEBITDA
-12.5
4.8
-15
-10
-5
0
5
10
FY 3/2009 FY 3/2010 Forecast
(JPY bn)
Forecast for FY 3/2010 compared to results of the previous fiscal year
[Negative factors]
-Mainly to the absence of the one time revenue which we received in FY3/2009
19
39
Foods Business Foods Business –– Net SalesNet Sales
413.0
435.9
100
150
200
250
300
350
400
450
500
FY 3/2009 FY 3/2010 Forecast
(JPY bn)
Forecast for FY 3/2010 compared to results of the previous fiscal year
[Positive factors]
-Strategic concentration on the focused category as chilled processed foods business and seasoning business.
-Strengthening of the “Roots” flagship coffee brand
[Negative factors]
-Withdraw from the chilled processed foods business-Decrease of sales in beverages business by the economic slowdown
40
Foods Business Foods Business -- EBITDAEBITDA
17.0
18.0
15
16
17
18
19
20
FY 3/2009 FY 3/2010 Forecast
(JPY bn)
Forecast for FY 3/2010 compared to results of the previous fiscal year
[Positive factors]
-Strengthening profitability by pursuance of efficiencies
-Synergies mainly from processed foods business
20

41
227.0
+39.3
-119.8
307.5
100 150 200 250 300 350
FY 3/2009
Operating
income
Non-operating
income
FY 3/2010
Forecast
Recurring ProfitRecurring Profit
100.0
+57.2
-80.5
123.4
0 50 100 150
FY 3/2009
Recurringprofit
Extraordinaryprofit/loss,
income tax, etc.
FY 3/2010Forecast
Net IncomeNet Income
(JPY bn) (JPY bn)
Forecast for FY 3/2010 compared to results of the previous fiscal year
Positive factors:Positive factors:-Decrease of interest payment accompanied by the repayment of Interest –bearing debt etc.
Positive factors:Positive factors:-Decrease of introduction costs for vending machines with adult identification functions etc. Negative factors:Negative factors:-Decrease of profit on sale of property, plant and equipment-Increase of rationalization costs (domestic factory closing etc.) etc.
21
Data sheets for FY ended Mar.31, 2009
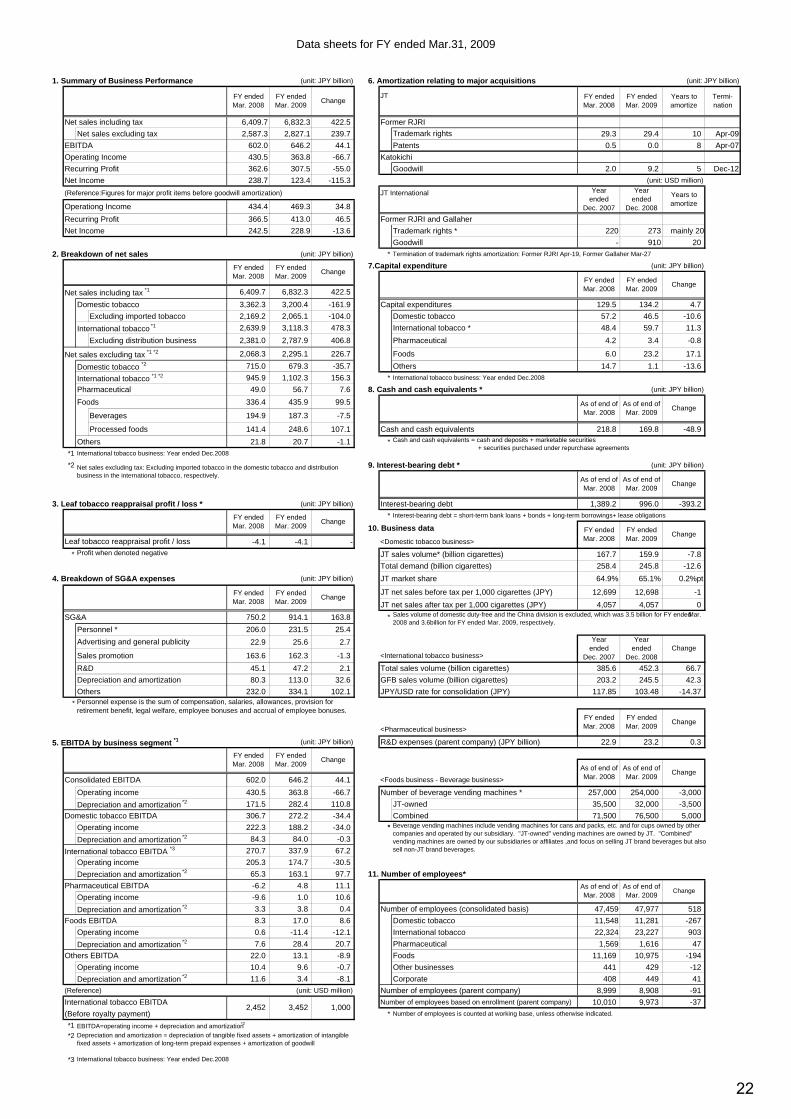
1. Summary of Business Performance (unit: JPY billion) 6. Amortization relating to major acquisitions (unit: JPY billion)
JT
Net sales including tax 6,409.7 6,832.3 422.5 Former RJRI
Net sales excluding tax 2,587.3 2,827.1 239.7 29.3 29.4 10 Apr-09
EBITDA 602.0 646.2 44.1 Patents 0.5 0.0 8 Apr-07
Operating Income 430.5 363.8 -66.7 Katokichi
Recurring Profit 362.6 307.5 -55.0 Goodwill 2.0 9.2 5 Dec-12
Net Income 238.7 123.4 -115.3 (unit: USD million)
(Reference:Figures for major profit items before goodwill amortization) JT International
Operationg Income 434.4 469.3 34.8
Recurring Profit 366.5 413.0 46.5 Former RJRI and Gallaher
Net Income 242.5 228.9 -13.6 Trademark rights * 220 273 mainly 20
Goodwill - 910 20
2. Breakdown of net sales (unit: JPY billion) * Termination of trademark rights amortization: Former RJRI Apr-19, Former Gallaher Mar-27
7.Capital expenditure (unit: JPY billion)
Net sales including tax *1 6,409.7 6,832.3 422.5
Domestic tobacco 3,362.3 3,200.4 -161.9 Capital expenditures 129.5 134.2 4.7
Excluding imported tobacco 2,169.2 2,065.1 -104.0 Domestic tobacco 57.2 46.5 -10.6
International tobacco *1 2,639.9 3,118.3 478.3 International tobacco * 48.4 59.7 11.3
Excluding distribution business 2,381.0 2,787.9 406.8 Pharmaceutical 4.2 3.4 -0.8
Net sales excluding tax *1 *2 2,068.3 2,295.1 226.7 Foods 6.0 23.2 17.1
Domestic tobacco *2 715.0 679.3 -35.7 Others 14.7 1.1 -13.6
International tobacco *1 *2 945.9 1,102.3 156.3 * International tobacco business: Year ended Dec.2008
Pharmaceutical 49.0 56.7 7.6 8. Cash and cash equivalents * (unit: JPY billion)
Foods 336.4 435.9 99.5
Beverages 194.9 187.3 -7.5
Processed foods 141.4 248.6 107.1 Cash and cash equivalents 218.8 169.8 -48.9
Others 21.8 20.7 -1.1 *
*1 International tobacco business: Year ended Dec.2008
*2 9. Interest-bearing debt * (unit: JPY billion)
3. Leaf tobacco reappraisal profit / loss * (unit: JPY billion) Interest-bearing debt 1,389.2 996.0 -393.2
* Interest-bearing debt = short-term bank loans + bonds + long-term borrowings+ lease obligations
10. Business data
-4.1 -4.1 - <Domestic tobacco business>
* Profit when denoted negative JT sales volume* (billion cigarettes) 167.7 159.9 -7.8
Total demand (billion cigarettes) 258.4 245.8 -12.6
4. Breakdown of SG&A expenses (unit: JPY billion) JT market share 64.9% 65.1% 0.2%pt
JT net sales before tax per 1,000 cigarettes (JPY) 12,699 12,698 -1
JT net sales after tax per 1,000 cigarettes (JPY) 4,057 4,057 0
SG&A 750.2 914.1 163.8 *
Personnel * 206.0 231.5 25.4
22.9 25.6 2.7
Sales promotion 163.6 162.3 -1.3 <International tobacco business>
R&D 45.1 47.2 2.1 Total sales volume (billion cigarettes) 385.6 452.3 66.7
Depreciation and amortization 80.3 113.0 32.6 GFB sales volume (billion cigarettes) 203.2 245.5 42.3
Others 232.0 334.1 102.1 JPY/USD rate for consolidation (JPY) 117.85 103.48 -14.37
*
<Pharmaceutical business>
5. EBITDA by business segment *1 (unit: JPY billion) R&D expenses (parent company) (JPY billion) 22.9 23.2 0.3
Consolidated EBITDA 602.0 646.2 44.1 <Foods business - Beverage business>
Operating income 430.5 363.8 -66.7 Number of beverage vending machines * 257,000 254,000 -3,000
171.5 282.4 110.8 JT-owned 35,500 32,000 -3,500
Domestic tobacco EBITDA 306.7 272.2 -34.4 Combined 71,500 76,500 5,000
Operating income 222.3 188.2 -34.0 *
84.3 84.0 -0.3
International tobacco EBITDA *3 270.7 337.9 67.2
Operating income 205.3 174.7 -30.5
65.3 163.1 97.7 11. Number of employees*
Pharmaceutical EBITDA -6.2 4.8 11.1
Operating income -9.6 1.0 10.6
3.3 3.8 0.4 Number of employees (consolidated basis) 47,459 47,977 518
Foods EBITDA 8.3 17.0 8.6 Domestic tobacco 11,548 11,281 -267
Operating income 0.6 -11.4 -12.1 International tobacco 22,324 23,227 903
7.6 28.4 20.7 Pharmaceutical 1,569 1,616 47
Others EBITDA 22.0 13.1 -8.9 Foods 11,169 10,975 -194
Operating income 10.4 9.6 -0.7 Other businesses 441 429 -12
11.6 3.4 -8.1 Corporate 408 449 41
(Reference) (unit: USD million) Number of employees (parent company) 8,999 8,908 -91
International tobacco EBITDA Number of employees based on enrollment (parent company) 10,010 9,973 -37
(Before royalty payment) * Number of employees is counted at working base, unless otherwise indicated.
*1 EBITDA=operating income + depreciation and amortization*2
*2
*3 International tobacco business: Year ended Dec.2008
As of end ofMar. 2008
As of end ofMar. 2009
Change
Change
Sales volume of domestic duty-free and the China division is excluded, which was 3.5 billion for FY ended Mar.2008 and 3.6billion for FY ended Mar. 2009, respectively.
As of end ofMar. 2008
As of end ofMar. 2009
Change
Yearended
Dec. 2007Change
FY endedMar. 2009
Termi-nation
FY endedMar. 2008
FY endedMar. 2009
Years toamortize
Trademark rights
As of end ofMar. 2009
Yearended
Dec. 2008
Years toamortize
As of end ofMar. 2008
FY endedMar. 2008
FY endedMar. 2009
As of end ofMar. 2008
Cash and cash equivalents = cash and deposits + marketable securities + securities purchased under repurchase agreements
As of end ofMar. 2009
Change
Change
Beverage vending machines include vending machines for cans and packs, etc. and for cups owned by othercompanies and operated by our subsidiary. "JT-owned" vending machines are owned by JT. "Combined"vending machines are owned by our subsidiaries or affiliates ,and focus on selling JT brand beverages but alsosell non-JT brand beverages.
FY endedMar. 2008
Change
Change
FY endedMar. 2009
FY endedMar. 2009
Yearended
Dec. 2008
FY endedMar. 2008
FY endedMar. 2008
FY endedMar. 2009
FY endedMar. 2008
Change
Yearended
Dec. 2007
Net sales excluding tax: Excluding imported tobacco in the domestic tobacco and distributionbusiness in the international tobacco, respectively.
FY endedMar. 2008
FY endedMar. 2009
Change
Change
FY endedMar. 2008
FY endedMar. 2009
Change
Personnel expense is the sum of compensation, salaries, allowances, provision forretirement benefit, legal welfare, employee bonuses and accrual of employee bonuses.
Change
Leaf tobacco reappraisal profit / loss
FY endedMar. 2008
FY endedMar. 2009
Advertising and general publicity
Depreciation and amortization = depreciation of tangible fixed assets + amortization of intangiblefixed assets + amortization of long-term prepaid expenses + amortization of goodwill
Depreciation and amortization *2
Depreciation and amortization *2
Depreciation and amortization *2
Depreciation and amortization *2
Depreciation and amortization *2
Depreciation and amortization *2
2,452 3,452 1,000
22
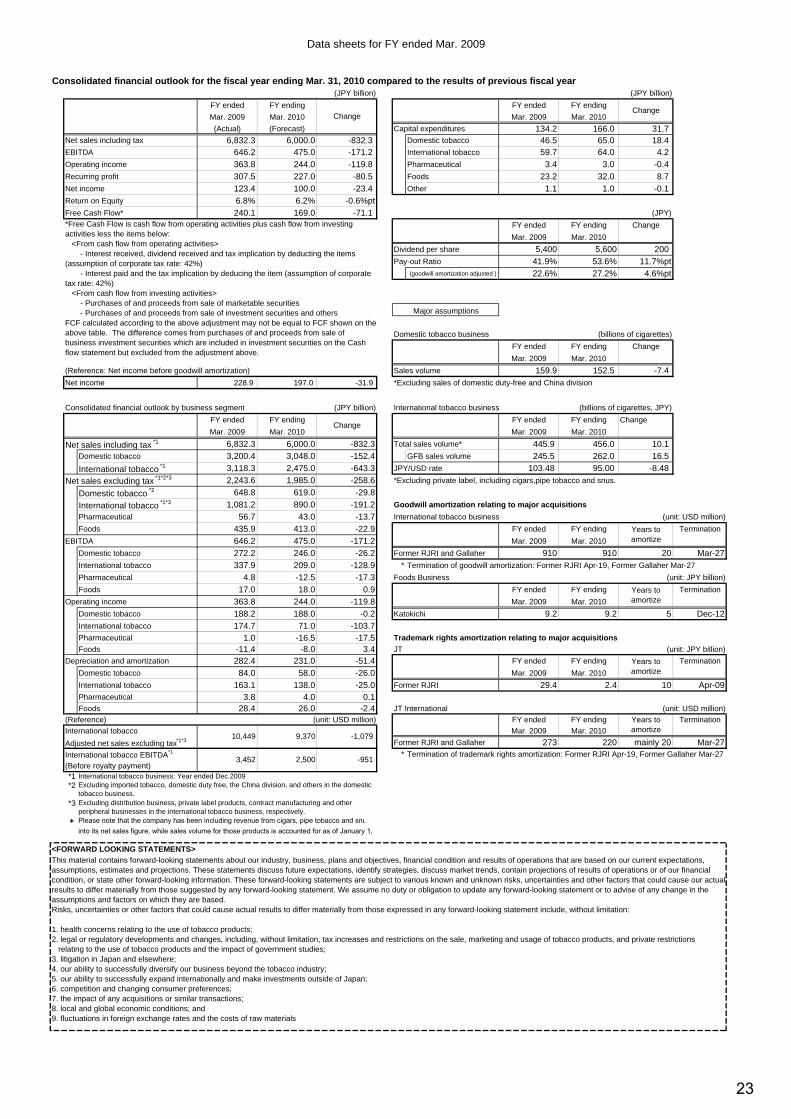
Data sheets for FY ended Mar. 2009
Consolidated financial outlook for the fiscal year ending Mar. 31, 2010 compared to the results of previous fiscal year(JPY billion) (JPY billion)
FY ended FY ending FY ended FY ending
Mar. 2009 Mar. 2010 Mar. 2009 Mar. 2010
(Actual) (Forecast) Capital expenditures 134.2 166.0 31.7Net sales including tax 6,832.3 6,000.0 -832.3 Domestic tobacco 46.5 65.0 18.4EBITDA 646.2 475.0 -171.2 International tobacco 59.7 64.0 4.2Operating income 363.8 244.0 -119.8 Pharmaceutical 3.4 3.0 -0.4Recurring profit 307.5 227.0 -80.5 Foods 23.2 32.0 8.7Net income 123.4 100.0 -23.4 Other 1.1 1.0 -0.1Return on Equity 6.8% 6.2% -0.6%ptFree Cash Flow* 240.1 169.0 -71.1 (JPY)
FY ended FY ending Change
Mar. 2009 Mar. 2010
Dividend per share 5,400 5,600 200Pay-out Ratio 41.9% 53.6% 11.7%pt
22.6% 27.2% 4.6%pt
Domestic tobacco business (billions of cigarettes)
FY ended FY ending Change
Mar. 2009 Mar. 2010
(Reference: Net income before goodwill amortization) Sales volume 159.9 152.5 -7.4Net income 228.9 197.0 -31.9 *Excluding sales of domestic duty-free and China division
Consolidated financial outlook by business segment (JPY billion) International tobacco business (billions of cigarettes, JPY)
FY ended FY ending FY ended FY ending Change
Mar. 2009 Mar. 2010 Mar. 2009 Mar. 2010
Net sales including tax *1 6,832.3 6,000.0 -832.3 Total sales volume* 445.9 456.0 10.1Domestic tobacco 3,200.4 3,048.0 -152.4 GFB sales volume 245.5 262.0 16.5
International tobacco *1 3,118.3 2,475.0 -643.3 JPY/USD rate 103.48 95.00 -8.48
2,243.6 1,985.0 -258.6 *Excluding private label, including cigars,pipe tobacco and snus.
Domestic tobacco *2 648.8 619.0 -29.8
International tobacco *1*3 1,081.2 890.0 -191.2 Goodwill amortization relating to major acquisitions
Pharmaceutical 56.7 43.0 -13.7 International tobacco business (unit: USD million)
Foods 435.9 413.0 -22.9 FY ended FY ending Termination
EBITDA 646.2 475.0 -171.2 Mar. 2009 Mar. 2010
Domestic tobacco 272.2 246.0 -26.2 Former RJRI and Gallaher 910 910 20 Mar-27International tobacco 337.9 209.0 -128.9 * Termination of goodwill amortization: Former RJRI Apr-19, Former Gallaher Mar-27
Pharmaceutical 4.8 -12.5 -17.3 Foods Business (unit: JPY billion)
Foods 17.0 18.0 0.9 FY ended FY ending Termination
Operating income 363.8 244.0 -119.8 Mar. 2009 Mar. 2010
Domestic tobacco 188.2 188.0 -0.2 Katokichi 9.2 9.2 5 Dec-12International tobacco 174.7 71.0 -103.7Pharmaceutical 1.0 -16.5 -17.5 Trademark rights amortization relating to major acquisitions
Foods -11.4 -8.0 3.4 JT (unit: JPY billion)
Depreciation and amortization 282.4 231.0 -51.4 FY ended FY ending Termination
Domestic tobacco 84.0 58.0 -26.0 Mar. 2009 Mar. 2010
International tobacco 163.1 138.0 -25.0 Former RJRI 29.4 2.4 10 Apr-09Pharmaceutical 3.8 4.0 0.1Foods 28.4 26.0 -2.4 JT International (unit: USD million)
(Reference) (unit: USD million) FY ended FY ending Termination
International tobacco Mar. 2009 Mar. 2010
Adjusted net sales excluding tax*1*3 Former RJRI and Gallaher 273 220 mainly 20 Mar-27
International tobacco EBITDA*1 * Termination of trademark rights amortization: Former RJRI Apr-19, Former Gallaher Mar-27
(Before royalty payment)*1 International tobacco business: Year ended Dec.2009*2
*3
*
<FORWARD LOOKING STATEMENTS>
Change
Change
*Free Cash Flow is cash flow from operating activities plus cash flow from investingactivities less the items below: <From cash flow from operating activities> - Interest received, dividend received and tax implication by deducting the items(assumption of corporate tax rate: 42%) - Interest paid and the tax implication by deducing the item (assumption of corporatetax rate: 42%) <From cash flow from investing activities> - Purchases of and proceeds from sale of marketable securities - Purchases of and proceeds from sale of investment securities and othersFCF calculated according to the above adjustment may not be equal to FCF shown on theabove table. The difference comes from purchases of and proceeds from sale ofbusiness investment securities which are included in investment securities on the Cashflow statement but excluded from the adjustment above.
Excluding distribution business, private label products, contract manufacturing and otherperipheral businesses in the international tobacco business, respectively.
3,452 -9512,500
Net sales excluding tax *1*2*3
-1,079
Please note that the company has been including revenue from cigars, pipe tobacco and snuinto its net sales figure, while sales volume for those products is accounted for as of January 1,
Change
(goodwill amortization adjusted )
This material contains forward-looking statements about our industry, business, plans and objectives, financial condition and results of operations that are based on our current expectations,assumptions, estimates and projections. These statements discuss future expectations, identify strategies, discuss market trends, contain projections of results of operations or of our financialcondition, or state other forward-looking information. These forward-looking statements are subject to various known and unknown risks, uncertainties and other factors that could cause our actualresults to differ materially from those suggested by any forward-looking statement. We assume no duty or obligation to update any forward-looking statement or to advise of any change in theassumptions and factors on which they are based.Risks, uncertainties or other factors that could cause actual results to differ materially from those expressed in any forward-looking statement include, without limitation:
1. health concerns relating to the use of tobacco products;2. legal or regulatory developments and changes, including, without limitation, tax increases and restrictions on the sale, marketing and usage of tobacco products, and private restrictions relating to the use of tobacco products and the impact of government studies;3. litigation in Japan and elsewhere;4. our ability to successfully diversify our business beyond the tobacco industry;5. our ability to successfully expand internationally and make investments outside of Japan;6. competition and changing consumer preferences;7. the impact of any acquisitions or similar transactions;8. local and global economic conditions; and9. fluctuations in foreign exchange rates and the costs of raw materials
Years toamortize
Years toamortize
Years toamortize
Years toamortize
Major assumptions
Excluding imported tobacco, domestic duty free, the China division, and others in the domestictobacco business.
10,449 9,370
23
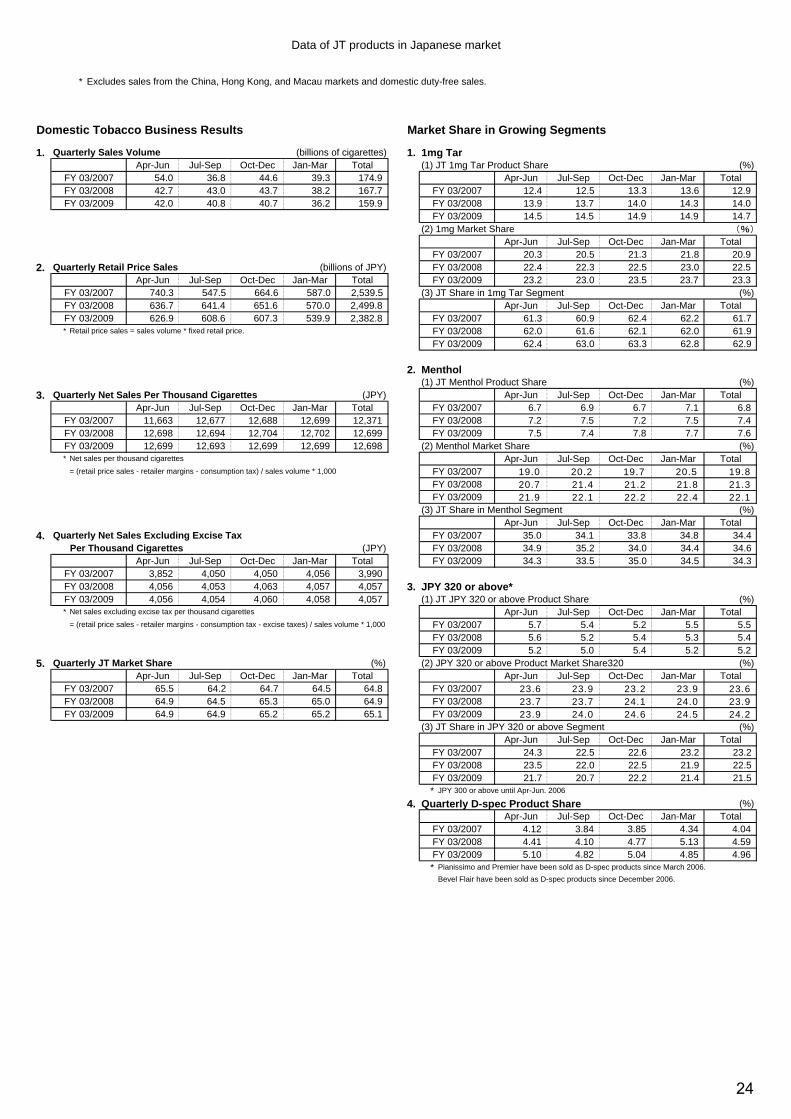
Data of JT products in Japanese market
* Excludes sales from the China, Hong Kong, and Macau markets and domestic duty-free sales.
Domestic Tobacco Business Results Market Share in Growing Segments
1. Quarterly Sales Volume (billions of cigarettes) 1. 1mg TarApr-Jun Jul-Sep Oct-Dec Jan-Mar Total (1) JT 1mg Tar Product Share (%)
FY 03/2007 54.0 36.8 44.6 39.3 174.9 Apr-Jun Jul-Sep Oct-Dec Jan-Mar TotalFY 03/2008 42.7 43.0 43.7 38.2 167.7 FY 03/2007 12.4 12.5 13.3 13.6 12.9FY 03/2009 42.0 40.8 40.7 36.2 159.9 FY 03/2008 13.9 13.7 14.0 14.3 14.0
FY 03/2009 14.5 14.5 14.9 14.9 14.7(2) 1mg Market Share (%)
Apr-Jun Jul-Sep Oct-Dec Jan-Mar TotalFY 03/2007 20.3 20.5 21.3 21.8 20.9
2. Quarterly Retail Price Sales (billions of JPY) FY 03/2008 22.4 22.3 22.5 23.0 22.5Apr-Jun Jul-Sep Oct-Dec Jan-Mar Total FY 03/2009 23.2 23.0 23.5 23.7 23.3
FY 03/2007 740.3 547.5 664.6 587.0 2,539.5 (3) JT Share in 1mg Tar Segment (%)FY 03/2008 636.7 641.4 651.6 570.0 2,499.8 Apr-Jun Jul-Sep Oct-Dec Jan-Mar TotalFY 03/2009 626.9 608.6 607.3 539.9 2,382.8 FY 03/2007 61.3 60.9 62.4 62.2 61.7* Retail price sales = sales volume * fixed retail price. FY 03/2008 62.0 61.6 62.1 62.0 61.9
FY 03/2009 62.4 63.0 63.3 62.8 62.9
2. Menthol(1) JT Menthol Product Share (%)
3. Quarterly Net Sales Per Thousand Cigarettes (JPY) Apr-Jun Jul-Sep Oct-Dec Jan-Mar TotalApr-Jun Jul-Sep Oct-Dec Jan-Mar Total FY 03/2007 6.7 6.9 6.7 7.1 6.8
FY 03/2007 11,663 12,677 12,688 12,699 12,371 FY 03/2008 7.2 7.5 7.2 7.5 7.4FY 03/2008 12,698 12,694 12,704 12,702 12,699 FY 03/2009 7.5 7.4 7.8 7.7 7.6FY 03/2009 12,699 12,693 12,699 12,699 12,698 (2) Menthol Market Share (%)* Net sales per thousand cigarettes Apr-Jun Jul-Sep Oct-Dec Jan-Mar Total
= (retail price sales - retailer margins - consumption tax) / sales volume * 1,000 FY 03/2007 19.0 20.2 19.7 20.5 19.8FY 03/2008 20.7 21.4 21.2 21.8 21.3FY 03/2009 21.9 22.1 22.2 22.4 22.1
(3) JT Share in Menthol Segment (%)Apr-Jun Jul-Sep Oct-Dec Jan-Mar Total
4. Quarterly Net Sales Excluding Excise Tax FY 03/2007 35.0 34.1 33.8 34.8 34.4Per Thousand Cigarettes (JPY) FY 03/2008 34.9 35.2 34.0 34.4 34.6
Apr-Jun Jul-Sep Oct-Dec Jan-Mar Total FY 03/2009 34.3 33.5 35.0 34.5 34.3FY 03/2007 3,852 4,050 4,050 4,056 3,990FY 03/2008 4,056 4,053 4,063 4,057 4,057 3. JPY 320 or above*FY 03/2009 4,056 4,054 4,060 4,058 4,057 (1) JT JPY 320 or above Product Share (%)* Net sales excluding excise tax per thousand cigarettes Apr-Jun Jul-Sep Oct-Dec Jan-Mar Total
= (retail price sales - retailer margins - consumption tax - excise taxes) / sales volume * 1,000 FY 03/2007 5.7 5.4 5.2 5.5 5.5FY 03/2008 5.6 5.2 5.4 5.3 5.4FY 03/2009 5.2 5.0 5.4 5.2 5.2
5. Quarterly JT Market Share (%) (2) JPY 320 or above Product Market Share320 (%)Apr-Jun Jul-Sep Oct-Dec Jan-Mar Total Apr-Jun Jul-Sep Oct-Dec Jan-Mar Total
FY 03/2007 65.5 64.2 64.7 64.5 64.8 FY 03/2007 23.6 23.9 23.2 23.9 23.6FY 03/2008 64.9 64.5 65.3 65.0 64.9 FY 03/2008 23.7 23.7 24.1 24.0 23.9FY 03/2009 64.9 64.9 65.2 65.2 65.1 FY 03/2009 23.9 24.0 24.6 24.5 24.2
(3) JT Share in JPY 320 or above Segment (%)Apr-Jun Jul-Sep Oct-Dec Jan-Mar Total
FY 03/2007 24.3 22.5 22.6 23.2 23.2FY 03/2008 23.5 22.0 22.5 21.9 22.5FY 03/2009 21.7 20.7 22.2 21.4 21.5* JPY 300 or above until Apr-Jun. 2006
4. Quarterly D-spec Product Share (%)Apr-Jun Jul-Sep Oct-Dec Jan-Mar Total
FY 03/2007 4.12 3.84 3.85 4.34 4.04FY 03/2008 4.41 4.10 4.77 5.13 4.59FY 03/2009 5.10 4.82 5.04 4.85 4.96* Pianissimo and Premier have been sold as D-spec products since March 2006.
Bevel Flair have been sold as D-spec products since December 2006.
24

Japan Tobacco Inc. Clinical development (as of April 30, 2009)
Code Stage Key Indication Mechanism Characteristics RightsJTT-705(oral)
Phase 2 (Japan) Dyslipidemia CETP inhibitor Decreases LDL and increases HDL byinhibition of CETP -CETP: Cholesteryl Ester Transfer Protein,facilitates transfer of cholesteryl ester fromHDL to LDL-HDL: High-density lipoprotein ("goodcholesterol")-LDL: Low-density lipoprotein ("badcholesterol")
Roche (Switzerland) obtained the rightsto develop and commercialize thecompound worldwide, with theexception of Japan.
*Development stage by Roche: Phase 3
JTT-130(oral)
Phase 2 (Japan)Phase 2 (Overseas)
Dyslipidemia MTP inhibitor Treatment of dyslipidemia by reducingabsorption of cholesterol and triglyceridesvia inhibition of MTP -MTP: Microsomal Triglyceride TransferProtein
JTK-303(oral)
Phase 1 (Japan) HIV infection Integrase inhibitor Integrase inhibitor which works by blockingintegrase, an enzyme that is involved in thereplication of HIV -HIV: Human Immunodeficiency Virus
Gilead Sciences (U.S.) obtained therights to develop and commercialize thiscompound worldwide, with theexception of Japan.
*Development stage by Gilead Sciences:Phase 3
JTT-302(oral)
Phase 2 (Overseas) Dyslipidemia CETP inhibitor Decreases LDL and increases HDL byinhibition of CETP -CETP: Cholesteryl Ester Transfer Protein,facilitates transfer of cholesteryl ester fromHDL to LDL-HDL: High-density lipoprotein ("goodcholesterol")-LDL: Low-density lipoprotein ("badcholesterol")
JTT-305(oral)
Phase 2 (Japan) Osteoporosis CaSR antagonist Increases BMD and decreases new vertebralfractures by accelerating endogenous PTHsecretion via antagonism of circulating Ca onCaSR in parathyroid cells -BMD: Bone Mineral Density-PTH: Parathyroid Hormone-CaSR: Calcium-Sensing Receptor
Merck (U.S.) obtained the rights todevelop and commercialize thiscompound worldwide, with theexception of Japan.
JTS-653(oral)
Phase 1 (Japan) PainOveractive bladder
TRPV1 antagonist Improves pain and overactive bladder viaantagonism of TRPV1 on sensory neurons - TRPV1: Transient Receptor PotentialVanilloid subtype 1
JTT-654(oral)
Phase 1 (Japan)Phase 1 (Overseas)
Type 2 diabetes mellitus HSD-1 inhibitor Improves type 2 diabetes through reducingexcessive glucocorticoid action by inhibitingHSD-1 - HSD1: 11beta-hydroxysteroiddehydrogenase type 1
JTK-656(oral)
Phase 1 (Overseas) HIV infection Integrase inhibitor Integrase inhibitor which works by blockingintegrase, an enzyme that is involved in thereplication of HIV - HIV: Human Immunodeficiency Virus
JTT-751(oral)
Phase 2 (Japan) Hyperphosphatemia Phosphate binder Decreases serum phosphorous level bybinding phosphate derived from dietary inthe gastrointestinal tract
JT obtained the rights to develop andcommercialize this compound in Japanfrom Keryx Biopharmaceuticals (U.S.)(Developed jointly with Torii)
Updates since the previous announcement on February 9, 2009: JTT-751 entered into clinical trial in Japan.Development of JTT-651 was terminated.
Additional Note:Glaxo SmithKline(U.K.) obtained the exclusive, worldwide rights to manufacture,develop and commercialize certain MEK inhibitors from JT on April 18, 2006. In March 2009 GSK updated its external pipeline chart showing the lead MEK inhibitor in Phase 1 clinical development.
25