Overview and Initiatives - Conseil canadien du...
43
Overview and Initiatives Compost Matters in Ontario Workshop – February 23, 2017 Ontario Ministry of Agriculture, Food and Rural Affairs
Transcript of Overview and Initiatives - Conseil canadien du...

Overview and Initiatives
Compost Matters in Ontario Workshop – February 23, 2017
Ontario Ministry of Agriculture, Food and Rural Affairs
Linkages: Economics, Soil, Water, Climate & Land
Productive and Sustainable Agriculture
Sector
Climate Change
Extreme adverse weather Greenhouse gas emissions Adaptation Climate Change Action Plan
Soil Health
Soil organic matter Soil biodiversity Soil structure Fertility Erosion
Water Quality & Quantity
Drought / Floods Access to water
Water Protection Phosphorus / Algal Blooms Domestic Action Plan
Agri-food growth challenge Productivity Trade, exports Local food Profits, jobs
Policy
Research
Education
Stewardship
Land use planning Provincial Policy Statement Provincial Plan Review Agricultural systems
Land Use Agri-Food Growth

Initiatives/Policies:
• Soil Health Strategy
• Great Lakes Water Quality (phosphorus reduction)
• Climate Change (greenhouse gas reduction)
• Pollinator Health
• Decrease/eliminate organics from landfill (MOECC)
BMPs around these issues are being evaluated
All of these initiatives have BMPs where increasing soil organic matter as a common denominator

Need for Shared Vision & Strategy
• Changes in tillage and other practices may be affecting soil health.
• Soil degradation can reduce productivity (as much as 40+% yield loss).
• Climate change is increasing risks (extreme weather, more erosion, drought).
• Changing government priorities & capacity to provide data, advice, analysis.
SHARED LEADERSHIP to ensure long-term soil productivity
• government,
• agriculture industry and
• other partners
• Partnerships have led to major progress in adoption of soil management BMPs.
SHARED INTEREST to feed and supply growing population by:
• Sustaining the productive capacity of our soils
• Ensuring availability of data, knowledge, and tools for sustainable soil management
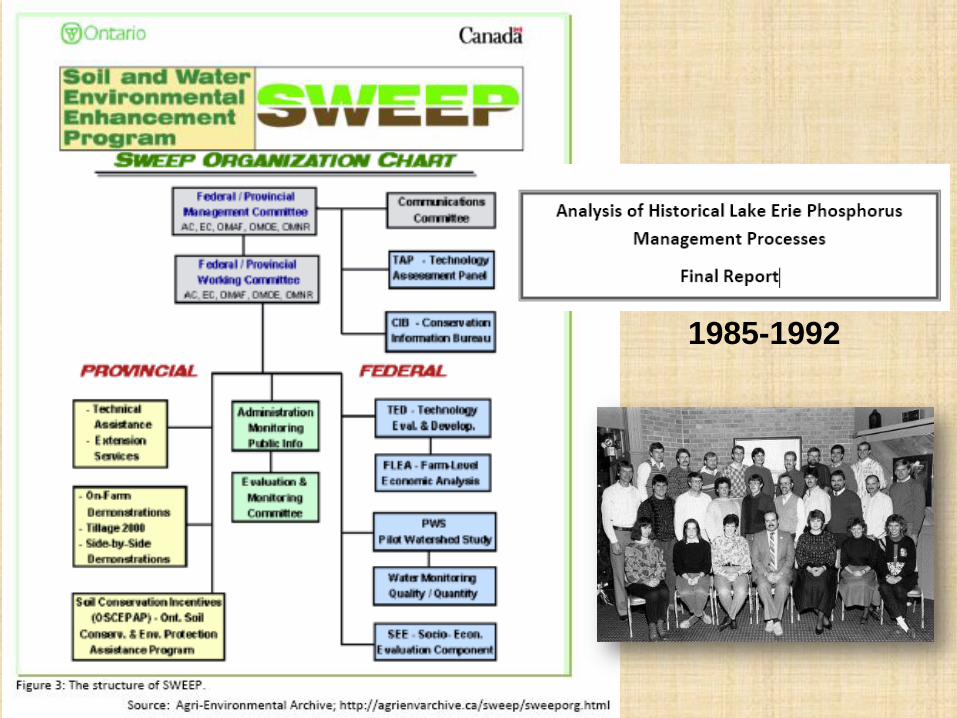
1985-1992

Previous Soil Conservation Program - Highlights
Collaborative approach that included: • Conservation practices became part of “normal farming”
• Program dollars (e.g., OSCEPAP, Land Stewardship)
• Innovative farmers association
• Agriculture industry involvement
• Researchers talked to Ontario farmers
• Government “feet on the ground” – equipment trials, structural erosion control, farmer conservation clubs
• Economics – not just “for societal good”

What’s different?

Changes in the Landscape that Decrease SOM

Change in Livestock Density over Time

Socio-Economic Changes over Time

Impact of Field Size and Crop Rotation over Time

A Collaborative Approach • Collaborative approach reflects shared responsibility.
• Strategy - reflect shared responsibility
– gain support from farmers, farm groups and other partners.
• Technical working group
– Farm groups, academia, conservation groups, federal government.
– Helped develop Discussion Document.
– Build support and shared responsibility.
11
Working Group Participants
Chair
Ontario Ministry of Agriculture, Food and
Rural Affairs (OMAFRA)
Members
Ontario Federation of Agriculture
Christian Farmers Federation of Ontario
Agriculture and Agri-Food Canada
Ontario Soil and Crop Improvement Association
Conservation Authorities
Universities and Research Community
Ontario Certified Crop Advisor Association
Ecological Farmers Association of Ontario
Grain Farmers of Ontario
Soil Conservation Council of Canada
Innovative Farmers Association of Ontario Ontario Fruit & Vegetable Growers Association
Farm and Food Care
National Farmers Union

Soil Strategy Development Process
12
Develop Consensus on Approach &
Discussion Document
Collaborative working group develops consensus on key issues, priorities and principles for action.
Develop Discussion Document for consultation.
Fall 2015 - Spring 2016
Engagement
Engagement on Discussion Document.
Seek input on draft vision, goals and objectives.
Finished Nov 27
Summer/Fall 2016
Strategy Development
Synthesize comments
Working group refines consensus on key issues & priorities
Develop consensus on actions needed.
Develop soil health and conservation strategy document for consultation.
Fall / Winter 2016-2017
Seek Input and Finalize Strategy
Post draft Strategy.
Seek input on draft vision, goals, objectives and actions.
Seek broad support.
Finalize strategy.
2017
PHASE 1 PHASE 2

13
Soil Management Soil Information &
Mapping
Soil Monitoring & Modelling
Soil Knowledge &
Innovation
Draft Vision: Healthy agricultural soils
contribute to a productive economy,
sustainable environment and thriving society
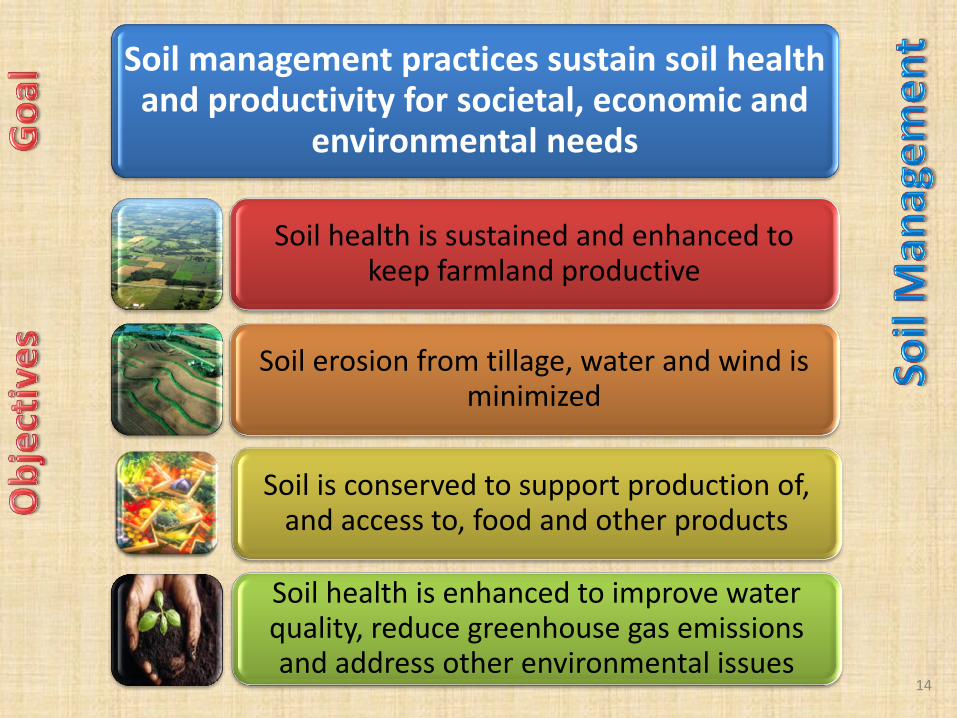
14
Soil management practices sustain soil health and productivity for societal, economic and
environmental needs
Soil health is sustained and enhanced to keep farmland productive
Soil erosion from tillage, water and wind is minimized
Soil is conserved to support production of, and access to, food and other products
Soil health is enhanced to improve water quality, reduce greenhouse gas emissions and address other environmental issues
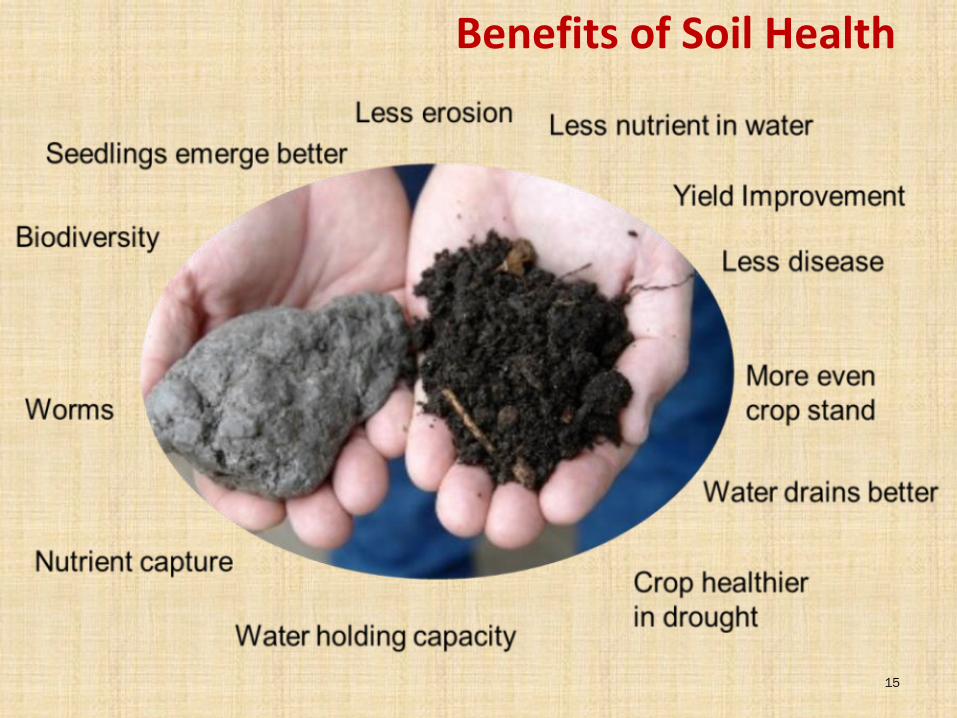
Benefits of Soil Health
15

Building on Current Activities
• Education and Technology Transfer on soil best practices
– Technical advice
– Publications, workshops, meetings
• Risk assessment
– Environmental Farm Planning
• Identification of risks to soil
• Promotion of soil best practices
– Farmland Health Check Up
• Cost sharing on soil practice changes
– Growing Forward 2
– Great Lakes Agriculture Stewardship Initiative
– Conservation Authority programs
• Soil inventory and mapping
• Research - University of Guelph, government, Industry
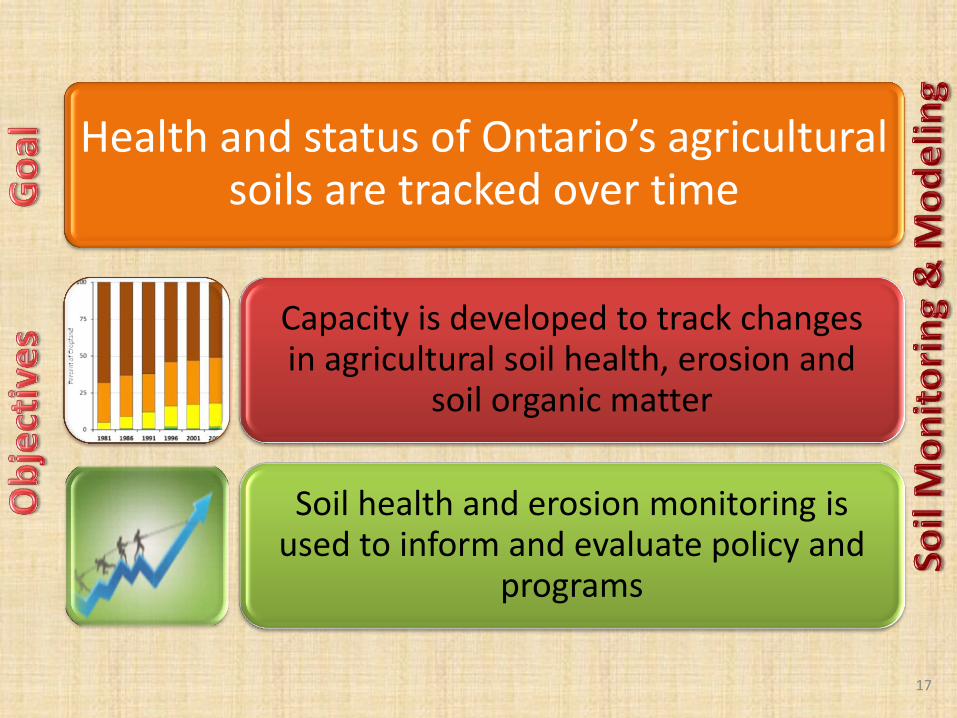
17
Health and status of Ontario’s agricultural soils are tracked over time
Capacity is developed to track changes in agricultural soil health, erosion and
soil organic matter
Soil health and erosion monitoring is used to inform and evaluate policy and
programs


Why do we need Organic Amendments?


Essex OM (mean) over past 15 years is 3.47% (In 1949 soil report 70% of farms tested had > 6% OM)

Niagara OM (mean) over past 15 years is 3.67%
(4.43 % in 1989 soil report)
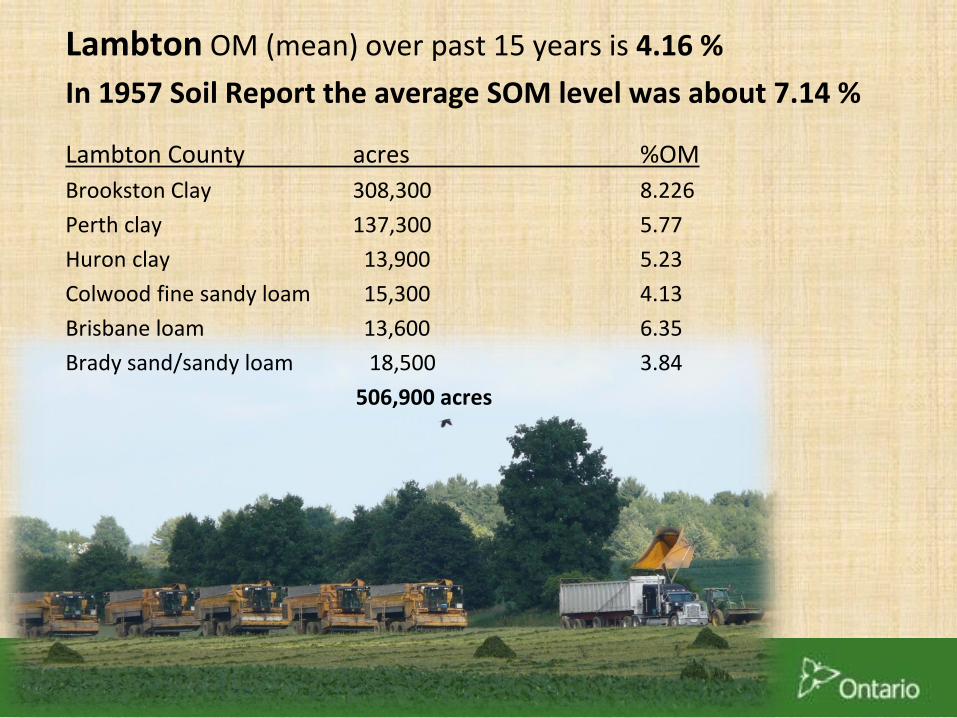
Lambton OM (mean) over past 15 years is 4.16 %
In 1957 Soil Report the average SOM level was about 7.14 %
Lambton County acres %OM
Brookston Clay 308,300 8.226
Perth clay 137,300 5.77
Huron clay 13,900 5.23
Colwood fine sandy loam 15,300 4.13
Brisbane loam 13,600 6.35
Brady sand/sandy loam 18,500 3.84
506,900 acres

Texture Very Good Good Fair Poor
Sand 3.1 % + 2.1 – 3.0 % 1.2 – 2.0 % < 1.1%
Sandy
loam 3.6% + 2.6 – 3.5 % 1.6 – 2.5 % < 1.5 %
Loam 4.1 % + 3.1 – 4.0 % 2.1 – 3.5 % < 2.0 %
Clay loam 4.6% + 3.6 – 4.5 % 2.6 – 3.5 % < 2.5 %
Clay 4.6 % + 3.6 – 4.5 % 2.6 – 3.5 % < 2.5 %
Organic Matter Level Rating for Different Soil Textures From Agronomy Guide for Field Crops - Publication 811
Where Should SOM levels be in Ontario?

25
Reliable soils information and tools are available to allow for informed decision-making and analysis by
producers, industry, government and the public
Soil inventory data are well documented, replicable and defensible
Soil information is comprehensive, accessible, flexible and widely available
Accessible soil data provide for a wide range of analysis and decision-making

Ag Maps: http://www.omafra.gov.on.ca/english/landuse/gis/portal.htm
Canada Land Inventory
Aerial/topographic/drainage
Aerial/topographic Topographic map
Map Layers – Site-Specific on-line info

Pilot Soil Mapping Areas 2016-18
27

Planned LiDAR Acquisition Areas
28

29
Soil knowledge and skills are optimized to meet societal and economic needs and drive innovation
Sustain human resource capacity in soils knowledge to meet priorities
The education sector supports programs for appropriate soils knowledge and skills
Ongoing research supports innovation in soil knowledge and management
Industry has access to people with soil-related knowledge and skills to meet client
needs effectively and economically
Producers have access to knowledge needed to maintain and enhance soil health

30
Soil Knowledge &
Innovation
Soil Knowledge & Innovation theme includes:
• Human resources, skilled professionals in soils
• Education & training in soils
• Research on soils
• Extension/ tech transfer regarding soils

Can Crop Rotation Maintain SOM?
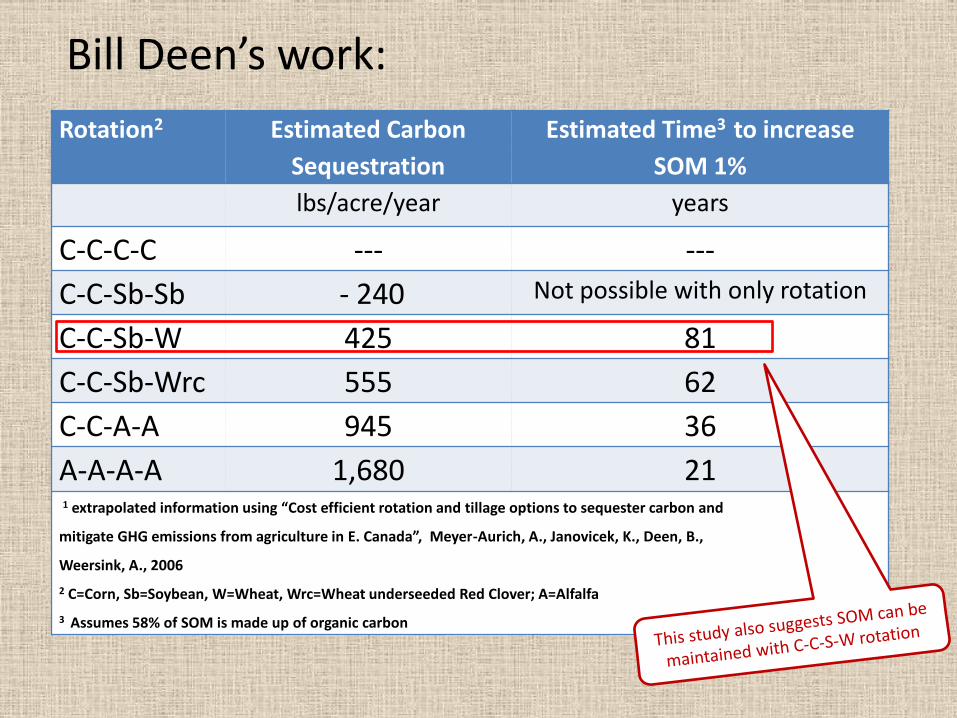
Bill Deen’s work:
Rotation2 Estimated Carbon
Sequestration
Estimated Time3 to increase
SOM 1%
lbs/acre/year years
C-C-C-C --- ---
C-C-Sb-Sb - 240 Not possible with only rotation
C-C-Sb-W 425 81
C-C-Sb-Wrc 555 62
C-C-A-A 945 36
A-A-A-A 1,680 21 1 extrapolated information using “Cost efficient rotation and tillage options to sequester carbon and
mitigate GHG emissions from agriculture in E. Canada”, Meyer-Aurich, A., Janovicek, K., Deen, B.,
Weersink, A., 2006
2 C=Corn, Sb=Soybean, W=Wheat, Wrc=Wheat underseeded Red Clover; A=Alfalfa
3 Assumes 58% of SOM is made up of organic carbon
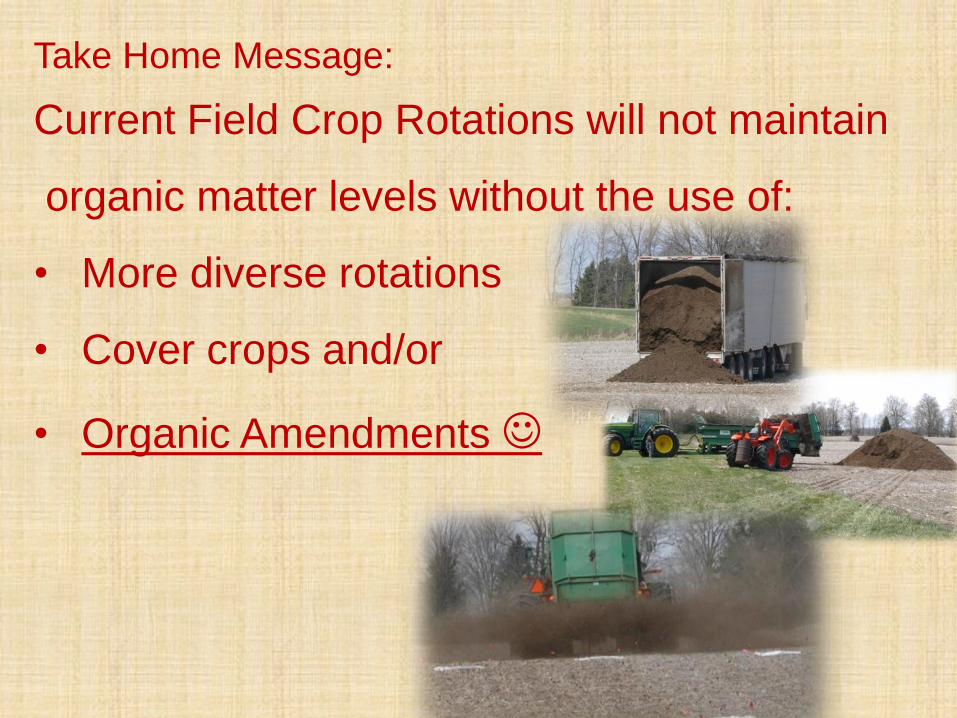
Take Home Message:
Current Field Crop Rotations will not maintain
organic matter levels without the use of:
• More diverse rotations
• Cover crops and/or
• Organic Amendments

Categories of Organic Amendments • Solid Manures / Biosolids / Immature Compost
– Nutrient rich,
– Odours, pathogens
– High carbon/organic matter
• Unrestricted Compost – manure and municipal
• Liquid Manures / Anaerobic Digestate – Available nutrient rich
– Higher environmental risk with application
– Potential for high pH, high ammonia,
– Low carbon/organic matter
• Processed Biosolids – e.g. N-Viro, Pellets, LysteGro
• Other – Biochar


Amendment Type Total N
(lbs/ton)
C:N
ratio
Application
rate (ton/ac)
Stable C
(lb/ton)
% SOM
increase
1% ↑
SOM (applicatons)
N - P205 - K20 (lbs/ac)*
(available)
High C:N dairy 6 lbs 49 340 19,992 1.0 1 327 – 625 - 1,179
High C:N dairy 6 49 150 8,820 0.44 2.3 145 - 276 – 520
Mushroom compost 24.8 10 400 99,200 1.0 1 3,143 - 5,000 - 9,390
Mushroom compost 24.8 10 25 1,240 0.062 16 196 – 313 - 587
Solid Dairy manure 18.32 16 341 19,991 1.0 1 1,160 - 3,600 - 6,900
Solid Dairy manure 18.32 16 32 1,875 0.094 10.6 109 – 338 – 650
Leaf/yard compost 19.6 17 300 19,992 1.0 1 1,808 - 2,315 - 3,445
Leaf/yard compost 19.6 17 34 2,266 0.113 8.8 204 - 263 – 390
Solid Horse manure 10 30 333 19,980 1.0 1 801 - 1,836 - 3,103
Solid Horse manure 10 30 62 3,720 0.186 5.4 149 - 342 - 578
*NMAN3 data using average database nutrient values for application 1 x per 3 years for a 180 bu corn crop
Materials are not created equally – Need to know the nutrient and OM, C:N ratio of the materials being considered.
Organic Amendments: Nutrients or Organic Matter?
How long does it take and how much material is required to raise Soil Organic Matter by ~1%

Leaf tissue N, P and K
0
0.5
1
1.5
2
2.5
3
3.5
Wiley Grant Blydorp Horner
Critical Low Level = 2.5 % N
0
0.05
0.1
0.15
0.2
0.25
0.3
0.35
0.4
Wiley Grant Blydorp Horner
0
0.5
1
1.5
2
2.5
Wiley Grant Blydorp Horner
Critically low Level = 0.28 % P
Critically Low Level = 1.20 % K
Nitrogen
Phosphorus
Potassium
Meaford New Lowell Melancthon Shelburne
Meaford New Lowell Melancthon Shelburne
Meaford New Lowell Melancthon Shelburne
%
%
%

R² = 0.8138
R² = 0.8001
R² = 0.8277
R² = 0.8265
-200
0
200
400
600
800
1000
1200
0 100 200 300 400 500 600
Do
sim
ete
r R
ead
ings
(p
pm
/hr)
Hours After Application
Comparing Ammonia Loss Trends – Injected and Surface Applied Manure to Digestate
check
injected digestate
surface digestate
surface manure
injected manure
Surface Applied Digestate Surface Applied Manure Injected Digestate Injected Manure
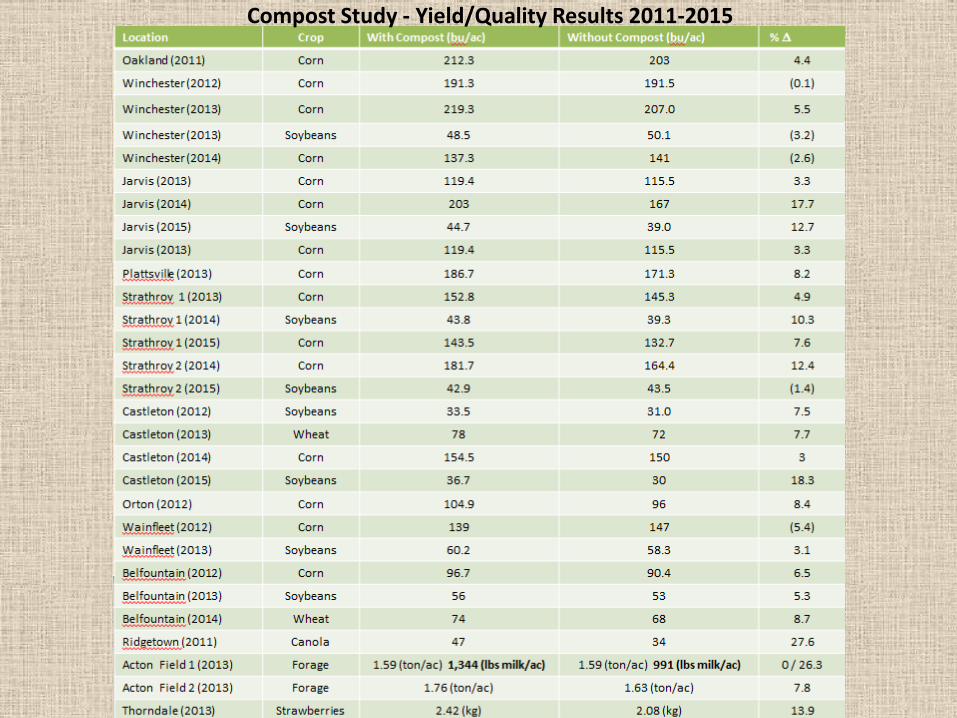
Compost Study - Yield/Quality Results 2011-2015

Next Steps for Soil Strategy
• Consultation completed November 27 on soil discussion paper
• Continue work with technical working group
• Release draft soil strategy summer 2017
• Another round of consultation
41
Theme Soil Working Group Meeting
Begin strategy development December
Soil Management January, March
Soil Data & Mapping March
Soil Evaluation & Monitoring March or April
Soil Knowledge & Innovation April
Putting it Together: Draft Strategy May
Approvals June
Consultation on draft strategy After approvals

Questions?
Christine Brown Field Crop Sustainability Specialist OMAFRA - Woodstock [email protected] 519-537-8305