Over-representation of species-specific vocalizations in ...
15
OVER-REPRESENTATION OF SPECIES-SPECIFIC VOCALIZATIONS IN THE AWAKE MOUSE INFERIOR COLLICULUS C. V. PORTFORS, a * P. D. ROBERTS b AND K. JONSON a a School of Biological Sciences, Washington State University, 14204 NE Salmon Creek Avenue, Vancouver, WA 98686, USA b Division of Biomedical Engineering, Oregon Health & Science Uni- versity, Portland, OR 97239, USA Abstract—Social vocalizations are particularly important stimuli in an animal’s auditory environment. Because of their importance, vocalizations should be strongly represented in auditory pathways. Mice commonly emit ultrasonic vocaliza- tions with spectral content between 45 and 100 kHz. However, there is limited representation of these ultra-high frequencies (particularly those greater than 60 kHz) throughout the as- cending auditory system. Here, we show that neurons in the inferior colliculus (IC) of mice respond strongly to conspe- cific vocalizations even though the energy in the vocaliza- tions is above the neurons’ frequency tuning curves. This results in an over-representation of species-specific vocal- izations in the IC. In addition, neurons in mouse IC show selectivity among different vocalizations. Many vocalization- responsive neurons do not respond to the individual ultra- sonic frequencies contained within the vocalizations, but they do respond to combinations of ultrasonic tones if the difference between the tones is within the excitatory fre- quency tuning curve. The combinations of tones that elicit responses are the quadratic and/or cubic intermodulation distortion components that are generated by the cochlea. Thus, the intermodulation distortions in the cochlea may provide a previously overlooked mechanism for auditory pro- cessing of complex stimuli such as vocalizations. The impli- cation of these findings is that nonlinear interactions of fre- quencies, possibly caused by distortions in the system, may be used to enhance the sensitivity to behaviorally important stimuli. Published by Elsevier Ltd on behalf of IBRO. Key words: hearing, frequency tuning, ultrasonic, neural cod- ing, complex sounds, cochlear distortion. Two fundamental functions of sensory systems are to detect behaviorally relevant signals in complex environments and to discriminate between these signals so appropriate motor be- haviors can be performed. For the auditory system, vocaliza- tions represent one type of behaviorally relevant stimuli. Spe- cies-specific vocalizations are used by many different ani- mals to facilitate important behaviors such as mating, territorial defense, and parent– offspring interactions, with dif- ferent vocalizations conveying different information. The hearing sensitivity of many animals corresponds to the fre- quency range utilized in vocalizations suggesting that audi- tory systems have evolved to enhance detection of behav- iorally relevant signals (Casseday and Covey, 1996). Interestingly, the mouse auditory system does not seem to fit this pattern, at least based on stimulating neurons with pure tone stimuli. Both male and female mice emit a variety of ultra-high frequency vocalizations (UHFVs) with spectral con- tent between 45 and 100 kHz (Holy and Guo, 2005; House- knecht, 1968; Portfors, 2007; Smith, 1975). Males emit UH- FVs during inspection and mounting of females, and different vocalization types are correlated with copulation behaviors (Whitney et al., 1973; Wang et al., 2008). These male-emitted copulation UHFVs have behavioral importance for the female as demonstrated by females spending more time with vocal- izing males than males who have been surgically devocal- ized (Pomerantz et al., 1983). Female mice also emit UHFVs, although in different behavioral contexts than males. Fe- males vocalize in the presence of other females and, in particular in response to a female that is reuniting with her group-mates (D’Amato and Moles, 2001; Moles et al., 2007; Wang et al., 2008). In general, female mice use UHFVs in social investigation contexts whereas males use UHFVs to facilitate mating. Although the behavioral meaning and con- text of the UHFVs varies across vocalization type and gender of emitter (and likely other variables), there is little doubt that UHFVs are behaviorally relevant to mice. It is surprising then that there is limited representation of the ultra-high frequencies used in vocalizations (partic- ularly those greater than 60 kHz) throughout the mouse ascending auditory system (Liu and Schreiner, 2007; Mul- ler et al., 2005; Portfors and Felix, 2005; Romand and Ehret, 1990; Stiebler and Ehret, 1985; Stiebler et al., 1997). For example, in the main auditory midbrain nucleus, the inferior colliculus (IC), the representation of different frequency ranges is not equal with frequencies between 15 and 26 kHz over-represented (occupying 56% of the whole IC volume) and frequencies above 45 kHz under-repre- sented (Romand and Ehret, 1990; Stiebler and Ehret, 1985). Frequencies above 45 kHz are found in the most medial regions of the IC, often outside of the central nu- cleus of the IC, and occupy a small percentage of the total volume of the IC (Stiebler and Ehret, 1985). In most stud- ies of IC, neurons with best frequencies greater than 60 kHz are rarely found and lowest tone thresholds for fre- quencies around 60 kHz are at least 40 –50 dB higher than thresholds to neurons tuned to 15–30 kHz (Hage and Ehret, 2003; Portfors and Felix, 2005; Romand and Ehret, 1990; Stiebler and Ehret, 1985). In addition, frequency tuning curves rarely extend beyond 60 –70 kHz. These electrophysiological data are congruent with behavioral *Corresponding author. Tel: 360-546-9434; fax: 360-546-9064. E-mail address: [email protected] (C. V. Portfors). Abbreviations: CF, characteristic frequency; FFT, fast Fourier trans- form; IC, inferior colliculus; MT, minimal threshold; PSTH, post-stimu- lus time histogram; SI, selectivity index; UHFV, ultra-high frequency vocalization. Neuroscience 162 (2009) 486 –500 0306-4522/09 $ - see front matter. Published by Elsevier Ltd on behalf of IBRO. doi:10.1016/j.neuroscience.2009.04.056 486
Transcript of Over-representation of species-specific vocalizations in ...
OT
Ca
Nb
v
Asiatt(cictrisrstdqrdTpccqbs
Ki
Tbdhtcmtfh
*EAflv
Neuroscience 162 (2009) 486–500
0d
VER-REPRESENTATION OF SPECIES-SPECIFIC VOCALIZATIONS IN
HE AWAKE MOUSE INFERIOR COLLICULUSqti
tputkFv(caiiampgWsftoU
oualE1tfaIs1mcvikqtE1t
. V. PORTFORS,a* P. D. ROBERTSb AND K. JONSONa
School of Biological Sciences, Washington State University, 14204E Salmon Creek Avenue, Vancouver, WA 98686, USA
Division of Biomedical Engineering, Oregon Health & Science Uni-ersity, Portland, OR 97239, USA
bstract—Social vocalizations are particularly importanttimuli in an animal’s auditory environment. Because of their
mportance, vocalizations should be strongly represented inuditory pathways. Mice commonly emit ultrasonic vocaliza-ions with spectral content between 45 and 100 kHz. However,here is limited representation of these ultra-high frequenciesparticularly those greater than 60 kHz) throughout the as-ending auditory system. Here, we show that neurons in the
nferior colliculus (IC) of mice respond strongly to conspe-ific vocalizations even though the energy in the vocaliza-ions is above the neurons’ frequency tuning curves. Thisesults in an over-representation of species-specific vocal-zations in the IC. In addition, neurons in mouse IC showelectivity among different vocalizations. Many vocalization-esponsive neurons do not respond to the individual ultra-onic frequencies contained within the vocalizations, buthey do respond to combinations of ultrasonic tones if theifference between the tones is within the excitatory fre-uency tuning curve. The combinations of tones that elicitesponses are the quadratic and/or cubic intermodulationistortion components that are generated by the cochlea.hus, the intermodulation distortions in the cochlea mayrovide a previously overlooked mechanism for auditory pro-essing of complex stimuli such as vocalizations. The impli-ation of these findings is that nonlinear interactions of fre-uencies, possibly caused by distortions in the system, maye used to enhance the sensitivity to behaviorally importanttimuli. Published by Elsevier Ltd on behalf of IBRO.
ey words: hearing, frequency tuning, ultrasonic, neural cod-ng, complex sounds, cochlear distortion.
wo fundamental functions of sensory systems are to detectehaviorally relevant signals in complex environments and toiscriminate between these signals so appropriate motor be-aviors can be performed. For the auditory system, vocaliza-
ions represent one type of behaviorally relevant stimuli. Spe-ies-specific vocalizations are used by many different ani-als to facilitate important behaviors such as mating,
erritorial defense, and parent–offspring interactions, with dif-erent vocalizations conveying different information. Theearing sensitivity of many animals corresponds to the fre-
Corresponding author. Tel: �360-546-9434; fax: �360-546-9064.-mail address: [email protected] (C. V. Portfors).bbreviations: CF, characteristic frequency; FFT, fast Fourier trans-
orm; IC, inferior colliculus; MT, minimal threshold; PSTH, post-stimu-
eus time histogram; SI, selectivity index; UHFV, ultra-high frequencyocalization.
306-4522/09 $ - see front matter. Published by Elsevier Ltd on behalf of IBRO.oi:10.1016/j.neuroscience.2009.04.056
486
uency range utilized in vocalizations suggesting that audi-ory systems have evolved to enhance detection of behav-orally relevant signals (Casseday and Covey, 1996).
Interestingly, the mouse auditory system does not seemo fit this pattern, at least based on stimulating neurons withure tone stimuli. Both male and female mice emit a variety ofltra-high frequency vocalizations (UHFVs) with spectral con-
ent between 45 and 100 kHz (Holy and Guo, 2005; House-necht, 1968; Portfors, 2007; Smith, 1975). Males emit UH-Vs during inspection and mounting of females, and differentocalization types are correlated with copulation behaviorsWhitney et al., 1973; Wang et al., 2008). These male-emittedopulation UHFVs have behavioral importance for the females demonstrated by females spending more time with vocal-
zing males than males who have been surgically devocal-zed (Pomerantz et al., 1983). Female mice also emit UHFVs,lthough in different behavioral contexts than males. Fe-ales vocalize in the presence of other females and, inarticular in response to a female that is reuniting with herroup-mates (D’Amato and Moles, 2001; Moles et al., 2007;ang et al., 2008). In general, female mice use UHFVs in
ocial investigation contexts whereas males use UHFVs toacilitate mating. Although the behavioral meaning and con-ext of the UHFVs varies across vocalization type and genderf emitter (and likely other variables), there is little doubt thatHFVs are behaviorally relevant to mice.
It is surprising then that there is limited representationf the ultra-high frequencies used in vocalizations (partic-larly those greater than 60 kHz) throughout the mousescending auditory system (Liu and Schreiner, 2007; Mul-
er et al., 2005; Portfors and Felix, 2005; Romand andhret, 1990; Stiebler and Ehret, 1985; Stiebler et al.,997). For example, in the main auditory midbrain nucleus,he inferior colliculus (IC), the representation of differentrequency ranges is not equal with frequencies between 15nd 26 kHz over-represented (occupying 56% of the wholeC volume) and frequencies above 45 kHz under-repre-ented (Romand and Ehret, 1990; Stiebler and Ehret,985). Frequencies above 45 kHz are found in the mostedial regions of the IC, often outside of the central nu-
leus of the IC, and occupy a small percentage of the totalolume of the IC (Stiebler and Ehret, 1985). In most stud-
es of IC, neurons with best frequencies greater than 60Hz are rarely found and lowest tone thresholds for fre-uencies around 60 kHz are at least 40–50 dB higher thanhresholds to neurons tuned to 15–30 kHz (Hage andhret, 2003; Portfors and Felix, 2005; Romand and Ehret,990; Stiebler and Ehret, 1985). In addition, frequencyuning curves rarely extend beyond 60–70 kHz. These
lectrophysiological data are congruent with behavioral
tisbla
IcewabfttMseaaoen2vtwveiai
sicwscdsgdmvncrbc
S
Fn1at
tN
cu2sipmlcuncaat
A
PpcwpaCetbaaossasTamtDbg2bmtwatpudowtd
E
Tihacm
C. V. Portfors et al. / Neuroscience 162 (2009) 486–500 487
hresholds to tones in the frequency range commonly usedn mouse vocalizations (Ehret, 1974). Behavioral re-ponses to pure tones can be obtained up to about 90 kHz,ut the thresholds to these ultra-high frequencies are at
east 80 dB SPL. Thus, it is unclear how the UHFVs of micere encoded by the auditory system.
In this study, we first examined whether neurons in theC of awake mice can detect vocalizations with spectralontent outside the frequency range of most neuronalxcitatory frequency tuning curves. We then examinedhether neurons in the IC of mouse show selectivitymong vocalizations to determine whether the IC is capa-le of discriminating among different vocalizations. Weocused on the IC because it receives convergent excita-ory and inhibitory inputs from most lower brainstem struc-ures (Brunso-Bechtold et al., 1981; Casseday et al., 2002;almierca, 2005) resulting in the creation of novel re-
ponse properties. In particular, studies in bats providevidence that the IC is the first site in the ascendinguditory system where individual neurons show selectivitymong vocalizations; each neuron responds to only a subsetf vocalizations even though non-eliciting vocalizations havenergy within the excitatory frequency tuning curve of theeuron (Holmstrom et al., 2007; Klug et al., 2002; Portfors,004; Xie et al., 2005). The level of selectivity across neuronsaries, with some neurons responding to only one vocaliza-ion and others responding to many vocalizations but oftenith different temporal firing patterns. Selectivity to particularocalizations is sometimes due to inhibition surrounding thexcitatory tuning curve (Klug et al., 2002; Xie et al., 2005),
nhibition far from the excitatory tuning curve (Holmstrom etl., 2007) or nonlinear facilitation between multiple harmonics
n the vocalization (Portfors, 2004).Each of the studied neural mechanisms underlying
electivity to vocalizations requires that the response-elic-ting vocalizations have some match between their spectralontent and the frequency tuning curve of the neuron. Oneay that neurons could respond to vocalizations that havepectral content far outside the neurons’ frequency tuningurve is to take advantage of nonlinearities in the trans-uction of sound to the auditory nerve. Recent evidencehows that IC neurons respond to cochlear distortionsenerated by combinations of pure tones that individuallyo not evoke responses (Abel and Kossl, 2009). Becauseice emit ultra-high frequencies in their behaviorally rele-
ant vocalizations, in this study we examined whether ICeurons respond to cochlear distortions generated byombinations of ultra-high frequencies. We found that neu-ons in IC do respond to cochlear distortions and this maye a mechanism utilized for encoding behaviorally relevantomplex sounds such as conspecific vocalizations.
EXPERIMENTAL PROCEDURES
urgical procedures
emale CBA/CaJ mice were used in this study. This strain exhibitsormal hearing sensitivity well into its second year of life (Willott,986, 1991, 2005). The care and experimental manipulations of thenimals were carried out in accordance with guidelines of the Na-
ional Institutes of Health and have been approved by the Washing- E
on State University Institutional Animal Care and Use Committee.umber of animals used and their suffering was minimized.
To enable extracellular recordings in the awake mouse, weemented a metal pin onto the skull of the animal that was latersed to secure the head into the stereotax (Portfors and Felix,005; Felix and Portfors, 2007; Portfors and Roberts, 2007). Theurgery was done one or two days prior to extracellular record-ngs. The animal was anesthetized with isoflurane inhalation andlaced in a rodent stereotaxic frame with a mouse adaptor. Aidline incision was made in the scalp and the skin reflected
aterally. A tungsten ground electrode was cemented into the righterebral cortex and the metal pin was cemented onto the skullsing ultraviolet-cured dental cement. Using stereotaxic coordi-ates (Paxinos and Franklin, 2001) and surface landmarks, araniotomy was made over the IC. A local anesthetic (lidocaine)nd topical antibiotic (neosporin) were applied to the wound. Thenimal was returned to its home cage to recover from surgery prioro starting electrophysiological recordings.
coustic stimulation
ure tone stimuli and natural mouse social vocalizations wereresented as stimuli. Pure tone stimuli were synthesized usingustom-written C�� computer algorithms. The pure tone stimuliere 50–100 ms duration, had 1 ms rise/fall times and wereresented at a rate of four/s. The social vocalizations consisted ofsuite of 16 calls. These vocalizations were recorded from CBA/aJ adult mice in our laboratory and are known to be regularlymitted by mice living in captivity (Portfors, 2007). The vocaliza-ions do not represent the entire repertoire of mouse vocalizations,ut rather represent a variety of commonly emitted ultrasonic callsnd two low frequency calls that both males and females emit. Themplitude of the vocalizations was adjusted so that they were allutput at the same peak intensity. All vocalization stimuli weretored in the computer prior to electrophysiological recordings. Allound stimuli were output through a high-speed, 16-bit digital-to-nalog converter (Microstar Laboratories, Bellevue, WA; 400,000amples/s), fed to a programmable attenuator (Tucker Davisechnologies, Alachua, FL; PA5), a power amplifier (Parasound)nd to a leaf tweeter speaker (Emit) located 10 cm away from theouse. The acoustic properties of the system were regularly
ested using a 1/4 in. calibrated microphone (Bruel and Kjaer,enmark; model 4135) placed in the position normally occupiedy the animal’s ear. For pure tone stimuli, there was a smooth,radual decrease in sound pressure from 6 to 100 kHz of about.7 dB per 10 kHz. Distortion components in tonal stimuli wereuried in the noise floor, at least 50 dB below the signal level, aseasured by custom-designed software performing a fast Fourier
ransform (FFT) of the digitized microphone signal. To determinehether responses to combinations of signals with frequenciesbove 45 kHz were due to speaker distortion, we also examined
he FFT of each high frequency tone pairs. No speaker distortion wasresent in any of the two-tone combination stimuli. Vocalization stim-li were calibrated as described above for pure tone stimuli. Potentialistortions in the vocalizations were examined by performing a FFTf each digitized vocalization. Low frequency noise in any UHFVsas eliminated prior to output by the speaker by passing the signal
hrough a high-pass filter with a cutoff of 20 kHz. No noise oristortions were present in the vocalization stimuli.
xtracellular recording procedure
he mouse was briefly sedated with acepromazine and restrainedn a piece of foam molded to its body, and the pin attached to itsead was secured to a bar on a custom-designed stereotaxicpparatus that was housed in a single-walled sound-attenuatinghamber. To obtain well-isolated single unit responses, we usedicropipettes filled with 1 M NaCl (resistances of 20–30 M�).
lectrodes were advanced into the IC by a hydraulic microposi-
tarEMBBlds(htdMrcedw
S
Pstwfst
S
Ttr(aia
C
Btmctwa1ekwtutd2ashd
U
Tus
it83wTSd1ttm2
V
Ritlfc
D
SdedcMqfe2
wcwheofdhftrifb
tqitFttibtcekbtt
C. V. Portfors et al. / Neuroscience 162 (2009) 486–500488
ioner (David Kopf Instruments, Tujunga, CA) located outside thecoustic chamber. Electrode penetrations were dorsal–ventral toecord from neurons throughout the central nucleus of the IC.xtracellular action potentials were amplified (Dagan Corporation,inneapolis, MN), filtered (bandpass, 500–6000 Hz; Krohn-Hite,rockton, MA) and sent through a spike enhancer (Fredrick Haer,owdoin, ME) before being digitized (Microstar Laboratories, Bel-
evue, WA; 10,000 samples/s). Individual neural waveforms wereisplayed and archived using custom-written C�� software. Theoftware displayed raster plots, post-stimulus time histogramsPSTHs), and statistics on-line. Spike discrimination, spike en-ancement, and time-window analysis parameters could be al-ered offline to analyze stored raw waveforms. Raster and PSTHata were further analyzed and displayed using custom writtenATLAB (The MathWorks, Inc., Natick, MA) programs. Each
ecording session lasted 6–8 h and one to three sessions wereonducted on each animal. Petroleum jelly was used to protect thexposed brain between recording sessions. If the animal struggleduring experiments, it was removed for the day and recordingsere resumed on a subsequent day.
timulus protocol
ure tones (100 ms duration) were used as search stimuli. Once aingle unit was isolated, characteristic frequency (CF) and minimalhreshold (MT) were determined audiovisually and later confirmedith quantitative frequency tuning tests. The CF was defined as the
requency at which a unit evoked spikes to at least 50% of thetimulus presentations at MT, and MT was defined as the minimumhreshold required to evoke a response to 50% of the stimuli at the CF.
ingle tone stimuli
o obtain excitatory frequency tuning curves, we presented pureone bursts (100 ms duration, 1 ms rise/fall time, four/s, 200 msecording window) across the majority of the mouse hearing range6–80 kHz in 2 kHz steps) in 20 dB intensity steps from 10 dBbove threshold to approximately 80–90 dB SPL. Each frequency–
ntensity pair was presented 20 times. Twenty repetitions withoutstimulus were used to calculate spontaneous rate.
ombination stimuli with one tone set at CF
ecause we previously showed that combination-sensitive inhibi-ion (Holmstrom et al., 2007) and facilitation (Portfors, 2004) areechanisms utilized by IC neurons in the mustached bat to dis-
riminate among conspecific vocalizations, we presented pairs ofones (100 ms duration, 1 ms rise/fall time, 200 ms recordingindow, simultaneous onset) to test whether similar mechanismsre utilized by neurons in mouse IC. One tone was set at CF and0–30 dB above threshold such that a consistent spike rate wasvoked while the frequency of a second tone varied from 6 to 100Hz at 20 dB attenuation. Twenty repetitions of each tone pairere presented. If there was evidence of inhibition and/or facilita-
ion, the intensity of the second tone was varied in steps of 10 dBntil the inhibition or facilitation was eliminated. This generated a
hreshold of inhibition or facilitation. Inhibition and facilitation wereefined by the spike rate decreasing or increasing by greater than0% of the sum of the spike rates to the individual tones (Portforsnd Wenstrup, 1999; Portfors and Felix, 2005). Inhibition thaturrounded the excitatory frequency tuning curves was used toelp categorize the neurons into frequency tuning types previouslyefined for mouse IC (Egorova et al., 2001).
ltrasonic tone pairs
o determine whether distortion products could be a mechanismtilized by IC neurons to encode complex, ultra-high frequency
timuli, we presented pairs of ultra-high frequency tones that tndividually did not evoke neural responses. We arbitrarily set oneone at a high frequency used in many vocalizations (usually 70 or0 kHz) and varied the frequency of the second tone (between0–100 kHz) so that the difference between the two frequenciesould cover the extent of the neuron’s frequency tuning curve.he intensity of the tones was set at 20 dB attenuation (60–80 dBPL depending on the frequency response of the speaker) becauseistortion products occur with high intensities (Nuttall and Dolan,993; Abel and Kossl, 2009). In some cases, we varied the intensi-ies of the tones to determine a threshold for the neural response tohe combination stimuli. The two tones had simultaneous onset, 100s duration, 1 ms rise/fall times and were presented at four/s with a00 ms recording window.
ocalization stimuli
esponses to a suite of 16 vocalizations were tested at threentensities (40, 60 and 80 dB; intensities at which the vocaliza-ions are naturally emitted). Twenty repetitions of each stimu-us, at each intensity were presented. Vocalizations were dif-erent durations, but each was presented at four/s with a re-ording window of 200 ms.
ata analysis
pike counts and raw waveforms were stored in the computeruring data collection. Raw waveforms were examined offline tonsure only spikes from well-isolated single units were used in theata analysis. Data were exported from the custom-written dataollection software and analyzed using programs written inATLAB. Responses to single tones were used to generate fre-uency tuning curves. Frequency tuning curves were generatedrom the pure tone tests using statistical comparisons betweenvoked responses and spontaneous activity (Holmstrom et al.,007).
We categorized the excitatory frequency tuning curves in twoays. First, we utilized the classification scheme of Ehret andolleagues (Egorova et al., 2001) derived for mouse IC. Neuronsere classified into types I, II, III and IV based on the slopes of theigh and low frequency sides of the excitatory tuning curve, pres-nce of inhibitory sidebands and complex response areas. Sec-nd, because one goal of this study was to determine whetherrequency tuning curves could predict responses to UHFVs, weeveloped a classification scheme to distinguish between low andigh frequency tuned neurons. Our distinction between low and highrequencies was based on the spectral content of the UHFVs suchhat low frequency tuning curves were entirely outside the frequencyange of the UHFVs. We categorized the frequency tuning curvesnto four types based on CF and the width of the tuning curve. Theour categories were (1) low frequency, narrow; (2) low frequency,road; (3) high frequency; (4) multiply tuned.
To sort the tuning curves into the four categories, we analyzedhe peak responses of an intensity compressed form of the fre-uency tuning curve, F (f, a), where f is the frequency (Hz) and a
s the SPL intensity (dB). For the intensity compressed form, Fc�f�,he tuning curve was summed over the sampled intensities,c�f���a F�f,a�, to yield a profile of the frequency response. We
hen determined the range of frequencies with responses greaterhan 0.3 times the maximum, �f: Fc�f��0.3·max�Fc�f���. If the max-mum f in this set was less than 35 kHz, and the differenceetween the minimum f and maximum f was less than 8 kHz, then
he frequency tuning curve was in the low frequency, narrowategory. If the maximum f was less than 35 kHz, and the differ-nce between the minimum f and maximum f was greater than 8Hz, then the frequency tuning curve was in the low frequency,road category. If the minimum f was greater than 35 kHz, thenhe frequency tuning curve was in the high frequency category. Ifhere were frequencies in the set that were both greater and less
han 35 kHz, then the frequency tuning curve was in the multiply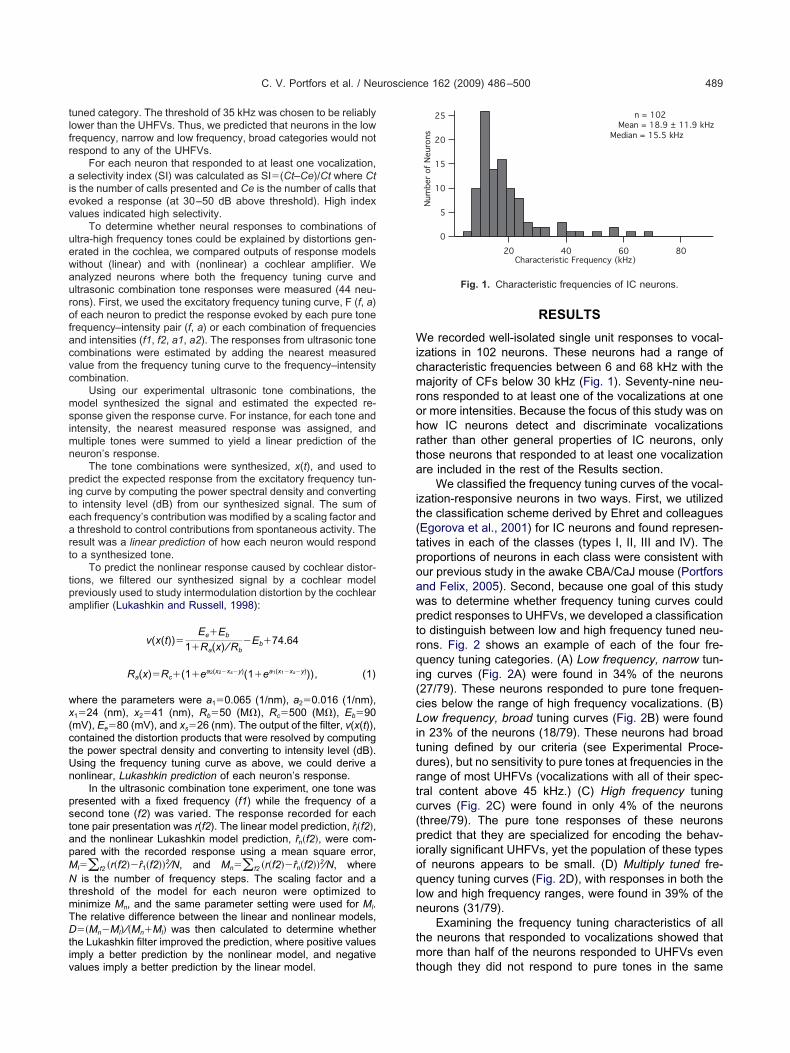
tlfr
aiev
uewaurofacvc
msimn
piteart
tpa
wx(ctUn
pstapMNtmTDtiv
Wicmrohrta
it(tpoawptrqi(cLitdrtc(pioqln
tm
C. V. Portfors et al. / Neuroscience 162 (2009) 486–500 489
uned category. The threshold of 35 kHz was chosen to be reliablyower than the UHFVs. Thus, we predicted that neurons in the lowrequency, narrow and low frequency, broad categories would notespond to any of the UHFVs.
For each neuron that responded to at least one vocalization,selectivity index (SI) was calculated as SI�(Ct–Ce)/Ct where Ct
s the number of calls presented and Ce is the number of calls thatvoked a response (at 30–50 dB above threshold). High indexalues indicated high selectivity.
To determine whether neural responses to combinations ofltra-high frequency tones could be explained by distortions gen-rated in the cochlea, we compared outputs of response modelsithout (linear) and with (nonlinear) a cochlear amplifier. Wenalyzed neurons where both the frequency tuning curve andltrasonic combination tone responses were measured (44 neu-ons). First, we used the excitatory frequency tuning curve, F (f, a)f each neuron to predict the response evoked by each pure tonerequency–intensity pair (f, a) or each combination of frequenciesnd intensities (f1, f2, a1, a2). The responses from ultrasonic toneombinations were estimated by adding the nearest measuredalue from the frequency tuning curve to the frequency–intensityombination.
Using our experimental ultrasonic tone combinations, theodel synthesized the signal and estimated the expected re-
ponse given the response curve. For instance, for each tone andntensity, the nearest measured response was assigned, and
ultiple tones were summed to yield a linear prediction of theeuron’s response.
The tone combinations were synthesized, x(t), and used toredict the expected response from the excitatory frequency tun-
ng curve by computing the power spectral density and convertingo intensity level (dB) from our synthesized signal. The sum ofach frequency’s contribution was modified by a scaling factor andthreshold to control contributions from spontaneous activity. The
esult was a linear prediction of how each neuron would respondo a synthesized tone.
To predict the nonlinear response caused by cochlear distor-ions, we filtered our synthesized signal by a cochlear modelreviously used to study intermodulation distortion by the cochlearmplifier (Lukashkin and Russell, 1998):
v(x(t))�Ee�Eb
1�Ra(x) ⁄ Rb�Eb�74.64
Ra(x)�Rc�(1�ea2(x2�xs�y)(1�ea1(x1�xs�y))), (1)
here the parameters were a1�0.065 (1/nm), a2�0.016 (1/nm),1�24 (nm), x2�41 (nm), Rb�50 (M�), Rc�500 (M�), Eb�90mV), Ee�80 (mV), and xs�26 (nm). The output of the filter, v(x(t)),ontained the distortion products that were resolved by computinghe power spectral density and converting to intensity level (dB).sing the frequency tuning curve as above, we could derive aonlinear, Lukashkin prediction of each neuron’s response.
In the ultrasonic combination tone experiment, one tone wasresented with a fixed frequency (f1) while the frequency of aecond tone (f2) was varied. The response recorded for eachone pair presentation was r(f2). The linear model prediction, r̂l�f2�,nd the nonlinear Lukashkin model prediction, r̂n�f2�, were com-ared with the recorded response using a mean square error,l��f2 �r�f2��r̂1�f2��2⁄N, and Mn��f2 �r�f2��r̂n�f2��2⁄N, whereis the number of frequency steps. The scaling factor and a
hreshold of the model for each neuron were optimized toinimize Mn, and the same parameter setting were used for Ml.he relative difference between the linear and nonlinear models,��Mn�Ml� ⁄�Mn�Ml� was then calculated to determine whether
he Lukashkin filter improved the prediction, where positive valuesmply a better prediction by the nonlinear model, and negative
alues imply a better prediction by the linear model. tRESULTS
e recorded well-isolated single unit responses to vocal-zations in 102 neurons. These neurons had a range ofharacteristic frequencies between 6 and 68 kHz with theajority of CFs below 30 kHz (Fig. 1). Seventy-nine neu-
ons responded to at least one of the vocalizations at oner more intensities. Because the focus of this study was onow IC neurons detect and discriminate vocalizationsather than other general properties of IC neurons, onlyhose neurons that responded to at least one vocalizationre included in the rest of the Results section.
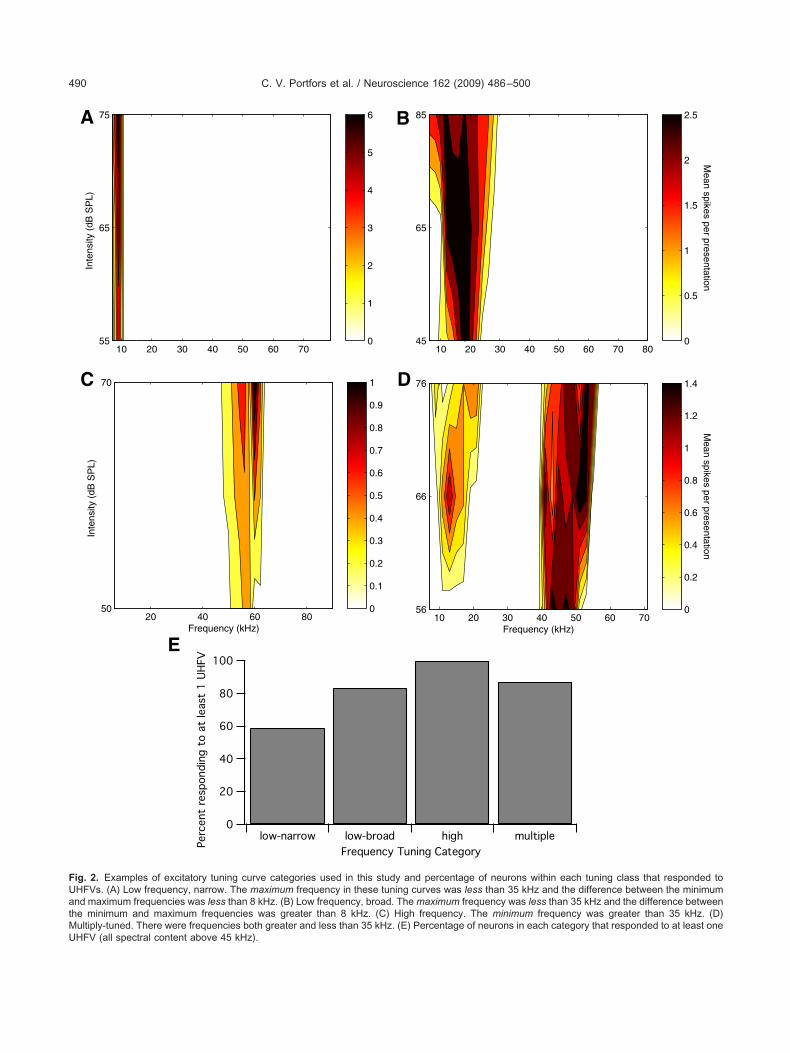
We classified the frequency tuning curves of the vocal-zation-responsive neurons in two ways. First, we utilizedhe classification scheme derived by Ehret and colleaguesEgorova et al., 2001) for IC neurons and found represen-atives in each of the classes (types I, II, III and IV). Theroportions of neurons in each class were consistent withur previous study in the awake CBA/CaJ mouse (Portforsnd Felix, 2005). Second, because one goal of this studyas to determine whether frequency tuning curves couldredict responses to UHFVs, we developed a classificationo distinguish between low and high frequency tuned neu-ons. Fig. 2 shows an example of each of the four fre-uency tuning categories. (A) Low frequency, narrow tun-
ng curves (Fig. 2A) were found in 34% of the neurons27/79). These neurons responded to pure tone frequen-ies below the range of high frequency vocalizations. (B)ow frequency, broad tuning curves (Fig. 2B) were found
n 23% of the neurons (18/79). These neurons had broaduning defined by our criteria (see Experimental Proce-ures), but no sensitivity to pure tones at frequencies in theange of most UHFVs (vocalizations with all of their spec-ral content above 45 kHz.) (C) High frequency tuningurves (Fig. 2C) were found in only 4% of the neuronsthree/79). The pure tone responses of these neuronsredict that they are specialized for encoding the behav-
orally significant UHFVs, yet the population of these typesf neurons appears to be small. (D) Multiply tuned fre-uency tuning curves (Fig. 2D), with responses in both the
ow and high frequency ranges, were found in 39% of theeurons (31/79).
Examining the frequency tuning characteristics of allhe neurons that responded to vocalizations showed thatore than half of the neurons responded to UHFVs even
Fig. 1. Characteristic frequencies of IC neurons.
hough they did not respond to pure tones in the same
FUatMU
C. V. Portfors et al. / Neuroscience 162 (2009) 486–500490
ig. 2. Examples of excitatory tuning curve categories used in this study and percentage of neurons within each tuning class that responded toHFVs. (A) Low frequency, narrow. The maximum frequency in these tuning curves was less than 35 kHz and the difference between the minimumnd maximum frequencies was less than 8 kHz. (B) Low frequency, broad. The maximum frequency was less than 35 kHz and the difference between
he minimum and maximum frequencies was greater than 8 kHz. (C) High frequency. The minimum frequency was greater than 35 kHz. (D)ultiply-tuned. There were frequencies both greater and less than 35 kHz. (E) Percentage of neurons in each category that responded to at least one
HFV (all spectral content above 45 kHz).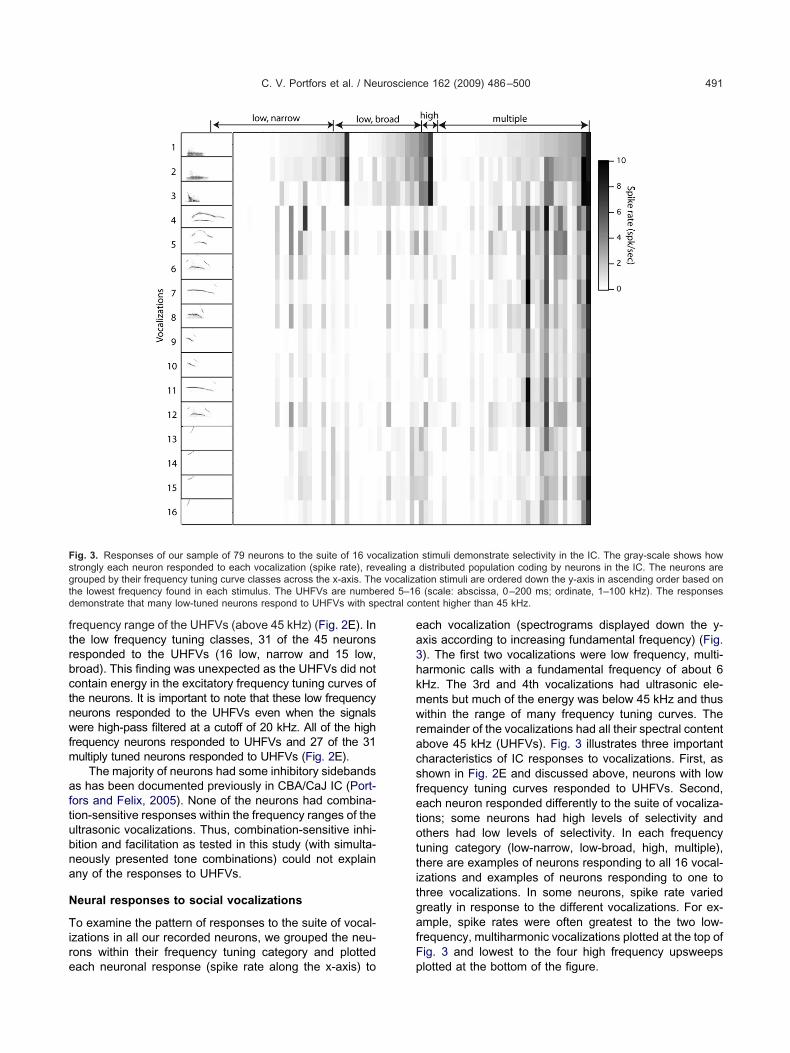
ftrbctnwfm
aftubna
N
Tire
ea3hkmwracsfetottitgafF
Fsgt red 5–16d ectral co
C. V. Portfors et al. / Neuroscience 162 (2009) 486–500 491
requency range of the UHFVs (above 45 kHz) (Fig. 2E). Inhe low frequency tuning classes, 31 of the 45 neuronsesponded to the UHFVs (16 low, narrow and 15 low,road). This finding was unexpected as the UHFVs did notontain energy in the excitatory frequency tuning curves ofhe neurons. It is important to note that these low frequencyeurons responded to the UHFVs even when the signalsere high-pass filtered at a cutoff of 20 kHz. All of the high
requency neurons responded to UHFVs and 27 of the 31ultiply tuned neurons responded to UHFVs (Fig. 2E).
The majority of neurons had some inhibitory sidebandss has been documented previously in CBA/CaJ IC (Port-ors and Felix, 2005). None of the neurons had combina-ion-sensitive responses within the frequency ranges of theltrasonic vocalizations. Thus, combination-sensitive inhi-ition and facilitation as tested in this study (with simulta-eously presented tone combinations) could not explainny of the responses to UHFVs.
eural responses to social vocalizations
o examine the pattern of responses to the suite of vocal-zations in all our recorded neurons, we grouped the neu-ons within their frequency tuning category and plotted
ig. 3. Responses of our sample of 79 neurons to the suite of 16 votrongly each neuron responded to each vocalization (spike rate), revrouped by their frequency tuning curve classes across the x-axis. Thehe lowest frequency found in each stimulus. The UHFVs are numbeemonstrate that many low-tuned neurons respond to UHFVs with sp
ach neuronal response (spike rate along the x-axis) to p
ach vocalization (spectrograms displayed down the y-xis according to increasing fundamental frequency) (Fig.). The first two vocalizations were low frequency, multi-armonic calls with a fundamental frequency of about 6Hz. The 3rd and 4th vocalizations had ultrasonic ele-ents but much of the energy was below 45 kHz and thusithin the range of many frequency tuning curves. The
emainder of the vocalizations had all their spectral contentbove 45 kHz (UHFVs). Fig. 3 illustrates three importantharacteristics of IC responses to vocalizations. First, ashown in Fig. 2E and discussed above, neurons with lowrequency tuning curves responded to UHFVs. Second,ach neuron responded differently to the suite of vocaliza-ions; some neurons had high levels of selectivity andthers had low levels of selectivity. In each frequencyuning category (low-narrow, low-broad, high, multiple),here are examples of neurons responding to all 16 vocal-zations and examples of neurons responding to one tohree vocalizations. In some neurons, spike rate variedreatly in response to the different vocalizations. For ex-mple, spike rates were often greatest to the two low-requency, multiharmonic vocalizations plotted at the top ofig. 3 and lowest to the four high frequency upsweeps
stimuli demonstrate selectivity in the IC. The gray-scale shows howdistributed population coding by neurons in the IC. The neurons aretion stimuli are ordered down the y-axis in ascending order based on(scale: abscissa, 0–200 ms; ordinate, 1–100 kHz). The responses
ntent higher than 45 kHz.
calizationealing avocaliza
lotted at the bottom of the figure.
apirrmsrrbfrdfowdts
cPswnl4woFtb
etnvanirn
ssavc
Fsvwr alizationt ose frequ
Fvm1w
C. V. Portfors et al. / Neuroscience 162 (2009) 486–500492
Third, each vocalization elicited a different pattern ofctivity across the sample of neurons. In examining theopulation response to one vocalization, neurons with sim-
lar CFs and similar tuning curve characteristics (i.e. neu-ons classified into the same category) showed differentesponses to one vocalization. The two low frequency,ultiharmonic vocalizations elicited the most similar re-
ponses from the sample of neurons. The majority of neu-ons responded to one or both of these vocalizations (seeesponses to top two vocalizations in Fig. 3) as expectedased on the spectral content of the vocalizations and therequency tuning curves of the neurons. However, spikeates for each of the low frequency vocalizations wereifferent for each neuron. The neural responses to the highrequency, upsweep vocalization plotted at the very bottomf Fig. 3 showed extremely high diversity. Even neuronsith similar frequency tuning characteristics respondedifferently to the same vocalization. Thus, each vocaliza-
ion activated a unique pattern of responses across theample of IC neurons.
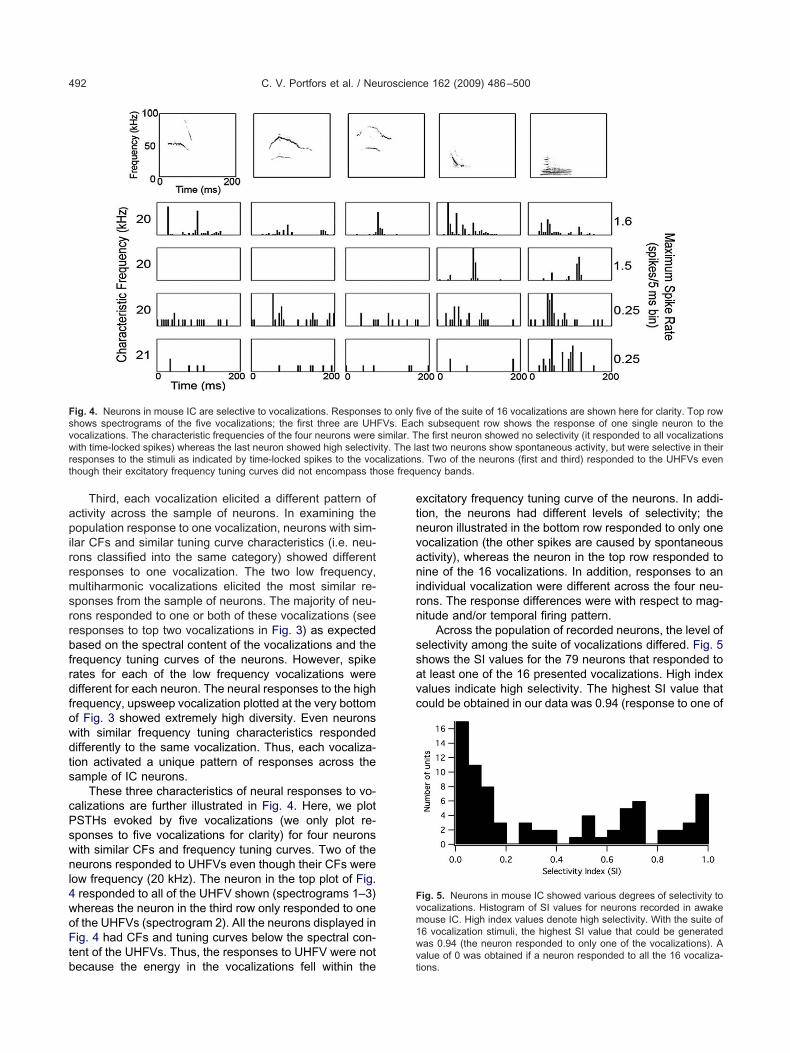
These three characteristics of neural responses to vo-alizations are further illustrated in Fig. 4. Here, we plotSTHs evoked by five vocalizations (we only plot re-ponses to five vocalizations for clarity) for four neuronsith similar CFs and frequency tuning curves. Two of theeurons responded to UHFVs even though their CFs were
ow frequency (20 kHz). The neuron in the top plot of Fig.responded to all of the UHFV shown (spectrograms 1–3)hereas the neuron in the third row only responded to onef the UHFVs (spectrogram 2). All the neurons displayed inig. 4 had CFs and tuning curves below the spectral con-
ent of the UHFVs. Thus, the responses to UHFV were not
ig. 4. Neurons in mouse IC are selective to vocalizations. Responseshows spectrograms of the five vocalizations; the first three are UHocalizations. The characteristic frequencies of the four neurons wereith time-locked spikes) whereas the last neuron showed high selectiv
esponses to the stimuli as indicated by time-locked spikes to the vochough their excitatory frequency tuning curves did not encompass th
ecause the energy in the vocalizations fell within thevt
xcitatory frequency tuning curve of the neurons. In addi-ion, the neurons had different levels of selectivity; theeuron illustrated in the bottom row responded to only oneocalization (the other spikes are caused by spontaneousctivity), whereas the neuron in the top row responded toine of the 16 vocalizations. In addition, responses to an
ndividual vocalization were different across the four neu-ons. The response differences were with respect to mag-itude and/or temporal firing pattern.
Across the population of recorded neurons, the level ofelectivity among the suite of vocalizations differed. Fig. 5hows the SI values for the 79 neurons that responded tot least one of the 16 presented vocalizations. High indexalues indicate high selectivity. The highest SI value thatould be obtained in our data was 0.94 (response to one of
ve of the suite of 16 vocalizations are shown here for clarity. Top rowh subsequent row shows the response of one single neuron to thehe first neuron showed no selectivity (it responded to all vocalizationsst two neurons show spontaneous activity, but were selective in their
s. Two of the neurons (first and third) responded to the UHFVs evenency bands.
ig. 5. Neurons in mouse IC showed various degrees of selectivity toocalizations. Histogram of SI values for neurons recorded in awakeouse IC. High index values denote high selectivity. With the suite of6 vocalization stimuli, the highest SI value that could be generatedas 0.94 (the neuron responded to only one of the vocalizations). A
to only fiFVs. Eacsimilar. Tity. The la
alue of 0 was obtained if a neuron responded to all the 16 vocaliza-ions.
tcjblf(
Nt
OtcvWgtfs
bftBanaWcneptmfidadfid6taddsdws(ptds
cppe
tle
tooBtfinptasairnmrbe
Cd
Hemstctant(eqndatsdtlrdrifc
Nr
SU
C. V. Portfors et al. / Neuroscience 162 (2009) 486–500 493
he 16 calls) and the lowest was 0 (responses to all 16alls). The mean (SD) SI value was 0.32 (0.30). The ma-ority of neurons responded to many vocalizations (SI�0.2)ut as Fig. 5 demonstrates, some IC neurons showed high
evels of selectivity among different vocalizations with aew neurons responding to only one to three vocalizationsSI�0.8).
eural responses to ultra-high frequency differenceones
ne possible mechanism for neurons with low frequencyuning curves to respond to complex signals with spectralontent outside their excitatory frequency tuning curve isia nonlinear distortion products generated in the cochlea.e tested 59 neurons for responses to difference tones
enerated by combinations of ultra-high frequencies. For-y-four neurons responded to some combination of tworequencies, and none of the neurons responded to eitherignal when presented individually.
Three examples of responses to difference tone com-inations are shown in Fig. 6. Each neuron’s excitatory
requency tuning curve is also illustrated to help to explainhe combination responses. In the first example (Fig. 6A,), the neuron was multiply-tuned with a CF of 10 kHz andsecond excitatory tuning curve around 58 kHz. The
euron responded to both the quadratic (F1–F2, F2–F1)nd cubic (2F2–F1, F2–2F1) distortion products (Fig. 6B).hen these differences were within the excitatory tuning
urve of the neuron, there was a vigorous spiking by theeuron. At other tone combinations, there was little or novoked response (some spontaneous activity was oftenresent). In addition, the response peaks were greatest forhe quadratic distortion product. This is consistent with theagnitude of distortion products generated by a nonlinear
lter. However, the cubic distortion product is known toominate in the otoacoustic emissions (Shera, 2004; Abelnd Kossl, 2009). In the mouse IC, we found strong qua-ratic dominance in many neural responses, as exempli-ed in Fig. 6D, where the response was only to the qua-ratic difference tones. In this case, the tuning curve (Fig.C) showed a weak response except at high intensities, sohat the weaker, cubic distortion products were, presum-bly, not strong enough to drive the neuron. Other neuronsisplayed responses where the cubic distortion productsominated as shown in Fig. 6F. Here, the reduced re-ponse to the quadratic differences, relative to the cubicifferences, can be explained by the “O-type” tuning curve,here there was a reduced response to the highest inten-ity stimuli when compared with lower stimulus intensitiesFig. 6E). A possible explanation is that the cubic distortionroducts (2F2–F1, F2–2F1) were strong enough to reachhe strongest part of the tuning curve, but the quadraticistortion products (F1–F2, F2–F1) were at a higher inten-ity, and generated a reduced response.
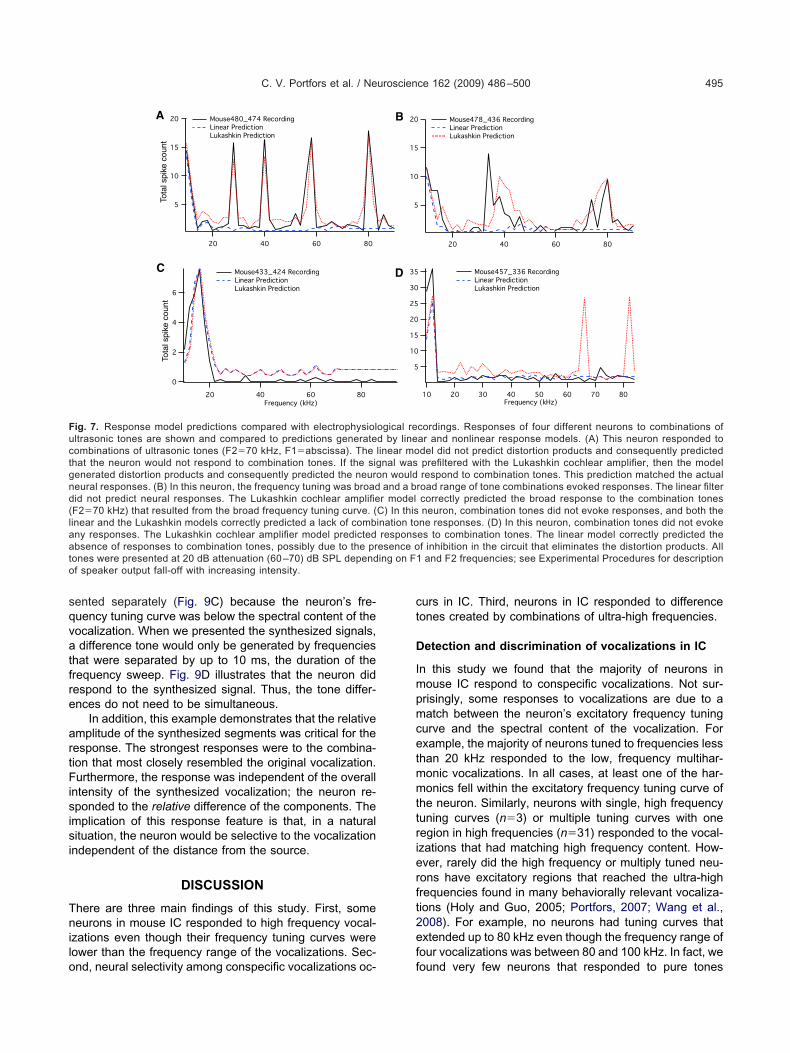
To determine whether the neural responses to theombinations of ultra-high frequency tones could be ex-lained by distortions generated in the cochlea, we com-ared responses predicted by a linear model using the
xcitatory frequency tuning curve and a nonlinear model of she cochlea that contains terms to account for intermodu-ation distortion (Lukashkin and Russell, 1998) with thempirical responses.
When the distortion products were taken into account,he frequency tuning curve generated by single tones wasften found to be a good predictor of the location and widthf combination-tone responses. As shown in Fig. 7A and, the prediction using the Lukashkin filter was similar to
he recorded neural responses. However, the Lukashkinlter improved the model predictions in less than half of theeurons tested (19/44). The relative improvement of therediction was measured by the relative difference betweenhe mean squared error between the predicted responsend the recorded response. Some neurons (5/44)howed no difference between the linear model predictionnd the nonlinear, Lukashkin model prediction, as shown
n the example in Fig. 7C. In a significant number of neu-ons (20/44), such as the example illustrated in Fig. 7D, theonlinear model’s prediction was worse than the linearodel. These neurons generally showed an absence of
esponses to the combination tones, as if the circuitryetween the cochlea and IC reduced or eliminated theffects of cochlear distortions.
omplex signals also generate responses toifference tones
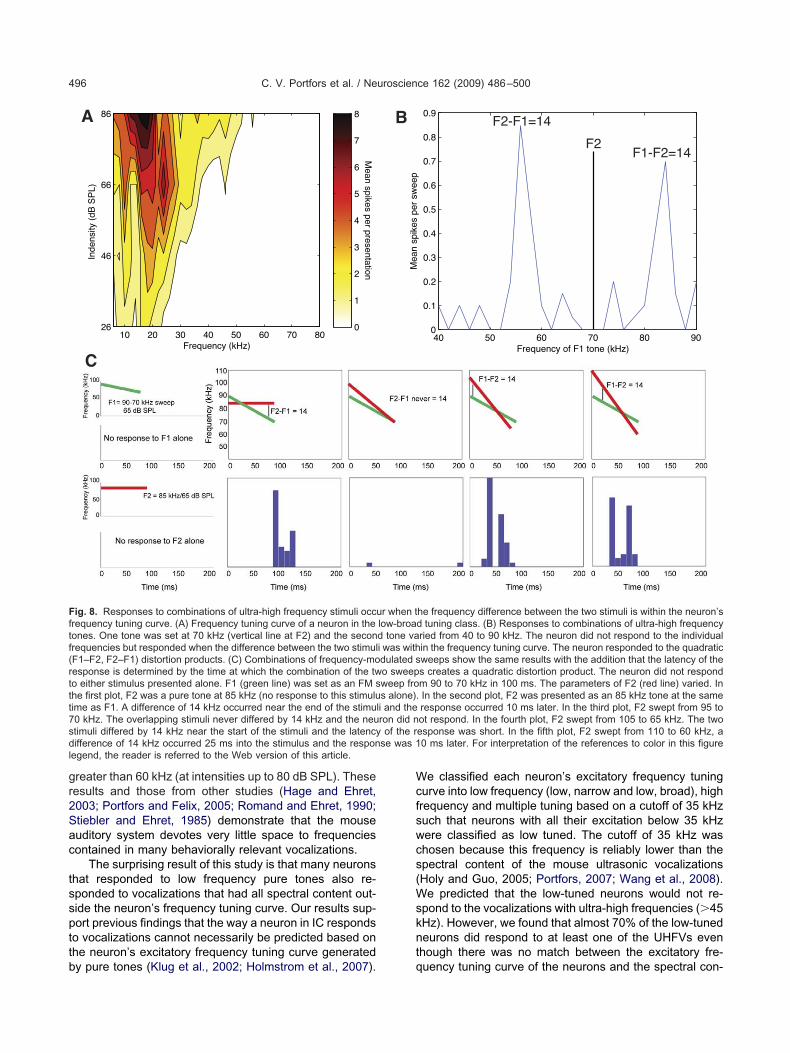
aving established that combinations of ultrasonic tonesvoked responses in IC neurons, we tested whether aore complex signal structure would also evoke re-
ponses when there was only a transient combination ofones with distortion products in the frequency tuningurves of the neurons. We combined frequency sweeps sohat the individual sweeps would not generate a response,s shown in Fig. 8. The frequency tuning class of thiseuron was low, broad tuning (Fig. 8A), and the combina-ion of a 70 kHz tone (F2) with either a 56 kHz toneF2–F1�14 kHz) or an 84 kHz tone (F1–F2�14 kHz)voked a response (Fig. 8B). We then synthesized a fre-uency down-sweep outside of the tuning curve of theeuron, starting at 90 kHz and ending at 70 kHz with auration of 100 ms (Fig. 8C). We combined the sweep withconstant tone at 85 kHz, and when the difference be-
ween the two signals reached 14 kHz, the neuron re-ponded with a latency of 20 ms. We next tested threeifferent sweep rates in combination with the 85 kHz pureone and a response was consistently evoked 20 ms fol-owing the time when the difference between the signalseached 14 kHz. For the trial where there was never aifference of 14 kHz, no response was evoked. Thus,esponses to complex sounds such as frequency sweepsn the IC can be explained by combinations of ultra-highrequencies that generate distortion products in the co-hlea.
on-simultaneous combination tones generateesponses in IC
ome responses of low-frequency tuned neurons toHFVs cannot be explained by combination of tones pre-
ented simultaneously. For example, the neuron in Fig. 9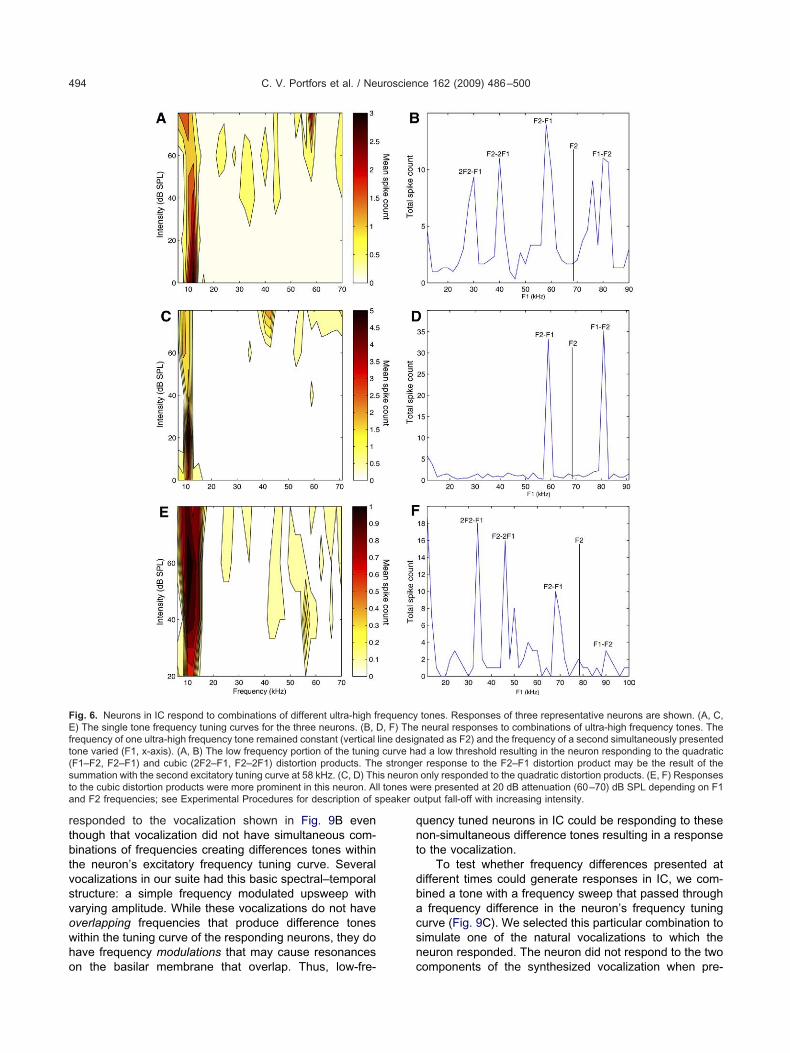
rtbtvsvowho
qnt
dbacsn
FEft(sta peaker o
C. V. Portfors et al. / Neuroscience 162 (2009) 486–500494
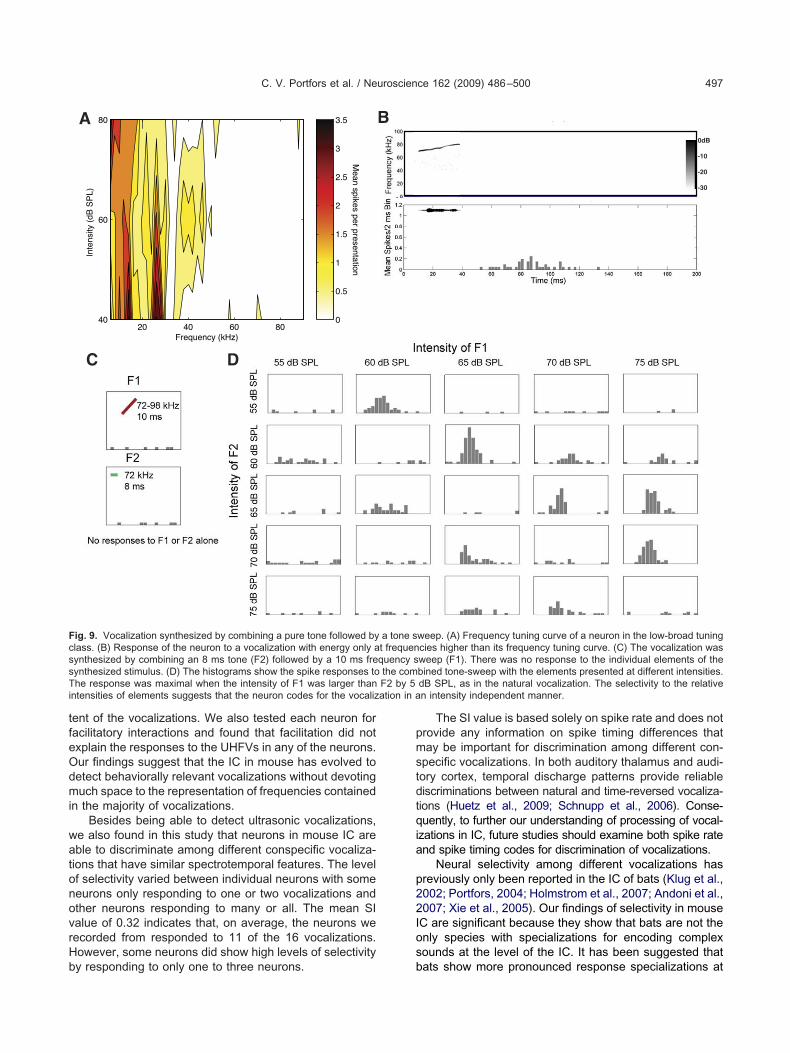
esponded to the vocalization shown in Fig. 9B evenhough that vocalization did not have simultaneous com-inations of frequencies creating differences tones withinhe neuron’s excitatory frequency tuning curve. Severalocalizations in our suite had this basic spectral–temporaltructure: a simple frequency modulated upsweep witharying amplitude. While these vocalizations do not haveverlapping frequencies that produce difference tonesithin the tuning curve of the responding neurons, they doave frequency modulations that may cause resonances
ig. 6. Neurons in IC respond to combinations of different ultra-high f) The single tone frequency tuning curves for the three neurons. (B, D
requency of one ultra-high frequency tone remained constant (verticalone varied (F1, x-axis). (A, B) The low frequency portion of the tuningF1–F2, F2–F1) and cubic (2F2–F1, F2–2F1) distortion products. Thummation with the second excitatory tuning curve at 58 kHz. (C, D) Tho the cubic distortion products were more prominent in this neuron. Alnd F2 frequencies; see Experimental Procedures for description of s
n the basilar membrane that overlap. Thus, low-fre- c
uency tuned neurons in IC could be responding to theseon-simultaneous difference tones resulting in a responseo the vocalization.
To test whether frequency differences presented atifferent times could generate responses in IC, we com-ined a tone with a frequency sweep that passed throughfrequency difference in the neuron’s frequency tuning
urve (Fig. 9C). We selected this particular combination toimulate one of the natural vocalizations to which theeuron responded. The neuron did not respond to the two
tones. Responses of three representative neurons are shown. (A, C,neural responses to combinations of ultra-high frequency tones. Thenated as F2) and the frequency of a second simultaneously presentedd a low threshold resulting in the neuron responding to the quadraticr response to the F2–F1 distortion product may be the result of theonly responded to the quadratic distortion products. (E, F) Responses
ere presented at 20 dB attenuation (60–70) dB SPL depending on F1utput fall-off with increasing intensity.
requency, F) The
line desigcurve ha
e strongeis neuronl tones w
omponents of the synthesized vocalization when pre-
sqvatfre
artFisisi
Tnilo
ct
D
Impmcetmmttrierft2ef
Fuctgnd(laato
C. V. Portfors et al. / Neuroscience 162 (2009) 486–500 495
ented separately (Fig. 9C) because the neuron’s fre-uency tuning curve was below the spectral content of theocalization. When we presented the synthesized signals,difference tone would only be generated by frequencies
hat were separated by up to 10 ms, the duration of therequency sweep. Fig. 9D illustrates that the neuron didespond to the synthesized signal. Thus, the tone differ-nces do not need to be simultaneous.
In addition, this example demonstrates that the relativemplitude of the synthesized segments was critical for theesponse. The strongest responses were to the combina-ion that most closely resembled the original vocalization.urthermore, the response was independent of the overall
ntensity of the synthesized vocalization; the neuron re-ponded to the relative difference of the components. Themplication of this response feature is that, in a naturalituation, the neuron would be selective to the vocalizationndependent of the distance from the source.
DISCUSSION
here are three main findings of this study. First, someeurons in mouse IC responded to high frequency vocal-
zations even though their frequency tuning curves wereower than the frequency range of the vocalizations. Sec-
A
C
Tota
l spi
ke c
ount
Tota
l spi
ke c
ount
ig. 7. Response model predictions compared with electrophysiolltrasonic tones are shown and compared to predictions generateombinations of ultrasonic tones (F2�70 kHz, F1�abscissa). Thehat the neuron would not respond to combination tones. If the sigenerated distortion products and consequently predicted the neuroeural responses. (B) In this neuron, the frequency tuning was broadid not predict neural responses. The Lukashkin cochlear amplifieF2�70 kHz) that resulted from the broad frequency tuning curve. (inear and the Lukashkin models correctly predicted a lack of combny responses. The Lukashkin cochlear amplifier model predictedbsence of responses to combination tones, possibly due to the pr
ones were presented at 20 dB attenuation (60 –70) dB SPL dependf speaker output fall-off with increasing intensity.
nd, neural selectivity among conspecific vocalizations oc- f
urs in IC. Third, neurons in IC responded to differenceones created by combinations of ultra-high frequencies.
etection and discrimination of vocalizations in IC
n this study we found that the majority of neurons inouse IC respond to conspecific vocalizations. Not sur-risingly, some responses to vocalizations are due to aatch between the neuron’s excitatory frequency tuning
urve and the spectral content of the vocalization. Forxample, the majority of neurons tuned to frequencies lesshan 20 kHz responded to the low, frequency multihar-onic vocalizations. In all cases, at least one of the har-onics fell within the excitatory frequency tuning curve of
he neuron. Similarly, neurons with single, high frequencyuning curves (n�3) or multiple tuning curves with oneegion in high frequencies (n�31) responded to the vocal-zations that had matching high frequency content. How-ver, rarely did the high frequency or multiply tuned neu-ons have excitatory regions that reached the ultra-highrequencies found in many behaviorally relevant vocaliza-ions (Holy and Guo, 2005; Portfors, 2007; Wang et al.,008). For example, no neurons had tuning curves thatxtended up to 80 kHz even though the frequency range ofour vocalizations was between 80 and 100 kHz. In fact, we
cordings. Responses of four different neurons to combinations ofar and nonlinear response models. (A) This neuron responded todel did not predict distortion products and consequently predictedprefiltered with the Lukashkin cochlear amplifier, then the modelrespond to combination tones. This prediction matched the actual
road range of tone combinations evoked responses. The linear filtercorrectly predicted the broad response to the combination tonesneuron, combination tones did not evoke responses, and both thene responses. (D) In this neuron, combination tones did not evokees to combination tones. The linear model correctly predicted thef inhibition in the circuit that eliminates the distortion products. Alland F2 frequencies; see Experimental Procedures for description
B
D
ogical red by linelinear monal wasn wouldand a br model
C) In thisination toresponsesence oing on F1
ound very few neurons that responded to pure tones
gr2Sac
tsspttb
Wcfswcs(Wsknt
Fftf(rttt7sdl
C. V. Portfors et al. / Neuroscience 162 (2009) 486–500496
reater than 60 kHz (at intensities up to 80 dB SPL). Theseesults and those from other studies (Hage and Ehret,003; Portfors and Felix, 2005; Romand and Ehret, 1990;tiebler and Ehret, 1985) demonstrate that the mouseuditory system devotes very little space to frequenciesontained in many behaviorally relevant vocalizations.
The surprising result of this study is that many neuronshat responded to low frequency pure tones also re-ponded to vocalizations that had all spectral content out-ide the neuron’s frequency tuning curve. Our results sup-ort previous findings that the way a neuron in IC respondso vocalizations cannot necessarily be predicted based onhe neuron’s excitatory frequency tuning curve generated
Frequency (kHz)
Inde
nsity
(dB
SP
L)
10 20 30 40 50 60 70 80
86
66
46
26
Mean spikes per presentation
0
1
2
3
4
5
6
7
8A
C
ig. 8. Responses to combinations of ultra-high frequency stimuli occrequency tuning curve. (A) Frequency tuning curve of a neuron in theones. One tone was set at 70 kHz (vertical line at F2) and the seconrequencies but responded when the difference between the two stimulF1–F2, F2–F1) distortion products. (C) Combinations of frequency-moesponse is determined by the time at which the combination of the two either stimulus presented alone. F1 (green line) was set as an FM she first plot, F2 was a pure tone at 85 kHz (no response to this stimuluime as F1. A difference of 14 kHz occurred near the end of the stimu0 kHz. The overlapping stimuli never differed by 14 kHz and the neutimuli differed by 14 kHz near the start of the stimuli and the latencyifference of 14 kHz occurred 25 ms into the stimulus and the respon
egend, the reader is referred to the Web version of this article.
y pure tones (Klug et al., 2002; Holmstrom et al., 2007). q
e classified each neuron’s excitatory frequency tuningurve into low frequency (low, narrow and low, broad), highrequency and multiple tuning based on a cutoff of 35 kHzuch that neurons with all their excitation below 35 kHzere classified as low tuned. The cutoff of 35 kHz washosen because this frequency is reliably lower than thepectral content of the mouse ultrasonic vocalizationsHoly and Guo, 2005; Portfors, 2007; Wang et al., 2008).
e predicted that the low-tuned neurons would not re-pond to the vocalizations with ultra-high frequencies (�45Hz). However, we found that almost 70% of the low-tunedeurons did respond to at least one of the UHFVs evenhough there was no match between the excitatory fre-
40 50 60 70 80 900
0.1
0.2
0.3
0.4
0.5
0.6
0.7
0.8
0.9
Frequency of F1 tone (kHz)
Mea
n sp
ikes
per
sw
eep
F2
F2-F1=14
F1-F2=14
he frequency difference between the two stimuli is within the neuron’sd tuning class. (B) Responses to combinations of ultra-high frequencyried from 40 to 90 kHz. The neuron did not respond to the individualin the frequency tuning curve. The neuron responded to the quadraticweeps show the same results with the addition that the latency of thes creates a quadratic distortion product. The neuron did not respondm 90 to 70 kHz in 100 ms. The parameters of F2 (red line) varied. InIn the second plot, F2 was presented as an 85 kHz tone at the sameresponse occurred 10 ms later. In the third plot, F2 swept from 95 toot respond. In the fourth plot, F2 swept from 105 to 65 kHz. The twoesponse was short. In the fifth plot, F2 swept from 110 to 60 kHz, a0 ms later. For interpretation of the references to color in this figure
B
ur when tlow-broad tone vai was withdulated so sweepweep fros alone).
li and theron did nof the r
se was 1
uency tuning curve of the neurons and the spectral con-
tfeOdmi
watonovrHb
pmstdtqia
p22Ios
FcssTi ation in a
C. V. Portfors et al. / Neuroscience 162 (2009) 486–500 497
ent of the vocalizations. We also tested each neuron foracilitatory interactions and found that facilitation did notxplain the responses to the UHFVs in any of the neurons.ur findings suggest that the IC in mouse has evolved toetect behaviorally relevant vocalizations without devotinguch space to the representation of frequencies contained
n the majority of vocalizations.Besides being able to detect ultrasonic vocalizations,
e also found in this study that neurons in mouse IC areble to discriminate among different conspecific vocaliza-ions that have similar spectrotemporal features. The levelf selectivity varied between individual neurons with someeurons only responding to one or two vocalizations andther neurons responding to many or all. The mean SIalue of 0.32 indicates that, on average, the neurons weecorded from responded to 11 of the 16 vocalizations.owever, some neurons did show high levels of selectivity
Frequency (kHz)
Inte
nsity
(dB
SP
L)
20 40 60 80
80
60
40
Mean spikes per presentation
0
0.5
1
1.5
2
2.5
3
3.5A
C D
ig. 9. Vocalization synthesized by combining a pure tone followed bylass. (B) Response of the neuron to a vocalization with energy only aynthesized by combining an 8 ms tone (F2) followed by a 10 ms freynthesized stimulus. (D) The histograms show the spike responses tohe response was maximal when the intensity of F1 was larger than
ntensities of elements suggests that the neuron codes for the vocaliz
y responding to only one to three neurons. b
The SI value is based solely on spike rate and does notrovide any information on spike timing differences thatay be important for discrimination among different con-
pecific vocalizations. In both auditory thalamus and audi-ory cortex, temporal discharge patterns provide reliableiscriminations between natural and time-reversed vocaliza-
ions (Huetz et al., 2009; Schnupp et al., 2006). Conse-uently, to further our understanding of processing of vocal-
zations in IC, future studies should examine both spike ratend spike timing codes for discrimination of vocalizations.
Neural selectivity among different vocalizations hasreviously only been reported in the IC of bats (Klug et al.,002; Portfors, 2004; Holmstrom et al., 2007; Andoni et al.,007; Xie et al., 2005). Our findings of selectivity in mouseC are significant because they show that bats are not thenly species with specializations for encoding complexounds at the level of the IC. It has been suggested that
0dB
-10
-20
-30
weep. (A) Frequency tuning curve of a neuron in the low-broad tuningcies higher than its frequency tuning curve. (C) The vocalization wasweep (F1). There was no response to the individual elements of thebined tone-sweep with the elements presented at different intensities.dB SPL, as in the natural vocalization. The selectivity to the relativen intensity independent manner.
B
a tone st frequenquency sthe comF2 by 5
ats show more pronounced response specializations at
skpRsaniv
C
TsmpstnrstntIpaIe
chmqucrb
Pt
TusvsXcb2saT2s2wtmp
vaqmvmHttejmarntftmr
btinlwpfnhorpts(sobaris
atttbcrciocpt
C. V. Portfors et al. / Neuroscience 162 (2009) 486–500498
ubcortical and primary cortical levels compared to mon-eys because primates have more auditory areas beyondrimary auditory cortex than non-primates (Kanwal andauschecker, 2007). Consequently, encoding of complexounds such as vocalizations is relegated to higher corticalreas in primates and subcortical and cortical areas inon-primates (Kanwal and Rauschecker, 2007). Our find-
ngs support this idea in that response specializations forocalizations appear in the IC of mice.
oding strategies
he finding that some neurons in the IC are selective topecific vocalizations reveals an important aspect of infor-ation coding in the midbrain. Complex sounds, and inarticular behaviorally relevant sounds, are not codedolely by neurons responding to simple frequency charac-eristics found in the signals. However, it is important toote that these neurons are not so selective that theyespond only to a single vocalization, but rather most re-pond to several vocalizations. A closer inspection of howhe responses are distributed over the population of ICeurons reveals a general coding principle. Each vocaliza-ion elicits a response from a different set of neurons in theC, and each neuron responds with a unique temporalattern to each vocalization. The population code leads tobroad array of spatial–temporal patterns of activity in the
C to natural stimuli, a pattern that would be unique forach vocalization.
Although a rich pattern of neural responses that en-ode a sound is not surprising, the surprising discoveryere is that the pattern of activity for vocalizations involvesany more neurons than one would expect from the fre-uency tuning characteristics of neurons found in the ICsing pure tones as stimuli. The encoding of natural vo-alizations is over-represented in the IC, leading to a moreefined encoding of subtle variations that are present inehaviorally relevant stimuli.
otential neural mechanisms underlying selectivityo vocalizations in IC
here are a number of potential mechanisms that maynderlie neural selectivity to vocalizations in the IC. Inome cases the selectivity of IC neurons to particularocalizations can be fully or partially explained by inhibitionurrounding the excitatory tuning curve (Klug et al., 2002;ie et al., 2005), inhibition far from the excitatory tuningurve (Holmstrom et al., 2007) or nonlinear facilitationetween multiple harmonics in the vocalization (Portfors,004). Although these mechanisms have all been de-cribed in bats, there is no reason to expect they are notlso important for encoding vocalizations in other species.he IC of mice exhibits lateral inhibition (Egorova et al.,001; Portfors and Felix, 2005) as well as combination-ensitive inhibition and facilitation (Portfors and Felix,005). Although we did not find that combination sensitivityas responsible for the responses to vocalizations ob-
ained in the current study, the reason may be in ourethodology. The role that combination sensitivity may
lay in creating selective responses in the IC of mice to tocalizations may be different than in bats because thecoustic characteristics of bat social vocalizations areuite different than mouse vocalizations. While both ani-als emit a rich repertoire of social vocalizations, bat
ocalizations tend to have richer harmonic structure thanouse vocalizations (Kanwal and Rauschecker, 2007;oly and Guo, 2005; Portfors, 2007). The harmonic struc-
ure means that facilitatory interactions often occur withwo overlapping signals (Portfors, 2004). However, consid-ring that many mouse vocalizations consist of frequency
umps, where frequencies can change 15–30 kHz in a fewilliseconds (Holy and Guo, 2005; Portfors, 2007; Wang etl., 2008), neurons that exhibit both frequency and tempo-al combination sensitivity would be an efficient mecha-ism for creating selectivity to particular vocalizations. Inhe current study we only tested for combination-sensitiveacilitation with overlapping tones. Thus, the extent thatemporal combination-sensitive responses in the IC ofice are important for neural responses to vocalizations
emains to be seen.The above mechanisms however, all rely on there
eing some match between the frequency tuning curve ofhe neuron and the spectral content of the response-elic-ting vocalization. Clearly this is not the case in many ICeurons in mouse. One possible means for neurons with
ow frequency tuning curves to respond to complex signalsith much higher frequencies is via nonlinear distortionroducts generated in the cochlea. The generation of dif-erence tones is a well-known phenomenon resulting fromonlinear distortion in the cochlea. Psychoacoustic studiesave shown the perceptibility of difference tones by humanbservers (Plomp, 1965). Moreover, auditory nerve fibersespond to 2F2–F1 distortion products even when the tworimary tones (F1 and F2) fail to generate a response inhe nerve (Goldstein and Kiang, 1968). Recent evidencehows that IC neurons respond to cochlear distortionsAbel and Kossl, 2009; McAlpine, 2004). In the currenttudy, we found that IC neurons respond to combinationsf ultrasonic frequencies; frequencies contained in manyehaviorally relevant vocalizations. Thus, the IC may takedvantage of these cochlear distortions to broaden theepresentation of ultrasonic vocalizations rather than elim-nating the distortions caused by transduction of auditoryignals.
One may have expected that the auditory system hasdapted to eliminate transduction distortions, such as in-ermodulation distortions, to encode an accurate image ofhe physical environment. However, there may be advan-ages in utilizing the effects of distortions to yield a broadand representation of natural sounds for more preciselassification. The distortions will generate activity in neu-ons that would otherwise not be sensitive to the frequencyontent of the complex sound. Thus, a population code
nvolving many more neurons than would be possible with-ut the distortions may be generated in IC for encodingomplex sounds. Moreover, our finding that distortionroducts are eliminated in some IC responses suggestshat additional sculpting of responses occurs (likely
hrough inhibition) such that the result is a rich population
ch
dmptainqtdtnet
ISenmirabufrsioasThd
Ata
A
A
B
C
C
D
E
E
F
G
H
H
H
H
H
K
K
L
L
M
M
M
M
N
P
P
P
P
P
P
C. V. Portfors et al. / Neuroscience 162 (2009) 486–500 499
oding of complex sounds in the IC, where each neuronas a unique response to each vocalization.
While we did not specifically demonstrate that cochlearistortions are utilized in the encoding of vocalizations inouse IC, we did show that IC neurons respond to com-lex synthesized signals that generate cochlear distor-ions. In addition, the frequencies that generate distortionsre not required to be simultaneous to generate responses
n low-frequency-tuned neurons (Fig. 9). The likely expla-ation of these results is that responses to different fre-uencies resonate in the cochlea for several millisecondso influence later frequencies rendering the combinationetectable to neurons that would otherwise not respond tohe individual tones. This responsiveness to non-simulta-eous combinations of frequencies leads to a considerablexpansion of the number of neurons in the IC that respondo behaviorally relevant vocalizations.
The findings of this study demonstrate that neurons inC are heterogeneous in their responses to vocalizations.ome neurons respond to all vocalizations that have en-rgy within the neuron’s frequency tuning curve, someeurons are selective to particular vocalizations due toechanisms such as inhibition and combination sensitiv-
ty, some may use cochlear distortions, and others may beesponding to other specific spectral and/or temporalcoustic features within vocalizations. All of these possi-ilities create difficulties in teasing out the mechanismsnderlying neural encoding of vocalizations. One means ofurther testing what acoustic features of vocalizations areesponsible for driving neural responses in IC is to synthe-ize the vocalizations and then systematically manipulatendividual spectral and temporal features to create variantsf the vocalizations. Neural responses to the specific vari-nts could then be compared to responses to the originalignals to reveal how neurons in IC encode vocalizations.hese types of results would further our understanding ofow behaviorally relevant sounds are encoded by the au-itory system.
cknowledgments—This work was supported in part by the Na-ional Science Foundation under grants IOS-0620560 to C.V.P.nd CRCNS IIS-0827722 to P.D.R.
REFERENCES
bel C, Kossl M (2009) Sensitive response to low frequency cochleardistortion products in the auditory midbrain. J Neurophysiol 101:1560–1574.
ndoni S, Li N, Pollak GD (2007) Spectrotemporal receptive fields inthe inferior colliculus revealing selectivity for spectral motion inconspecific vocalizations. J Neurosci 27(18):4882–4893.
runso-Bechtold JK, Thompson GC, Masterton RB (1981) HRP studyof the organization of auditory afferents ascending to central nu-cleus of inferior colliculus in cat. J Comp Neurol 197(4):705–722.
asseday J, Fremouw T, Covey E (2002) The inferior colliculus: a hubfor the central auditory system. In: Integrative functions in themammalian auditory pathway (Oertel D, Fay R, Popper A, eds), pp238–318. New York, NY: Springer Verlag.
asseday JH, Covey E (1996) A neuroethological theory of the oper-ation of the inferior colliculus. Brain Behav Evol 47(6):311–336.
’Amato F, Moles A (2001) Ultrasonic vocalizations as an index of
social memory in female mice. Behav Neurosci 115(4):834–840.gorova M, Ehret G, Vartanian I, Esser K-H (2001) Frequency re-sponse areas of neurons in the mouse inferior colliculus. I. Thresh-old and tuning characteristics. Exp Brain Res 140(2):145–161.
hret G (1974) Age-dependent hearing loss in normal hearing mice.Naturwissenschaften 61:506–507.
elix RA II, Portfors CV (2007) Excitatory, inhibitory and facilitatoryfrequency response areas in the inferior colliculus of hearing im-paired mice. Hear Res 228:212–229.
oldstein J, Kiang N (1968) Neural correlates of the aural combinationtone 2f1-f2. Proc IEEE 56(6):981–992.
age SR, Ehret G (2003) Mapping responses to frequency sweepsand tones in the inferior colliculus of house mice. Eur J Neurosci18(8):2301–2312.
olmstrom L, Roberts PD, Portfors CV (2007) Responses to socialvocalizations in the inferior colliculus of the mustached bat areinfluenced by secondary tuning curves. J Neurophysiol 98:3461–3472.
oly TE, Guo Z (2005) Ultrasonic songs of male mice. PLoS Biol3(12):E386.
ouseknecht C (1968) Sonographic analysis of vocalizations of threespecies of mice. J Mammal 49:555–560.
uetz C, Philibert B, Edeline J (2009) A spike-timing code for discrim-inating conspecific vocalizations in the thalamocortical system ofanesthetized and awake guinea pigs. J Neurosci 29(2):334.
anwal JS, Rauschecker JP (2007) Auditory cortex of bats and pri-mates: managing species-specific calls for social communication.Front Biosci 12:4621–4640.
lug A, Bauer EE, Hanson JT, Hurley L, Meitzen J, Pollak GD (2002)Response selectivity for species-specific calls in the inferior col-liculus of Mexican free-tailed bats is generated by inhibition. J Neu-rophysiol 88(4):1941–1954.
iu RC, Schreiner CE (2007) Auditory cortical detection and discrim-ination correlates with communicative significance. PLoS Biol5(7):e173.
ukashkin A, Russell I (1998) A descriptive model of the receptorpotential nonlinearities generated by the hair cell mechanoelectri-cal transducer. J Acoust Soc Am 103:973.
almierca MS (2005) The inferior colliculus: a center for convergenceof ascending and descending auditory information. NeuroembryolAging 22:215–229.
cAlpine D (2004) Neural sensitivity to periodicity in the inferior col-liculus: evidence for the role of cochlear distortions. J Neurophysiol92(3):1295–1311.
oles A, Costantini F, Garbugino L, Zanettini C, DAmato F (2007)Ultrasonic vocalizations emitted during dyadic interactions infemale mice: a possible index of sociability? Behav Brain Res182(2):223–230.
uller M, Hunerbein KV, Hoidis S, Smolders JW (2005) A physiolog-ical place-frequency map of the cochlea in the CBA/J mouse. HearRes 202(1–2):63–73.
uttall A, Dolan D (1993) Intermodulation distortion (F–F) in inner haircell and basilar membrane responses. J Acoust Soc Am 93:2061.
axinos G, Franklin K (2001) The mouse brain in stereotaxic coordi-nates, 2nd ed. San Diego, CA: Academic Press.
lomp R (1965) Detectability threshold for combination tones. JAcoust Soc Am 37:1110–1123.
omerantz S, Nunez A, Jay Bean N (1983) Female behavior is af-fected by male ultrasonic vocalizations in house mice. PhysiolBehav 31(1):91–96.
ortfors C (2004) Combination sensitivity and processing of communica-tion calls in the inferior colliculus of the moustached bat Pteronotusparnellii, Vol. 76, pp 253–257. Rio de Janeiro: Anais da AcademiaBrasileira de Cincias.
ortfors C, Felix R II (2005) Spectral integration in the inferior colliculusof the cba/caj mouse. Neuroscience 136(4):1159–1170.
ortfors CV (2007) Types and functions of ultrasonic vocalizationsin laboratory rats and mice. J Am Assoc Lab Anim Sci 46(1):
28 –34.
P
P
R
S
S
S
S
S
W
W
W
W
W
X
C. V. Portfors et al. / Neuroscience 162 (2009) 486–500500
ortfors CV, Roberts PD (2007) Temporal and frequency characteris-tics of cartwheel cells in the dorsal cochlear nucleus of the awakemouse. J Neurophysiol 98(2):744–756.
ortfors CV, Wenstrup JJ (1999) Delay-tuned neurons in the inferiorcolliculus of the mustached bat: implications for analyses of targetdistance. J Neurophysiol 82(3):1326–1338.
omand R, Ehret G (1990) Development of tonotopy in the inferiorcolliculus. I. Electrophysiological mapping in house mice. DevBrain Res 54:221–234.
chnupp JWH, Hall TM, Kokelaar RF, Ahmed B (2006) Plasticity oftemporal pattern codes for vocalization stimuli in primary auditorycortex. J Neurosci 26(18):4785–4795.
hera C (2004) Mechanisms of mammalian otoacoustic emission andtheir implications for the clinical utility of otoacoustic emissions. EarHear 25(2):86–97.
mith J (1975) Sound communication in rodents. Sym Zool Soc Lond37:317–333.
tiebler I, Ehret G (1985) Inferior colliculus of the house mouse. I. Aquantitative study of tonotopic organization, frequency represen-tation, and tone-threshold distribution. J Comput Neurosci 238:
65–76.tiebler I, Neulist R, Fichtel I, Ehret G (1997) The auditory cortex of thehouse mouse: left–right differences, tonotopic organization andquantitative analysis of frequency representation. J Comp Physiol181(6):559–571.
ang H, Liang S, Burgdorf J, Wess J, Yeomans J (2008) Ultrasonicvocalizations induced by sex and amphetamine in M2, M4, M5muscarinic and d2 dopamine receptor knockout mice. PLoS ONE3(4):e1893.
hitney G, Coble J, Stockton M, Tilson E (1973) Ultrasonic emissions:do they facilitate courtship in mice? J Comp Psychol 84:445–452.
illott J (2005) Hearing loss and the inferior colliculus. In: The inferiorcolliculus (Winer J, Schreiner C, eds), pp 585–682. New York, NY:Springer-Verlag.
illott JF (1986) Effects of aging, hearing loss, and anatomical loca-tion on thresholds of inferior colliculus neurons in c57bl/6 and cbamice. J Neurophysiol 56:391–408.
illott JF (1991) Central physiological correlates of ageing and pres-bycusis in mice. Acta Otolaryngol 476:153–156.
ie R, Meitzen J, Pollak GD (2005) Differing roles of inhibition in hierar-chical processing of species-specific calls in auditory brainstem nu-
clei. J Neurophysiol 94(6):4019–4037.(Accepted 22 April 2009)(Available online 3 May 2009)