Output Delivery System (ODS) Tips and...
91
Output Delivery System (ODS) Tips and Techniques A presentation by Kirk Paul Lafler
Transcript of Output Delivery System (ODS) Tips and...

Output Delivery System (ODS)
Tips and Techniques
A presentation by
Kirk Paul Lafler

Copyright © Software Intelligence Corporation, 1999-2015.
All rights reserved.
SAS is the registered trademark of SAS Institute Inc., Cary, NC, USA.
MS-Word and MS-Excel are the registered trademarks of Microsoft Corporation, Redmond, WA, USA.
All other company and product names mentioned are used for identification purposes only and may be trademarks of their respective owners.

Presentation Data Set


Traditional SAS Output
• Advantages familiar and automatic
easy to use
• Limitations monospace fonts used
single line rendered at a time
each procedure uses its own print routines
inconsistent use of formatting options
inability to control formatting
difficult to create HTML and XML output

ODS enables users to format output to mediums other than traditional line printers using monospace fonts. Although Version 9.3 offers a great many new and exciting capabilities, earlier versions do provide powerful features.
Using an Earlier Version than 9.3?

Format
Engines
Output Data Set
Rich Text Format (RTF)
MS-Excel®
HTML (default >=9.3)
Listing (default <= 9.2)
Data
XML
ODS
Output Formats / Destinations
MS-PowerPoint® (9.4)

The Data Component
The data component represents the actual Data produced from a procedure or DATA step. It has the following characteristics:
Consists of raw data created by the DATA step and ODS-supported procedures
Contains data values for each piece of output
Is void of format attributes

The Template Component
The template component provides the structure and format for output. A template is applied to the raw data in the data component. It has the following characteristics:
Describes how to render the raw data values in a data component
Includes column order, column headers, data formats, font sizes, and font types

The Output Object
An output object is a bundle of raw data and structure/format produced by an output producing step. As an integrated whole, the output object is sent to any and all open destinations. An output object:
Combines data and template components
Contains a name, label, and directory path
Data Component
Template Component
Output Object

Facts About ODS Destinations
The facts about ODS output destinations are:
The Listing destination is open by default
Objects are sent to open destinations
More than one destination can be open
Objects are sent to open destinations
Open destinations use system resources
Destinations don’t close automatically
Destinations should be closed when not needed

Deleting Output Results
Managing the Results window may require removing unwanted output. The following steps can be used to delete output:
Select the folder you want to remove
Select the Delete button on the task bar
Select “Yes” to confirm the deletion of the folder

Creating Output with ODS
Creating output with ODS is as easy as 1-2-3. Here’s how it’s done:
Step #1: Specify output destination(s)
Step #2: Determine what output is created
Step #3: Select desired output object(s)
Step #4: Create output
Step #5: Customize output as necessary


Identifying Output with TRACE
• The trace feature identifies output objects
• Contents of the trace results: name label Path template
• Specify ODS TRACE statement
• Syntax: ODS TRACE ON;
• Output is written to the SAS log
• When done, turn off trace feature with
ODS TRACE OFF;

Tracing Output
Learning the names of the multiple pieces of output generated by procedures is useful. To perform a trace of the individual output objects produced with the UNIVARIATE procedure, the following statement is issued:
ODS TRACE ON;
proc univariate data=SASUSER.movies;
run;
ODS TRACE OFF;

Tracing Output – Log Results
Output Added: Name: Moments Label: Moments Template: base.univariate.Moments Path: Univariate.Length.Moments Output Added: Name: BasicMeasures Label: Basic Measures of Location and Variability Template: base.univariate.Measures Path: Univariate.Length.BasicMeasures . . . . . . . . . . . . . . . Output Added: Name: ExtremeObs Label: Extreme Observations Template: base.univariate.ExtObs Path: Univariate.Length.ExtremeObs . . . . . . . . . . . . . . .


Exploring Selection Lists
Selection (or exclusion) lists:
are maintained for each ODS destination
are lists of output objects slated for a destination
determine whether an output object is sent to an ODS destination
should not be intermixed - do not create both type of lists --> prevents confusion
can be modified in one of two ways:
automatic modification
explicit modification

Selecting a Single Object
ods select Moments;
proc univariate data=SASUSER.movies; title1 ‘Moments Object Selected‘; run;
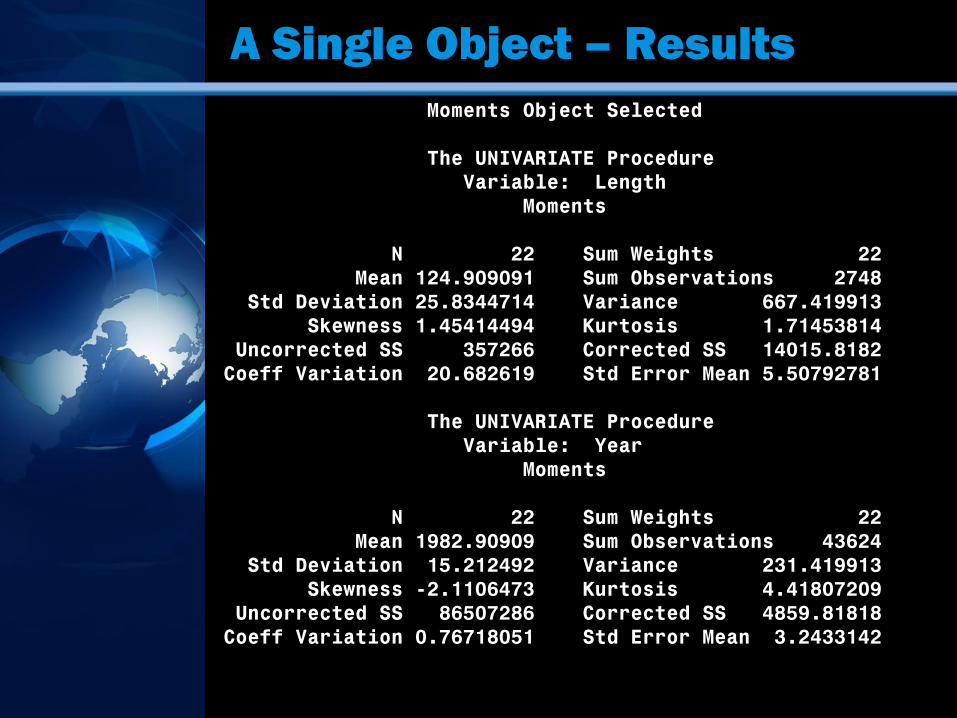
Moments Object Selected The UNIVARIATE Procedure Variable: Length Moments N 22 Sum Weights 22 Mean 124.909091 Sum Observations 2748 Std Deviation 25.8344714 Variance 667.419913 Skewness 1.45414494 Kurtosis 1.71453814 Uncorrected SS 357266 Corrected SS 14015.8182 Coeff Variation 20.682619 Std Error Mean 5.50792781 The UNIVARIATE Procedure Variable: Year Moments N 22 Sum Weights 22 Mean 1982.90909 Sum Observations 43624 Std Deviation 15.212492 Variance 231.419913 Skewness -2.1106473 Kurtosis 4.41807209 Uncorrected SS 86507286 Corrected SS 4859.81818 Coeff Variation 0.76718051 Std Error Mean 3.2433142
A Single Object – Results

Selecting Multiple Objects
ods select Moments ExtremeObs;
proc univariate data=SASUSER.movies; title1 ‘Multiple Objects Selected‘; run;

Moments Object Selected The UNIVARIATE Procedure Variable: Length Moments N 22 Sum Weights 22 Mean 124.909091 Sum Observations 2748 Std Deviation 25.8344714 Variance 667.419913 Skewness 1.45414494 Kurtosis 1.71453814 Uncorrected SS 357266 Corrected SS 14015.8182 Coeff Variation 20.682619 Std Error Mean 5.50792781 Extreme Observations ----Lowest---- ----Highest--- Value Obs Value Obs 97 3 135 19 98 13 142 7 101 21 170 16 103 2 177 1 105 6 194 22
Multiple Objects – Results

Multiple Destinations
ods Listing close; ods PDF file=‘c:\Moments.pdf’; ods PDF select Moments;
ods HTML body=‘c:\ExtremeObs.html’; ods HTML select ExtremeObs;
proc univariate data=SASUSER.movies; title1; run;
ods PDF close; ods HTML close; ods Listing;

Multiple Destinations – Results
Extreme Observations ----Lowest---- ----Highest--- Value Obs Value Obs 97 3 135 19 98 13 142 7 101 21 170 16 103 2 177 1 105 6 194 22


Sending Output to a Data Set
ods Listing close; ods Output Moments = my_moments;
User-defined Data set name
Turn off Listing output
Open Output data set destination
Output object name

Output to a Data Set
ods Listing close; ods Output Moments = my_moments;
proc univariate data=SASUSER.movies ; title1 ‘Moments Output to SAS Data Set‘ ; run ;
ods Output close; ods Listing;
proc print data=my_moments noobs; run;

Moments Output to SAS Data Set Var Name Label1 cValue1 nValue1 Label2 cValue2 nValue2 Length N 22 22.000000 Sum Weights 22 22.000000 Length Mean 124.909091 124.909091 Sum Observations 2748 2748.000000 Length Std Deviation 25.8344714 25.834471 Variance 667.419913 667.419913 Length Skewness 1.45414494 1.454145 Kurtosis 1.71453814 1.714538 Length Uncorrected SS 357266 357266 Corrected SS 14015.8182 14016 Length Coeff Variation 20.682619 20.682619 Std Error Mean 5.50792781 5.507928 Year N 22 22.000000 Sum Weights 22 22.000000 Year Mean 1982.90909 1982.909091 Sum Observations 43624 43624 Year Std Deviation 15.212492 15.212492 Variance 231.419913 231.419913 Year Skewness -2.1106473 -2.110647 Kurtosis 4.41807209 4.418072 Year Uncorrected SS 86507286 86507286 Corrected SS 4859.81818 4859.818182 Year Coeff Variation 0.76718051 0.767181 Std Error Mean 3.2433142 3.243314
Output to a Data Set – Results


Rich Text Format (RTF) Defined
• RTF is text and formatting attributes such as for boldface, italics, underline, color, etc.
• Encapsulates fonts and highlighting attributes when copying text
• Word processing programs use rich text instead of ASCII text
• SAS can cut and copy text in RTF format
• RTF text cannot be pasted into a SAS window

Creating RTF Syntax
The syntax used to create rich text format
(RTF) follows:
ODS RTF FILE = ‘user-file-name.rtf’;
where user-specified-file-name specifies a complete
and fully-qualified output location for the creation of
the RTF file.

Omitting the RTF Extension
If the .RTF extension is omitted when creating an rtf file with ODS, just add the extension in a Rename process after the file is created. Then access the file as usual with a click of your mouse.

Output to RTF
ods Listing close; ods RTF file=‘c:\univariate-moments.rtf’; ods select Moments;
proc univariate data=SASUSER.movies; title1 ‘Moments Output to RTF‘; run;
ods RTF close; ods Listing;

Output to RTF – Results

Customizing Page Numbers
Page numbers can be customized in RTF output by specifying an escape character with an ODS RTF statement and any or all of the following functions:
{thispage}
{lastpage}
{pageof}

Custom Page Numbers
ods Listing close; ods escapechar=‘^’; ods RTF file=‘c:\univariate-output.rtf’;
proc univariate data=SASUSER.movies; title 'Page ^{thispage} of ^{lastpage}'; footnote '^{pageof}'; run;
ods RTF close; ods Listing;

'Page ^{thispage} of ^{lastpage}'
'^{pageof}'
Custom Page Number – Results


PDF Output
• Enables output to be shared electronically
• Proprietary format created by Adobe
• Permits printed output to be seen or printed as intended
• Permits printer independence
• Output is viewed with “free” Adobe Reader software
• Example:
ODS PDF FILE=‘filename.PDF’;
Sharing Output with PDF
Adobe created a proprietary format called Portable Document Format (PDF) to share output electronically. The objective of PDF is to enable the printing of output exactly as it’s intended. PDF output is a great format for Web deployment since it is completely independent of any printer destination.

Bookmarks in PDF Output
• Bookmarks (or links to a particular printed page) can be created in a PDF file
• Displayed by Acrobat Reader as a table of contents
• Table of contents appear in a window to the left of primary PDF file
• To display bookmarks in Acrobat, select Show Bookmarks from the Windows pull-down window

Output to PDF
ods Listing close; ods PDF file=‘c:\univariate-output.PDF’;
proc univariate data=SASUSER.movies; title ‘Sending Output to PDF’; run;
ods PDF close; ods Listing;

Output to PDF – Results


Sending Data/Output to Excel
• Sending Data/Output to Excel
Data sets can be exported to Excel
Using the EXPORT procedure
Subsets of data can also be exported to Excel
• The Different Ways
Using SAS Display Manager (with a right-click)
Using Output Delivery System (ODS) • PROC steps
• DATA steps
Using the EXPORT procedure
Using a LIBNAME statement

Display Manager to XLS
SAS 9 permits the creation of an Excel file using SAS Display Manager. To create an Excel file, follow these steps:
Select the desired SAS data set
Right-click on the selected data set name
From the selection list, select ‘View in Excel’
Once data is transferred to Excel, save the Excel file to the desired location

PROC PRINT to XLS
SAS 9 permits the creation of an Excel file with ODS. For example, the XLS extension is specified in the file name of the ODS statement with PROC PRINT.
ods Listing close; ods HTML FILE=‘c:\Movies-PROCPRINT.XLS’; proc print data=SASUSER.movies noobs; title; run; ods HTML close; ods Listing;

PROC PRINT to XLS – Results

DATA Step to XLS
An Excel file can be created with ODS in a DATA step. For example, the XLS extension is specified in the file name of the ODS statement with the DATA step follows.
ods Listing close; ods HTML FILE=‘c:\Movies-DATAStep.XLS’; data _null_; set SASUSER.movies; file print ods; put _ods_; run; ods HTML close; ods Listing;

DATA Step to XLS – Results

PROC EXPORT to XLS
Exporting data to Excel with the EXPORT procedure is an effective way to transfer data. For example, exporting “Comedy” movies from the Movies data set to Excel with the PROC EXPORT statement and WHERE= data set option is illustrated:
PROC EXPORT DATA=SASUSER.movies (WHERE=(category="Comedy")) OUTFILE='c:\Movies-Export.xls' DBMS=EXCEL; RUN;

PROC EXPORT to XLS – Results

LIBNAME to XLS
Beginning in SAS 9, a LIBNAME statement can be used to export a data set to an Excel file. For example, to export the data in the Movies data set to an Excel 97 spreadsheet, the following LIBNAME statement is used:
LIBNAME MYXLS PCFILES PATH="c:\Movies-Libname.XLS"; DATA MYXLS.Movies; SET SASUSER.Movies; RUN;
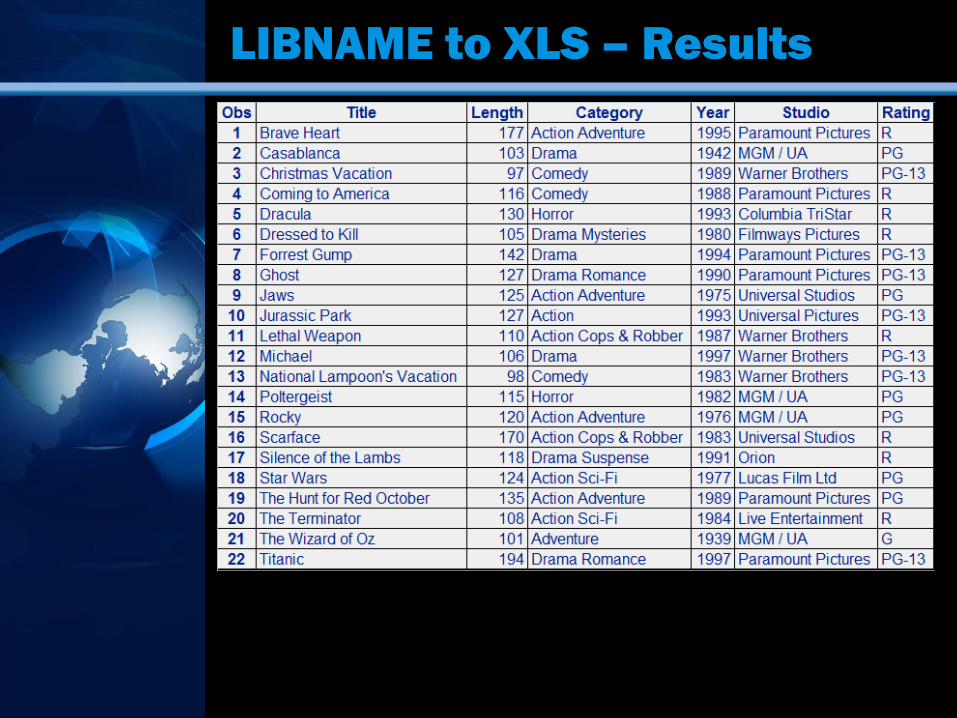
LIBNAME to XLS – Results


Steps to Creating HTML Output
Step 1: Specify HTML output destination
Step 2: Identify output object(s) using Trace
Step 3: Select output object(s) desired
Step 4: Create output with procedure step
Step 5: Deploy output to Internet, server, etc.
Step 6: Browse output with Web browser

ODS and HTML Output
• Syntactically-correct HTML code is created
• In SAS 8.2 and earlier versions and releases, ODS produces HTML 3.2 output
• In SAS 9: ODS produces HTML 4.01 tagset formatting
ODS HTML4 can be specified to request HTML 4.01 tagset formatting
ODS HTML3 can be specified to request HTML 3.2 tagset formatting
HTML-generated code can be browsed with web browser

PAGESIZE / LINESIZE Settings
PAGESIZE= (PS=) and LINESIZE= (LS=) option settings have no effect when used with the HTML destination (opposed to most other output-producing steps). If the PS= and/or LS= options are used with the HTML destination, they are simply ignored. The SAS System creates a type of “streaming” or continuous output and the Web browser adds elevator bars (horizontal and vertical), as necessary, for easy navigation.

HTML Files
• Created with ODS HTML statement
• 4 files may be created (Frame set):
Body (or File=) file (Required)
Contents file
Page file
Frame file

Viewing a Frame Set
Body File Contents File
Page File
Frame Set

ODS HTML Frame Syntax
The syntax used to create an HTML Frame set follows:
ods html body=‘filename-body.htm’
contents=‘filename-contents.htm’
page=‘filename-page.htm’
frame=‘filename-frame.htm’;
where file-names specifies complete output locations for the creation of HTML files.

Frame Set to HTML
ods Listing close; ods HTML body=‘c:\univariate-body.html’ contents=‘c:\univariate-contents.html’ page=‘c:\univariate-page.html’ frame=‘c:\univariate-frame.html’;
proc univariate data=SASUSER.movies; title1 ‘Frame Set to HTML'; title2 ‘Univariate Output’; run;
ods HTML close; ods Listing;

Frame Set to HTML – Results

Combining Output Results
With the streaming capabilities of HTML output, results can be combined so they appear on the same screen (or page). Rather than having output controlled by one or more page breaks, HTML automatically displays output without page boundaries.

Combining Output
ods HTML path=‘c:\’ body=‘Combined-output-body.html’ contents=‘Combined-output-contents.html’ page=‘Combined-output-page.html’ frame=‘Combined-output-frame.html’; proc print data=movies noobs n; title1 ‘Movie Classics Detail Listing’; where rating in (‘G’, ‘PG’); run;
proc means data=movies; title1 ‘Summary of Movie Classics’; class rating; run; ods HTML close;

Combining Output – Results

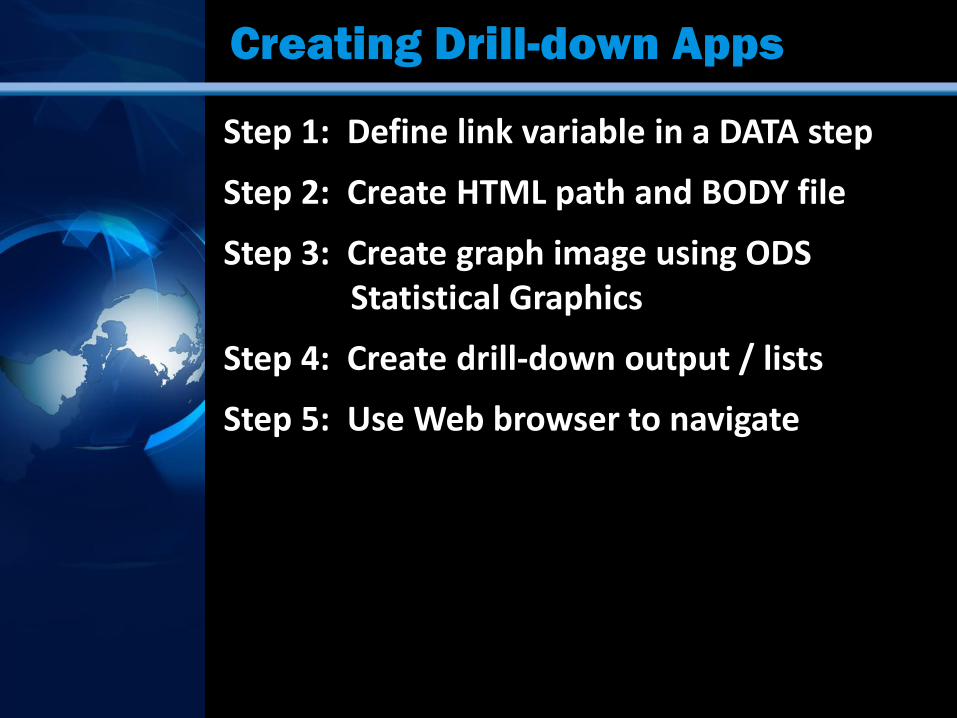
Creating Drill-down Apps
Step 1: Define link variable in a DATA step
Step 2: Create HTML path and BODY file
Step 3: Create graph image using ODS Statistical Graphics
Step 4: Create drill-down output / lists
Step 5: Use Web browser to navigate

BoxPlot Drill-down

BoxPlot Drill-down Output

BoxPlot Drill-down – Header *****************************************************************************************;
***** Program Name: Drill-down with PROC SGRENDER and BoxPlot.SAS *****;
***** Purpose.....: Create and display a simple drill-down dashboard using a DATA *****;
***** step and PROC SGPLOT with the ODS HTML destination. *****;
***** *****;
***** Author......: Kirk Paul Lafler, Software Intelligence Corporation *****;
***** Date Written: 02/11/2015 *****;
***** SAS Version.: SAS 9.2, 9.3, 9.4 *****;
***** Input Files.: Workshop Data *****;
***** Movies *****;
***** Output Files: HTML Output (6 Files) *****;
***** SGRender-BoxPlotBoxPlotDashboard.htm *****;
***** SGRender-BoxPlot-G-Rated-Movies.htm *****;
***** SGRender-BoxPlot-PG-Rated-Movies.htm *****;
***** SGRender-BoxPlot-PG13-Rated-Movies.htm *****;
***** SGRender-BoxPlot-PG17-Rated-Movies.htm *****;
***** SGRender-BoxPlot-R-Rated-Movies.htm *****;
***** Subroutines.: None *****;
***** User-defined Formats: None *****;
***** Macro Variables: None *****;
***** Includes....: None *****;
***** Modification History: *****;
***** 03/28/2015 KPL Added DROP= data set option to remove URLLINK and MAX *****;
***** from PROC PRINT routines. *****;
***** 02/15/2015 KPL Added Header information. *****;
*****************************************************************************************;
libname mydata 'e:\workshops\workshop data';

Step 1 – BoxPlot Drill-down
**************************************** ;
*Assign HTML Link to URLLINK Variable ;
**************************************** ;
data Classic_Movies;
length URLLINK $50;
max=200;
set mydata.movies;
if upcase(rating) = 'G' then
URLLINK='e:\BoxPlot-G-Movies.htm';
else
if upcase(rating) = 'PG' then
URLLINK='e:\BoxPlot-PG-Movies.htm';
else
if upcase(rating) = 'PG-13' then
URLLINK='e:\BoxPlot-PG13-Movies.htm';
else
if upcase(rating) = 'PG-17' then
URLLINK='e:\BoxPlot-PG17-Movies.htm';
else
if upcase(rating) = 'R' then
URLLINK='e:\BoxPlot-R-Movies.htm';
run;

Step 2 – BoxPlot Drill-down
********************************************************* ;
*Create BoxPlotSGPanelDashboard Template Overlay with ;
*PROC TEMPLATE. ;
********************************************************* ;
proc template ;
define statgraph BoxPlotSGPanelDashboard ;
begingraph ;
layout overlay ;
boxplot x=rating y=length ;
barchart x=rating y=max /
url=urllink datatransparency=0.8
stat=mean ;
endlayout ;
endgraph ;
end ;
Run ;

Step 3 – BoxPlot Drill-down
******************************************************** ;
*Create Graphical Output from BoxPlotSGPanel Template ;
*using PROC SGRENDER. ;
******************************************************** ;
ods html file='BoxPlot-Dashboard.htm' path='e:\';
ods graphics / reset imagemap=on
width=7in height=5in
imagename='BoxPlotSGPanelDashboard';
proc sgrender data=Classic_Movies template=BoxPlot;
run;
ods html close;

Step 4 – BoxPlot Drill-down
********************************************************** ;
*Create Drill-down Output for Each Rating Group with ***** ;
*PROC PRINT. ***** ;
********************************************************** ;
ODS html body="BoxPlot-G-Rated-Movies.htm" path='e:\';
PROC PRINT DATA=classic_movies(DROP=URLLINK MAX) NOOBS N ;
TITLE "G-rated Movies" ;
WHERE UPCASE(rating) = "G" ;
RUN ;
ODS html close ;
. . . . . . . . . . . .
ODS html body="BoxPlot-R-Rated-Movies.htm" path='e:\';
PROC PRINT DATA=classic_movies(DROP=URLLINK MAX) NOOBS N ;
TITLE "R-rated Movies" ;
WHERE UPCASE(rating) = "R" ;
RUN ;
ODS html close ;
ODS html ;

Pie Chart / Bar Chart Drill-down

Pie Chart Drill-down Output

Bar Chart Drill-down Output

Pie / Bar Drill-down – Header ****************************************************************************************;
***** Program Name: 2-Cell Drill-down, PROC SGRENDER, Pie and Bar Chart #2.SAS *****;
***** Purpose.....: Create and display a simple drill-down dashboard with two *****;
***** categorical variables using a DATA step, PROC TEMPLATE, Pie, *****;
***** Bar Chart, and PROC SGRENDER with the ODS HTML destination. *****;
***** *****;
***** Author......: Kirk Paul Lafler, Software Intelligence Corporation *****;
***** Date Written: 03/28/2015 *****;
***** SAS Version.: SAS 9.2, 9.3, 9.4 *****;
***** Input Files.: Workshop Data *****;
***** Movies *****;
***** Output Files: HTML Output (17 Files) *****;
***** PieChart-BarChart-Dashboard.htm (Qty 1) *****;
***** PieChart-Rating-Movies.htm (Qty 5) *****;
***** BarChart-Category-Movies.htm (Qty 11) *****;
***** Subroutines.: None *****;
***** User-defined Formats: None *****;
***** Macro Variables: None *****;
***** Includes....: None *****;
***** Modification History: *****;
***** 03/28/2015 KPL Added Header information. *****;
****************************************************************************************;
libname mydata 'e:\workshops\workshop data';

Step 1a – Pie Chart Drill-down
*********************************************;
* Assign PieChart URL= to URLRATING Variable ;
*********************************************;
data Classic_Movies;
length URLRATING URLCATEGORY $60;
max=200;
set mydata.movies;
if upcase(rating) = 'G’ then
URLRATING='e:\PieChart-G-Movies.htm';
else
if upcase(rating) = 'PG’ then
URLRATING='e:\PieChart-PG-Movies.htm';
else
if upcase(rating) = 'PG-13’ then
URLRATING='e:\PieChart-PG13-Movies.htm';
else
if upcase(rating) = 'R’ then
URLRATING='e:\PieChart-R-Movies.htm';
. . . . . . . . . . . .

Step 1b – Bar Chart Drill-down
***********************************************;
* Assign BarChart URL= to URLCATEGORY Variable ;
***********************************************;
if upcase(category) = 'ACTION’ then
URLCATEGORY='e:\BarChart-Action-Movies.htm';
else
if upcase(category) = 'ACTION ADVENTURE’ then
URLCATEGORY='e:\BarChart-ActionAdv-Movies.htm';
else
. . . . . . . . . . . .
else
if upcase(category) = 'DRAMA SUSPENSE’ then
URLCATEGORY='e:\BarChart-DramaSuspense-Movies.htm';
else
if upcase(category) = 'HORROR’ then
URLCATEGORY='e:\BarChart-Horror-Movies.htm';
run;

Step 2 – Pie / Bar Template
* Create PieChart / BarChart Template Overlay with PROC TEMPLATE ;
proc template ;
define statgraph PieChartBarChartDashboard ;
begingraph ;
entrytitle "Drill-down PieChart/BarChart Dashboard" ;
layout gridded / columns=1 ;
layout lattice / columns=2 ;
cell ;
layout region ;
piechart category=Rating /
url=URLRATING dataskin=crisp datatransparency=0.3 ;
endlayout ;
endcell ;
cell ;
layout overlay / width=250px
xaxisopts=(display=(label tickvalues line)) ;
barchart x=Category y=length /
url=URLCATEGORY dataskin=crisp datatransparency=0.3
orient=vertical barwidth=0.8 ;
endlayout ;
endcell ;
endlayout ;
endlayout ;
endgraph ;
end ;
run ;
quit ;

Step 3 – Produce Graphics
**************************************************;
* Produce Graphical Output from PieChart BarChart ;
* Template using PROC SGRENDER ;
**************************************************;
ods html file='SGRender-PieChart-BarChart-Dashboard.htm’
path='e:\' ;
ods graphics / reset imagemap=on width=8in height=5in
imagename='PieChartBarChart-Dashboard' ;
title1 "PieChart/BarChart of Movies Data" ;
title2 "Movie Ratings/Categories" ;
proc sgrender data=Classic_Movies
template=PieChartBarChartDashboard ;
run ;
quit ;
title ;
ods html close ;

Step 4a – PieChart Drill-down
*****************************************************;
* Create Pie Chart Drill-down Output for Each Rating ;
* Group with PROC PRINT ;
*****************************************************;
ODS html body="PieChart-G-Movies.htm" path='e:\';
PROC PRINT DATA=classic_movies(DROP=URLRATING URLCATEGORY MAX)
NOOBS N ;
TITLE "G-rated Movies" ;
WHERE UPCASE(rating) = "G" ;
RUN ;
ODS html close ;
. . . . . . . . . . . .
ODS html body="PieChart-R-Movies.htm" path='e:\';
PROC PRINT DATA=classic_movies(DROP=URLRATING URLCATEGORY MAX)
NOOBS N ;
TITLE "R-rated Movies" ;
WHERE UPCASE(rating) = "R" ;
RUN ;
ODS html close ;

Step 4b – BarChart Drill-down
*************************************************************;
* Create Bar Chart Drill-down Output for Each Category Group ;
* with PROC PRINT. ;
*************************************************************;
ODS html body="BarChart-Action-Movies.htm” path='e:\';
PROC PRINT DATA=classic_movies(DROP=URLRATING URLCATEGORY MAX)
NOOBS N ;
TITLE "Action Movies" ;
WHERE UPCASE(category) = "ACTION" ;
RUN ;
ODS html close ;
. . . . . . . . . . . .
ODS html body=“BarChart-Horror-Movies.htm” path='e:\';
PROC PRINT DATA=classic_movies(DROP=URLRATING URLCATEGORY MAX)
NOOBS N ;
TITLE "Horror Movies" ;
WHERE UPCASE(category) = "HORROR" ;
RUN ;
ODS html close ;

Testing Web Output
Before transferring your Web files to a server, users should thoroughly test any HTML code to make sure it is problem-free. Many viewers will not return to Web pages that contain errors or do not work according to design. Caution: Not all Web browser software handles web pages the same way. Microsoft Internet Explorer may display a web page differently than Netscape Navigator , Mozilla Firefox, Google Chrome, and others.

Conclusion
This presentation has introduced simple and useful techniques for using the SAS® Output Delivery System (ODS). Key topics included:
Opening and closing output destinations
Selecting and excluding objects
Sending output to SAS data sets
Creating RTF and PDF output
Sending Data/Output to Excel spreadsheet files
Creating Web output with the HTML destination
Creating drill-down applications with ODS Statistical Graphics
An SQL Book
with “behind the
scenes” details,
explanations and
lots of examples
Coming Winter 2004! Available from SAS Press on www.SAS.com
Kirk Paul Lafler
Kirk Paul Lafler
PROC SQL Beyond the Basics
Using SAS Second Edition

Available on Amazon.com
Become a Search Pro!
A Comprehensive
Book of
Tips and Techniques
for Better Searches
and Better Results

Kirk Paul Lafler Senior SAS® Consultant, Application Developer, Data Scientist, Trainer, and Author
Questions?
Thank you for attending!


![ODSチュートリアルの紹介 - SAS...ODSチュートリアルの紹介 SAS Output Delivery System[ODS] Quick Tips Sunday,May 7,2000 8:30-12:00 三共株式会社 高野浩布](https://static.fdocuments.net/doc/165x107/5e68875fd47e8117a3572add/odsffffffc-odsffffffc-sas-output.jpg)