Outlook on Timber Prices and End-use Markets · Outlook on Timber Prices and End-use Markets ......
40
Outlook on Timber Prices and End-use Markets Bob Flynn, Director, International Timber Timber Invest Europe Conference, London, October 23, 2012
-
Upload
duonghuong -
Category
Documents
-
view
223 -
download
1
Transcript of Outlook on Timber Prices and End-use Markets · Outlook on Timber Prices and End-use Markets ......

Outlook on Timber Prices and End-use Markets
Bob Flynn, Director, International Timber
Timber Invest Europe Conference,
London, October 23, 2012

RISI Timber
Teams of Economists,
Analysts and Editors in
Local Offices
Living In, Working In and
Knowing Every Region
A Global Perspective That
Understands Regional Impact
Regional Expertise with a Global Perspective
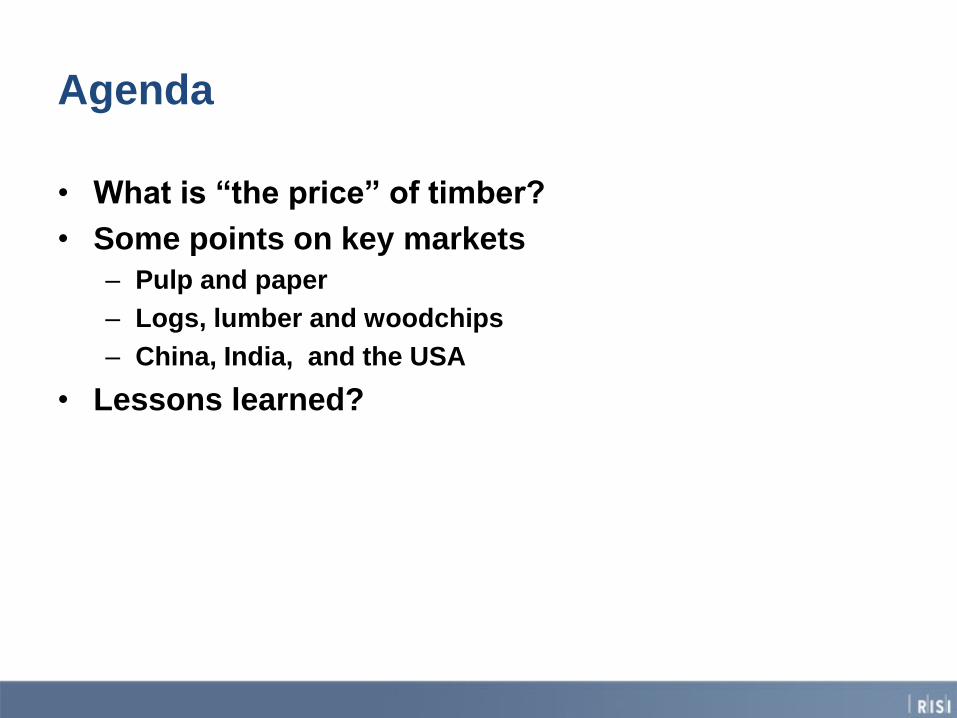
Agenda
• What is “the price” of timber?
• Some points on key markets
– Pulp and paper
– Logs, lumber and woodchips
– China, India, and the USA
• Lessons learned?

Wood is a fantastic material, but its
incredible diversity of uses makes it
difficult to outline the key demand drivers • Wood can be used for:
– Building your house
– Printing your newspaper or textbooks
– Packaging products ranging from industrial equipment to food
– Making your clothes
– Producing furniture for you to sit on, or floors to walk on
– Making a gazebo or fence for your backyard
– Producing biofuels to run your car, biomass power to light your
city, or thermal heat to warm your house
– Make an incredibly wide range of specialty chemicals
– Produce tissue products for numerous uses
• The point is, to understand the drivers of timber
prices you have to know the target market.

Timber prices also depend on your location:
the same product can have wildly different
price trends in different markets
20
25
30
35
40
45
50
55
60
06
-Q1
06
-Q2
06
-Q3
06
-Q4
07
-Q1
07
-Q2
07
-Q3
07
-Q4
08
-Q1
08
-Q2
08
-Q3
08
-Q4
09
-Q1
09
-Q2
09
-Q3
09
-Q4
10
-Q1
10
-Q2
10
-Q3
10
-Q4
11
-Q1
11
-Q2
11
-Q3
11
-Q4
12
-Q1
US$
pe
r C
ub
ic M
ete
r
Pine Pulpwood Prices
US South
Sweden
Source: World
Timber Price
Quarterly, RISI,
2012

$200
$250
$300
$350
$400
$450
$500
$550
$600
$650
$700
2006 2007 2008 2009 2010 2011 2012
West Coast (Doug-Fir #2)
West Coast (White Woods #2)
South (Pine)*
Inland West (White Woods)
*Assumes 7.5 short tons per MBF.
(Delivered Sawtimber Prices Compared, $/MBF, Scrib., qtrly)
Even within the same country prices for softwood logs can be moving in different directions, e.g. record lows in US South, sharp revival in PNW
Source:
North
American
Timber
Forecast,
RISI, 2012

In general, timber raw material is bulky and
cannot be transported far to market without
first adding value….however---
Wood pellets
FSC eucalyptus logs
Teak logs
Woodchips

Know your woodfiber – what products
can you make, at a competitive cost?
100
120
140
160
180
200
220
240
2006 2007 2008 2009 2010 2011
US$
pe
r B
DM
T
CIF Prices for Eucalyptus Woodchip Imports in Japan
Chile
Thailand
Source: International Pulpwood Trade Review, RISI, 2012

“Global” trends and conventional
wisdom can be misleading
4,000
5,000
6,000
7,000
8,000
9,000
Th
ou
sa
nd
To
nn
es
USA: Imports and Exports of Wood Pulp
Imports Exports
European power
producers understood
that, in general, pulp
production was shifting
from northern hemisphere
to large, new pulp
production facilities in
Brazil, Indonesia, etc.,
which would mean that
closure of pulp facilities in
the US South would free
up millions of tonnes of
wood for biomass exports
to Europe. For hardwood
(short fiber) pulp this is
largely true.
But for softwood (long-fiber) pulp, US
producers are among the most competitive
in the world, with exports reaching record
levels in 2011
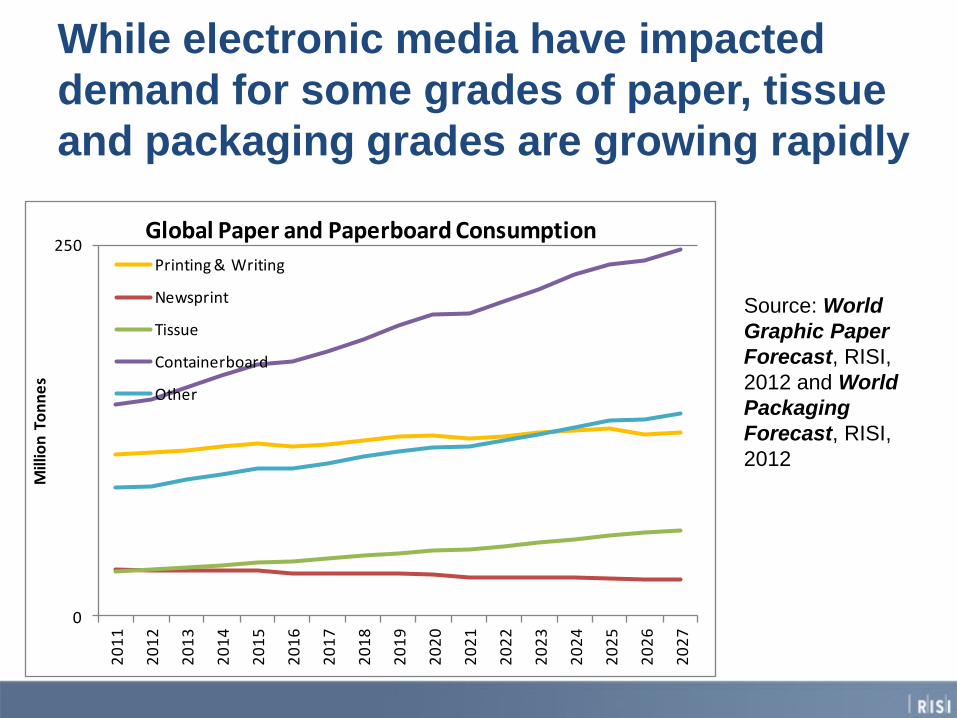
While electronic media have impacted
demand for some grades of paper, tissue
and packaging grades are growing rapidly
0
250
20
11
20
12
20
13
20
14
20
15
20
16
20
17
20
18
20
19
20
20
20
21
20
22
20
23
20
24
20
25
20
26
20
27
Mill
ion
To
nn
es
Global Paper and Paperboard Consumption
Printing & Writing
Newsprint
Tissue
Containerboard
Other
Source: World
Graphic Paper
Forecast, RISI,
2012 and World
Packaging
Forecast, RISI,
2012
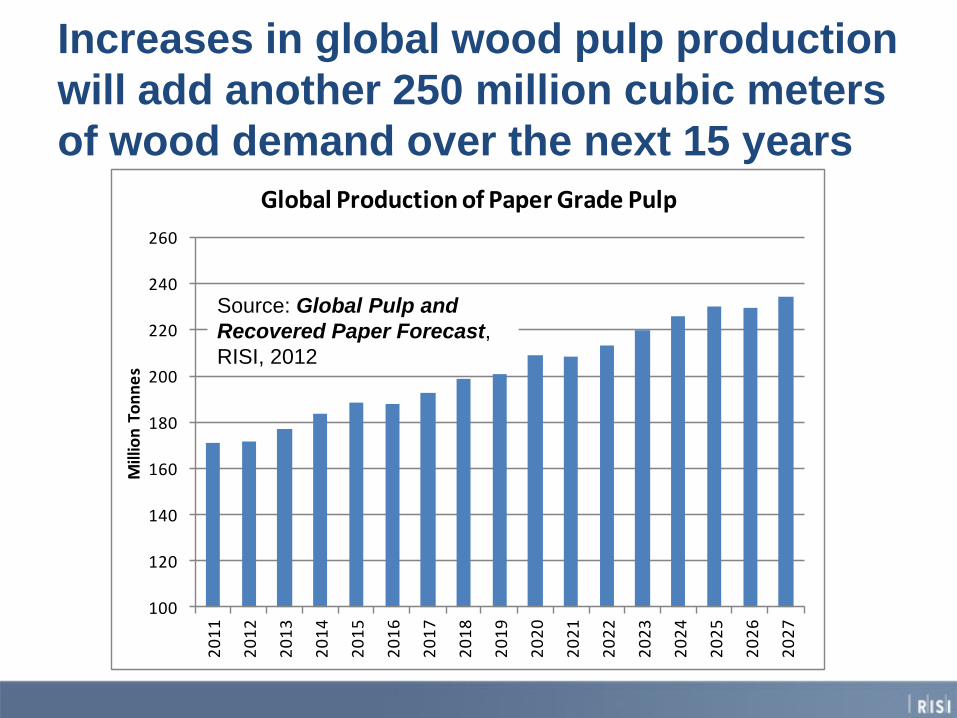
Increases in global wood pulp production
will add another 250 million cubic meters
of wood demand over the next 15 years
100
120
140
160
180
200
220
240
260
20
11
20
12
20
13
20
14
20
15
20
16
20
17
20
18
20
19
20
20
20
21
20
22
20
23
20
24
20
25
20
26
20
27
Mill
ion
To
nn
es
Global Production of Paper Grade Pulp
Source: Global Pulp and
Recovered Paper Forecast,
RISI, 2012

The location of new pulp production is highly
variable, & does not necessarily correspond with
the location of wood resources or pulp demand
0
10
20
30
40
50
60
Mill
ion
To
nn
es
Wood Pulp Production Forecast, 2011-2027
2011 2027

Japan is the biggest woodchip market, but it is
increasing Chinese imports that are pushing the
hardwood chip trade in Asia to record levels
0
4
8
12
16
20
24
2006 2007 2008 2009 2010 2011 2012E 2013F 2014F
Mill
ion
BD
MT
Asian Hardwood Chip Imports, 2006-2014F
Korea Taiwan
China Japan

Woodchip imports will hit another all-time high
in 2012, but only 10% is softwood and that
share has been shrinking
0
3,000
6,000
9,000
12,000
15,000
18,000
21,000
19
91
19
92
19
93
19
94
19
95
19
96
19
97
19
98
19
99
20
00
20
01
20
02
20
03
20
04
20
05
20
06
20
07
20
08
20
09
20
10
20
11
20
12
E
Tho
usa
nd
BD
MT
Asian Woodchip Imports, 1991-2012E
Softwood Hardwood
Source:
International
Pulpwood
Trade
Review,
RISI, 2012

China’s timber deficit grew at nearly 17%
CAGR from 1997-2011, but has slowed to only
4.1% through the first 8 months of 2012
0
20
40
60
80
100
120
140
160
180
97 98 99 00 01 02 03 04 05 06 07 08 09 10 11 12E
Millio
n C
ub
ic M
ete
rs, R
WE
China's Growing Timber Deficit, 1997 - 2012E
Woodchips
Pulp
Wood Panels
Lumber
Logs
Source: China
Timber Supply
Outlook, RISI,
2011

China’s demand for imported woodfiber
is equal to 10% of TOTAL world industrial
roundwood production
0
20
40
60
80
100
120
140
160
China USA Germany India
Mill
ion
Cu
bic
Me
ters
2011 Woodfiber Import Demand for Primary Products

Market shares can shift over time due to
government policies, changes in ocean freight
rates, Fx rates, available wood supplies, etc
0
2
4
6
8
10
12
14
16
Russia N Zealand USA Canada Australia Other
Mill
ion
Cu
bic
Me
ters
China Softwood Log Imports, January-Aug
2007 2011 2012

In the past, almost all of Canada’s lumber exports
went to the USA, but with that market in a deep
depression, producers found an outlet in China
0
0.5
1
1.5
2
2.5
3
3.5
4
4.5
5
Canada Russia USA Chile N Zealand Other
Mill
ion
Cu
bic
Me
ters
China Imports of Softwood Lumber, January-Aug
2007 2011 2012

Why are European producers the leading
suppliers of softwood lumber to Japan, but
have only a tiny share of the Chinese market?
0%
5%
10%
15%
20%
25%
30%
35%
40%
2000 2001 2002 2003 2004 2005 2006 2007 2008 2009 2010 2011
Shar
e o
f Lu
mb
er
Imp
ort
s
European Share of Asian Softwood Lumber Market
Japan
China

China’s log and lumber imports: rebound likely
in 2013-2014
• China’s domestic softwood timber harvest is
constrained due to past over-harvesting and mandated
timber harvest reductions in softwood timber regions.
• Economic and construction activity mostly treading
water until new leadership takes over at year's end.
• Despite past over-building in some regions, economic
stimulus in 2013 is likely to provide a boost to housing
and other construction activity, requiring greater
imports of softwood logs and lumber.
• Despite much lower sawmilling costs in China, lumber
is likely to maintain or slightly increase its share of
softwood log and lumber imports to about 50% by
2014.

Much slower economic growth in India has
also slowed demand for logs in India in 2012
0
300
600
900
1200
1500
1800
19
99
20
00
20
01
20
02
20
03
20
04
20
05
20
06
20
07
20
08
20
09
20
10
20
11
20
12
E
Th
ou
sa
nd
Cu
bic
Me
ters
India: Imports of Softwood Logs by Source, 1999 - 2012E
Other Australia New Zealand

India’s economy in 2011 was the same size as
China’s in 2002….but its timber deficit was only
one-fifth the size of China’s, due largely to
differences in the level of housing construction
0
20
40
60
80
100
120
140
160
180
2002 2011 2012E
Mil
lio
n c
ub
ic M
ete
rs
Timber Deficit in China and India
China
IndiaSource: India’s
Forest Products
Industry, RISI,
Jan. 2013

3-year old clonal Casuarina plantation
in Andhra Pradesh, developed by
International Paper for their farm
forestry program

RISI Base Case Outlook for US Housing Starts
% Millions
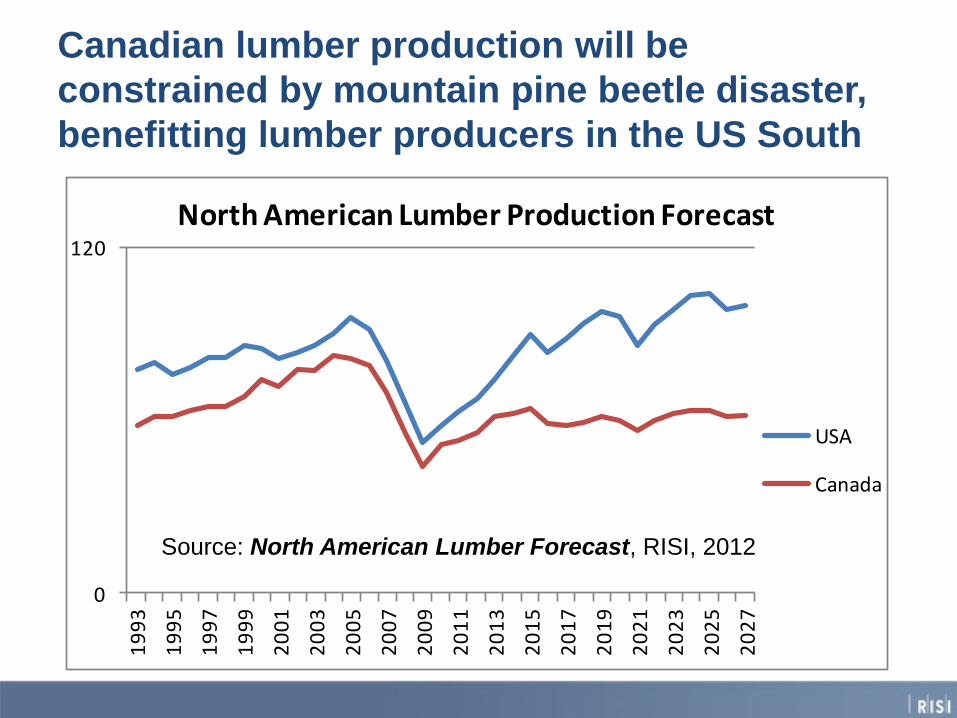
Canadian lumber production will be
constrained by mountain pine beetle disaster,
benefitting lumber producers in the US South
0
120
19
93
19
95
19
97
19
99
20
01
20
03
20
05
20
07
20
09
20
11
20
13
20
15
20
17
20
19
20
21
20
23
20
25
20
27
North American Lumber Production Forecast
USA
Canada
Source: North American Lumber Forecast, RISI, 2012
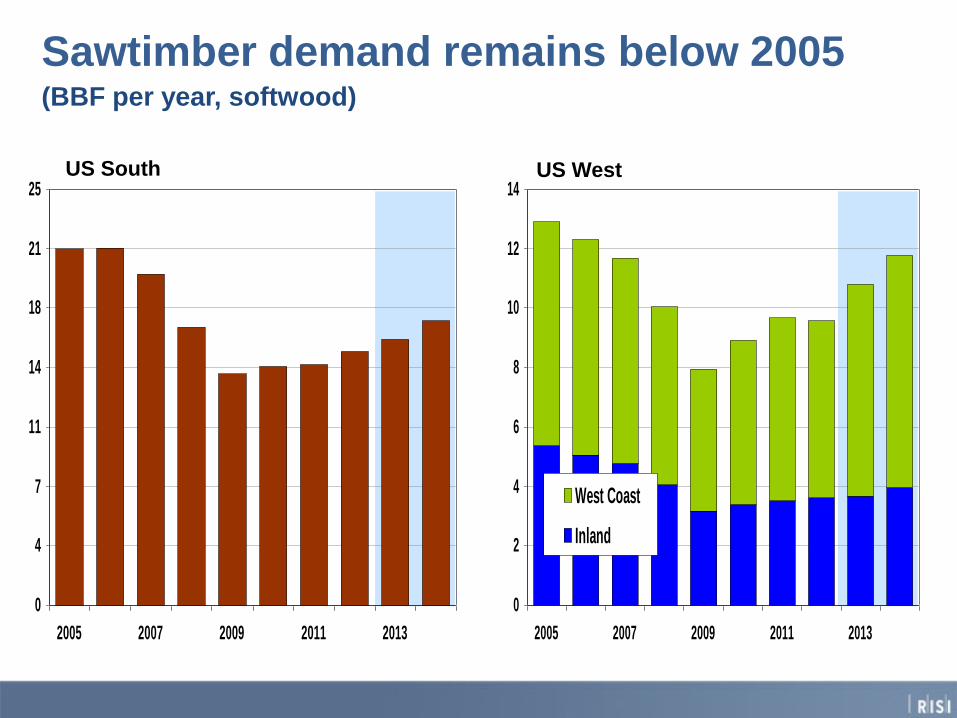
0
2
4
6
8
10
12
14
2005 2007 2009 2011 2013
West Coast
Inland
0
4
7
11
14
18
21
25
2005 2007 2009 2011 2013
Sawtimber demand remains below 2005 (BBF per year, softwood)
US West US South
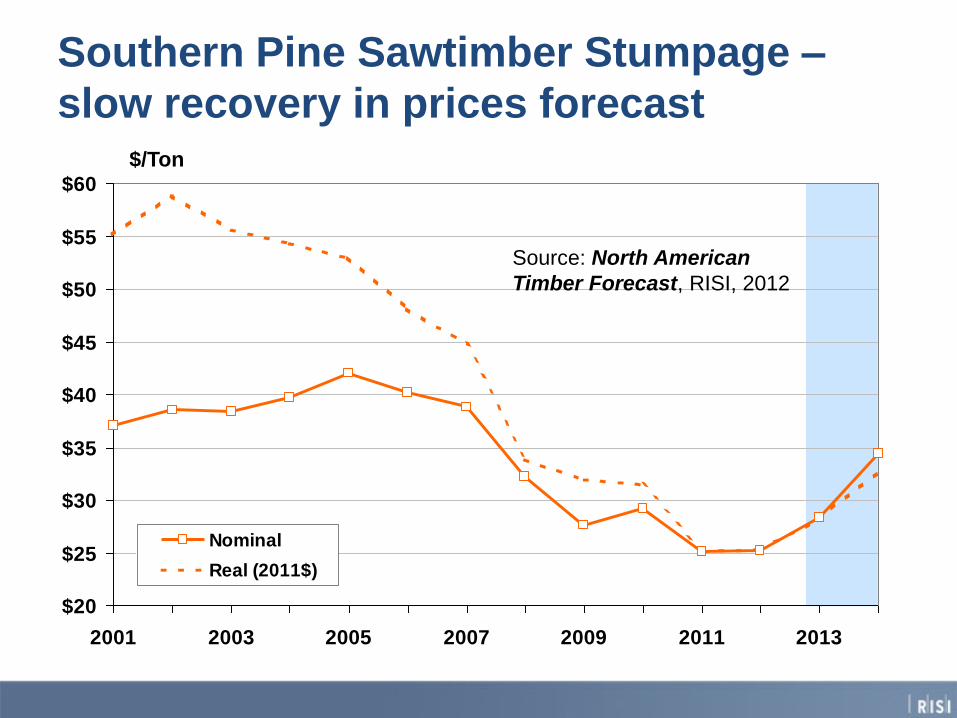
$20
$25
$30
$35
$40
$45
$50
$55
$60
2001 2003 2005 2007 2009 2011 2013
Nominal
Real (2011$)
Southern Pine Sawtimber Stumpage –
slow recovery in prices forecast $/Ton
Source: North American
Timber Forecast, RISI, 2012
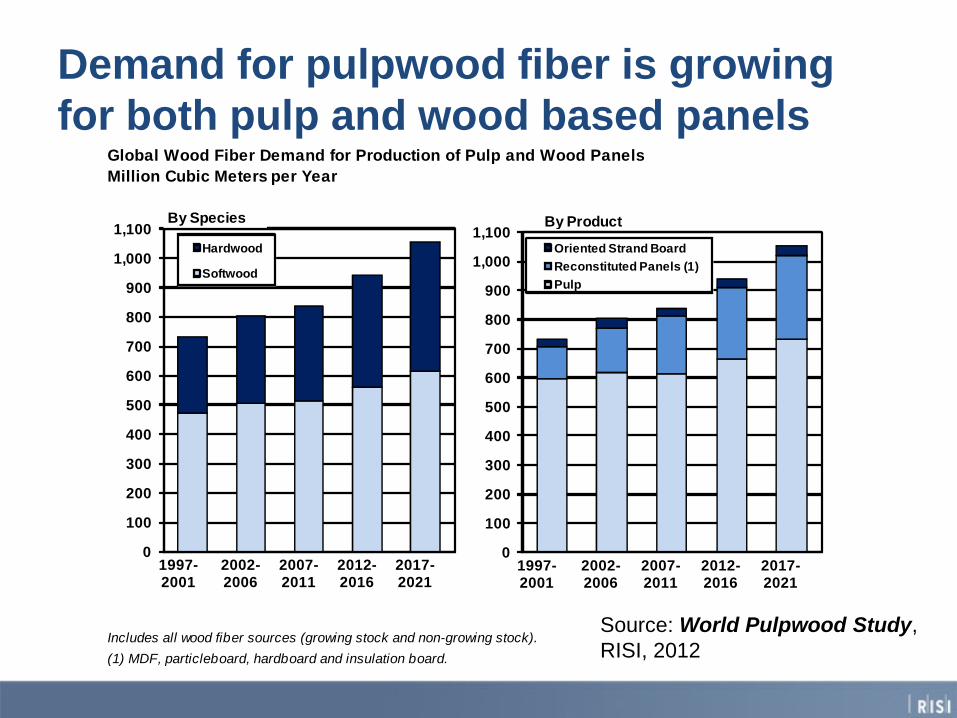
Demand for pulpwood fiber is growing
for both pulp and wood based panels Global Wood Fiber Demand for Production of Pulp and Wood Panels
Million Cubic Meters per Year
Includes all wood fiber sources (growing stock and non-growing stock).
(1) MDF, particleboard, hardboard and insulation board.
0
100
200
300
400
500
600
700
800
900
1,000
1,100
1997-2001
2002-2006
2007-2011
2012-2016
2017-2021
Hardwood
Softwood
0
100
200
300
400
500
600
700
800
900
1,000
1,100
1997-2001
2002-2006
2007-2011
2012-2016
2017-2021
Oriented Strand Board
Reconstituted Panels (1)
Pulp
By Species By Product
Source: World Pulpwood Study,
RISI, 2012
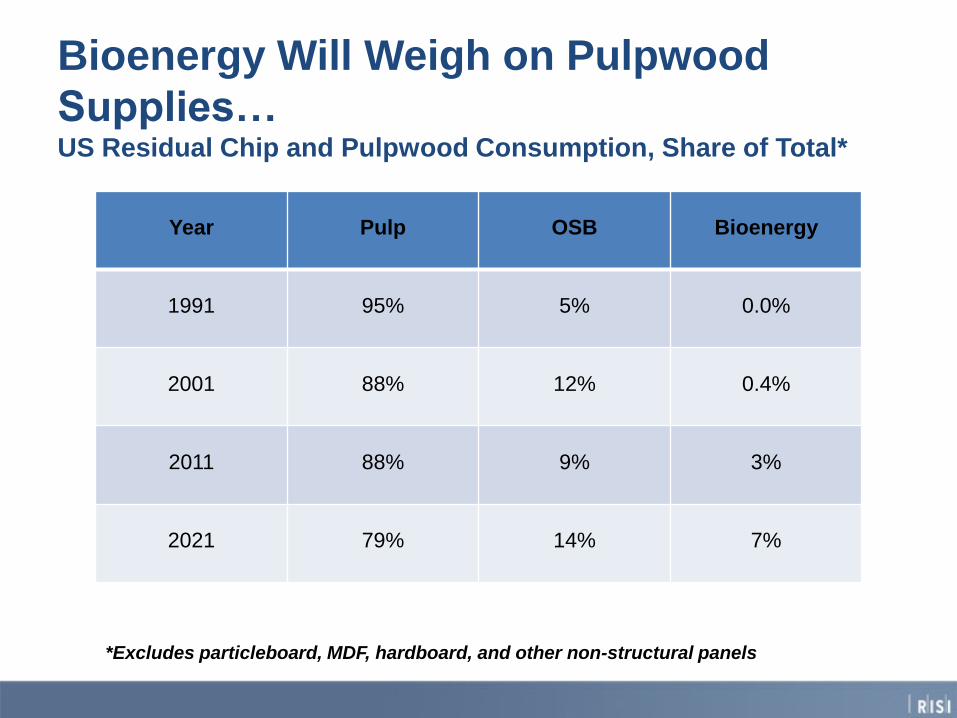
Bioenergy Will Weigh on Pulpwood
Supplies… US Residual Chip and Pulpwood Consumption, Share of Total*
*Excludes particleboard, MDF, hardboard, and other non-structural panels
Year Pulp OSB Bioenergy
1991 95% 5% 0.0%
2001 88% 12% 0.4%
2011 88% 9% 3%
2021 79% 14% 7%

Wood Pellet Exports from North America Million Tonnes
• North American wood
pellet exports exceeded
2 million tonnes in 2011
• Exports expected to
increase to 10 million
tonnes in 2017
• 2017 Forecast
– USA: 5.6 million tonnes
– Canada: 4.8 million tonnes
0
2
4
6
8
10
12
20
07
20
08
20
09
20
10
2011
20
12
20
13
20
14
20
15
20
16
20
17
USA Canada
Source: North American Bioenergy
Forecast, RISI, 2012
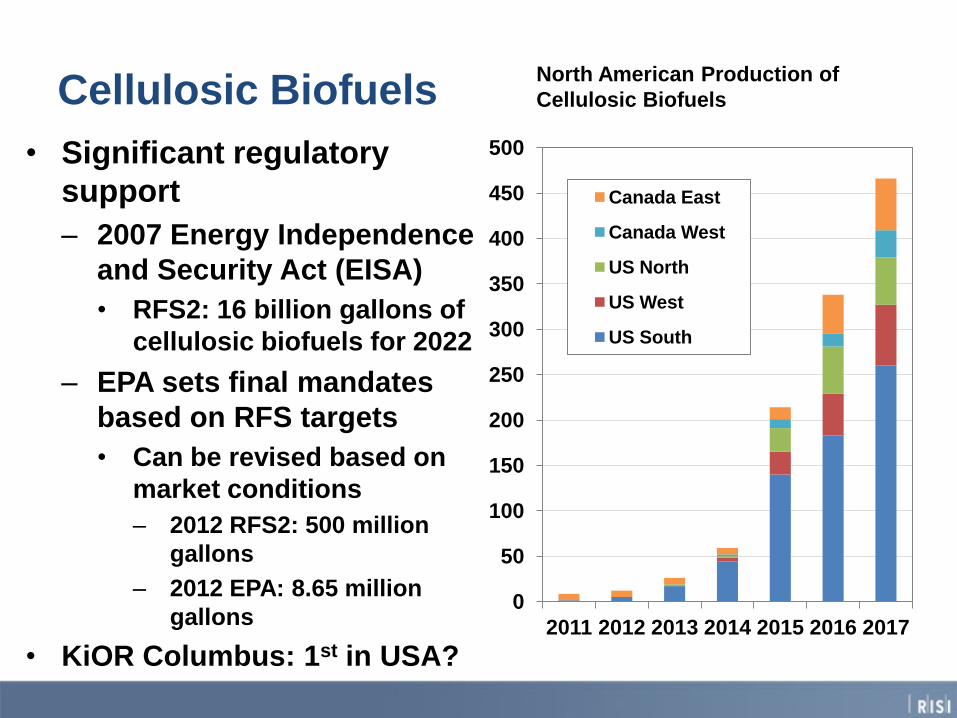
Cellulosic Biofuels
• Significant regulatory
support
– 2007 Energy Independence
and Security Act (EISA)
• RFS2: 16 billion gallons of
cellulosic biofuels for 2022
– EPA sets final mandates
based on RFS targets
• Can be revised based on
market conditions
– 2012 RFS2: 500 million
gallons
– 2012 EPA: 8.65 million
gallons
• KiOR Columbus: 1st in USA?
0
50
100
150
200
250
300
350
400
450
500
2011 2012 2013 2014 2015 2016 2017
Canada East
Canada West
US North
US West
US South
North American Production of
Cellulosic Biofuels

Dedicated biomass crops – really just getting
started in many countries, but for some a way
to add new diversity to portfolio
• In the USA, great potential but little planted to date
• Remember that “biomass” also includes non-woody
sources, e.g., miscanthus, switchgrass, Arundo donax
• Integrated biomass and sawlog cropping (e.g.,
Greenwood Resources in Oregon) seems promising
• Some TIMOs (Greenwood, Regions) are planting
dedicated biomass crops in Europe, driven by EU
renewable energy targets and policies
• But in parts of South America (Brazil, Chile, Uruguay)
biomass crops are being established without subsidies,
based on the high cost of fossil fuels in some regions

Brazil and biomass tree crops: diversified
approach
• Foreign and domestic investors have been pursuing charcoal
options for the pig iron industry
• But industrial fuelwood consumption, much of it from dedicated
plantations, was 33 million m3 in 2011!
• Example: Energia Florestal is planting eucalyptus for fuelwood for
Cargill, Galvani and other major grain traders
• Example: ERB is growing dedicated eucalyptus for fuelwood, but
will sell steam (to Dow Chemical) and electricity into the grid from
its own CHP plant
• Projects also developing in other South American countries, e.g.
Greenwood in Chile
• Some projects still looking at dedicated plantations for pellet
production in NE Brazil, for export to Europe, but most biomass
production will be consumed within South America

Large-scale test of high-density eucalyptus
planting for biomass production, near Lins,
Sao Paulo state, Brazil
Photo from Dr.
Laercio Couto, aka
“Mr. Biomass Brazil”

A number of companies, including North American “TIMOs”,
are planting poplar or willow in Germany, Hungary, Poland
and other countries to produce biomass fiber
Photo from Michael
Weitz
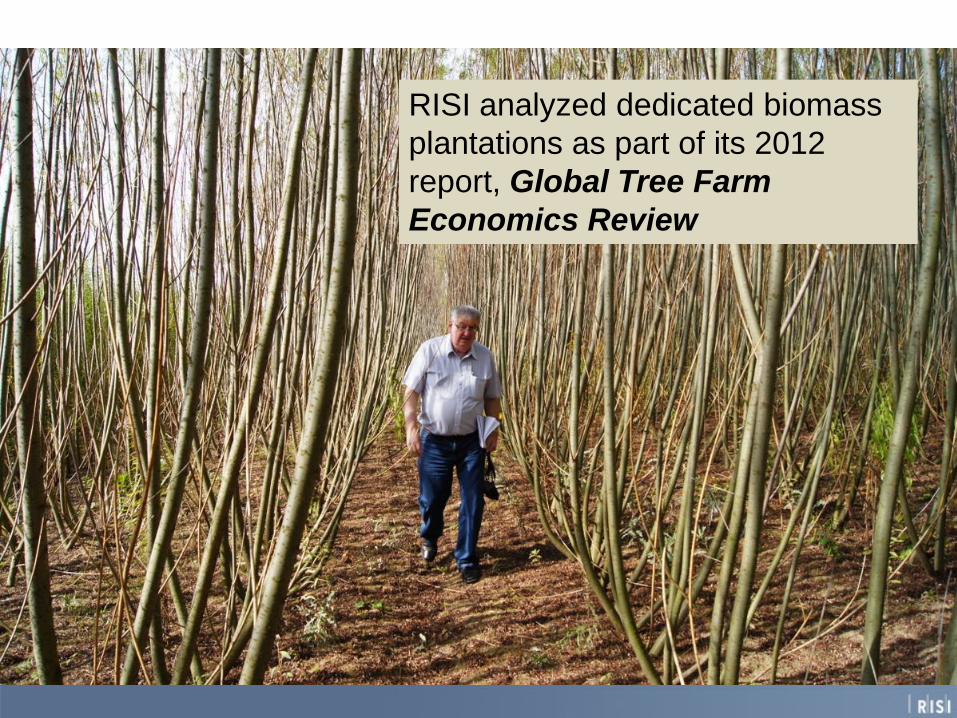
RISI analyzed dedicated biomass
plantations as part of its 2012
report, Global Tree Farm
Economics Review
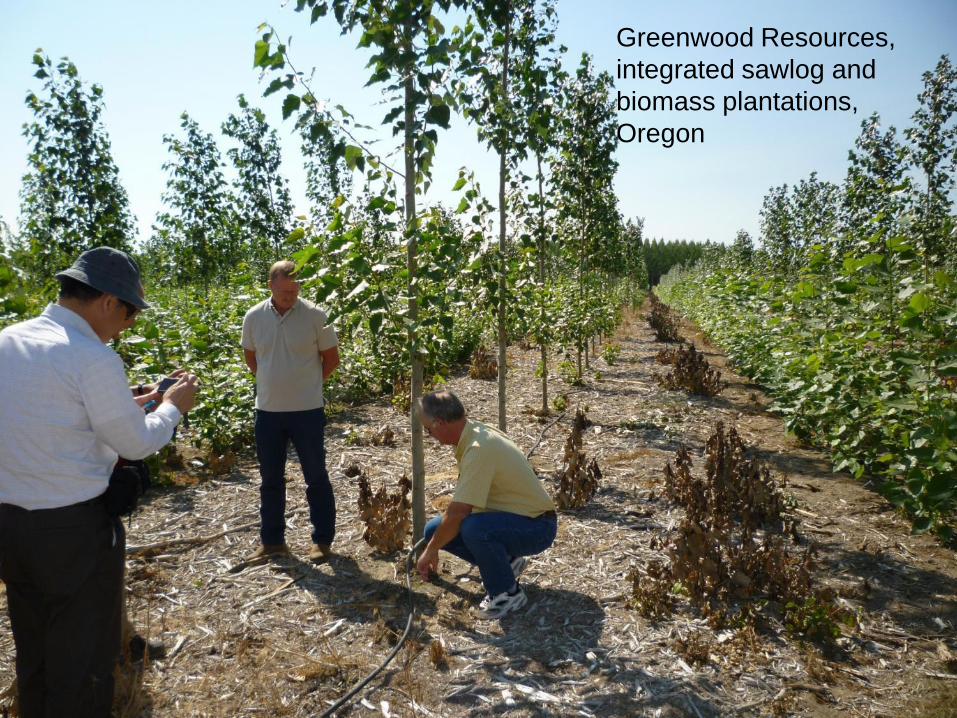
Greenwood Resources,
integrated sawlog and
biomass plantations,
Oregon

Summary: Lessons learned?
• There is no global price for “timber”, depends on:
– Target market (product + individual market preferences)
– Location of forest
– Fiber characteristics and processing technology
– Impact of exchange rates
– Fluctuations in ocean freight rates and other logistics factors
– Changes in government policies
– Housing is a major driver in many countries
– Exogenous factors – e.g. global warming and the pine beetle
– Evolution of markets, e.g. biomass

www.woodfibreconference.com
for online registration, conference program,
speakers, field trips and tours
Conference program includes:
1. Optional pre conference tour of Gallipoli
(5-7 April)
2. Optional pre conference field trip to Yildiz
Entegre, world's largest single site MDF
production complex (8 April)
3. Two days of Conference (9 & 10 April)
4. Optional post conference field trip to
Western Hungary to visit short rotation
hybrid poplar plantations managed by
Regions Timberland Group (11 & 12 April)
5. Partner’s tours
Questions?
• Bob Flynn
• Director, International Timber, RISI
• Phone: 1-253-565-4846
• Mobile: 1-360-471-6578
• Email: [email protected]
• Web site: www.risi.com
Presentation based on
• China’s Timber Supply Outlook, 2011-2015
www.risi.com/chinatimber
• International Pulpwood Trade Review, 2012
www.risi.com/pulpwood
• Global Tree Farm Economics Review, 2012
www.risi.com/treefarm