Outlook for Energy A View to 2030
42
Outlook for Energy A View to 2030 Exxon Mobil Corporation Outlook for Energy: A View to 2030
Transcript of Outlook for Energy A View to 2030

Outlook for EnergyA View to 2030
2d
Printed entirely on 100% post-consumer recycled paper.SP-122
ExxonMobil is a publicly traded company. The New York Stock Exchange (NYSE) is the principal exchange on which Exxon Mobil Corporation common stock (symbol XOM) is traded.Worldwide, ExxonMobil markets fuels and lubricants under three brands.
Corporate Headquarters5959 Las Colinas Blvd.Irving, Texas 75039-2298exxonmobil.com
Exxo
n Mo
bil C
orp
oratio
nO
utloo
k for E
nergy: A
View
to 2030

IFC1 exxonmobil.com
Table of Contents
Transition to modern energy/technology 2
Our key energy challenges 6
Growing global demand 13
Global transportation demand 15
A single-cell oil well? 16
Improving today’s vehicle 18
Thinking outside the tank 20
Global industrial demand 21
Managing emissions 22
Global energy demand and supply 25
The importance of natural gas 27
Options for carbon policy 31
CO2 emissions 32
Integrated energy solutions 34
Key findings 36
Glossary 37
This publication includes forward-looking statements. Actual future
conditions (including economic conditions, energy demand, and
energy supply) could differ materially due to changes in technology,
the development of new supply sources, political events, demographic
changes, and other factors discussed herein (and in Item 1 of
ExxonMobil’s latest report on Form 10-K). This material is not to be
reproduced without the permission of Exxon Mobil Corporation.

The Outlook for Energy: A View to 2030 1
The Outlook for Energy:
A View to 2030
The Outlook for Energy: A View to 2030 1
In our Outlook for Energy – A View to 2030, we see many
hopeful things – economic recovery and growth, improved
living standards and a reduction in poverty, and promising
new energy technologies.
But we also see a tremendous challenge: how to meet the
world’s growing energy needs while also reducing the impact
of energy use on the environment.
As the Outlook shows, ExxonMobil expects that global energy
demand in 2030 will be almost 35 percent higher than in
2005, even accounting for the recession that dampened
energy demand in 2009. Other key findings include:
• Growthwillbeledbyrapidexpansioninnon-OECD
countries such as China and India, where energy usage will
rise by about 65 percent.
• Demandwillbeparticularlyintenseforelectricpower
generation, which will comprise 40 percent of global energy
demand by 2030.
• Oilandnaturalgaswillremainessential,butothersources
including nuclear and renewables (e.g., wind, solar and
biofuels) will play an expanded role.
The future of energy is directly linked to the future well-being
and prosperity of the world’s people.
Today, about 1.5 billion people – a quarter of the world’s
population – lack access to electricity. Even more lack modern
cooking and heating fuels. Expanding access to energy – and
the opportunities it affords – should be a shared global goal.
Our energy and environmental challenges are intertwined and
their scale is enormous. Today, energy use per person around
the world varies dramatically but equates to an average of
200,000 British thermal units (BTUs) a day. Globally, that
translates to 15 billion BTUs every second.
ExxonMobil believes that meeting future energy needs while
also reducing environmental risk will require an integrated set
of solutions that includes:
• Acceleratingenergyefficiency,whichtempersdemandand
saves emissions
• Expandingall economic energy sources, including oil and
natural gas
• Mitigatingemissionsthroughtheuseofnewtechnologies
and cleaner-burning fuels such as natural gas, nuclear and
other renewable sources.
This multidimensional approach will need trillions of dollars
in investment, and an unwavering commitment to innovation
and technology that evolves over years and decades. It will
require sound, stable government policies that enable access
to resources and encourage long-term investments and
technological development. And it will require the global
energy industry to operate on a scale even larger than today.
Updated each year, The Outlook for Energy is a comprehensive
look at long-term trends in energy demand, supply, emissions
and technology. The report is built upon detailed analysis of
data from about 100 countries, incorporating publicly available
information as well as in-house expertise.
ExxonMobil uses the Outlook to guide its long-term investment
decisions. We share it publicly to encourage a better
understanding of our company, our industry and the global
energy challenges that we all have a vested interest in meeting.

1869 Golden spike set in Transcontinental Railroad
1936 Hoover Dam completed
1992 U.S. “Energy Star” program introduced
1991 First commercial lithium battery
1916 First radio tuner
1933Philo Farnsworth develops electronic television
1927 Charles Lindbergh flies across Atlantic
1947 First offshore well out of sight of land
1896 Niagara Falls hydroelectric plant opens
1901 First gasoline-powered automobile mass-produced
1907 First drive-in gas station opened
1879 First commercial incandescent light bulb
1884 First steam turbine1859 First oil
well drilled in Titusville, PA
1979 First commercial citywide cellular network launched in Japan
1980 First U.S. windfarm consisting of 20 turbines built in NewHampshire
1981 IBM introduces personal computer
1954 Modern silicon solar cell invented
1952 First commercial jet service
1956 Interstate Highway Bill signed
1969 First flight of the Concorde supersonic jet
1969 Man walks on the moon
1975 Vehicle fuel economy standards (CAFE) enacted by Congress
2005 U.S. mandate for ethanol blending into gasoline
2009 U.S. natural gas resources now cover about 100 years at current demand due to unconventional gas drilling technology advances (Source: Colorado School of Mines)
2001 Human genome sequenced
2003 First ultra-deepwater well depth greater than 3,000 meters
Source: Energy Information AdministrationWood Modern RenewablesHydro NuclearCoal GasOil
1850 1860 1870 1880 1890 1900 1910 1920 1930 1940 1950 1960 1970 1980 1990 2000 2010 2020 2030
100
75
50
25
0
U.S. Energy DemandPercent
Transition to modern energy/technology
2 exxonmobil.com
1869 Golden spike set in Transcontinental Railroad
1936 Hoover Dam completed
1992 U.S. “Energy Star” program introduced
1991 First commercial lithium battery
1916 First radio tuner
1933Philo Farnsworth develops electronic television
1927 Charles Lindbergh flies across Atlantic
1947 First offshore well out of sight of land
1896 Niagara Falls hydroelectric plant opens
1901 First gasoline-powered automobile mass-produced
1907 First drive-in gas station opened
1879 First commercial incandescent light bulb
1884 First steam turbine1859 First oil
well drilled in Titusville, PA
1979 First commercial citywide cellular network launched in Japan
1980 First U.S. windfarm consisting of 20 turbines built in NewHampshire
1981 IBM introduces personal computer
1954 Modern silicon solar cell invented
1952 First commercial jet service
1956 Interstate Highway Bill signed
1969 First flight of the Concorde supersonic jet
1969 Man walks on the moon
1975 Vehicle fuel economy standards (CAFE) enacted by Congress
2005 U.S. mandate for ethanol blending into gasoline
2009 U.S. natural gas resources now cover about 100 years at current demand due to unconventional gas drilling technology advances (Source: Colorado School of Mines)
2001 Human genome sequenced
2003 First ultra-deepwater well depth greater than 3,000 meters
Source: Energy Information AdministrationWood Modern RenewablesHydro NuclearCoal GasOil
1850 1860 1870 1880 1890 1900 1910 1920 1930 1940 1950 1960 1970 1980 1990 2000 2010 2020 2030
100
75
50
25
0
U.S. Energy DemandPercent
The Outlook for Energy: A View to 2030 3

1869 Golden spike set in Transcontinental Railroad
1936 Hoover Dam completed
1992 U.S. “Energy Star” program introduced
1991 First commercial lithium battery
1916 First radio tuner
1933Philo Farnsworth develops electronic television
1927 Charles Lindbergh flies across Atlantic
1947 First offshore well out of sight of land
1896 Niagara Falls hydroelectric plant opens
1901 First gasoline-powered automobile mass-produced
1907 First drive-in gas station opened
1879 First commercial incandescent light bulb
1884 First steam turbine1859 First oil
well drilled in Titusville, PA
1979 First commercial citywide cellular network launched in Japan
1980 First U.S. windfarm consisting of 20 turbines built in NewHampshire
1981 IBM introduces personal computer
1954 Modern silicon solar cell invented
1952 First commercial jet service
1956 Interstate Highway Bill signed
1969 First flight of the Concorde supersonic jet
1969 Man walks on the moon
1975 Vehicle fuel economy standards (CAFE) enacted by Congress
2005 U.S. mandate for ethanol blending into gasoline
2009 U.S. natural gas resources now cover about 100 years at current demand due to unconventional gas drilling technology advances (Source: Colorado School of Mines)
2001 Human genome sequenced
2003 First ultra-deepwater well depth greater than 3,000 meters
Source: Energy Information AdministrationWood Modern RenewablesHydro NuclearCoal GasOil
1850 1860 1870 1880 1890 1900 1910 1920 1930 1940 1950 1960 1970 1980 1990 2000 2010 2020 2030
100
75
50
25
0
U.S. Energy DemandPercent

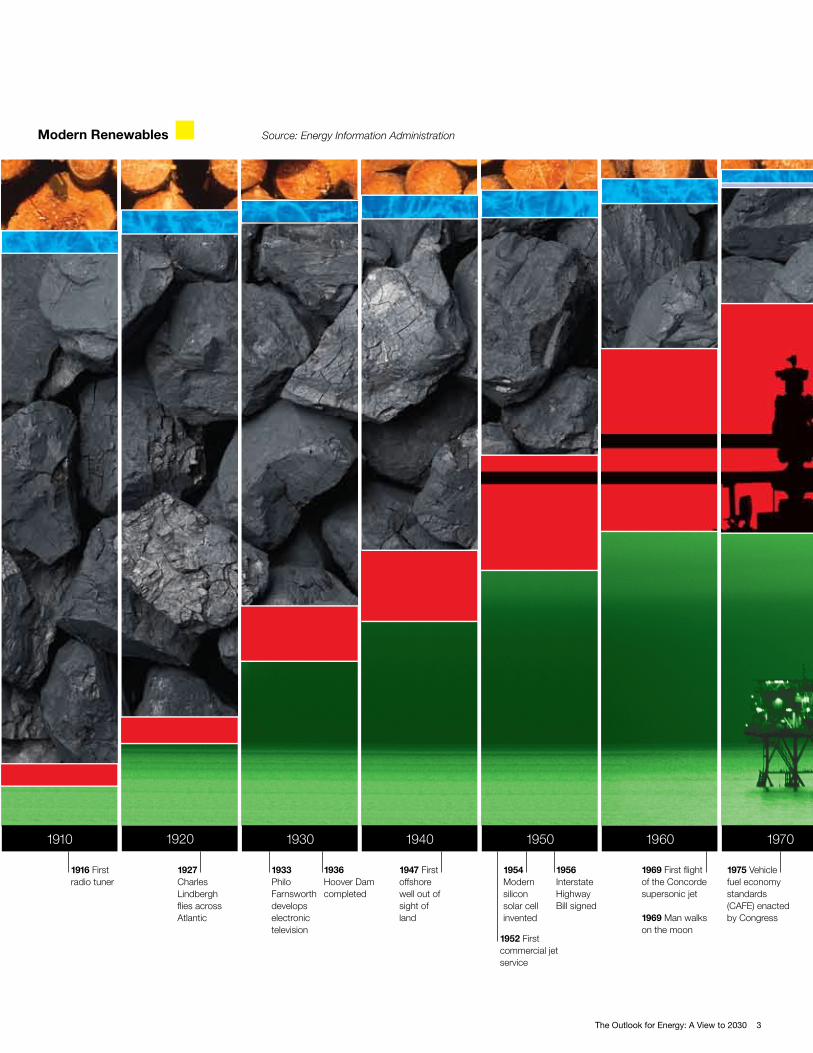
Energy sources and technology evolve
over time – and each influences the
other. By understanding the history of
energy and technology, we can better
understand the future course of the
energy challenge.
As an example, the history of energy
use in the United States over the last
150 years illustrates the way energy use
and technologies develop over time.
In the United States in 1850, wood
was the biggest energy source. But by
1900, coal had become predominant.
Technology played a role in this trend, as
mining evolved and coal fed the newly
industrialized nation. America’s access to
energy enabled its growth as an industrial
economy; in turn, industrial growth and
the wealth it created expanded U.S.
energy demand. It is important to note
that it took about 40 years for coal to
achieve its substantial share.
By 1950, oil was overtaking coal, as
more Americans owned cars and rail
transport shifted from coal to diesel.
The growth of cars and trucks, as
well as the birth of the commercial
airline industry, meant a new need for
transportation fuels. Improvements in
oil-exploration technologies helped keep
pace with this growing fuel demand.
Also by 1950, hydroelectric power came
into use. And natural gas, considered
nearly worthless a generation earlier, grew
as a fuel to meet the growing heating and
industrial needs of an increasingly wealthy
nation. Coal remained significant and
helped meet growing electricity demand.
From 1950 to 2000, we saw the
introduction and growth of nuclear energy
and the first meaningful appearance of
modern renewable fuels. Natural gas also
continued to grow and was now fueling
power generators as well.
Looking out to 2030, we see gradual
shifts in energy and technology
continuing. Both the U.S. and world
energy mix continue to grow more
diverse, which strengthens energy
security by reducing the risk from
disruption to any single supply source.
We will need to expand all these
sources – and develop new ones –
to meet future demand. New energy
technologies will open up new energy
sources, and new end-use technologies
will reshape demand patterns, just
as they have for the last 150 years. It
is important to remember, however,
that these shifts happen slowly, over
the course of decades. Free markets,
open trade, and stable legal, regulatory
and tax frameworks will facilitate these
positive transformations.
Change in energy use and technology
development is an evolutionary
process, but one that often has
revolutionary impacts.
Evolution of energy and technology

The Outlook for Energy: A View to 2030 4
Importance of energy
Before considering the many energy demand, supply and
emissions trends that constitute the world’s energy outlook
through 2030, it is worth reflecting on the importance of
energy to all aspects of our lives.
Fundamentally, the energy outlook is about people – billions
of people and their families using energy to improve their
daily lives.
At a national and international level, it is the lifeblood
of modern economies. For developed nations, reliable
energy fuels the technologies and services that enrich and
extend life. Energy powers advanced computers, improved
transportation, expanded communications, cutting-edge
medical equipment and procedures, and much more.
For developing nations, expanding reliable and affordable
supplies of energy supports and even accelerates changes
that improve and save lives. Reliable energy means
expanded industry, modern agriculture, increased trade
and improved transportation. These are building blocks
of economic growth that create the jobs that help people
escape poverty and create better lives for their children.
For these reasons and more, energy issues are vitally
important and demand our understanding.
4 exxonmobil.com

The benefits of energy reach far beyond
what we may see in our day-to-day lives.
The energy that people use every day – to run
their households and drive their cars – is what
we can categorize as personal, or direct,
consumption of energy, and it includes the
fuel used to make electricity for the home.
To complete the picture, we also need
to count the energy that powers private
enterprise, public services and other
important needs across society.
This indirect consumption includes energy
required to run buildings (schools, hospitals,
retail shops), commercial transportation
(trucking, air and rail travel) and industry
(manufacturing, chemicals, steel). Every
member of society benefits from this
indirect energy usage – through job
opportunities, higher living standards and
overall economic growth.
On a global, per-capita basis, indirect
energy consumption is about two-thirds
of the total. In other words, when direct
and indirect energy consumption are
counted, each of us has on average an
energy “footprint” that is about twice the
size of what we might typically consider
our personal energy consumption.
In 2005, the average person in North America
had a daily energy footprint equivalent to
nearly 740,000 BTUs of energy.
The pattern of direct and indirect energy
use holds true in every region of the
world. While the absolute level of energy
use differs, indirect use is larger in every
region.
As we look at different ways to solve our
energy challenges, we must consider not
only the energy we use in our daily lives,
but also the tremendous energy being
used behind the scenes that makes our
modern lives possible.
Your energy footprint
North America
Latin America
Europe
Middle East
Asia Pacific
Africa
Russia/Caspian
Your energy footprint
740,000BTUs per Day
Direct Energy UseHousehold
Indirect Energy Use
Personal Vehicle
daily energy useBTUs per Person
200,000 300,000 500,000 600,000 700,000400,000 800,0000 100,000
Households Personal Car Public Buildings Commercial Tran IndustryNA 146542 129057 117161 80377 262391R/C 96721 7707 29261 28943 238901Europe 92112 35434 45103 52179 159466ME 73984 14388 26748 62898 161355LA 21908 9398 8081 25550 65901AP 30218 5442 10042 10873 66677Africa 35406 1882 2788 8025 32390
The Outlook for Energy: A View to 2030 5

6 exxonmobil.com
As we survey the global energy landscape to
2030, we see several interlocking challenges.
One of the biggest jobs through 2030 will be
to reduce poverty and raise living standards
around the world. An important factor in
achieving this goal will be to continue meeting
the world’s energy needs safely, reliably and
affordably, even as population and economic
growth – particularly in developing countries –
pushes global demand higher by almost 35
percent compared to 2005.
By providing reliable and affordable energy,
we will also help revitalize economies and
enable broad economic gains around the
world. Meeting this demand will not be
easy, especially considering that the world’s
energy resources are increasingly found in
difficult or hard-to-reach places. And it will
require the global energy industry to operate
on a scale even larger than it does today.
At the same time, because we want to
ensure that today’s progress does not come
at the expense of future generations, we
need to manage the risks to our climate
and environment. That includes taking
meaningful steps to curb carbon dioxide
(CO2) emissions, while at the same time
utilizing local resources to help maintain
secure supplies.
We can meet these interlocking
challenges. To do it, we will need an
integrated set of solutions that includes
expanding all economic energy sources,
improving efficiency and mitigating
emissions through the use of cleaner-
burning fuels such as natural gas.
These solutions must be supported
by trillions of dollars in new energy
investment, a long-term focus and constant
technological innovation.
ExxonMobil is committed to pursuing each
of these integrated solutions.
Our key energy challenges
Globally, about 2.5 billion people rely
on traditional fuels such as wood and
dung for heating and cooking.

Over the past 150 years, the evolution of
modern energy and technology has enabled
people in developed countries to achieve
a lifestyle in which access to energy – at
home, at work and on the road – is largely
taken for granted. In many of these places,
the challenge today is largely one of securing
enough reliable, affordable energy to
continue meeting these existing needs.
But in some parts of the world, the challenge
is far more basic. Today, globally, about
1.5 billion people lack access to electricity.
Even more live without modern fuels for
cooking and heating. Instead, these
2.5 billion people – nearly 40 percent of the
world’s population – rely on burning wood,
dung or other traditional biomass fuels,
which can be dangerous to people’s health
and harmful to air quality.
Gaining access to energy represents
hope and opportunity. It means improved
transportation, increased commerce,
expanded industry and greater access to
health care and other social services – all of
which create jobs that help people escape
poverty. For nations with widespread
poverty, affordable and reliable energy also
is vital to building homes, schools, hospitals
and sanitation systems that can improve
and save lives.
As we consider the energy outlook to 2030,
it is important to keep in mind this “energy
gap,” and energy’s potential to lift lives and
improve communities in developed and
developing nations alike.
Challenge: meeting basic needsGlobally,
about
1.5billion people
lack access
to electricity.
A satellite image of the Earth
at night shows electricity
usage by region.
Photo courtesy of NASA
electricity modern cooking and heating fuels
Challenge: meeting basic needs
Available Available
About1.5 Billion Peoplewith No Electricity
About2.5 Billion Peoplewith No Modern
Cooking or Heating Fuels
The Outlook for Energy: A View to 2030 7

8 exxonmobil.com

The Outlook for Energy: A View to 2030 9
On average, a city of 1 million people in the OECD:
Needs 6 million BTUs of energy every second
Consumes over 1,000 gallons of oil per minute
Uses 150 tons of coal each hour
Requires two world-scale power plants
Drives 500,000 cars that use over 500,000 gallons of petroleum every day
Naples, Italy, population 1,004,500

10 exxonmobil.com
When ExxonMobil prepares its Outlook for
Energy each year, we start with the world’s
economic outlook, because economic
activity – along with population growth – is
a fundamental driver of energy demand.
The economic trend, globally, is the same,
and it’s encouraging.
While the recession is expected to produce a
2percentcontractioninglobalGDPin2009,
economic growth will return, and return
to a pre-recession rate. In fact, from 2005
through2030,weseeglobalGDPexpanding
at an average annual rate of 2.7 percent.
At the same time, the world’s population
is expected to rise from 6.7 billion today to
almost 8 billion. As we noted earlier, rising
populations not only create new demands for
energy for personal needs such as fuels for
cars and electricity for homes, but also energy
that is consumed “indirectly” – the energy that
serves the broader society and economy.
Together, population and economic growth
through 2030 will continue to drive global
energy demand higher.
ExxonMobil expects that global energy
demand will rise by an average annual
rate of 1.2 percent a year through 2030,
when the world will be using almost 35
percent more energy than it did in 2005.
The composition of the world’s energy will
continue to evolve through 2030, as we
will discuss later in the Outlook.
It’s important to note that while economic
growth drives energy demand, because
of expected gains in energy efficiency, our
projected rate of energy-demand growth
(1.2 percent) is less than half the rate
ofglobalGDPgrowth(2.7percent)
through 2030.
Energy demand to grow significantly
In the United States and other OECD
countries, energy demand will be
essentially flat and CO2 emissions
will decline through 2030 even as
economies and populations grow.
Energy efficiency will play a key role.
1980 20302005
0.9% Average Growth per Year
2005 – 2030
1980 20302005
2.7% Average Growth per Year
2005 – 2030
1980 20302005
1.2% Average Growth per Year
2005 – 2030
Energy demand to grow sharply
Quadrillion BTUs
700
600
500
400
300
200
100
0
energy demandTrillions in 2005 Dollars
100
80
60
40
20
0
GDPBillions
10
8
6
4
2
0
population
Data as of 11/19/2009
Data forEnergy Demandchart lifted fromcharts on 17A
1/1/80 44091/1/81 44861/1/82 45641/1/83 46421/1/84 47201/1/85 47991/1/86 48821/1/87 49671/1/88 50531/1/89 51401/1/90 52251/1/91 53101/1/92 53921/1/93 54711/1/94 55521/1/95 56251/1/96 57161/1/97 57891/1/98 58681/1/99 59451/1/00 60261/1/01 60981/1/02 61691/1/03 62411/1/04 63131/1/05 63851/1/06 64531/1/07 65221/1/08 65901/1/09 66581/1/10 67271/1/11 67931/1/12 68591/1/13 69251/1/14 69911/1/15 70561/1/16 71211/1/17 71851/1/18 72491/1/19 73131/1/20 73771/1/25 76761/1/30 7945
World1/1/80 202591/1/81 205731/1/82 206351/1/83 211891/1/84 221491/1/85 229201/1/86 236871/1/87 245521/1/88 256621/1/89 265951/1/90 273041/1/91 277701/1/92 283011/1/93 287591/1/94 297021/1/95 305571/1/96 315741/1/97 327451/1/98 335011/1/99 345641/1/00 359981/1/01 365401/1/02 372431/1/03 382361/1/04 397861/1/05 411741/1/06 428341/1/07 444401/1/08 453231/1/09 444181/1/10 453061/1/11 464551/1/12 478741/1/13 493391/1/14 508201/1/15 523501/1/16 539221/1/17 555481/1/18 572301/1/19 589721/1/20 607671/1/21 625521/1/22 643901/1/23 662811/1/24 682281/1/25 702331/1/26 722141/1/27 742511/1/28 763451/1/29 784991/1/30 80713

The Outlook for Energy: A View to 2030 11
Economic growth drives energy demand
The world uses 15 billion BTUs
of energy every second. As more
countries move up the economic
ladder, more energy will be required.
Economic growth drives energy demand
GDP
1980 20302005
Trillions in 2005 Dollars
OECD
OECD
Non-OECD
Non-OECD60
50
40
30
20
10
0
energy demand
1980 20302005
Quadrillion BTUs
400
300
200
100
0
Global
energy demand
will be almost
35%higher in 2030
than it was
in 2005.
While global energy demand is expected
to rise by almost 35 percent through 2030,
to fully understand the energy outlook in
coming decades, we need to examine what’s
going on in developed Organization for
EconomicCo-operationandDevelopment
(OECD)countries(liketheUnitedStatesand
Europeannations)andnon-OECDnations
(such as China and India), because the trends
in these two groups can be starkly different.
Through2030,theeconomiesofnon-OECD
countries, while still relatively smaller, will grow
atamuchfasterratethanthoseoftheOECD.
By 2030, these developing economies will
havereachedcloseto60percentofOECD
economic output.
Innon-OECDcountries,rapideconomic
growth is expected to produce a steep climb
in energy demand. In fact, we expect
that between 2005 and 2030, non-OECD
energy demand will grow by about
65 percent. However, even with this rapid
growth, per-capita energy demand in non-
OECDcountriesstillwillbemuchsmaller
thaninOECDcountries.
By contrast, in OECD countries, energy
demand is expected to actually be
slightly lower in 2030 versus 2005, even
though their economies will be more
than 50 percent larger on average.
How is this possible? The main reason is
efficiency. ExxonMobil continues to project
substantialimprovementsinefficiencyinOECD
countries.Innon-OECDcountries,wealsosee
efficiencyimproving,butfastergrowthinGDP
and personal incomes will continue to drive
demand higher there.

12 exxonmobil.com
Our world continues to become more energy
efficient. From 1980 to 2000, the energy it
tooktoproduceoneunitofGDPfellbyan
average 1.2 percent a year. This occurred
for a number of reasons, including the use
of new, energy-saving technologies.
We expect efficiency gains to accelerate
between 2005 and 2030 versus historical
trends,withenergy-per-GDPfallingatan
average global rate of 1.5 percent a year.
This faster pace will be driven by higher energy
costs, government mandates and regulations,
technology advances and expected CO2
emissionscostsinOECDcountries.
Improving efficiency at this rate will save a
significant amount of energy.
Through 2030, ExxonMobil expects global
energy demand to grow by an average
1.2 percent. To see how energy efficiency
works to curb energy-demand growth,
imagine if the world’s economies grew as
projected through 2030, but efficiency
was held flat at 2005 levels. In that case,
global energy demand in 2030 would not
be almost 35 percent higher than in 2005,
as we currently project; it would be about
95percenthigher.Putanotherway,gains
in energy efficiency through 2030 will curb
energy-demand growth through 2030 by
about 65 percent.
In this respect, the greatest source of energy
in the future is finding ways to use energy
more efficiently.
Efficiency: reducing demand growth
energy per GDP
Efficiency: reducing demand growth
energy demand
1980 2030
Millions of BTUs per Thousand of Dollarsof Gross Domestic Product (2005 Dollars)
Quadrillion BTUs
1.2%Average Growth per Year
2005 – 2030
1.2% Average Efficiency Gain
per Year1980 – 2000
1.5% Average Efficiency Gain
per Year2005 – 2030
15
10
5
01980 2030
1000
600
500
400
300
800
700
900
200
100
02005
What demand would bewithout efficiency gains
Constant 2005 Level
2005
~300Quads
Through 2030, the amount of
energy saved through improved
efficiency will be greater than the
energy consumed from any single
supply source.
Taking sensible steps to improve
energy efficiency is a “triple win” –
it saves money, reduces energy
demand and curbs CO2 emissions.
Gains in energy
efficiency through
2030 will
reduce global
energy-demand
growth by
approximately
65%

The Outlook for Energy: A View to 2030 13
Broken down by the four main end-use
sectors, the biggest demand for energy
comes from electric power generation – a
fact that might surprise some people, who
may think that transportation is the largest.
Transportation is, in fact, in third place
behind industrial demand, which represents
the energy used for manufacturing,
steelmaking and other industrial purposes.
Residential/commercial demand is the
smallest sector.
Powergenerationisnotonlythelargest
energy-demand sector, but also the
fastest-growing. Through 2030, this sector
represents 55 percent of the total growth
in energy demand.
The story behind the remarkable increase
in demand for energy for power generation
is not just the high-tech demands of
the developed world, but also the more
basic needs and economic growth of the
developingworld.Non-OECDelectricity
demand more than doubles through 2030
and accounts for 80 percent of total growth
in electricity demand through 2030.
Anyone asking how the world will meet
its energy and environmental goals must
consider electric power generation; by
2030, this sector alone will account for
about 40 percent of total primary energy
demand, and its largest energy source
will continue to be coal, the fuel with the
highest carbon intensity.
In each sector, demand would be growing
much faster without improvements in
efficiency. Efficiency improvements in each
sector will add up to significant energy
savings each year – reaching 300 quadrillion
BTUs in 2030.
Growing global demand
2005 2030
Transportation
2005 2030
PowerGeneration
2005 2030
Residential/Commercial
2005 2030
Industrial
Growing global demand
2030 Energy Savings
Quadrillion BTUs
energy demand in each sector will increase . . . . . . but increasing efficiencieswill help mitigate growth
300
200
100
0
Transportation
PowerGeneration
Residential/Commercial
Industrial
Rising living standards in non-OECD
countries will create new demands
for energy through 2030.
By 2030,
power generation
will account for
40% of all energy
demand.

14 exxonmobil.com
In the residential/commercial sector –
the energy we use in our homes and
businesses – residential demand dominates,
at about three times bigger than commercial.
This trend continues as demand in this
sector grows through 2030.
Residential energy demand is tied closely
to the total number of households in the
world. Through 2030, we see the number of
households rising by 900 million, with nearly
90 percent of that growth occurring
innon-OECDcountries.
OECDcountriestodayusesubstantially
moreenergyperhouseholdthannon-OECD
countries. While that remains true in 2030,
all around the world, households are growing
more efficient in their use of energy. Through
2030, the steepest decline in energy-per-
householdwillcomefromOECDcountries,
with more modest rates of improvement in
non-OECDnations.
A diverse mix of energy is used to meet
residential/commercial demand. Natural
gas and electricity account for most of the
growth in this sector through 2030. But
biomass – fuels like wood and dung – will
retain a substantial share of supply, mainly in
thenon-OECD.
Note: In each sector, we have included
“electricity” in the breakdown of demand by
fuel. Electricity, of course, is not a fuel in itself –
it must be generated by other energy sources
such as coal and natural gas. But it is important
to recognize the share of total electricity that is
consumed by each end-use sector.
Residential /commercial demand
2005 2030 2005 20302005 2030 2005 2030
by sector
Residential/commercial demand
Residential
Non-OECD
OECD
Commercial
Quadrillion BTUs
120
100
80
60
40
20
0
residential
1980 20302005
Billion Households
3.0
2.5
0
2.0
1.5
0.5
1.0
residential energy use
Non-OECD
OECD
Millions of BTUs per Household
80
70
60
50
40
30
20
10
0
There will be 900 million more households
in the world by 2030 – and they will need
energy for heating, cooking and appliances.

The Outlook for Energy: A View to 2030 15
Transportation is one of the fastest-
growing energy demand sectors. It is also
the one associated most closely with oil. While,
for example, we can use many different fuels
to make electricity, the same is not true right
now for transportation; globally, 98 percent of
transportation runs on fuel made from oil.
Historically, light-duty vehicles – cars, SUVs
and light pickup trucks – have been the
largest sub-sector, but that is changing.
Through 2030, light-duty demand flattens
as more efficient vehicles enter the market.
Heavy-duty vehicles (trucks and buses) grow
the most, the result of a number of factors,
including economic growth and the increased
shipment of goods across and between
nations, and within local communities.
By 2030, heavy-duty vehicles will have
become the largest transportation
demand segment; aviation and marine
transport also grow significantly, reflecting
global economic links.
We can classify transportation into two basic
categories – personal and commercial. In both,
but especially in personal vehicles, energy
demandishigherinOECDcountriestoday.
But through 2030, we see a significant
shift.IntheOECD,personaltransportation
demand is expected to drop by 25 percent
through2030,whilenon-OECDdemand
more than doubles. Why is this? First,
vehicle ownership is closely tied to personal
income,andinOECDeconomies,vehicles-
per-capita is already high. So, better fuel
economy over time – enabled by greater
penetration of conventional and advanced
technologies across the fleet – will more
than offset additional demand created by
an increase in vehicles per capita. But in
non-OECDcountries,economicprogresswill
be accompanied by rapid growth in vehicle
ownership through 2030.
Commercial transportation demand will
grow in all regions, but far more rapidly in
non-OECDcountries.By2030,thesefast-
developing nations will have overtaken the
OECDasthelargestsourceofcommercial
transportation demand.
Global transportation demand
2005 20052030 2030 2005 2030 2005 2030Personal Commercial
PersonalLight-DutyVehicles
Heavy-DutyVehicles
Aviation
Marine
Rail
Commercial
OECD
Non-OECD
OECD
Non-OECD
by sector
Global transportation demand
personal vs. commercial
1980 2030
Millions of Oil-Equivalent Barrels per Day Millions of Oil-Equivalent Barrels per Day
70
60
50
40
30
20
10
0
25
20
15
10
5
02005
Heavy-duty vehicles such as commercial trucks
will soon overtake personal vehicles as the largest
source of transportation-related energy demand.

16 exxonmobil.com
ExxonMobil believes that biofuels from photosynthetic
algae could someday play an important role in meeting the
world’s growing need for transportation fuels, while also
reducing CO2 emissions.
In July 2009, we announced a significant new project to research
and develop algae biofuels. Our partner is Synthetic Genomics
Inc (SGI), a California-based biotech firm founded by genome
researchpioneerDr.J.CraigVenter.Thegoaloftheprogram:to
produce a commercially scalable, renewable algae-based
fuel compatible with today’s gasoline, diesel and jet fuel.
• Why algae? Scientists already know that certain algae
naturally produce oils similar to the petroleum products we
use today. If commercial quantities of these algae-based oils
could be developed, they could avoid the need to build the
extensive new delivery infrastructure that some other alternative
transportation fuels might require.
• Algae-based biofuels have potential environmental
advantages. Through photosynthesis, algae absorb CO2 –
the main greenhouse gas – and convert it to useful products,
like oils and oxygen. As a result, fuels made from algae could
reduce greenhouse gas emissions.
• Algae-based biofuels likely would not impact the global
food supply. While biofuels made from plants like corn and
sugar cane are an expanding energy source, they require
fertile land and fresh water; algae can be grown using land
and water unsuitable for plant or food production. Algae also
could yield between three and eight times more biofuel per
acre compared to other biofuel sources.
Getting these algae fuels from the lab to broad, commercial
scale at the local gas station will be a tremendous
undertaking – and could require decades of work.
It is an exciting project that brings together SGI’s expertise in
genomics, synthetic biology, microbiology and biochemistry;
and ExxonMobil’s expertise in transportation fuels and the
development of technologies and systems needed to increase
scale from concept phase to large-scale manufacturing.
ExxonMobil expects to spend more than $600 million on
this project if research and development milestones are met.
ExxonMobil’s investment in algae-based fuels is just one part
of our commitment to the breakthrough technologies and
integrated solutions that will be needed to address rising
demand for transportation fuels and other long-term challenges
illustrated in our Outlook for Energy.
A single-cell
oil well?

The Outlook for Energy: A View to 2030 17
To accurately estimate future demand for
light-duty transportation fuels, we need
to project the number of vehicles that
will be on the world’s roads in 2030, and
thetypesoffuelstheywilluse.Personal
transportation demand is very sensitive to
vehicle fleet size, which we forecast from
income levels and vehicle penetration.
In the United States, vehicle penetration –
the number of vehicles relative to population –
is quite high, at nearly 80 percent, reflecting
the strong correlation between income and
vehicle ownership.
Europe has a larger population than the
United States but a similar fleet size,
reflecting a much lower number of vehicles
per capita.
The picture in other areas can be very
different. For example, in China, rising
incomes will result in rapid growth in that
country’s personal-vehicle fleet through
2030. Yet even in 2030, China’s vehicles-
per-capita will be almost 10 times lower than
the United States’, with about eight vehicles
for every 100 people.
At the same time, the composition of the
global vehicle fleet is expected to change
through 2030. Conventional gasoline
vehicles will continue to be the majority,
followed by diesel. Hybrids and other
advanced vehicles will grow rapidly; we
estimate that by 2030 they will constitute
approximately 15 percent of the total
personal-vehicle fleet, compared to less
than 1 percent today.
The expanding market share of hybrids and
other advanced vehicles, combined with
ongoing improvements to the fuel efficiency
of conventional vehicles, will combine
to curb growth in energy demand for
transportation through 2030.
Personalvehiclefleetisgrowing
2005 2030
United States
CarsCars
PopulationPopulation
2005 2030
CarsCars
Population Population
EuropeOECD
2005 2030
Cars
Cars
Population
Personal vehicle fleet is growing
vehicle penetrationIn Millions
1500
1200
900
600
300
0
fleet by car typeMillion Cars
Gasoline
Diesel
Advanced
1250
1000
750
500
250
02000 20302015 2020 20252005 2010
PopulationChina
China today has only about 27 vehicles
per 1,000 people, compared to 780 per
1,000 in the United States. Rising incomes
in China and other developing countries
will produce strong growth in the number
of global vehicles through 2030.
The Outlook for Energy: A View to 2030 17

18 exxonmobil.com
Making vehicles more efficient is a goal of
automakers, governments and consumers
around the world. Many technologies already
have been developed to substantially improve
the fuel efficiency of conventional vehicles.
These are not far-off innovations; they are
available today, and there is a lot of positive
news in this area.
• Improvedengine-basedtechnologies
can increase miles per gallon by about
15 percent versus today’s conventional
gasoline vehicles. For example, engines
can be made more efficient via
turbocharging, cylinder deactivation
and camless valves.
• Fortransmissions,increasingtoa6-speed
or higher transmission, or to a continuously
variable transmission, could increase miles
per gallon by another 5 percent to 10 percent.
• Potentialimprovementstothecarbody
and accessories include improving vehicle
aerodynamics and reducing vehicle weight
through lightweight materials such as
plastics. They also include tires that stay
inflated longer and higher-efficiency air-
conditioner compressors. Together, these
technologies could produce a 10 percent to
15 percent improvement in fuel efficiency.
Improving today’s vehicle
0 10 20155 3025 35
improvement in mileage
Improving today’s vehicle
Engine
Transmission
Body andAccessories
Total
Percent Improvement in Miles per Gallon Aerodynamics
Turbocharging
LightweightMaterials
CylinderDeactivation
CamlessValves
Air ConditioningEfficiency
6 Speedand
7 Speed
ContinuouslyVariable
Transmission
Improved Tires

The Outlook for Energy: A View to 2030 19
When we combine all these improvements
to conventional vehicles, we see an overall
potential increase in miles per gallon of
about 35 percent.
While these technologies are available today,
some have not yet been widely utilized
because of cost or other issues. We expect,
however, that this will change as automakers
seek to ramp up fleet efficiencies to meet
mandates.
Our view is that compared to hybrids, plug-
in hybrids or electric vehicles, improvements
to conventional vehicles will likely be a more
cost-effective approach for improving light-
duty vehicle efficiency through 2030. It’s a
matter of affordability and scale – making
incremental and economical improvements
to the millions of conventional cars that
make up the vast majority of new-car sales
is expected to have a greater overall impact
than revolutionary and costly changes in
new cars with technologies that as of yet
have not proven capable of significantly
penetrating the market.
0 10 20155 3025 35
improvement in mileage
Improving today’s vehicle
Engine
Transmission
Body andAccessories
Total
Percent Improvement in Miles per Gallon Aerodynamics
Turbocharging
LightweightMaterials
CylinderDeactivation
CamlessValves
Air ConditioningEfficiency
6 Speedand
7 Speed
ContinuouslyVariable
Transmission
Improved Tires

20 exxonmobil.com
ExxonMobil’s interest in cars and trucks goes far beyond the
fuel tank. Using our expertise not only in fuels and lubricants,
but also in chemicals and plastics, we are advancing new
technologies to make vehicles more fuel efficient.
Conventional vehicle efficiency improvements will be a key in
reducing the demand for personal transportation fuel demand
intheOECDby2030.
Some of our technologies are already on the road. For example:
• Workingwithmajortiremanufacturers,ExxonMobil
developed a new tire-lining technology that uses up to 80
percent less material in the manufacturing process, making tires
lighter and keeping them properly inflated. A car with under-
inflated tires burns up to an extra tank of gasoline every year.
• ExxonMobilhasdevelopedlightweight plastics for car
parts such as bumpers and fuel tanks. Lighter vehicles use
less fuel; for every 10 percent drop in vehicle weight, fuel
economy improves by 7 percent. ExxonMobil is a leading
supplier of polyolefinic polymers used in the manufacture of
plastic car parts.
• WeintroducedMobil 1 Advanced Fuel Economy, a
lower-viscosity synthetic motor oil. Lower viscosity means less
energy is required to circulate the oil in the engine. Mobil AFE
can improve fuel economy by up to 2 percent versus motor oils
most commonly used.
These ExxonMobil technologies may not get much notice from
drivers, but they can add up to significant fuel savings. For
example, if all vehicle tires on the road in the United States retained
air pressure as well as tires made with our new technology, it
would save more than 700 million gallons of fuel annually.
By enabling cars and trucks to travel farther on a gallon of fuel,
drivers not only spend less money per mile, they also emit
less CO2 per mile.
Reducing emissions associated with transportation is one of the
key long-term challenges outlined in The Outlook for Energy. In
the United States, transportation accounted for 33 percent of all
energy-related CO2 emissions in 2008, second only to electric
powergeneration,accordingtotheDepartmentofEnergy.
In addition to technologies available today, ExxonMobil
also is researching advanced engine technologies that
could make the internal-combustion engine more efficient,
and developing innovations that could advance hybrid and
hydrogen-powered vehicles.
Thinking outside
the tank

The Outlook for Energy: A View to 2030 21
The industrial sector is the second-largest
demand sector, behind power generation. In
2005, it accounted for nearly 30 percent of
global energy usage.
Heavy industry and chemicals make up the
majority of industrial demand. These two
sub-sectors will account for 90 percent of the
growth in industrial demand through 2030,
which is the result of economic expansion,
concentratedinnon-OECDcountries.
The next largest sub-sector is the energy
industry. Here, energy usage stays about
flat through 2030, even as demand for
the industry’s products is projected to
grow substantially. This achievement is the
result of ongoing efficiency improvements
throughout the industry and a reduction in
natural gas “flaring.”
Broken down by country group, industrial
energy demand increases by nearly
60percentinnon-OECDcountriesfrom
2005 to 2030, with China making up
about 35 percent of that increase. This is
consistent with the robust economic growth
and continued industrialization of the
developing world.
Meanwhile,OECDindustrialenergydemand
is projected to be down slightly from 2005
to 2030, despite a near-term recovery in
demand following the recession. This decline
will be driven by several factors: relatively
mature economies, ongoing efficiency gains
and a decline in heavy manufacturing as a
percentageofOECDeconomies.
Broken down by energy type, oil remains the
largest industrial fuel through 2030 due to
growingnon-OECDdemand.Weseenatural
gas and electricity gaining share while coal
declines, reflecting the shift to less-carbon-
intensive energy sources.
Global industrial demand
2005 2030
HeavyIndustry
2005 2030
Chemical
2005 2030
EnergyIndustry
2005 2030
Other
by sector
Global industrial demand
Quadrillion BTUs
120
100
80
60
40
20
0
Oil
Gas
Coal
Biomass
Electricity/Heat
by fuelQuadrillion BTUs
250
200
150
100
50
01980 20302005
OECD
Non-OECD
by regionQuadrillion BTUs
250
200
150
100
50
01980 20302005
Oil Gas Coal Bio 2ndry1/1/80 46.8 30 26.5 6.8 17.11/1/81 43.9 29.2 26.3 7 17.41/1/82 42.7 28 25.7 7.2 17.21/1/83 41.9 27.9 26 7.6 17.81/1/84 42.5 29.8 27.7 8.2 18.91/1/85 42.4 30.3 27.8 8.2 19.41/1/86 43.5 30.8 27.6 8.4 20.51/1/87 44.5 32 28.8 8.8 20.81/1/88 45.9 33.1 30 8.9 21.71/1/89 46.4 34 30.2 8.3 22.21/1/90 44.8 31 29.3 7.9 25.81/1/91 45.1 31.3 28.3 7.9 26.31/1/92 45.3 30.9 27.1 8.2 26.41/1/93 44 31 27 7.9 26.11/1/94 45.1 31.2 27.5 8.2 25.41/1/95 46.4 33.1 29.3 8.5 25.51/1/96 47.8 34.3 28.7 8.7 25.11/1/97 49.2 35.3 28.2 8.9 25.11/1/98 48.3 35.4 28 8.9 251/1/99 49.6 35.7 25.7 9 25.51/1/00 49.9 37.7 25 9.2 26.71/1/01 51 36.7 24.3 9 26.81/1/02 51.4 37.1 24.9 9.1 27.61/1/03 52.6 38.6 27 9.4 28.81/1/04 54.5 39.2 30.6 9.8 30.11/1/05 55.2 39.8 32.2 10 31.61/1/06 56.6 40.8 34.2 10.4 33.11/1/07 56.2 41.9 36.2 10.8 34.91/1/08 55.2 42 36.9 11.2 35.51/1/09 54.7 40.4 33.3 10.2 32.61/1/10 55.3 41.1 34.3 10.4 33.91/1/11 55.9 42.1 35 10.6 35.21/1/12 56.7 42.9 35.6 10.8 36.81/1/13 57.4 43.5 35.8 10.9 37.81/1/14 57.9 44.1 35.9 11 38.71/1/15 58.4 44.6 35.8 11 39.51/1/16 58.8 45.1 35.8 11.1 40.41/1/17 59.2 45.7 35.6 11.2 41.31/1/18 59.6 46.3 35.5 11.3 42.21/1/19 59.9 47 35.3 11.4 431/1/20 60.3 47.7 35.1 11.5 441/1/25 62.7 51.9 34.3 12 48.61/1/30 65.3 56.1 33.5 12.5 53.7
OECD Non OECD1/1/80 64.5607 62.65431/1/81 62.1489 61.58041/1/82 58.1205 62.6951/1/83 57.4426 63.73971/1/84 61.0036 65.99621/1/85 61.0815 67.13621/1/86 60.5684 70.12071/1/87 62.8367 72.06431/1/88 64.7114 74.85581/1/89 63.9762 77.14531/1/90 63.1283 75.74691/1/91 62.7292 76.23011/1/92 62.8626 75.04961/1/93 62.4078 73.58991/1/94 64.5308 73.02281/1/95 65.8874 76.97181/1/96 67.5776 77.01981/1/97 69.2132 77.55961/1/98 68.4165 77.2521/1/99 68.9909 76.6051/1/00 70.8415 77.76781/1/01 68.9998 78.70051/1/02 69.0421 81.11171/1/03 69.3716 87.04621/1/04 70.4059 93.84041/1/05 69.7822 99.03471/1/06 70.3738 104.7931/1/07 71.0483 108.9231/1/08 69.6417 111.3261/1/09 62.2052 109.0031/1/10 62.4725 112.5781/1/11 63.3762 115.4471/1/12 64.4712 118.3761/1/13 64.7286 120.7341/1/14 64.7607 122.8471/1/15 64.8073 124.4551/1/16 64.9304 126.2151/1/17 65.0266 127.9551/1/18 65.1751 129.6481/1/19 65.2651 131.41/1/20 65.36 133.1561/1/25 65.4861 144.1661/1/30 65.6498 155.593
"2005" "2030"Heavy Ind 79.2 110.7Chem 38.2 54.4Energy Ind 36.9 37.6Other 14.4 18.5
Data as of 12/02/2009
Data as of 10/28/2009

22 exxonmobil.com
ExxonMobil is successfully reducing emissions from its
own operations. In 2008, we achieved a global reduction of
10 million metric tonnes of greenhouse gas emissions – about
a 7 percent decline from 2007.
We reduce emissions by increasing efficiency in our day-to-
day operations, using new energy efficiency technologies and
reducing flaring.
• Efficiency. Since the launch of our Global Energy
Management System in 2000, ExxonMobil has identified
opportunities to improve efficiency by 15 percent to 20 percent at
our refineries and chemical plants. We have already implemented
about 60 percent of these. Over the past several years, efficiency
at our refining and chemicals operations has improved at a rate
two to three times faster than the industry average.
• Cogeneration. ExxonMobil continues to expand its use of
cogeneration – a process in which we produce electricity to
power our operations while also capturing heat to make steam
needed to transform raw materials into consumer products.
ExxonMobil is an industry leader in this highly efficient form
of energy production, with interest in about 100 cogeneration
facilities in more than 30 locations worldwide. In 2008, we
added 125 megawatts of power capacity, with the startup
of new facilities at our refinery in Antwerp, Belgium. With
new facilities under construction, we expect to increase our
cogeneration capacity to more than 5 gigawatts by 2011.
• Flare Reduction. Across our operations, we are working
to reduce flaring of gas that has no economic outlet as
well as gas that is flared as a result of maintenance or
unexpected operating events. In 2008, we reduced upstream
flaring by about 30 percent, and we plan further reductions
of more than 20 percent over the next several years
compared to 2008 levels.
Since 2004, we have invested more than $1.5 billion in
activities to increase efficiency and reduce emissions. We plan
to spend at least $500 million more over the next few years.
ExxonMobil believes that energy efficiency is the most powerful
tool for meeting the central challenge outlined in The Outlook
for Energy: how to meet rising demand for energy while also
reducing the impact of energy use on the environment.
In addition to improving efficiency and reducing emissions
at our own operations, ExxonMobil also is developing
technologies to help consumers do the same. This is
important because while about 10 percent of petroleum-
related greenhouse gas emissions are from industry
operations, 90 percent are from consumer use of petroleum.
Managing
emissions

The Outlook for Energy: A View to 2030 23
Growing demand for electricity, and the fuels
used for power generation, is a major trend
of the last 25 years, and will remain so for the
next 25 years as living standards continue
to improve worldwide and more people gain
access to electricity.
Powergenerationisthelargestenergy-demand
sector and the fastest-growing – rising at an
average of approximately 1.7 percent a year –
and will account for about 40 percent of all
energy demand, up from 36 percent in 2005
and 26 percent in 1980. This will support
strong increases in global electricity demand,
which will be about four times higher than 1980.
Electricity demand rises at a much faster rate
innon-OECDcountries,reflectingtheirfaster
economic growth and relatively low electricity
penetration to date.
What fuels will be used to generate this
electricity? Through 2030, there is a shift
away from coal toward natural gas, as well
as to nuclear and renewable fuels. This will
be driven by environmental policies, including
ones that seek to reduce emissions by
putting a cost on carbon emissions.
By 2030, we expect that 40 percent of the
world’s electricity will be generated by
nuclear and renewable fuels.
Projectingthefuturemixoffuelsforpower
generation is a complex task with many
variables. As part of this process, we must
consider how these fuels will compete
economically, because these are the real-life
factors that utilities and power generators
look at when considering which fuels to use
or what types of new power plants to build.
Electricity use is growing rapidly
by sector
Electricity use is growing rapidly
Residential
Commercial
HeavyIndustry
OtherIndustry
Transportation
Thousands of Terrawatt Hours
30
25
20
15
10
5
01980 20302005
40%
by generationThousands of Terrawatt Hours
1980 20302005
30
25
20
15
10
5
0
Renewables
Nuclear
Oil
Coal
Gas
Thousands of Terrawatt Hours
30
25
20
15
10
5
0
by region
1980 20302005
United States
Europe
Asia Pacific
OECD
China
OtherAsia Pacific
Other
Non-OECDOther
Dat
a as
of 1
0/28
/200
9
By 2030, about 40 percent of the
world’s electricity will be generated
by nuclear and renewable fuels.
The Outlook for Energy: A View to 2030 23

24 exxonmobil.com
In the United States, absent any policies
that impose a cost on CO2 emissions, we
would expect coal and natural gas to be the
lowest-cost options for future, new-build
power plants.
But policies that impose a cost on carbon
would sway these economics. Coal, being
the most carbon-intensive fuel, would
increase in price more than natural gas.
At $30 per ton of CO2, natural gas would
become the most economic alternative for
new-build power plants. This is where we
expect CO2 costs may evolve over the
next 10 years.
As the CO2 price increases, we would expect
to see fuel switching from coal to natural
gas. This will happen by running existing
natural gas plants at higher load factors, as
well as by building new natural gas plants
and retiring old coal plants.
At $60 per ton, natural gas is still very
competitive. In addition, nuclear and wind are
now competitive, which is why we include
strong growth for both in our Outlook.
Carbon capture and storage (CCS), a
process in which CO2 emissions are
captured before they can enter the
atmosphere, holds promise in the future.
However, even with CO2 emissions priced
at $60 per ton, new-build plants with CCS
remain challenged and very expensive –
meaning a less affordable source of
electricity for consumers. This high cost,
combined with the need to build a regulatory
framework for CO2 storage, presents
significant challenges for its use over the
next two decades beyond government-
subsidized demonstration projects.
Likewise, solar energy faces significant
hurdles to becoming economically
competitive in this time frame. The cost of
capturing solar energy in photovoltaic cells or
concentrators remains generally unaffordable
for large, commercial applications.
Electricity generation cost
Baseload plants are electric power plants that run continuously to meet minimum electricity demand requirements, while peaking power plantsrun intermittently to meet seasonal and daily peak electricity demand.
* Wind and solar exclude additional costs for intermittency and transmission investments ** With carbon capture and storage technology
U.S. baseload plants, startup 2025
Electricity generation cost
Coal Gas Nuclear Wind* Coal/CCS**
Gas/CCS**
Solar*
No CO2 Cost
Coal Gas Nuclear Wind* Coal/CCS**
Gas/CCS**
Solar*
At $30 per Ton
Coal Gas Nuclear Wind* Coal/CCS**
Gas/CCS**
Solar*
At $60 per Ton
Cost per Kilowatt Hour in 2009 Cents20
15
10
5
0
20
15
10
5
0
20
15
10
5
0
Climate policies that put a “cost”
on CO2 emissions will shift the
economics of fuels used for power
generation. Natural gas, nuclear
and wind stand to benefit.

The Outlook for Energy: A View to 2030 25
Through 2030, the global energy-demand
picture is clear: Expansion and progress,
particularlyinnon-OECDcountries,willboost
the need for energy in all four end-use sectors –
power generation, transportation, industrial
and residential/commercial. Even assuming
significant gains in efficiency, this will stack up to
a significant increase in global energy demand
to 2030 – an average 1.2 percent a year.
What types of supplies will we use to meet this
rising need for energy through 2030?
Fossil fuels – oil, natural gas and coal – will
continue to meet most of the world’s needs
during this period, because no other energy
sources can match their availability, versatility,
affordability and scale. The fastest-growing
of these fuels will be natural gas, because
it is the cleanest-burning. By 2030, global
demand for natural gas will be more than
55 percent higher than it was in 2005.
Nuclear power will also grow significantly to
support increasing needs for power generation.
Wind, solar and biofuels will grow sharply
through 2030, at nearly 10 percent per year on
average. However, because they are starting
from a small base, their contribution by 2030
will remain relatively small at about 2.5 percent
of total energy.
No single fuel can meet our energy challenges.
To satisfy projected increases in global energy
demand to 2030 – and ensure reliable and
affordable energy to help meet our interlocking
social, economic and environmental challenges –
we will need to expand all economic fuel sources
through 2030.
Technology will play a key role. Many do not
realize that energy already is a high-tech
industry. New innovations and improvements
in energy technology continue to advance the
potential for all sources of energy.
Global energy demand and supply
Industrial
Transportation
Oil
Gas
Coal
Nuclear
Biomass
Hydro, GeoWind, Solar, Biofuels
Power Generation
Residential/Commercial
by sector
Global energy demand and supply
by energy type
1980 2030
Quadrillion BTUs Quadrillion BTUs
700
600
500
400
300
200
100
0
700
600
500
400
300
200
100
02005 1980 20302005
0
100
200
300
400
500
600
700Res/Comm
Industrial
Transportation
PowerGen
1/1/301/1/251/1/201/1/191/1/181/1/171/1/161/1/151/1/141/1/131/1/121/1/111/1/101/1/091/1/081/1/071/1/061/1/051/1/041/1/031/1/021/1/011/1/001/1/991/1/981/1/971/1/961/1/951/1/941/1/931/1/921/1/911/1/901/1/891/1/881/1/871/1/861/1/851/1/841/1/831/1/821/1/811/1/80 0
100
200
300
400
500
600
700Wind, Solar, Biofuels
Hydro/Geo
Biomass/Other
Nuclear
Coal
Gas
Oil ex bio
1/1/301/1/251/1/201/1/191/1/181/1/171/1/161/1/151/1/141/1/131/1/121/1/111/1/101/1/091/1/081/1/071/1/061/1/051/1/041/1/031/1/021/1/011/1/001/1/991/1/981/1/971/1/961/1/951/1/941/1/931/1/921/1/911/1/901/1/891/1/881/1/871/1/861/1/851/1/841/1/831/1/821/1/811/1/80
ExxonMobil scientists and engineers use
3-D seismic technology to locate oil and
natural gas deposits with greater accuracy
and a smaller environmental footprint.

26 exxonmobil.com
Today, fossil fuels provide the majority of
the world’s energy, led by oil and then coal
and natural gas. Biomass and nuclear
come next, followed by hydroelectric and
geothermal power. Wind, solar and biofuels
combine for a very small share.
In 2030, fossil fuels remain the
predominant energy sources, accounting
for nearly 80 percent of demand. Oil still
leads, but natural gas moves into second
place on very strong growth of 1.8 percent
a year on average, particularly because
of its position as a favored fuel for power
generation.
Other energy types – particularly nuclear,
wind, solar and biofuels – will grow sharply,
albeit from a smaller base.
Other reputable sources, including the
U.S. Government’s Energy Information
Administration and the International
Energy Agency, share a similar view of
this supply picture.
Total global energy demand through 2030
is expected to rise by about 160 quadrillion
BTUs. All of this growth will occur in non-
OECDcountries;OECDdemandisexpected
to be slightly lower in 2030 versus 2005.
Through 2030, one of the most important
“fuels” of all will be energy saved through
improved efficiency. Energy saved through
efficiency gains will reach about 300
quadrillion BTUs per year by 2030, which
is about twice the growth in global
energy demand through 2030. Most of
the energy saved through efficiency will be in
OECDcountries.
Global energy demand and supplyOil and natural gas
remain essential
through 2030, but
one of the most
important “fuels”
of all will be
energy saved
through improved
efficiency.
2005 2030
OilAverage
Growth RatePer Year
0.8%
2005-2030
TotalEnergyGrowth
AnnualEnergySavings
Non-OECD
Non-OECD
OECD
20302005 2030
Gas1.8%
2005 2030
Global energy demand and supply
Quadrillion BTUs
demand and supply
300
250
200
150
100
50
02005 2030
Nuclear2.3%
2005 2030
Hydro, Geo2.2%
2005 2030
Wind, Solar,Biofuels
9.6%
2005 2030
Biomass0.5%
Coal0.5%
ExxonMobil has partnered
with the National Community
Action Foundation to help
low-income Americans
save money and energy by
weatherizing their homes
through the U.S. Department
of Energy’s Weatherization
Assistance Program.

The Outlook for Energy: A View to 2030 27
Natural gas will provide a growing share of the world’s energy
through 2030. Affordable and abundant, natural gas can help
provide the energy needed for economic and social progress.
And because it burns cleaner than oil and much cleaner
than coal, natural gas is a powerful tool for reducing the
environmental impact of energy use.
ExxonMobil produces more natural gas than any other public
company in the world. We also develop breakthrough
natural gas technologies that make more of this cleaner-
burning fuel available to consumers around the world.
In the United States, ExxonMobil technologies have unlocked
vast new resources of natural gas that previously were
trapped in dense rock formations, as well as other types of
so-called “unconventional” natural gas. These technologies
have resulted in a significant upswing in U.S. natural gas
production, and may have similar applications in other parts
of the world.
• OurMulti-Zone Stimulation Technology (MZST) allows
operators to create fractures in reservoir rock at a more rapid
rate than conventional technology so gas can flow more
easily.UsingMZSTandourFastDrillProcess,ExxonMobil
is increasing recovery and production rates while reducing
development costs and our environmental footprint.
• ExxonMobilhasjoinedwithQatarPetroleumandother
partnerstofurtherdevelopQatar’sNorthField,the largest
non-associated natural gas field in the world. There, we
plan to develop natural gas resources exceeding 150 trillion
cubic feet, which will serve a global customer base.
Liquefied Natural Gas (LNG): ExxonMobil is a global leader in
developing and delivering advanced LNG technologies. These
breakthroughs are creating a “global gas market” that can link
theworld’slargestnaturalgasreserves,suchasthoseinQatar,
with consumers who need them.
• ExxonMobilhelpedpioneeranew class of LNG carriers.
Theseships,calledQ-Max,cancarryupto80percentmore
cargo than conventional LNG carriers, reducing transportation
costs while improving efficiency and reducing emissions.
• Wearebuildingstate-of-the-artLNGreceivingterminalsin
the United States and Europe. In 2009, off the coast of Italy, we
opened the world’s first offshore gravity-based structure
for unloading, storage and re-gasification of LNG. The terminal’s
main structure rests on the seabed in 95 feet of water, about 10
miles offshore, and out of sight of land.
• ExxonMobil,togetherwithitspartners,isproducingnearly
35 million tons per year of LNG. We anticipate increasing our
joint production to almost 65 million tons per year by 2010. And
beyond 2010, we expect this to go up to around 100 million
tons per year.
The most significant single use of natural gas is as a fuel to
make electricity. As The Outlook for Energy shows, the world’s
need for electricity – and the fuels used to produce it – will grow
substantially over the coming decades. Natural gas can help
meet this growing need for electricity.
Natural gas used for electricity can reduce CO2 emissions by
up to 60 percent versus coal, which today is the most popular
fuel for power generation. It also has fewer emissions of sulfur
oxides and nitrogen oxides.
The importance of
natural gas

28 exxonmobil.com
The world’s liquid fuel supply consists mostly
of crude oil, but also includes condensate,
natural gas liquids and biofuels. Liquid fuels
will be especially important for meeting
projected strong growth in transportation
demand through 2030. Nearly all the world’s
transportation runs on liquid fuels because
they provide a large quantity of energy in
small volumes, making them easy to transport
and widely available.
Through 2030, total liquids demand
increasessteadilyto104MBDOE–about
24 percent higher than in 2005.
Tomeetthisdemand,non-OPECsupplies
areprojectedtogrowtoabout67MBDOE,
includingabout3MBDfrombiofuels.Gains
alsoareexpectedin“other”non-OPEC
petroleum, which includes natural gas liquids,
condensate, gas-to-liquids, coal-to-liquids
and refinery gains.
Thegapbetweennon-OPECsuppliesand
total liquids demand – known as the “call on
OPECcrude”–remainsrelativelyflatinthe
nearterm,butthenexpandsto37MBDOEin
2030.Thislevelisachievable,givenOPEC’s
large resource base and continued investment.
Total liquids supply needed in 2030 is about
20MBDOEabove2005.Thisincreasewill
bemetbynon-OPECandOPECliquidsin
nearly equal share.
Meeting this demand in an economic
and environmentally sound manner is an
ongoing task of the global energy industry.
It will require large investments to maximize
yields from mature fields as they naturally
decline, and develop new sources of
supplies in existing development areas as
well as promising new regions.
Global liquids supply grows
2005Supplies
2030Adds Non-
OPEC
Base/Adds
OPEC
Global liquids supply grows
global liquids supply and demandMillions of Oil-Equivalent Barrels per Day
Non-OPEC Crudeand Condensate
Canada Oil Sands
Other Petroleum
BiofuelsLiquids Demand
OPEC Crude
120
100
80
60
40
20
01980 20302010 20201990 2000
~27~28
~34
~37
C+C Sands Cond. Biofuels1/1/80 34646 163 4834 511/1/81 35378 146 5054 571/1/82 36375 165 4997 821/1/83 37203 217 5139 1071/1/84 38733 193 5164 1491/1/85 39029 255 5215 1641/1/86 39005 315 5370 1521/1/87 39371 334 5640 1681/1/88 39285 369 5963 1721/1/89 38395 374 6107 1751/1/90 38533 344 6108 1771/1/91 38072 350 6281 1851/1/92 36952 363 6625 1881/1/93 36070 376 6963 1971/1/94 36627 396 7277 2131/1/95 36968 428 7674 2201/1/96 37942 443 7995 1991/1/97 38581 526 8202 2051/1/98 38684 590 8378 2111/1/99 38672 568 8738 2201/1/00 39493 608 9253 2131/1/01 39966 659 9409 2331/1/02 40829 741 9711 2711/1/03 41492 867 9910 3351/1/04 41847 1002 10501 3801/1/05 41660 1002 11011 4421/1/06 41455 1160 11102 5871/1/07 41520 1215 11405 7541/1/08 41053 1222 12018 10121/1/09 40851 1250 12575 10851/1/10 40472 1300 13175 12341/1/11 40106 1400 13870 13101/1/12 39724 1430 14333 13891/1/13 39462 1510 14669 14611/1/14 39320 1550 15007 15341/1/15 39159 1650 15206 16121/1/16 39439 1860 15465 16611/1/17 39716 2010 15660 17121/1/18 39846 2140 15924 17671/1/19 40176 2310 16112 18241/1/20 40401 2440 16401 18851/1/21 40825 2600 16573 19541/1/22 41067 2720 16762 20291/1/23 41160 2860 16985 21111/1/24 41283 2970 17204 22011/1/25 41354 3110 17584 22991/1/26 41468 3270 17852 24061/1/27 41578 3430 18085 25251/1/28 41624 3590 18284 26591/1/29 41573 3740 18451 28111/1/30 41681 3880 18648 2984
09CP demand1/1/80 626551/1/81 604241/1/82 589531/1/83 587281/1/84 597381/1/85 596521/1/86 613781/1/87 627181/1/88 649741/1/89 658791/1/90 668261/1/91 673171/1/92 680521/1/93 679011/1/94 689931/1/95 705381/1/96 723251/1/97 737921/1/98 743631/1/99 760241/1/00 767461/1/01 773801/1/02 781701/1/03 798461/1/04 827261/1/05 841301/1/06 852331/1/07 860321/1/08 857371/1/09 833851/1/10 845771/1/11 858091/1/12 871331/1/13 882691/1/14 893751/1/15 903981/1/16 913311/1/17 922561/1/18 931691/1/19 940481/1/20 948571/1/21 957661/1/22 966851/1/23 976121/1/24 985481/1/25 994931/1/26 1004151/1/27 1013451/1/28 1022831/1/29 1032311/1/30 104187
2005 Base Non OPEC OPECBase/Adds 84130 8594 11463New technologies – such as floating offshore
platforms that can reach crude oil located
under thousands of feet of water – are helping
meet rising global demand for oil.
Through 2030,
OPECandnon-OPEC
sources will combine
to meet an expected
24%increase
in liquid fuels
demand.

The Outlook for Energy: A View to 2030 29
Natural gas will meet a growing share of
our energy needs through 2030. Given its
abundance and properties as a clean-burning
fuel, expanded use of natural gas in power
generation can serve economic progress and
help advance environmental goals as well.
Total natural gas demand in the United
States and Europe will follow a similar
pattern – dipping in the near term because
of the recession, and then growing
modestly through 2030. Growth averages
about0.8percentperyear.Asia-Pacific
demand grows much more rapidly, at almost
4 percent per year, with demand more than
doubling over the outlook period.
In terms of supply, an important development
has been the expansion of unconventional
natural gas – the result of recent improvements
in technologies used to tap these hard-to-
reach resources. This is particularly the case
in the United States, where it is expected to
satisfy more than 50 percent of demand by
2030. The growth in unconventional supplies
will moderate the need for liquefied natural
gas (LNG) imports in the United States in the
short term.
In Europe, local natural gas production
continues to decline, driving imports from
about 45 percent of total supply in 2005
to about 70 percent in 2030. This shift will
require growth in pipeline imports from Russia
and Caspian countries as well as LNG.
InAsiaPacific,domesticnaturalgas
production – unconventional in particular –
continues to climb, but at a slower pace
thandemand.Asaresult,AsiaPacificwill
need to rely more heavily on gas imports,
especially LNG, which will meet more than
one-third of the region’s demand in 2030.
Natural gas supply and demand balanceNatural gas supply and demand balance
LocalProduction
Imports
LNG
Pipeline
Unconventional
Conventional
Billions of Cubic Feet per Day
120
100
80
60
40
20
0
Asia Pacific
2000 203020202010
LocalProduction
Imports
LNG
Pipeline
Unconventional
Conventional
Billions of Cubic Feet per Day
120
100
80
60
40
20
0
Europe
2000 203020202010
LocalProduction
ImportsLNG
Pipeline
Unconventional
Conventional
Billions of Cubic Feet per Day
120
100
80
60
40
20
0
United States
2000 203020202010
ExxonMobil and Qatar Petroleum’s
Q-Flex and Q-Max ships are fostering a
new “global gas market” that can link the
world’s largest natural gas reserves with
the consumers who need them.
The Outlook for Energy: A View to 2030 29

30 exxonmobil.com
Rising emissions of CO2 and other greenhouse
gases pose significant risks to society and
ecosystems. Since most of these emissions
are energy-related, any integrated approach
to meeting the world’s growing energy needs
over the coming decades must incorporate
strategies to curb emissions and address the
risk of climate change. These strategies will
needtobeimplementedbybothOECDand
non-OECDcountries.
The outlook for energy-related CO2 emissions
is linked directly to the types and amounts of
energy required around the world. By 2030,
global CO2 emissions are likely to be about
25 percent higher than they were in 2005.
While this is a significant increase, it is
substantially lower than the projected
growth in energy demand over the period.
This positive development is the result of
expected gains in efficiency, as well as
a shift over time to a significantly less-
carbon-intensive energy mix – mainly
natural gas, nuclear and wind gaining
share as fuels for power generation.
Natural gas used for power generation
can result in up to 60 percent less CO2
emissions than coal, currently the most
widely used fuel for power generation.
Broken down by end-use sector, power
generation accounts for the largest
share of the growth in CO2 emissions
through 2030. This is not only because it is
the fastest-growing demand sector, but also
because it is the one that relies most heavily
on coal.
Global energy demand and CO2 emissions
Global CO2 emissions will rise by
0.9 percent a year through 2030,
with emissions growing fastest in
the power-generation sector.
Gas
Oil
Coal
1.2%Average Growth per Year
2005 – 2030
Other
energy supply
Global energy demand and CO2 emissions
1980 2030
Quadrillion BTUs
700
600
500
400
300
200
100
02005
Gas
Oil
Coal
0.9%Average Growth per Year
2005 – 2030
CO2 emissions by fuel
1980 2030
Billion Tons
40
30
20
10
02005
Transportation
Industrial
Power Generation
0.9%Average Growth per Year
2005 – 2030
CO2 emissions by sector
1980 2030
Billion Tons
40
30
20
10
02005
Residential/Commercial
C
oal
Oil
G
as
Oth
er1/
1/80
70
.3
128.
1 54
.7
43.3
1/1/
81
70.4
12
3.5
54.3
45
.31/
1/82
70
.7
120.
5 53
.8
46.9
1/1/
83
72.5
12
0 54
.2
49.1
1/1/
84
75.5
12
2.1
58.2
52
.81/
1/85
77
.8
121.
9 60
.1
55.9
1/1/
86
78.4
12
5.5
61.2
57
.61/
1/87
81
.9
128.
2 64
60
1/1/
88
84.6
13
2.8
66.6
62
.31/
1/89
85
.8
134.
7 70
.2
63.4
1/1/
90
86.2
13
6.6
72
64.6
1/1/
91
85.6
13
7.6
74.5
66
.51/
1/92
84
13
9.1
74.2
67
.81/
1/93
84
.1
138.
8 75
.2
68.9
1/1/
94
84.7
14
1 75
.6
70.1
1/1/
95
88.2
14
4.2
78
72.3
1/1/
96
89.7
14
7.8
81.7
74
1/1/
97
89.4
15
0.8
83.1
74
.41/
1/98
89
15
2 83
.6
75.6
1/1/
99
87.3
15
5.4
86.3
77
.41/
1/00
89
.7
156.
4 88
.9
79.5
1/1/
01
90.3
15
7.7
89.2
80
1/1/
02
92.4
15
9.3
91.7
81
.21/
1/03
99
.2
162.
6 95
.5
82.5
1/1/
04
107
168.
3 98
.1
85.3
1/1/
05
112.
3 17
1.1
100.
4 87
.11/
1/06
11
8.8
173
102.
5 89
.21/
1/07
12
4.7
174.
3 10
6 90
.31/
1/08
12
6.3
173.
2 10
7.7
92.6
1/1/
09
117.
5 16
8.2
104.
3 91
.91/
1/10
11
9.9
170.
4 10
7.5
93.9
1/1/
11
122.
3 17
2.7
110.
5 96
.11/
1/12
12
5 17
5.3
113.
6 98
.31/
1/13
12
6.4
177.
4 11
6 10
0.3
1/1/
14
127.
2 17
9.5
118.
2 10
2.4
1/1/
15
127.
9 18
1.5
120.
1 10
4.3
1/1/
16
128.
4 18
3.3
122.
3 10
6.2
1/1/
17
128.
5 18
5.1
124.
6 10
8.3
1/1/
18
128.
5 18
6.8
126.
9 11
0.3
1/1/
19
128.
4 18
8.5
129.
3 11
2.4
1/1/
20
128.
2 19
0 13
1.9
114.
51/
1/25
12
8.1
198.
7 14
4.8
126.
11/
1/30
12
7 20
6.9
156.
9 13
7.6
Cha
rt o
f lef
t, D
ata
as o
f 10/
29/2
009
C
oal
Oil
Gas
1/1/
80
6923
85
66
3123
1/1/
81
6941
82
23
3086
1/1/
82
6966
79
82
3060
1/1/
83
7145
79
22
3079
1/1/
84
7446
80
00
3302
1/1/
85
7677
79
61
3400
1/1/
86
7736
81
85
3457
1/1/
87
8084
82
98
3622
1/1/
88
8344
85
74
3770
1/1/
89
8467
86
76
3974
1/1/
90
8527
87
87
4020
1/1/
91
8463
88
05
4169
1/1/
92
8315
88
59
4153
1/1/
93
8325
88
50
4211
1/1/
94
8381
89
25
4230
1/1/
95
8719
90
29
4368
1/1/
96
8870
92
15
4580
1/1/
97
8844
93
57
4667
1/1/
98
8799
94
60
4703
1/1/
99
8639
96
14
4856
1/1/
00
8883
96
36
4970
1/1/
01
8948
97
00
5004
1/1/
02
9149
97
40
5147
1/1/
03
9824
99
48
5368
1/1/
04
1059
9 10
231
5511
1/1/
05
1112
1 10
443
5640
1/1/
06
1177
3 10
534
5756
1/1/
07
1236
1 10
604
5955
1/1/
08
1251
7 10
591
6055
1/1/
09
1163
7 10
215
5859
1/1/
10
1187
5 10
364
6046
1/1/
11
1211
9 10
518
6219
1/1/
12
1238
8 10
671
6394
1/1/
13
1253
4 10
794
6531
1/1/
14
1261
6 10
909
6655
1/1/
15
1268
8 11
010
6762
1/1/
16
1274
1 11
124
6882
1/1/
17
1274
7 11
235
7008
1/1/
18
1274
7 11
343
7139
1/1/
19
1274
5 11
445
7273
1/1/
20
1272
7 11
539
7416
1/1/
25
1270
0 12
028
8138
1/1/
30
1259
3 12
441
8811
Powr Ind Trans Res/Com1/1/80 5527 6780 3706 25991/1/81 5533 6498 3685 25341/1/82 5534 6292 3667 25161/1/83 5689 6251 3704 25021/1/84 5844 6500 3810 25951/1/85 5978 6514 3889 26581/1/86 6120 6564 4042 26531/1/87 6391 6747 4177 26881/1/88 6603 6973 4364 27491/1/89 6881 7056 4480 27001/1/90 7517 6572 4565 26801/1/91 7655 6453 4617 27121/1/92 7727 6293 4712 25941/1/93 7739 6223 4767 26571/1/94 7798 6291 4877 25701/1/95 7932 6558 5010 26151/1/96 8193 6594 5130 27491/1/97 8321 6654 5254 26381/1/98 8502 6595 5387 24791/1/99 8612 6413 5542 25411/1/00 8908 6397 5636 25471/1/01 9088 6333 5652 25791/1/02 9305 6385 5774 25721/1/03 9840 6726 5914 26611/1/04 10361 7116 6179 26851/1/05 10826 7346 6337 26951/1/06 11285 7642 6490 26461/1/07 11748 7838 6691 26441/1/08 11831 7892 6708 27311/1/09 11148 7391 6490 26821/1/10 11428 7554 6611 26911/1/11 11723 7687 6744 27021/1/12 12042 7816 6878 27171/1/13 12255 7879 6992 27321/1/14 12414 7916 7099 27511/1/15 12577 7925 7192 27671/1/16 12721 7950 7299 27771/1/17 12827 7969 7406 27881/1/18 12934 7984 7511 28001/1/19 13040 7999 7613 28111/1/20 13134 8015 7710 28231/1/25 13659 8158 8181 28681/1/30 14089 8285 8610 2860

The Outlook for Energy: A View to 2030 31
ExxonMobil believes that the broad objective of actions
to address climate change should be to reduce the risk of
serious impacts on society and the environment, while not
harming the contribution of energy to economic development
and expanded prosperity around the world.
As a company with 125 years of experience developing the
technology and infrastructure that delivers the world’s energy,
we believe we have a unique perspective on what types
of conditions are necessary to successfully tackle such a
complex global energy challenge.
Above all, companies, consumers and investors will need a
market environment that provides clear signals to encourage
sensible and broad-based investment in the two most
powerful emissions-fighting tools: improvements to energy
efficiency and the expanded use of lower-carbon fuels such
as natural gas. Continued progress on these fronts will require
trillions of dollars in new investment, and steadfast work on
the creation of new technologies.
Some governments are considering policies that would
impose a “cost” on CO2 emissions. In these cases,
ExxonMobil believes that a revenue-neutral carbon tax
has many advantages over a cap-and-trade system in terms
of achieving our society’s shared goal of reducing emissions
over the long term:
• Acarbontaxcancreate a clear and uniform cost for
emissions in all economic decisions. This price stability
encourages companies to invest in advanced technologies,
and provides a clear incentive for all consumers to increase
efficiency and reduce emissions.
• Acarbontaxavoids the costs and complexity of having
to build a new market for emissions allowances or the need
for new layers of regulators and administrators to manage
this market. It also does not open up significant opportunities
for market manipulation, or require complex and costly
compliance and enforcement systems.
• A carbon tax can be made revenue-neutral. Returning
the tax revenue to consumers through reductions in other
taxes – payroll taxes or a simple dividend – reduces the
burden on the economy, and ensures that government
policy is specifically focused on reducing emissions, not on
becoming a revenue stream for other purposes.
• Becauseglobalparticipationissoimportanttocontrolling
emissions, a carbon tax may be a more viable framework for
engaging participation by other nations.
As The Outlook for Energy shows, curbing greenhouse gas
emissions while also meeting rising energy demand will
require a tremendous global effort, sustained over decades.
Compared with a cap-and-trade system, a carbon tax – by being
predictable, transparent, and comparatively simple to understand
and implement – is a more effective approach for creating the
conditions necessary to achieve emissions-reduction goals.
Options for
carbon policy
The Outlook for Energy: A View to 2030 31

32 exxonmobil.com
Reducing emissions is a global priority. Yet
because different countries are at different
stages in their economic development,
CO2 emissions patterns through 2030 vary
greatlybetweenOECDandnon-OECD
country groups.
Growth in CO2 emissions through 2030
will be dominated by China, India and the
other non-OECD countries. Non-OECD
emissions surpassed OECD emissions in
2004; by 2030, non-OECD countries will
account for two-thirds of the global total.
Meanwhile, OECD emissions will decline
by about 15 percent, and by 2030 will be
down to 1980 levels.
When comparing the CO2 emissions of
OECDandnon-OECDcountries,several
measures can be used – producing very
different results. On a per-capita basis,
2005emissionsintheOECDwereabout
fourtimesthatofnon-OECDcountries,
consistent with the higher per-capita energy
use in that country group. By 2030, this gap
shrinks, but remains significant – at about
two and a half times higher.
When emissions are measured per unit of
economicoutput,however,OECDnations
have much lower levels. This is because
developed nations have relatively productive
economies and are less energy-intensive. By
2030,thisgapalsoshrinks,althoughOECD
nations remain far less energy-intensive than
non-OECDcountries.
CO2 emissions
2005 2030 2005 2030
Non-OECD
OECD
2005 2030 2005 2030
Non-OECD
OECD
OECD
Non-OECD
CO2 emissions
1980 2030
Billion Tons
40
30
20
10
02005
emissions per capitaCO2 emissionsTons per Person
12
10
8
6
4
2
0
emissions per GDPTons per Thousand Dollars of GDPin 2005 Dollars
2.0
1.5
1.0
0.5
0
"2005' "2030"
OECD 11.26 8.76
Non OECD 2.7 3.41
OECD Non OECD
1/1/80 10978 7634
1/1/81 10670 7580
1/1/82 10244 7764
1/1/83 10181 7965
1/1/84 10532 8216
1/1/85 10629 8409
1/1/86 10636 8742
1/1/87 10889 9114
1/1/88 11206 9482
1/1/89 11397 9720
1/1/90 11230 10104
1/1/91 11243 10194
1/1/92 11284 10043
1/1/93 11372 10014
1/1/94 11561 9974
1/1/95 11736 10380
1/1/96 12110 10556
1/1/97 12284 10584
1/1/98 12297 10666
1/1/99 12385 10723
1/1/00 12635 10852
1/1/01 12625 11026
1/1/02 12632 11404
1/1/03 12852 12286
1/1/04 12998 13340
1/1/05 13113 14087
1/1/06 13059 15000
1/1/07 13239 15678
1/1/08 13076 16082
1/1/09 12018 15692
1/1/10 12030 16254
1/1/11 12128 16728
1/1/12 12250 17202
1/1/13 12254 17604
1/1/14 12233 17946
1/1/15 12198 18261
1/1/16 12160 18587
1/1/17 12100 18889
1/1/18 12042 19186
1/1/19 11971 19491
1/1/20 11893 19788
1/1/25 11486 21381
1/1/30 11049 22795
Data as of 10/28/2009
Data as of 10/28/2009
"2005" "2030"
OECD 0.4083 0.2159
Non OECD 1.5554 0.7719
Data as of 10/28/2009
Please check units
Non-OECD countries account for all of
the CO2 emissions growth through 2030,
yet their per-capita emissions remain far
lower than the OECD’s.

The Outlook for Energy: A View to 2030 33
As a result of ongoing efficiency improvements
and a switch to less-carbon-intensive fuels
such as natural gas, CO2 emissions in the
OECDappeartohavealreadypeakedand
are set to trend lower through 2030.
Absolute CO2emissionsintheOECDrose
by about 2 billion tons from 1980 to 2005.
But from 2005 to 2030, we expect them
to fall by about 2 billion tons, and by 2030
be back to about 1980 levels. This is a
noteworthy achievement considering that
OECDeconomicoutputwillhavetripledover
the period and population will have grown by
about 30 percent. This proves it is possible
to achieve economic growth and also reduce
the impact of energy use on the environment.
How has this progress been achieved? To
curb CO2 emissions and still meet rising
energy demand, we have two main tools.
One is improving energy efficiency – doing
the same or more with less energy by
employing advanced technologies and
making smart choices about how we use
energy to fuel vehicles, generate electricity
and power homes and businesses. Another
is reducing CO2 intensity – choosing fuels
that have lower CO2 emissions.
From1980to2005,OECDenergyusage
became both more efficient and less carbon-
intensive. Through 2030, we see this positive
trend continuing. Beyond 2030, further gains
are likely as OECD countries continue to
pursue efficiency and shift to less-carbon-
intensive fuels to help mitigate risks
associated with CO2 emissions.
OECDtransitionstoloweremissions
Tons of CO2 per Billion BTUs
Reducing CO2 Content
Incr
easi
ng E
ffic
ienc
y
1980
2005
2030
OECD transitions to lower emissions
1980 – 2005
Billion Tons
3
2
1
0
–1
–2
–32005 – 2030
improving energy efficiency and CO2 emissionschange in CO2 emissions
12
10
8
6
4
2
060 8040200
Millions of BTUsper ThousandDollars of GDP
Energy per GDP
CO2 Content

34 exxonmobil.com
2005 2010 2015 2020 2025 2030
6.7 billion people
Global economic linkages
Growing technology use and focus
Disparate living standards
Enormous energy needs
Environmental gains and concerns
8 billion people
Non-OECD leadseconomic growth
Significant advancesin technology
Less poverty; livingstandards improve
Global energy needs upalmost 35 percent
Progress onenvironmental goals
ExpandSupply
ImproveEfficiency
MitigateEmissions
Integrated energy solutions

The Outlook for Energy: A View to 2030 35
By 2030, there will be more than 1 billion additional
people on the earth – in total, close to 8 billion people,
all seeking better living standards. Economic expansion
will be key to reducing poverty and improving health
and prosperity, and we expect developing countries
to expand their economies rapidly toward that end.
This will require reliable and affordable energy, driving
demand up by close to 35 percent versus 2005. At
the same time, there is an ongoing need to protect the
environment for future generations.
These interlocking challenges require an integrated set
of solutions. No single source of energy, sector of the
economy or segment of society can solve all of these
challenges. In our view, there are three key elements
related to energy:
• Acceleratinggainsinenergyefficiency,which
conserves supplies, minimizes energy costs and
reduces the growth rate of both energy demand
and emissions
• Expandingtheavailabilityofreliableandaffordable
energy supplies
• Developinganddeployingtechnologytohelp
mitigate the growth of emissions associated
with energy use.
We believe it is prudent to pursue strategies that
address the long-term risks associated with rising
emissions, while keeping in mind the central
importance of energy to the economies of the world.
In this light, it is essential to consider and implement
policies with the lowest overall cost to society. This
requires economy-wide, predictable and transparent
costs to shape business and consumer plans and
investments. Global participation is also critical to
reducing costs and risks.
We must pursue each of these three elements with vigor
if we are to meet our global energy and environmental
challenges. Technology will, as it has in previous
decades, continue to play a critical role in enabling all
three of these areas.
2005 2010 2015 2020 2025 2030
6.7 billion people
Global economic linkages
Growing technology use and focus
Disparate living standards
Enormous energy needs
Environmental gains and concerns
8 billion people
Non-OECD leadseconomic growth
Significant advancesin technology
Less poverty; livingstandards improve
Global energy needs upalmost 35 percent
Progress onenvironmental goals
ExpandSupply
ImproveEfficiency
MitigateEmissions

36 exxonmobil.com
The Outlook for Energy through 2030 – key findings
DemandEconomic recovery and growth, coupled with rising
populations and living standards, will push energy demand
up by 1.2 percent a year on average through 2030.
• By 2030, global energy demand will be almost 35 percent
higher than in 2005. This assumes significant gains in
energy efficiency. Without efficiency improvements,
demand in 2030 could be about 95 percent higher.
• All the growth in demand through 2030 occurs in non-
OECDcountries,whereeconomiesaregrowingmost
rapidly.Non-OECDenergydemandrisesbymorethan
60 percent;demandinOECDcountriesdeclines
slightly even as their economies expand.
• Power generation is the largest and fastest-growing
sector. By 2030, power generation will account for
40 percent of all energy demand.
• Demandfortransportation fuels continues to increase,
due largely to greater use of heavy-duty vehicles (trucks
andbuses).Demandforlight-dutyvehicles(carsand
SUVs) actually plateaus and declines toward 2030.
SupplyTo meet demand through 2030, we will need to expand all
economicenergysources.Demandwillbestrongestforfuels
that can help reduce CO2 emissions, such as natural gas.
• Oil remains the largest energy source through 2030, but
natural gas will move into second place ahead of coal. In
2030, these three fuels will meet close to 80 percent of
global energy needs.
• Natural gas will be the fastest-growing major fuel.
By 2030, demand for natural gas will be more than
55 percent higher than in 2005. Technologies that
have unlocked “unconventional” gas will help satisfy
this demand.
• Nuclear and renewable fuels will see strong growth,
particularly in the power-generation sector. By 2030,
about 40 percent of the world’s electricity will be
generated by nuclear and renewable fuels.
• One of the most important “fuels” of all is energy efficiency.
The energy saved by improved efficiency through 2030 is
larger than from any other single source, including oil.
EmissionsGlobal CO2 emissions will rise by an average 0.9 percent a
year – a significant increase but substantially slower than
the pace of energy-demand growth because of improved
efficiency and a shift toward lower-carbon fuels.
• Non-OECDcountriesaccountforall of the CO2 emissions
growth through 2030, yet their per-capita emissions
remain far lowerthantheOECD’s.
• CO2emissionsintheUnitedStatesandotherOECD
countries are declining, even as their populations and
economiesgrow;by2030,OECDemissionswillbe
approaching 1980 levels.
• Emissions grow fastest in the power-generation sector,
in part because it is the sector that relies most heavily
on coal.
• Beyond 2030, further progress on emissions will require
more aggressive gains in efficiency and/or the use
of less-carbon-intensive fuels. New technologies will
be essential on both fronts.
Improve efficiency. Expand energy supplies. Mitigate
emissions. Develop new technologies. Each of these
solutions will be needed to meet our interlocking energy
challenges through 2030 and beyond.
The Outlook for Energy is available on our Web site at
www.exxonmobil.com.

The Outlook for Energy: A View to 2030 37
Glossary
ExxonMobil’s Outlook for Energy contains global
projections for the period 2005-2030. In the Outlook,
we refer to standard units for the measurement of energy:
BCFD. Billion cubic feet per day. This is used to measure
volumesofnaturalgas.OneBCFDofnaturalgascanheat
approximately 5 million homes in the U.S. for one year. Six
BCFDofnaturalgasisequivalenttoabout1MBDOE.
BTU. British Thermal Unit. A BTU is a standard unit of
energy that can be used to measure any type of energy
source. It takes approximately 400,000 BTUs per day to
run the average North American household.
Gigawatt (GW). A unit of electric power, a gigawatt
is equal to 1 billion watts, or 1,000 megawatts. A
1-GW power plant can meet the electricity demand of
approximately 500,000 homes in the U.S.
MBDOE. Million barrels per day of oil-equivalent. This
term provides a standardized unit of measure for different
types of energy sources (oil, gas, coal, etc.) based on
energy content relative to a typical barrel of oil. One
MBDOEisenoughenergytofuelabout3percentofthe
vehicles on the world’s roads today.

Corporate Headquarters5959 Las Colinas Blvd.Irving, Texas 75039-2298exxonmobil.com
Printed entirely on recycled paper.December 2009 SP-124
Outlook for Energy A View to 2030