Outline - IIT Kanpur - 5... · 12/1/2015 1 DliRi l kti "9th Capacity Building Programme for...
25
12/1/2015 1 D l i R i l kti "9th Capacity Building Programme for Officers of Electricity Regulatory Commissions“ 21‐22 Nov. 2015 at IIT Kanpur 24‐26 Nov. 2015 at Singapore Developing a Regional power mark et in South Asia Anoop Singh Associate Professor Dept of Industrial and Management Engg. IIT Kanpur • Energy and Socio‐economic development Outline • Drivers • Status and Opportunities for Electricity Trade • International experience • Cross Border Electricity Trade in SA • Strategy for South Asia • Conclusions
Transcript of Outline - IIT Kanpur - 5... · 12/1/2015 1 DliRi l kti "9th Capacity Building Programme for...

12/1/2015
1
D l i R i l k t i
"9th Capacity Building Programme for Officers of Electricity Regulatory Commissions“
21‐22 Nov. 2015 at IIT Kanpur 24‐26 Nov. 2015 at Singapore
Developing a Regional power market in South Asia
Anoop SinghAssociate Professor
Dept of Industrial and Management Engg.IIT Kanpur
• Energy and Socio‐economic development
Outline
• Drivers
• Status and Opportunities for Electricity Trade
• International experience
• Cross Border Electricity Trade in SA
• Strategy for South Asia
• Conclusions

12/1/2015
2
Energy and Socio‐economic Development
Per capita electricity consumption in South Asia
So: WDI (2015), RGoB (2012), CEA (2015)

12/1/2015
3
Electricity Consumption and Economic Growth
11 0
12.0Energy - GDP Relationship (log scale)
India
Pakistan
Sri Lanka7.0
8.0
9.0
10.0
11.0
BangladeshNepal
Pakistan
4.0
5.0
6.0
3.0 4.0 5.0 6.0 7.0 8.0 9.0 10.0 11.0 12.0
Electricity Consumption and Human Development Index
Europe & CA6000
7000
009)
Bhutan
China
World
2000
3000
4000
5000
6000
ita Electricity Consumption (2
Afghanistan
Bangladesh
Bhutan
IndiaMaldives
NepalPakistan
Sri LankaSouth Asia
0
1000
0.35 0.45 0.55 0.65 0.75 0.85
Per Cap
Human Development Index (2011)

12/1/2015
4
Access to Electricity in South Asia (2011, So: WD)
Drivers for Energy Cooperation in South Asia

12/1/2015
5
Power outages in firms in a typical month (number)
So: WDI (2015)
Economic growth continues to suffer
Value lost due to electrical outages
Countryelectrical outages(As a % of sales)
Afghanistan (2007) 6.49
Bangladesh (2007) 10.56
Bhutan (2009) 4.33
India (2006) 6.62
So: World Development Indicators (2013)
( )
Nepal (2009) 26.95
Pakistan (2007) 9.16
Sri Lanka (2011) 3.0

12/1/2015
6
Concerns for Energy Security
60
70Net energy import (2010)
3.0 16.9 9.0
59.0
12 1
25.1 24.0
43.9
24.8
8.6 10
20
30
40
50
60
Net
ene
rgy
impo
rt(%
of e
nerg
y u
se)
2010
12.1 0
So: World Development Indicators, 2013
Economic Integation in South Asia –Share of Merchandise Trade
70.0
Share of Trade with South AsiaMerchandise exports within
20.0
30.0
40.0
50.0
60.0
Percentage
Share
pSouth Asia
Merchandise import within South Asia
0.0
10.0
12/1/2015
7
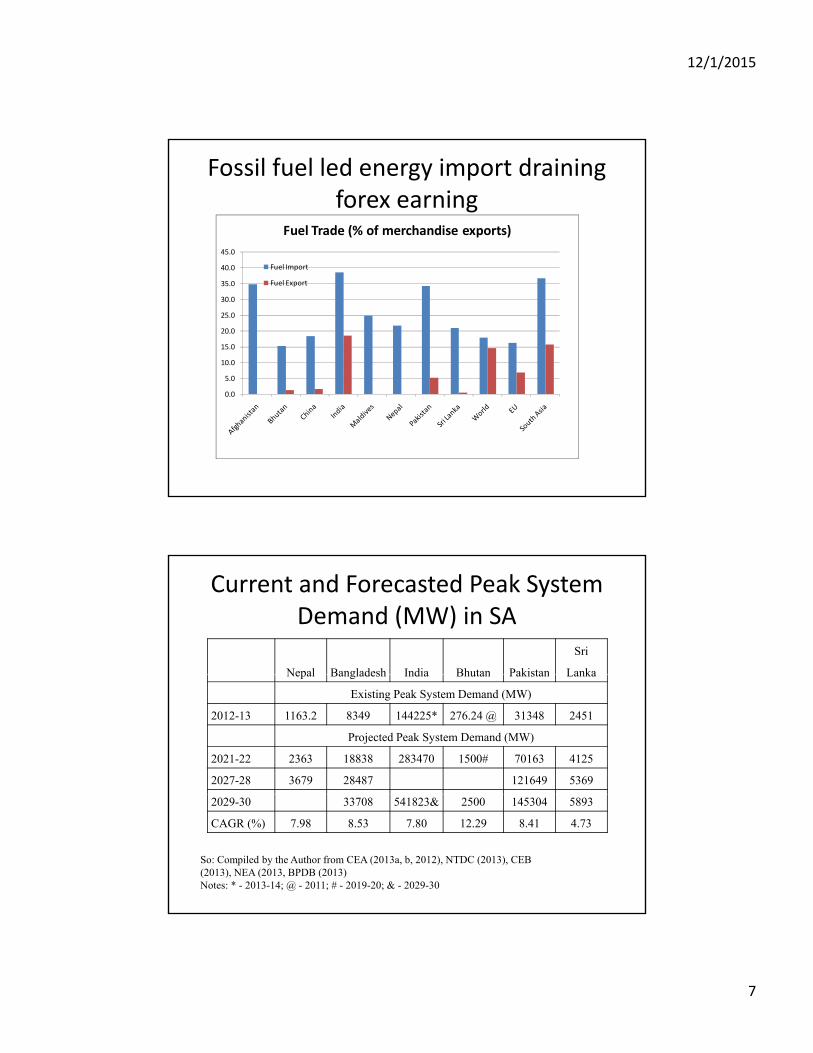
Fossil fuel led energy import draining forex earning
45.0
Fuel Trade (% of merchandise exports)
5 0
10.0
15.0
20.0
25.0
30.0
35.0
40.0 Fuel Import
Fuel Export
0.0
5.0
Nepal Bangladesh India Bhutan Pakistan
Sri
Lanka
Current and Forecasted Peak System Demand (MW) in SA
Nepal Bangladesh India Bhutan Pakistan Lanka
Existing Peak System Demand (MW)
2012-13 1163.2 8349 144225* 276.24 @ 31348 2451
Projected Peak System Demand (MW)
2021-22 2363 18838 283470 1500# 70163 4125
2027-28 3679 28487 121649 5369
2029-30 33708 541823& 2500 145304 5893
CAGR (%) 7.98 8.53 7.80 12.29 8.41 4.73
So: Compiled by the Author from CEA (2013a, b, 2012), NTDC (2013), CEB (2013), NEA (2013, BPDB (2013)Notes: * - 2013-14; @ - 2011; # - 2019-20; & - 2029-30

12/1/2015
8
Coal Oil Natural Gas Biomass Hydropower*
C t(million
t )(million b l )
(trillion cubic f t)
(million t ) (Gi tt )
Energy Resource Endowments in South Asia – An Indicator for Potential Trade?
Country tons) barrels) feet) tons) (Gigawatts)
Afghanistan 440 NA 15 18–27 25
Bhutan 2 0 0 26.6 30
Bangladesh 884 12 8 0.08 0.33
India 90,085 5,700 39 139 150
Maldives 0 0 0 0.06 0
N l NA 0 0 27 04 83Nepal NA 0 0 27.04 83
Pakistan 17,550 324 33 NA 59
Sri Lanka NA 150 0 12 2
Total 108,961 5,906 95 223 349.33
Source: ADB (2012), SAARC Secretariat (2010),CWC (2005), WAPDA (2011)
• Improve Quality of Life (Human Development Index)
S t i bl E A t All (2012 UN’
Common Energy Sector Goals for South Asia
• Sustainable Energy Access to All (2012 – UN’s
“International Year of Sustainable Energy for All”)
• Improve energy security
• Optimal utilisation of region’s energy resources
• Greater economic and energy cooperationgy p
• Share best practices in the energy sector

12/1/2015
9
Status of Reform in the Electricity Sector
Installed i
Peak d d
Peak d d
IPPs/Private Sector share in
Electrification
& (%)
Per capita electricity
Electricity Sector in SA – A Status
capacity (MW)
demand met (MW)
demand(MW)
share in installed capacity
(%)
tion access
rate (%)*
T & D (%)electricity consumption (kWh)
Bangladesh 8537 6434 8349 16.35 60 14.36 213
India # 243028 126793 $ 131943 $ 34.0 75 23.65 917
Nepal 720 569.6** 1094.6 33.33 76 25.03 106
Pakistan 23412 13445 18467 35.56 69 17 450
Sri Lanka 3312 2112*** 2146 33.15 85 14 490
Sources: Bangladesh (BPDB, 2014); Nepal (NEA, 2013); Sri Lanka (CBSL, 2013), India (CEA,2014); Pakistan (Kessides, 2013), * IEA (2011), ** excludes electricity imports capacity from India,*** based on 1.2 GW hydro plant not running during drought seasons, # As on March 2014, $ ForMarch 2014
So: Singh et al. (Forthcoming) as WB’s PRWP

12/1/2015
10
Installed Electricity Generation Capacity in India (GW) (As on 31
March 2015)
CountryNominal generation
market structure
Initiation of private ownership and/or participation:
Introduction of legally
independent regulator
Transmission ArrangementGenera-
tionTrans-
missionDistri-bution
Status of Electricity Sector Reform
AfghanistanVertically integrated
monopolyVertically integrated
BangladeshMultiple sellers, single
buyer1992 2003
Unbundled transmission
owner
BhutanMultiple sellers, single
buyer2009 @ 2002*, 2010**
Vertically integrated
IndiaCompetition with
organized trading and power exchanges
1991 2000
1999 (Orissa);
2002 (Delhi)
1996 (Orissa); 1998 (national)
Independent system operator
( )
NepalMultiple sellers, single
buyer1992
PPP mode
(Year?)
1994/2011
(ETFC Independence?)
Vertically integrated
PakistanMultiple sellers, single
buyer1994
1998 (KESC)
1995Unbundled
transmission owner
Sri LankaMultiple sellers, single
buyer1996 2002
Vertically integrated
So: Singh et al. (Forthcoming) as WB’s PRWP

12/1/2015
11
Status and Opportunities for Electricity Trade
Participants Capacity
India – NepalNepal imported 793 GWh electricity in 2013 from India over
l i l i i (Si h 2014)
Status of Electricity Trade in SA
India Nepalmultiple interconnections. (Singh, 2014)
India-Bhutan
Electricity import from Bhutan to India was 5556 GWh in2013-14 (4627 GWh in 2012-13) from Hydro power stationsat Tala, Chukha and Kurichu with a total export led capacityof 1416 MW. (ERLDC, 2014)As per an umbrella agreement between the two countries,India assures a minimum of 5000 MW electricity import by2020.2020.
Pakistan-Iran
Pakistan imported 419 GWh electricity in 2014 from Iran, upfrom 375 GWh in the previous year (NTDC, 2014). A MOU,signed in 2014, could enable Pakistan to import up to 3000MW and electricity costing Pakistan PKRS 3 million permonth.CASA-1000 expected to enhance trade with Central Asia.

12/1/2015
12
Afghanistan-C l A i
Import of 2,246.2 GWh electricity from Iran,Uzbekistan, Turkmenistan, and Tajikistan in 2011.
Status of Electricity Trade in SA (Contd.)
Central AsiaUzbekistan, Turkmenistan, and Tajikistan in 2011.CASA-1000 expected to enhance this trade.
Pakistan-India
Pakistan has submitted a draft MoU to India onimporting electricity using a 1200 MW interconnection.There are also possibilities of CASA-1000 tp beextended up to India.
India-Sri LankaFeasibility studies for a 400-kV India-Sri Lanka havebeen conducted to support import of up to 1000 MWl i i f dielectricity from India.
India-Bangladesh
In 2013, power systems of India and Bangladesh wereinterconnected through a HVDC line that can supportelectricity export of up to 500 MW (expandable to1000 MW in future) from India to Bangladesh based onnegotiated price and market based price.
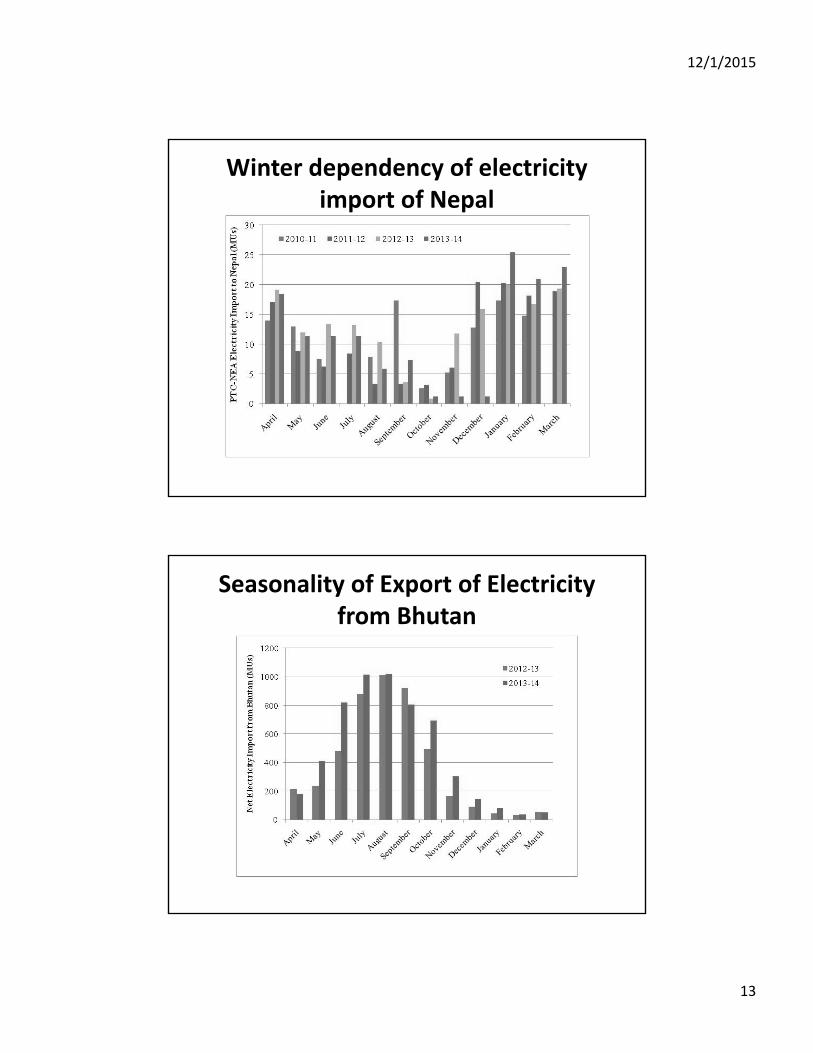
Growing Import Dependency in Nepal
12/1/2015
13
Winter dependency of electricity import of Nepal
Seasonality of Export of Electricity from Bhutan
12/1/2015
14
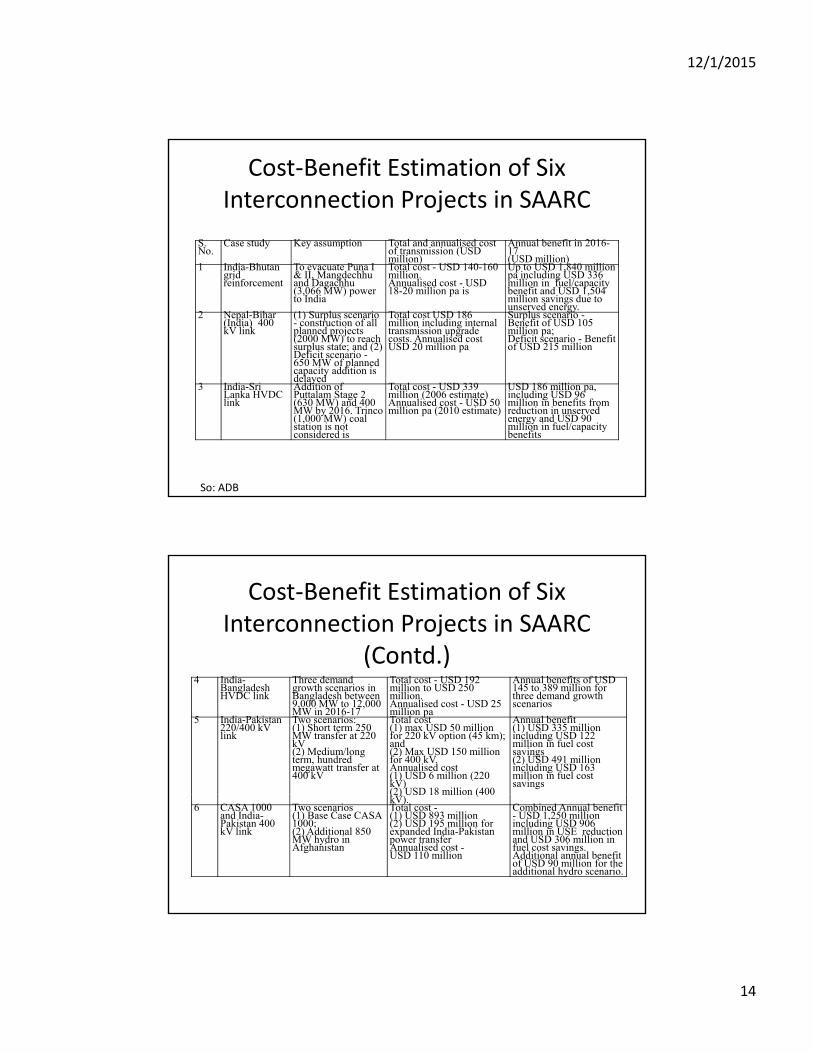
S. No.
Case study Key assumption Total and annualised cost of transmission (USD million)
Annual benefit in 2016-17 (USD million)
Cost‐Benefit Estimation of Six Interconnection Projects in SAARC
million) (USD million)1 India-Bhutan
grid reinforcement
To evacuate Puna I & II, Mangdechhuand Dagachhu(3,066 MW) power to India
Total cost - USD 140-160 million. Annualised cost - USD 18-20 million pa is
Up to USD 1,840 million pa including USD 336 million in fuel/capacity benefit and USD 1,504 million savings due to unserved energy.
2 Nepal-Bihar (India) 400 kV link
(1) Surplus scenario - construction of all planned projects (2000 MW) to reach surplus state; and (2) Deficit scenario -650 MW of planned capacity addition is delayed
Total cost USD 186 million including internal transmission upgrade costs. Annualised cost USD 20 million pa
Surplus scenario -Benefit of USD 105 million pa;Deficit scenario - Benefit of USD 215 million
delayed3 India-Sri
Lanka HVDC link
Addition of Puttalam Stage 2 (630 MW) and 400 MW by 2016. Trinco(1,000 MW) coal station is not considered is
Total cost - USD 339 million (2006 estimate)Annualised cost - USD 50 million pa (2010 estimate)
USD 186 million pa, including USD 96 million in benefits from reduction in unservedenergy and USD 90 million in fuel/capacity benefits
So: ADB
Cost‐Benefit Estimation of Six Interconnection Projects in SAARC
(Contd.)4 India-
Bangladesh HVDC link
Three demand growth scenarios in Bangladesh between 9,000 MW to 12,000 MW in 2016-17
Total cost - USD 192 million to USD 250 million. Annualised cost - USD 25 million pa
Annual benefits of USD 145 to 389 million for three demand growth scenarios
5 India-Pakistan 220/400 kV link
Two scenarios: (1) Short term 250 MW transfer at 220 kV (2) Medium/long term, hundred megawatt transfer at 400 kV
Total cost(1) max USD 50 million for 220 kV option (45 km); and (2) Max USD 150 million for 400 kV. Annualised cost(1) USD 6 million (220 kV)(2) USD 18 million (400
Annual benefit (1) USD 335 million including USD 122 million in fuel cost savings(2) USD 491 million including USD 163 million in fuel cost savings
(2) USD 18 million (400 kV).
6 CASA 1000 and India-Pakistan 400 kV link
Two scenarios (1) Base Case CASA 1000; (2) Additional 850 MW hydro in Afghanistan
Total cost -(1) USD 893 million (2) USD 195 million for expanded India-Pakistan power transfer Annualised cost -USD 110 million
Combined Annual benefit - USD 1,250 million including USD 906 million in USE reduction and USD 306 million in fuel cost savings.Additional annual benefit of USD 90 million for the additional hydro scenario.
12/1/2015
15
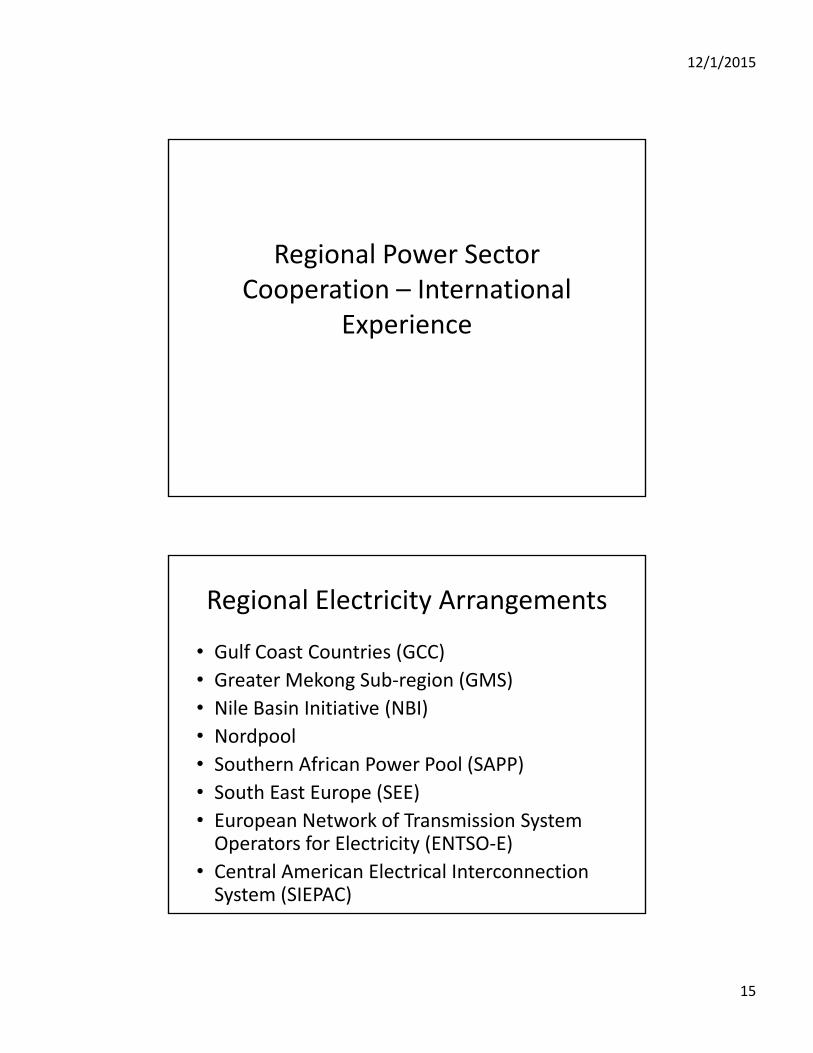
Regional Power SectorRegional Power Sector Cooperation – International
Experience
• Gulf Coast Countries (GCC)
G t M k S b i (GMS)
Regional Electricity Arrangements
• Greater Mekong Sub‐region (GMS)
• Nile Basin Initiative (NBI)
• Nordpool
• Southern African Power Pool (SAPP)
• South East Europe (SEE)South East Europe (SEE)
• European Network of Transmission System Operators for Electricity (ENTSO‐E)
• Central American Electrical Interconnection System (SIEPAC)
12/1/2015
16
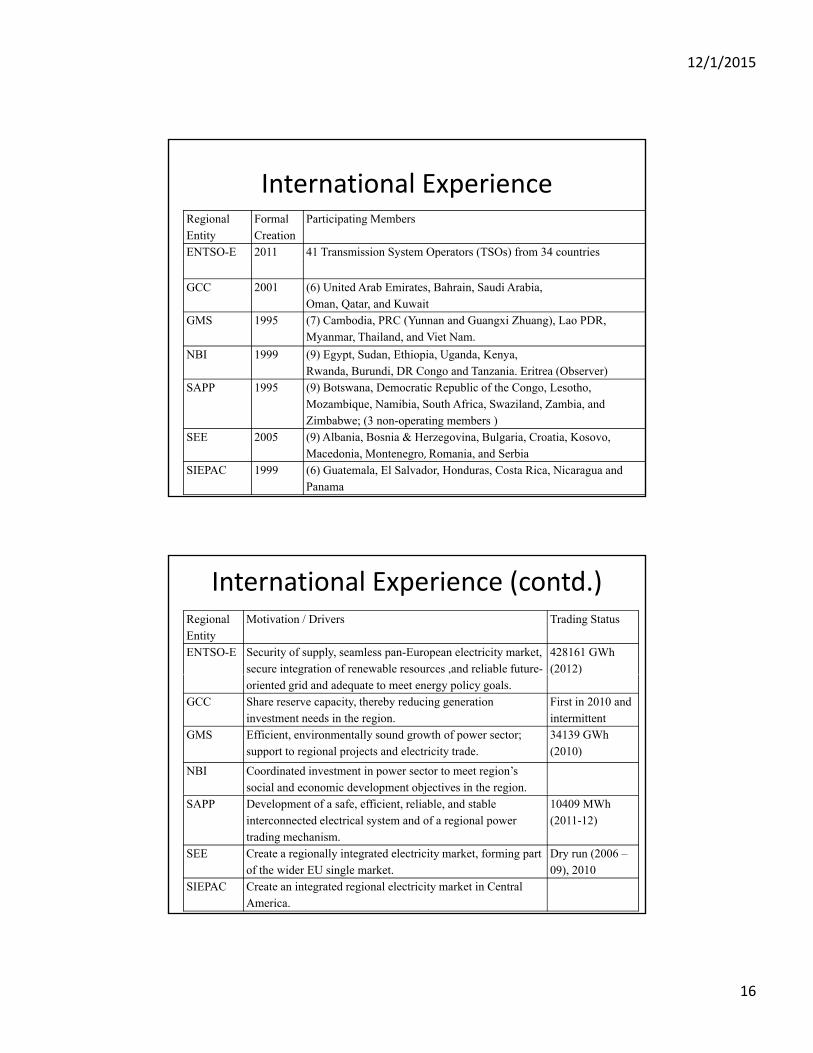
International ExperienceRegional Entity
Formal Creation
Participating Members
ENTSO-E 2011 41 Transmission System Operators (TSOs) from 34 countriesy p ( )
GCC 2001 (6) United Arab Emirates, Bahrain, Saudi Arabia,Oman, Qatar, and Kuwait
GMS 1995 (7) Cambodia, PRC (Yunnan and Guangxi Zhuang), Lao PDR, Myanmar, Thailand, and Viet Nam.
NBI 1999 (9) Egypt, Sudan, Ethiopia, Uganda, Kenya,Rwanda, Burundi, DR Congo and Tanzania. Eritrea (Observer)
SAPP 1995 (9) Botswana, Democratic Republic of the Congo, Lesotho, Mozambique, Namibia, South Africa, Swaziland, Zambia, and Zimbabwe; (3 non-operating members )
SEE 2005 (9) Albania, Bosnia & Herzegovina, Bulgaria, Croatia, Kosovo, Macedonia, Montenegro, Romania, and Serbia
SIEPAC 1999 (6) Guatemala, El Salvador, Honduras, Costa Rica, Nicaragua and Panama
International Experience (contd.)Regional Entity
Motivation / Drivers Trading Status
ENTSO-E Security of supply, seamless pan-European electricity market, secure integration of renewable resources ,and reliable future-
428161 GWh (2012)g
oriented grid and adequate to meet energy policy goals.( )
GCC Share reserve capacity, thereby reducing generation investment needs in the region.
First in 2010 and intermittent
GMS Efficient, environmentally sound growth of power sector; support to regional projects and electricity trade.
34139 GWh (2010)
NBI Coordinated investment in power sector to meet region’s social and economic development objectives in the region.
SAPP Development of a safe, efficient, reliable, and stable interconnected electrical system and of a regional power trading mechanism.
10409 MWh (2011-12)
SEE Create a regionally integrated electricity market, forming part of the wider EU single market.
Dry run (2006 –09), 2010
SIEPAC Create an integrated regional electricity market in Central America.

12/1/2015
17
Import ExportTotal Trade
Net Imports
Electricity Trade in GMS Region (GWh) ‐ 2010
Cambodia 1,546 – 1,546 1,546
Lao PDR 1,265 6,944 8,210 (5,679)
Myanmar – 1,720 1,720 (1,720)
Thailand 6,938 1,427 8,366 5,511
Viet Nam 5,599 1,318 6,917 4,281
PRC 1,720 5,659 7,379 (3,939)
Total 17,069 17,069 34,139
So: ADB, 2012
• SAPP was built upon historical bilateral interconnections in the 1950s and 1960s which witnessed development of
Bilateral to Regional Approach
the 1950s and 1960s which witnessed development of interconnections projects between Democratic Republic of the Congo (DRC) and Zambia, and Zambia and Zimbabwe. Later, in 1975, between Mozambique and South Africa
• GMS’ historical foundations can be traced back to 1971 with export of power from the Nam Ngum hydropower plant (HPP) in Lao PDR to northeast Thailand.
12/1/2015
18
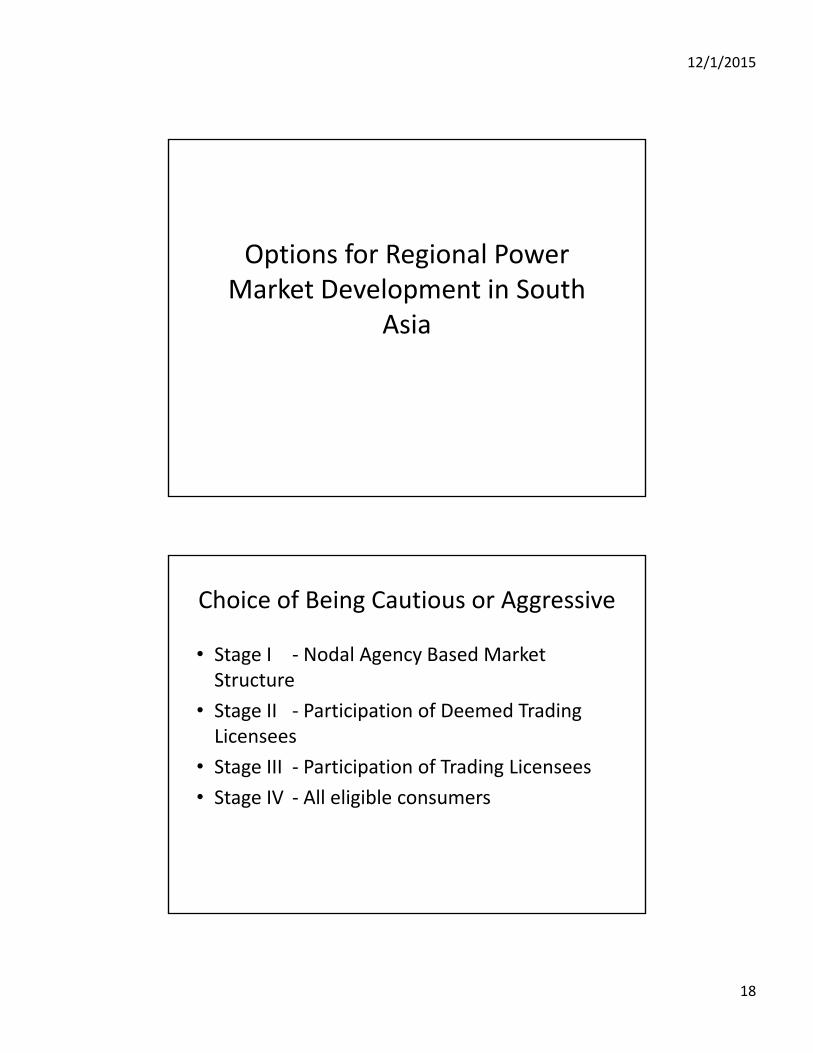
Options for Regional PowerOptions for Regional Power Market Development in South
Asia
• Stage I ‐ Nodal Agency Based Market St t
Choice of Being Cautious or Aggressive
Structure
• Stage II ‐ Participation of Deemed Trading Licensees
• Stage III ‐ Participation of Trading Licensees
• Stage IV All eligible consumers• Stage IV ‐ All eligible consumers

12/1/2015
19
Choice of Being Cautious or Aggressive (Contd.)
Nodal Agencies Trading Licensees Deemed Trading Licensees Eligible Consumers
C C CC C CC C C
G D G
N
G G D G D G
DL1 DL2 DL3
TL2
I II III
TL1
D D G
IV
C C C C C C C C
G – Generator#
D – Distribution Utilities
C – Consumer
N – Nodal Agencies
DL’s – Deemed Licensees*
TL’s – Trading Licensees
# Including Captive Generation *Generators and Distribution Utilities
• South Asian Regional Power Exchange (SARPX) S th A i P E h (SAPX)
Options for Market Design
or South Asian Power Exchange (SAPX)
• “Regional Contracts” on the Power Exchanges in India
• New 'Market Areas' on the Indian Power ExchangesExchanges
• Volume and/or Price coupling of All Power Exchanges across South Asia

12/1/2015
20
New 'Market Areas' on the Indian Power Exchanges
Nepal 1 Nepal 2 Bhutan
Afghanistan Pakistan 1
Pakistan 2
p p
Bangladesh 1 Bangladesh 2
India (12 Market Areas)
Sri Lanka
Towards Regional Power Market Development in South Asia
12/1/2015
21
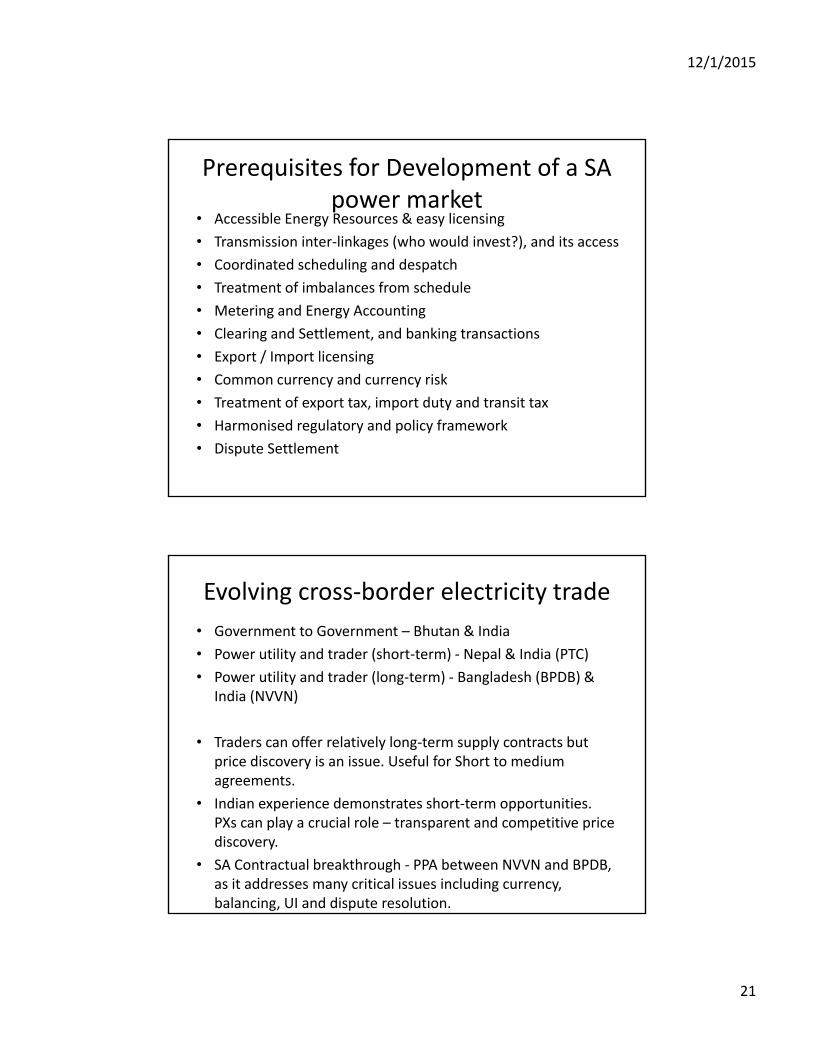
• Accessible Energy Resources & easy licensing
• Transmission inter‐linkages (who would invest?), and its access
Prerequisites for Development of a SA power market
• Coordinated scheduling and despatch
• Treatment of imbalances from schedule
• Metering and Energy Accounting
• Clearing and Settlement, and banking transactions
• Export / Import licensing
• Common currency and currency risk• Common currency and currency risk
• Treatment of export tax, import duty and transit tax
• Harmonised regulatory and policy framework
• Dispute Settlement
• Government to Government – Bhutan & India
• Power utility and trader (short‐term) ‐ Nepal & India (PTC)
• Power utility and trader (long term) Bangladesh (BPDB) &
Evolving cross‐border electricity trade
• Power utility and trader (long‐term) ‐ Bangladesh (BPDB) & India (NVVN)
• Traders can offer relatively long‐term supply contracts but price discovery is an issue. Useful for Short to medium agreements.
• Indian experience demonstrates short‐term opportunities. PXs can play a crucial role – transparent and competitive price discovery.
• SA Contractual breakthrough ‐ PPA between NVVN and BPDB, as it addresses many critical issues including currency, balancing, UI and dispute resolution.

12/1/2015
22
S. No.
Key Changes
SHORT TERM MEASURES1
Key regulatory/legal changes needed to facilitate cross‐border trading
MEDIUM TERM MEASURES1 Deemed trading licenses1
Nodal agency for cross-border trading/ Access to PX
2Investment framework
3Regulation of Power Procurement
from a PX
4
1 Deemed trading licenses2 Open access in transmission
3Regulatory guidelines
4 Commercial mechanism to Settle imbalances
5Transmission charges
6Grid code
74Settling imbalances
5 Duties and taxes6 Commerce trading license
restrictions7 Dispute resolution8 Tariff determination
7Transmission plan
LONG TERM MEASURES1
Trading license to other parties
2Open access in distribution
So: Singh (2013) – Project Report Submitted to ADB
Approach to Develop Regional Power Market
• Socialising initial investment in cross‐border inter‐connections backed by medium/long‐term bilateral between governments/government entities.g /g
• Early demonstrated ‘benefits’ to bring in political acceptability.
• From ‘power exchange’ to ‘Power Exchange’.
• Different stage of reform and unbundling– Accommodate differences in terms of licensing and market access
i l i i l• Long‐term regional transmission plan
• Regional coordination forum to harmonise technical, and regulatory framework.
• Dispute settlement mechanism

12/1/2015
23
• Coordinated Investment in Generation (South Asia Power Generation Co Ltd.?)
• Agreement for transit of (hydro) power between India
'Disruptive' Suggestions on the table!
• Agreement for transit of (hydro) power between India and Bangladesh reciprocated with easing physical congestion at the chicken’s neck for setting up transmission linkages.
• Multi‐country owned cross‐border transmission interconnections to reduce exposure to financial andinterconnections to reduce exposure to financial and operational risk. (South Asia Power Transmission Co Ltd.?)
• Regional mechanism/forum for coordination and dispute resolution.
Thank You
www.iitk.ac.in/ime/anoops

12/1/2015
24
Output
Anoop Singh, Tooraj Jamasb, Rabindra Nepal, and Michael Toman,
Cross‐Border Electricity Cooperation in South Asia, World Bank Policy
Research Working Paper (PRWP) #7328
http://documents.worldbank.org/curated/en/2015/06/24687043/cro
ss‐border‐electricity‐cooperation‐south‐asia
Published
Anoop Singh & Michael Toman, , International Experiences in Regional
Electricity Market Development: Lessons for South Asia. World Bank
Policy ResearchWorking Paper (PRWP)
Drafts under
reviewPolicy Research Working Paper (PRWP) review
Anoop Singh & Michael Toman, Benefits of and Barriers to Regional
Electricity Cooperation: A Review of the Literature. World Bank Policy
Research Working Paper (PRWP)
Anoop Singh, Options for Market Design and Strategy for Developing a
Regional Electricity Market in South Asia.
Selected Readings (some accessible from www.iitk.ac.in/ime/anoops)
• “Towards a Competitive Market for Electricity and Consumer Choice in Indian Power Sector”, Energy Policy Vol. 38 4196‐4208, 2010. (Elsevier)
• “A Market for Renewable Energy Credits in the Indian Power Sector”, Renewable and Sustainable Energy Review journal Elsevier 2009and Sustainable Energy Review journal, Elsevier, 2009.
• “Economics, Regulation and Implementation Strategy for Renewable Energy Certificates in India” in India Infrastructure Report 2010, Oxford Univ. Press.
• “Analysing Efficiency of Electric Distribution Utilities in India: a Data Envelopment Analysis” (with Dilip Kumar Pandey), IAEE International Conference, Stockholm 19‐23 June, 2011.
• “Modelling Economic Efficiency of Renewable Energy Policies: A Multi‐State M d l F I di ” A t d f W ld R bl E C 17 19 O tModel For India”, Accepted for World Renewable Energy Congress, 17‐19 Oct. 2011, Bali, Indonesia. (with Sundeep Chowdary).
• “Economics of Iran‐Pakistan‐India Natural Gas Pipeline: Implications for Energy Security in India”, Economic & Political Weekly, V. XLIII, No. 7 2008.
• “Power Sector Reform in India: Current Issues and Prospects”, Energy Policy, Elsevier, Volume 34, Issue 16, November 2006.

12/1/2015
25
• “Estimating the Impact of Restructuring on Electricity Generation Efficiency: The Case of the Indian Thermal Power Sector”, NBER Working Paper 17383, 2011 ( ith M L C Al d Li d K bi M lik)
Selected Readings (Contd.)
2011 (with Maureen L. Cropper, Alexander Limonov and Kabir Malik)
• “Analysing Efficiency of Electric Distribution Utilities in India: a Data Envelopment Analysis” (with Dilip Kumar Pandey), IAEE International Conference, Stockholm 19‐23 June, 2011.
• “Directions for Effective Regulation for Renewable Energy: An Analysis of Renewable Energy Certificates”, India Energy Security Summit: Energy Security for a sustainable future, 3‐4 March 2011, New Delhi, IPPAI.
“A C i l J A i d l f l i i d C• “At a Crucial Juncture: A perspective on development of electricity and REC markets in India”, 3 years of Indian Energy Exchange: Vision and Views of Industry Leaders, 2011, Powerline / IEX, New Delhi.
• “Economics, Regulation and Implementation Strategy for Renewable Energy Certificates in India” in India Infrastructure Report 2010, Oxford Univ. Press.
• “A Policy for Improving Efficiency of Agriculture Pump sets in India: Drivers, Barriers and Indicators”, Climate Strategies, UK, Working Paper
Selected Readings (Contd.)
2009
• “Climate Co‐benefit Policies for the Indian Energy Sector: Domestic Drivers and North‐South Cooperation”, Climate Policy 9 (5) 529‐543 2009
• “Informal Markets for Electricity: Economics of lighting for Hawkers in India”, International Journal of Energy Sector Management: Special Issue on India, 3(3), 308‐323, 2009.
• “A Market for Renewable Energy Credits in the Indian Power Sector”, Renewable and Sustainable Energy Review, Elsevier, 2009.
• “Rural Electrification in India: Economic and Institutional aspects of Renewables”, with James Cust and Karsten Neuhoff, EPRG WP 0730, University of Cambridge, UK., 2007