Out-of-School Time - youthprise.org · Introduction and Overview This report looks specifically at...
17
Commissioned by OCTOBER 2015 Out-of-School Time Participation Gap Study: Saint Paul Minneapolis 1
Transcript of Out-of-School Time - youthprise.org · Introduction and Overview This report looks specifically at...

Commissioned by
OCTOBER 2015
Out-of-School Time Participation Gap Study:
Saint Paul
Minneapolis
1

OST PARTICIPATION GAP STUDY
Participation of Low-Income Twin Cities Youth in Free or Low-Cost Out-of-School-Time Programs
Table of ContentsForeword from Youthprise ................................................................................................................3
Acknowledgements ..............................................................................................................................3
Introduction and Overview .................................................................................................................... 4
OST Programs: Participation, Not Just Availability ........................................................................5
Methods .......................................................................................................................................................5
Minneapolis ............................................................................................................................................... 6
Methodology .......................................................................................................................................... 6
Minneapolis Findings ............................................................................................................................7
Saint Paul ................................................................................................................................................... 9
Methodology .......................................................................................................................................... 9
Saint Paul Findings ..............................................................................................................................10
Key Findings across Minneapolis and Saint Paul ............................................................................... 13
Implications for Action ........................................................................................................................... 15
References ................................................................................................................................................. 17
Appendix ................................................................................................................................................... 17
Analysis Options ....................................................................................................................................... 17
Implications ........................................................................................................................................... 17
2

Foreword from Youthprise
The OST opportunity gap—loosely defined as poor access to quality learning opportunities, which could mean not enough programs or slots, or lack of transportation–poses a threat to our ability to really engage young people beyond the classroom.
Youthprise commissioned this study to provide a picture of the participation gaps in access to out-of-school time learning opportunities in the Twin Cities metropolitan area. The study serves as a baseline and will be updated periodically to determine whether our collective e!orts have been successful in increasing access to learning opportunities beyond the classroom, especially for youth who have been traditionally underserved.
Youthprise invests in the future of Minnesota by investing in youth from underserved communities. Rapidly changing demographics throughout the state, and particularly in the Twin Cities, have heightened disparities for people of color. In coming decades, the strength of our cities and our economy will depend on making sure that all members of our diverse community have opportunities to thrive.
Youthprise works on multiple levels: supporting nonprofit organizations that serve youth; aligning e!orts through citywide and statewide initiatives; and providing opportunities directly to young people.
Acknowledgements
This report represents a unique collaboration between Wilder Research and Rainbow Research. Together, they partnered with the City of Saint Paul’s Out-of-School-Time (OST) initiative, Sprockets, Saint Paul Public Schools, and Minneapolis Public Schools and the Minneapolis Afterschool Network of the Youth Coordinating Board, with support from Youthprise.
Rainbow Research: Rebecca Saito, Anna Rodell, Barry Cohen Rainbowresearch.org
Wilder Research: Megan Chmielewski, Craig Helmstetter Wilder.org/Wilder-Research/Pages/default.aspx
University of Minnesota: Dale Blyth
3
Introduction and Overview
This report looks specifically at the participation rates in out-of-school-time (OST) programming of lower-income youth, ages 11 to 18. It provides a snapshot in time of the participation rates of 10,093 older Minneapolis and Saint Paul youth from lower-income families in free or low-cost OST programs.
Participation in high-quality OST programs can lead to positive outcomes in school performance, and it can help to ensure that young people acquire the attitudes and skills1 needed to succeed in the 21st century.
This report represents an important milestone in a long-running journey of using citywide data to study the availability of OST programs and to set participation goals to ensure that all young people, including young people from lower-resourced families and communities, participate in high-quality OST programming.
As many parents of school-aged children already know, OST programs and activities are divided into two
1 See for instance: National Research Council. Commu-nity Programs to Promote Youth Development. Washington, DC: The National Academies Press, 2002; and Durlak, J.A., Weiss-berg, R.P., et al (2011). The impact of enhancing students’ social and emotional learning: A meta-analysis of school-based univer-sal interventions. Child Development, 82(1).
distinct tiers: one that is fee-based and market-driven for those who can a!ord it (such as club sports or private lessons and camps); and one that is free or low-cost.
This is a study that looks specifically at OST programs that are free or low-cost—that are accessible to anyone regardless of ability to pay. These OST programs and activities are typically run by nonprofits that are heavily subsidized by private foundations, United Way and public-sector funds. Their missions often include serving youth from lower-income families or from specific cultural groups. Programs are delivered by myriad youth-serving organizations, including national groups such as YMCA, YWCA, and Boys and Girls Clubs; public entities such as community education, public libraries, and parks and recreation departments; and nonprofit community-based organizations (CBOs).
These OST youth programs provide regularly scheduled, structured and supervised learning opportunities outside the typical school day.
4
OST Programs: Participation, Not Just Availability
Previous studies (Saito, Benson, Blyth, 1995, Walker and Saito, 2011, Sprockets, 2013-14) looked at the availability of OST programs in Minneapolis and Saint Paul, mapping program locations across zip codes, to examine whether poor availability or unequal distribution of programs contributed to low participation rates.
Studies showed, however, that close proximity to OST programs did not guarantee that young people would participate. For example, Saito (2006) identified 21 youth-serving organizations in and around the borders of the Whittier neighborhood in south Minneapolis, but found that very few of these organizations served Whittier youth.
We hope these data will contribute to discussion, decisions and action about how we can work together to ensure that all young people in the Twin Cities, including those from lower-income families and communities, participate in high-quality OST programs.
Also, by sharing our learnings, we hope to spur other communities to invest in collecting citywide participation data that will inform action plans to reach participation goals for under-served youth.
Methods
Defining and Calculating Participation Rates
Since the goal of this study was to focus attention on the participation of low-income youth in OST programs, we calculated participation rates by: (1) identifying the number of low-income youth participating in OST programs, and (2) dividing that by the total number of low-income youth in the area. “Youth” were defined as children age 11-18. “Low-income” was operationalized as eligibility for Free or Reduced Lunch (FRL). Children are FRL eligible if their family income falls below 185 percent of the Federal Poverty Level.2
We were not able to collect perfect data for either the numerator or the denominator of the participation-rate calculation. For example, the complete universe of OST programs is unknown; we likely missed some of the smaller CBO programs that specialize in serving low-income children and certainly did not collect data on low-income children who might have participated in more expensive fee-based programs. The actual methods and limitations di!ered by city, as outlined below. Regardless of these limitations, we believe that this study constitutes the best assessment to date of OST participation by low-income children across Minneapolis and Saint Paul.
Minneapolis data were collected during the 2012-2013 school-year. In Saint Paul, data were pulled from the 2013-2014 school year when several key partner organizations began providing data to their citywide intermediary, Sprockets.
2 �/�i�wÀÃÌ�ÃÌi«����Ì��Ã�ÃÌÕ`Þ�Ü>Ã�Ì��>ÀÀ�Ûi�>Ì�>�V������`iw��-tion of participation rate. The team of researchers from Wilder Research, ,>��L�Ü�,iÃi>ÀV�]�Ì�i�1��ÛiÀÃ�ÌÞ��v�����iÃ�Ì>�>�`�9�ÕÌ�«À�Ãi�V��Ã�`iÀi`�Ì�Àii�Ü>ÞÃ�Ì��V>�VÕ�>Ìi�«>ÀÌ�V�«>Ì����À>ÌiÃ�Ì�>Ì�>Ài��ÕÌ���i`����Ì�i�>««i�-dix.
5

Methodology On behalf of Youthprise, Rainbow Research, Inc. studied the OST participation rates of youth ages 11 to 18 in Minneapolis. The goals of the study were to better understand geographic, family income and racial disparities that a!ect the opportunities for Minneapolis youth to participate in OST programming.
Sample Data on youth OST participation were gathered from youth-serving organizations in Minneapolis during the 2012-13 school year. Youth with a home address within the geographic boundaries of the city of Minneapolis were included in the analysis.
Data on youth were gathered through outreach to 81 youth-serving organizations in Minneapolis. Each organization was asked to provide the following information for each youth enrolled in their programs during the 2012-2013 school year: first name, last name, date of birth (preferred) or age, gender, race/ethnicity, home address, and name and location of OST program. FRL eligibility was also requested but was not always available.
Of the 81 organizations contacted, 25 provided data for 7,470 participating youth. The largest database was provided by Minneapolis Community Education, a division of Minneapolis Public Schools. It included data on 1,477 individual OST program o!erings. The other 24 community-based organizations provided data from a total of 95 OST programs. All data were from youth between the ages 11 to 18, who lived in Minneapolis and were enrolled in at least one OST program in Minneapolis during the 2012-2013 school year. Data cleaning included deletion of duplicate entries from the final data set ensuring an unduplicated count of youth.
Limitations At the time of data collection, no single entity collected and updated a comprehensive list of youth-serving organizations in Minneapolis. Previously, the Youth Coordinating Board (YCB) collected this information
through the What’s Up hotline, and now YCB’s Minneapolis Afterschool Network provides an online citywide program finder.
Limitations of the Minneapolis data were based on lack of existing infrastructure for collecting data on youth OST participation, limited participation in the study by community-based OST organizations, and data consistency and accuracy.
Two of the largest OST program providers in Minneapolis were unable to share data for this study. The Minneapolis Parks and Recreation Board (MPRB) is prohibited by state statute from sharing participant-level information with outside agencies. Hennepin County Library did not collect patron data for most of its youth programs. (In Minneapolis, MPRB and the library are separate entities, while in Saint Paul these systems are under the purview of the Mayor’s O"ce.)
Minneapolis, MN
6
As noted, only 25 of 81 organizations shared youth OST participant data. Six of the organizations contacted indicated they could not participate because they didn’t collect or retain demographic data. Seven organizations expressed concerns about liability in data confidentiality and privacy. Forty-three organizations never replied or followed through. These data do not include low-income students attending private schools, charter schools, or open-enrolling outside of the Minneapolis district.
Due to these limitations, estimates of participation made here are likely to underestimate the actual levels
of participation in free or low-cost programs and of participation overall (since participation in fee-based programs is not included).
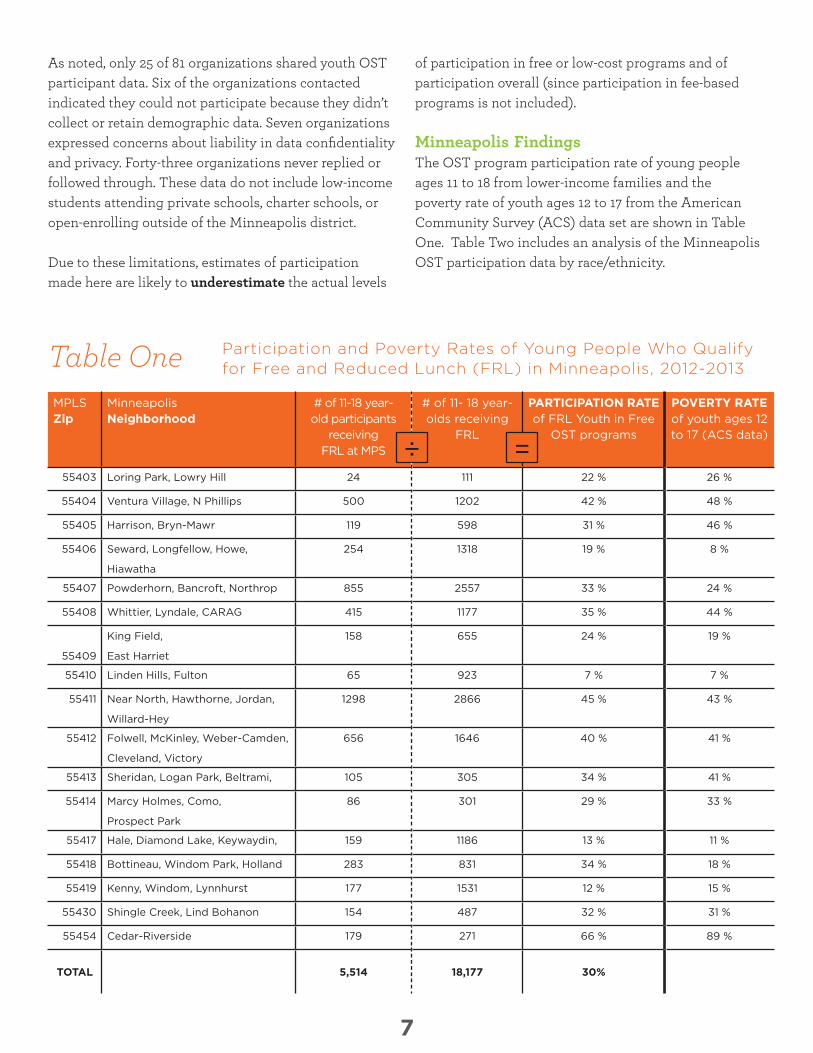
Minneapolis Findings The OST program participation rate of young people ages 11 to 18 from lower-income families and the poverty rate of youth ages 12 to 17 from the American Community Survey (ACS) data set are shown in Table One. Table Two includes an analysis of the Minneapolis OST participation data by race/ethnicity.
Table One MPLS Zip
Minneapolis Neighborhood
# of 11-18 year-old participants
receiving FRL at MPS
# of 11- 18 year-olds receiving
FRL
PARTICIPATION RATE of FRL Youth in Free
OST programs
POVERTY RATE of youth ages 12 to 17 (ACS data)
55403 Loring Park, Lowry Hill 24 111 22 % 26 %
55404 Ventura Village, N Phillips 500 1202 42 % 48 %
55405 Harrison, Bryn-Mawr 119 598 31 % 46 %
55406 Seward, Longfellow, Howe,
Hiawatha
254 1318 19 % 8 %
55407 Powderhorn, Bancroft, Northrop 855 2557 33 % 24 %
55408 Whittier, Lyndale, CARAG 415 1177 35 % 44 %
55409
King Field,
East Harriet
158 655 24 % 19 %
55410 Linden Hills, Fulton 65 923 7 % 7 %
55411 Near North, Hawthorne, Jordan,
Willard-Hey
1298 2866 45 % 43 %
55412 Folwell, McKinley, Weber-Camden,
Cleveland, Victory
656 1646 40 % 41 %
55413 Sheridan, Logan Park, Beltrami, 105 305 34 % 41 %
55414 Marcy Holmes, Como,
Prospect Park
86 301 29 % 33 %
55417 Hale, Diamond Lake, Keywaydin, 159 1186 13 % 11 %
55418 Bottineau, Windom Park, Holland 283 831 34 % 18 %
55419 Kenny, Windom, Lynnhurst 177 1531 12 % 15 %
55430 Shingle Creek, Lind Bohanon 154 487 32 % 31 %
55454 Cedar-Riverside 179 271 66 % 89 %
TOTAL 5,514 18,177 30%
Participation and Poverty Rates of Young People Who Qualify for Free and Reduced Lunch (FRL) in Minneapolis, 2012-2013
7
÷ =

Key Findings:
9�In this snapshot of participation, the majority of lower-income young people across the city are not participating in OST programs, with an overall participation rate of 30% in free or low-cost programs.
9�Only one zip code, 55454 in the Cedar-Riverside neighborhood, had a participation rate over 50% (66%). The area is home to a large contingent of African-born residents and has the highest poverty rate (89%) of the areas included in the study. It is served by a large nonprofit and park program.
9�Participation rates are slightly higher in higher-poverty neighborhoods, suggesting that OST programs are doing a good job of targeting the communities most in need.
9�The lowest participation rates are seen in higher-income ZIP codes (55410 Linden Hills, 55419 Lynnhurst) where low-income youth may have access to other kinds of programs or simply not participating.
Table Two race/ethnic group
# of 11-18 year-old participants receiving
FRL at MPS
# of 11- 18 year-olds receiving FRL
PARTICIPATION RATE of FRL Youth in
Free OST programs
African American 3127 7510 42%
Latino(a) 1016 3096 33%
Asian American 509 1523 33%
American Indian 270 850 32%
Caucasian 468 5124 9%
Key Findings:
9�The participation rate of low-income African American young people was 42%, followed by Latino(a), Asian American, and American Indian at 33%, 33%, and 32%, respectively.
9�The participation rate of low-income Caucasian youth in free and low-cost programs was only 9%.
Participation Rate of Low-Income Minneapolis Youth by Race/Ethnicity
8
÷ =

Methodology Since fall of 2011, Sprockets has contracted with Wilder Research to maintain a longitudinal database of OST participation in Saint Paul. The goal of the database is two-fold: to better understand the demographics and attendance patterns of youth attending OST programming in Saint Paul, and to provide youth-serving organizations with a tool to improve their data tracking and increase use of data in their decision-making. Participation in the Sprockets Database is voluntary for youth-serving organizations, and it is not tied to funding. Wilder Research also has a data-sharing agreement with Saint Paul Public Schools (SPPS) to obtain enrollment information, including Free and Reduced Lunch (FRL) eligibility. Aggregate information from the Sprockets database and SPPS has been shared with the community in part to improve outreach to underserved youth populations.
Sample In 2011, organizations submitted a letter of interest asking to join the database, and Sprockets accepted organizations in “cohorts” of 10 to 15 at a time. In 2013, Sprockets moved to open admission, allowing any organization to join the data system as long as it could demonstrate ability to collect the information used in the database (such as youth names and daily attendance). Organizations enter information throughout the school year and data can be pulled at any point for internal, program-level, or citywide reports.
All of these criteria significantly narrowed the sample to 4,589 youth. Most of the excluded youth were younger, attended charter schools or participated in in-school activities or Non-Saint Paul programming. Through the data-sharing agreement with SPPS, Wilder had birthdate, race, gender, Census tract, and FRL status for all youth in the sample.
Thirty-nine organizations tracked Saint Paul OST participation in the Sprockets database in 2013-2014. Most partners were community-based organizations (CBOs), but SPPS, Saint Paul Parks & Recreation, and Saint Paul Public Libraries also tracked their youth in the system. Participants from these three larger organizations made up a significant portion (53%) of the sample.
Limitations A limitation of the Saint Paul data set is that participation in the database is voluntary and not tied to funding. Consequently, some youth-serving organizations choose not to use the system, and others may have gaps in their data tracking due to sta! turnover or other circumstances. Sprockets and Wilder Research make an e!ort to connect with these organizations and, where needed, to include their data in the data system via uploads from internal databases and spreadsheets.
More than 27,000 youth were tracked in the Sprockets
database in the 2013-2014 school year and the following summer.
For the purpose of this report, the sample was limited to youth in the data system who:
1) Were ages 11 to 18 as of 9/1/2013,2) Attended at least one day of Saint Paul-based OST
programming between 9/1/2013 and 8/31/2014,3) Were Saint Paul Public School (SPPS) students,4) Lived in Saint Paul (per SPPS data), and5) Did not opt out of being included in evaluation
reports.
Saint Paul, MN
9

Another limitation is that, while Sprockets has a data-sharing agreement with SPPS, it does not have similar agreements with Saint Paul charter schools, which serve a significant portion of Saint Paul’s youth population, or the private schools that serve children from Saint Paul. Consequently, Wilder and Sprockets do not know the FRL status of youth from those schools and did not include them in the sample.
Saint Paul Findings The participation rates of young people ages 11 to 18 from lower-income families and the poverty rate of youth ages 12 to 17 from the American Community Survey (ACS) data set are shown in Table Three by Census Tract. Table Four includes an analysis of the Saint Paul OST participation data by race/ethnicity.
Table Three
Saint Paul Census Tract and Neighborhood
# of 11-18 year-old participants receiving
FRL at MPS
# of 11- 18 year-olds receiving
FRL
PARTICIPATION RATE of FRL Youth in Free
OST programs
POVERTY RATE of youth ages 12 to 17 (ACS data)
301.00 Saint Anthony Park 11 29 38% 8%
302.01 Como 8 42 19% 18%
302.02 Como 10 18 56% 0%
303.00 Como 20 51 39% 17%
304.00 North End 129 328 39% 14%
305.00 North End 227 635 36% 54%
306.01 Payne-Phalen 178 501 36% 45%
306.02 Payne-Phalen 48 189 25% 9%
307.02 Greater East Side 62 222 28% 6%
307.03 Greater East Side 68 279 24% 14%
307.04 Greater East Side 57 257 22% 54%
308.00 North End 156 372 42% 21%
309.00 Payne-Phalen 109 318 34% 43%
310.00 Payne-Phalen 102 332 31% 39%
311.00 Payne-Phalen 64 241 27% 38%
312.00 North End 55 90 61% 7%
313.00 North End 70 216 32% 72%
314.00 North End 71 210 34% 69%
315.00 Payne-Phalen 124 270 46% 50%
316.00 Payne-Phalen 122 408 30% 51%
317.01 Dayton’s Bluff 101 259 39% 42%
317.02 Greater East Side 210 541 39% 64%
318.01 Greater East Side 103 335 31% 38%
318.02 Greater East Side 59 193 31% 51%
319.00 Saint Anthony Park 16 33 48% 32%
320.00 �>����i���`Ü>Þ 19 59 32% 14%
321.00 �>����i���`Ü>Þ 24 57 42% 35%
322.00 �>����i���`Ü>Þ 22 54 41% 18%
323.00 �>����i���`Ü>Þ 25 76 33% 49%
2013-2014 Participation and Poverty Rates of Youth Who Qualify for Free and Reduced Lunch (FRL) in Saint Paul by Census Tract
10
÷ =

Saint Paul Census Tract and Neighborhood
# of 11-18 year-old participants receiving
FRL at MPS
# of 11- 18 year-olds receiving
FRL
PARTICIPATION RATE of FRL Youth in Free
OST programs
POVERTY RATE of youth ages 12 to 17 (ACS data)
324.00 Thomas-Dale 50 201 25% 26%
325.00 Thomas-Dale 134 386 35% 62%
326.00 Thomas-Dale 110 356 31% 35%
327.00 Thomas-Dale 90 245 37% 21%
330.00 Payne-Phalen 46 120 38% 59%
331.00 Dayton’s Bluff 54 127 43% 79%
332.00 �iÀÀ�>��*>À�]��iÝ��}Ì����>����i 18 38 47% 0%
333.00 �iÀÀ�>��*>À�]��iÝ��}Ì����>����i 7 23 30% 7%
334.00 �iÀÀ�>��*>À�]��iÝ��}Ì����>����i 29 58 50% 24%
335.00 -Õ���Ì�1��ÛiÀÃ�ÌÞ 93 254 37% 59%
336.00 -Õ���Ì�1��ÛiÀÃ�ÌÞ 45 110 41% 54%
337.00 -Õ���Ì�1��ÛiÀÃ�ÌÞ 54 101 53% 34%
338.00 -Õ���Ì�1��ÛiÀÃ�ÌÞ 38 94 40% 31%
339.00 -Õ���Ì�1��ÛiÀÃ�ÌÞ 35 58 60% 67%
340.00 -Õ���Ì�1��ÛiÀÃ�ÌÞ 9 31 29% 44%
342.01 ����� 5 17 29% N/A
342.02 ����� 10 41 24% 7%
344.00 Dayton’s Bluff 55 168 33% 50%
345.00 Dayton’s Bluff 122 352 35% 45%
346.01 Dayton’s Bluff 136 350 39% 52%
346.02 Dayton’s Bluff 103 319 32% 48%
347.01 >ÌÌ�i�Àii����}�Ü��` 87 273 32% 17%
347.02 >ÌÌ�i�Àii����}�Ü��` 70 206 34% 16%
350.00 �iÀÀ�>��*>À�]��iÝ��}Ì����>����i 9 20 45% 0%
352.00 �>V��À�Ûi�>�` 2 10 20% 7%
353.00 �iÀÀ�>��*>À�]��iÝ��}Ì����>����i 18 43 42% 0%
355.00 -Õ���Ì�1��ÛiÀÃ�ÌÞ 2 15 13% 0%
359.00 West Seventh 7 20 35% 100%
360.00 West Seventh 14 37 38% 28%
361.00 West Side 85 160 53% 57%
363.00 �>V��À�Ûi�>�` 1 11 9% 12%
364.00 Highland 6 16 38% 0%
365.00 Highland 6 11 55% 5%
366.00 Highland 11 36 31% 0%
367.00 West Seventh 34 101 34% 4%
368.00 West Seventh 23 54 43% 19%
369.00 West Seventh 26 41 63% 18%
370.00 West Side 29 71 41% 23%
Table Three: Continued
11
÷ =

Saint Paul Census Tract and Neighborhood
# of 11-18 year-old participants receiving
FRL at MPS
# of 11- 18 year-olds receiving
FRL
PARTICIPATION RATE of FRL Youth in Free
OST programs
POVERTY RATE of youth ages 12 to 17 (ACS data)
371.00 West Side 94 201 47% 26%
372.00 West Side 157 310 51% 28%
374.02 >ÌÌ�i�Àii����}�Ü��` 39 131 30% 0%
374.03 >ÌÌ�i�Àii����}�Ü��` 107 286 37% 51%
375.00 Highland 13 30 43% 3%
376.01 Highland 18 45 40% 41%
376.02 Highland 58 166 35% 8%
428.00 Thomas-Dale 119 235 51% 66%
429.00 -Õ���Ì�1��ÛiÀÃ�ÌÞ 26 54 48% 10%
430.00 Highland 5 16 31% 10%
Total 4579 12663 36%
Key Findings:
9�In this snapshot of participation, the majority of lower-income young people across the city are not participating in OST, with an overall participation rate of about 36%.
9�Saint Paul’s West Side which has strong collaboration between OST organizations, has the highest average participation rate for a neighborhood at 49% (although 13% of the individual Census tracks had rates at or above 50%)
9�Low-income youth throughout the city participate at roughly similar rates (4 out of every 5 Census Tract had a participation rate between 20% and 45%)
9�Saint Paul does not have a large di!erence in OST participation rates for low-income youth based on the poverty level of their neighborhood.
9�Some of the lowest participation rates are seen in higher-income neighborhoods (Mac Groveland and Downtown neighborhoods) that have few low-income youth and where low-income youth may have access to other kinds of programs or simply not be participating.
Table Three: Continued
12
÷ =

Table Four
Race/Ethnic group# of 11-18 year-old participants
receiving FRL at MPS# of 11- 18 year-olds
receiving FRLPARTICIPATION RATE of FRL Youth in Free
OST programs
African American 2054 4475 46%
American Indian 78 218 36%
Asian American 1750 5317 33%
�>Ì���>® 610 1925 32%
Caucasian 289 1145 25%
Key Findings:
9�The rate of participation of all racial/ethnic groups of low-income youth was less than 50%.
9�The participation rate of low-income African American young people was highest, followed by American Indian, Asian American, and Latino(a).
9�The participation of low-income Caucasian youth was the lowest at 25%.
Key Findings across Minneapolis and Saint Paul
Roughly one third of youth from lower-income families across Minneapolis and Saint Paul participated in the free and low-cost OST programs that were included in this study. The map below indicates rates of participation, from less than 20% (the lightest orange areas) to more than 47% (the deepest orange areas). Minneapolis participation data is analyzed by zip code while St. Paul data is analyzed by census tract due to availability of data from SPSS. As a result of the finer-grain analysis in Saint Paul, some small areas of high participation are visible. These concentrated “pockets” of participation may exist in Minneapolis as well, but are not visible due to the higher level of aggregation.
Across Saint Paul and Minneapolis we see that the wealthiest communities (e.g., Southwest Minneapolis, and Highland Park and Mac Groveland in Saint Paul), have the lowest participation rates in free and low-cost OST programs. Presumably, this is because higher-income youth have access to costlier fee-for-service programs that are not accessible to lower-income youth. Some lower-income communities that have had targeted e!orts to increase participation (e.g., Saint Paul’s West Side and Minneapolis’ North Side) have higher participation rates, suggesting that programs are reaching the intended audience.
Participation Rate of Low-Income Saint Paul Youth by Race/Ethnicity
13
÷ =

14

Table Five
Race/Ethnic Group
# of 11-18 year-old participants receiving
FRL at MPS
# of 11- 18 year-olds receiving FRL
PARTICIPATION RATE of FRL Youth in
Free OST programs
Mpls Saint Paul Mpls Saint Paul Mpls Saint Paul
African American 3127 2054 7510 4475 42% 46%
Latino(a) 1016 610 3096 1925 33% 32%
Asian American 509÷ 1750 1523 5317 33% 33%
American Indian 270 78 850 218 32% 36%
Caucasian 468 289 5124 1145 9% 25%
Key Finding:
9�Participation rates by race/ethnicity across the Twin Cities are similar, with the exception of low-income Caucasians, who have much lower participation rates in Minneapolis compared to Saint Paul.
Implications for Action
Regardless of how one examines the data, the Twin Cities have a long way to go to ensure that all young people—especially youth from low-income families—have ample access to and strong participation in high-quality OST programs.
Citywide rates of participation among low-income young people ages 11 to 18 in free or low-cost OST programs is 30-36%. These data, albeit with important limitations, are the best snapshot to date about the rates of participation among low-income young people in Saint Paul and Minneapolis.
In the future it will be most helpful to have both cities use the same metrics (e.g., Zip code, Census tract) and to have measurement partners (e.g., Sprockets, YCB, SPPS, MPS) be involved from the start. Further, strong e!orts to support and ensure broader and more comprehensive participation of organizations to collect and share their participant data is essential for understanding who does and does not participate in these growth-enhancing opportunities.
These data can be a springboard for important decisions at multiple levels. For example:
9�Programs/organizations: What do the data say about under-served youth in my neighborhood and how can my program serve them better?
9�Cities: What areas of the city and what populations have higher needs? What can we learn from neighborhoods that are doing unusually well, in spite of high poverty rates?
9�State and Region: How do we create and support an OST research and evaluation agenda with shared metrics? What are the key participation-rate questions and how will they be answered across multiple jurisdictions and platforms?
Who determines ideal community participation rate goals and what should they be? What is the tipping point beyond which youth program participation is the norm for all young people, regardless of where they live, their race/ethnicity or their family income? Most importantly, how do we reach our goals?
15
Participation Rate of Low-Income Minneapolis and Saint Paul Youth by Race/Ethnicity
÷ =

In order to create community-wide agreement on and measurement of desired participation rates and goals, a shared Twin Cities regional system is needed to set goals, gather data, measure progress and establish collaborative processes for communicating, deliberating and making decisions that will benefit all of the region’s youth.
YCB Minneapolis Afterschool Network and Sprockets in Saint Paul have created strong relationships with OST program providers, and e!orts are now well underway to create citywide systems to collect shared data. Strong buy-in and broad, inclusive participation by organizations will be needed to gather sound, useful and more complete data. Collecting community-level participation estimates is a complex endeavor. It requires consensus about what is important to collect, as well as data-sharing agreements across OST programs to collect and share individual program-level data. But community-wide participation rates are essential to understanding and addressing disparities.
Participation data can be used to inform resource allocation, improve program marketing, coordinate OST programming across funders and providers, and advocate for additional OST funding from foundations and government sources.
Closing We know that every community’s snapshot of youth programs and opportunities will be unique. And there will always be groups of young people who need more developmentally engaging youth programs, relationship, and opportunities.
The critical role that OST programs play in the strong, healthy development of our young people requires much deeper public policy debate. Investing in high quality, engaging OST programs for teenagers will pay o! immediately and in the future. In fact, if we don’t invest now, the future costs to our community could be much higher.
We hope that this study challenges assumptions about where we need to strengthen our e!orts to enrich the lives of young people who live in the most resource-stressed circumstances. In addition, we hope it shows that collecting useful data about participation and conducting action research to test strategies to increase participation is absolutely fundamental to understanding and addressing both the opportunity and participation gaps that contribute to educational disparities.
16

References Journeys into Community: Transforming Youth Opportunities for Learning and Development; Minnesota Commission on Out-of-School Time, University of Minnesota Extension, 2005.
Lochner, A., Allen, G., and Blyth, D. (2009). Exploring the Supply and Demand for Community Learning Opportunities in Minnesota: A Survey of Minnesota parents and Youth.
Saito, R.N., Beyond Access and Supply: Youth-Led Strategies to Captivate Young People’s Interest In and Demand for Youth Programs and Opportunities in D. Blyth and J. Walker (Ed.). New Designs for Youth Development. Volume winter 2006, Issue 112. Wiley Periodicals, Inc.
Saito, R.N., P.L. Benson, D.A. Blyth, and A.R. Sharma, Places to Grow: Perspectives on Youth Development Opportunities for Seven- to 14-Year-Old Minneapolis Youth, Minneapolis, MN: Search Institute, October, 1995.
Sprockets 2013-14 Out-of-School-Time Report. http://sprocketssaintpaul.org/about-sprockets/sprockets-publications
Appendix Researchers from Rainbow Research, Wilder Research and the University of Minnesota considered various ways of calculating participation rates for the purposes of this report. The three main options are outlined below. This report uses the definition labeled “Method C.”
Analysis Options Implications
Method A =
# of participants
Total # of youth
› Underestimates the participation rate – the denominator includes people who are less likely to participate in free or low-cost programs
› Is not truly an estimate of the participation rate of low-income youth, since both the numerator and the denominator include higher-income youth
› If the participating population and the population in the community are highly similar, this method could be a better fit.
Method B =
# of participants
# of low-income youth
› Overestimates the participation rate – the numerator includes some higher-income youth who are not in the denominator.
› If FRL status is not available for participants, this may be best method, as long as appropriate caveats are made about the fact that some youth in the numerator are not in the denominator.
Method C =
# of FRL-eligible participants
# of FRL-eligible youth
› Everyone in the numerator is in the denominator. Best measure of participation rates of lower-income youth.
› Limits the data set—leaves out data on higher income youth participants and youth attending non-primary school districts
› Could be improved through data-sharing agreements with charter schools
17