Standing with Students: An Exploration of Educational Inequality

University of Pennsylvania University of Pennsylvania
ScholarlyCommons ScholarlyCommons
CPRE Research Reports Consortium for Policy Research in Education (CPRE)
1-2002
Out-of-Field Teaching, Educational Inequality, and the Out-of-Field Teaching, Educational Inequality, and the
Organization of Schools: An Exploratory Analysis Organization of Schools: An Exploratory Analysis
Richard Ingersoll University of Pennsylvania, [email protected]
Follow this and additional works at: https://repository.upenn.edu/cpre_researchreports
Part of the Curriculum and Social Inquiry Commons, Educational Administration and Supervision
Commons, Educational Leadership Commons, Educational Methods Commons, and the Teacher
Education and Professional Development Commons
Recommended Citation Recommended Citation Ingersoll, Richard. (2002). Out-of-Field Teaching, Educational Inequality, and the Organization of Schools: An Exploratory Analysis. CPRE Research Reports. Retrieved from https://repository.upenn.edu/cpre_researchreports/22
View on the CPRE website.
This paper is posted at ScholarlyCommons. https://repository.upenn.edu/cpre_researchreports/22 For more information, please contact [email protected].

Out-of-Field Teaching, Educational Inequality, and the Organization of Schools: An Out-of-Field Teaching, Educational Inequality, and the Organization of Schools: An Exploratory Analysis Exploratory Analysis
Abstract Abstract Contemporary educational theory holds that one of the pivotal causes of inadequate student achievement, especially in disadvantaged schools, is the inability of schools to adequately staff classrooms with qualified teachers. Deficits in the quantity of teachers produced and in the quality of preparation prospective teachers receive have long been singled out as primary explanations for underqualified teaching. In this study, I hypothesize that the manner in which schools are organized and in which teachers are utilized can account for as much of the problem of underqualified teaching as do inadequacies in teacher training or the supply of teachers. This analysis specifically focuses on a little recognized source of underqualified teaching—the problem of out-of-field teaching—teachers being assigned by school administrators to teach subjects that do not match their training or education. I use data from the Schools and Staffing Survey—a large, comprehensive, nationally representative survey of teachers conducted by the National Center for Education Statistics. The results show that while most teachers, even in disadvantaged schools, hold basic qualifications, a significant proportion of these qualified teachers, especially in disadvantaged schools, are assigned to teach classes out of their fields. Data also show that out-of-field teaching is not primarily due to school hiring difficulties resulting from teacher shortages. In contrast, the analysis shows that a number of aspects of the administration and organization of schools are significantly related to out-of-field teaching. For example, school district regulations concerning minimal education requirements for new hires, the quality of principal leadership, the strategies schools use to cope with teacher recruitment and hiring, and average school class sizes all have an independent association with the extent of out-of-field teaching in schools, after controlling for other factors.
Disciplines Disciplines Curriculum and Social Inquiry | Educational Administration and Supervision | Educational Leadership | Educational Methods | Teacher Education and Professional Development
Comments Comments View on the CPRE website.
This report is available at ScholarlyCommons: https://repository.upenn.edu/cpre_researchreports/22

ctp Center for the Study of Teaching and PolicyU N I V E R S I T Y O F W A S H I N G T O N
Out-of-Field Teaching, Educational Inequality,and the Organization of Schools:
An Exploratory Analysis
A Research Report
byRichard M. Ingersoll
University of Pennsylvania
January 2002(Document R-02-1)

ctp Center for the Study of Teaching and PolicyA National Research Consortium
U N I V E R S I T Y O F W A S H I N G T O N (lead institution)
S T A N F O R D U N I V E R S I T Y
T E A C H E R S C O L L E G E / C O L U M B I A U N I V E R S I T Y
U N I V E R S I T Y O F M I C H I G A N
U N I V E R S I T Y O F P E N N S Y L V A N I A
Other active participants in CTP’s research and dissemination program include researchersaffiliated with Indiana University, Michigan State University, Pennsylvania State University,the University of California at Santa Barbara, the University of North Carolina, and EducationMatters, Inc.
CTP studies the way policies and conditions in schools, districts, states, and teacher educationinstitutions shape the quality of teaching and learning in the nation’s elementary and secondaryschools. The Center pays particular attention to the ways these policies and conditions interactwith each other to influence the teaching profession and its practice.
The Center’s program of research is carried out in collaboration with various other researchorganizations, among them other OERI-funded research centers, including the Consortiumfor Policy Research in Education (CPRE), the Center for Research on Education, Diversity,and Excellence (CREDE), and the Center on English Learning & Achievement (CELA).The Center is affiliated with a variety of professional and advocacy organizations thatrepresent teachers, teacher educators, state and local policymakers, disciplinary groups,and educational reform interests.
An earlier version of this paper was presented at the annual meeting of the American Educational Research Association, in New Orleans,April 2000. Thanks are due to David Chapman and Elizabeth Cohen for useful suggestions and feedback on the paper. This researchwas partly supported by a grant (with co-principal investigator—Linda Darling-Hammond) from the Center for the Study of Teaching andPolicy under the Educational Research and Development Centers Program, PR/Award R308B970003, as administered by the NationalInstitute on Educational Governance, Finance, Policymaking and Management, Office and Educational Research and Improvement, U.S.Department of Education. Opinions reflect those of the author and do not necessarily reflect those of the granting agencies.

CONTENTS
Abstract ................................................................................................................................................................ 2
Introduction......................................................................................................................................................... 3
Underqualified Teaching, Educational Inequality, and the Organization of Schools .............................. 4
Administrative Practices, Organizational Characteristics, and Out-of-Field Teaching ........................... 7Hiring Policies .............................................................................................................................................. 7Principal Leadership ................................................................................................................................... 7Staffing Practices .......................................................................................................................................... 7Teacher Unions ............................................................................................................................................. 8School Size .................................................................................................................................................... 8
Data and Methods .............................................................................................................................................. 9Data ................................................................................................................................................................ 9Methods ........................................................................................................................................................ 9
First Stage ............................................................................................................................................... 9Second Stage ........................................................................................................................................ 10
Results ................................................................................................................................................................ 14Levels of Teacher Qualifications & Out-of-Field Teaching .................................................................. 14The Sources of Out-of-Field Teaching .................................................................................................... 20Predictors of Out-of-Field Teaching ........................................................................................................ 22
Implications ....................................................................................................................................................... 24
Future Research Possibilities .......................................................................................................................... 26
Endnotes ............................................................................................................................................................ 27
References .......................................................................................................................................................... 29

ABSTRACT
Contemporary educational theory holds that one of the pivotal causes ofinadequate student achievement, especially in disadvantaged schools, is the inabilityof schools to adequately staff classrooms with qualified teachers. Deficits in thequantity of teachers produced and in the quality of preparation prospective teachersreceive have long been singled out as primary explanations for underqualifiedteaching. In this study, I hypothesize that the manner in which schools are organizedand in which teachers are utilized can account for as much of the problem ofunderqualified teaching as do inadequacies in teacher training or the supply ofteachers. This analysis specifically focuses on a little recognized source ofunderqualified teaching—the problem of out-of-field teaching—teachers beingassigned by school administrators to teach subjects that do not match their trainingor education. I use data from the Schools and Staffing Survey—a large, comprehensive,nationally representative survey of teachers conducted by the National Center forEducation Statistics. The results show that while most teachers, even in disadvantagedschools, hold basic qualifications, a significant proportion of these qualified teachers,especially in disadvantaged schools, are assigned to teach classes out of their fields.Data also show that out-of-field teaching is not primarily due to school hiringdifficulties resulting from teacher shortages. In contrast, the analysis shows that anumber of aspects of the administration and organization of schools are significantlyrelated to out-of-field teaching. For example, school district regulations concerningminimal education requirements for new hires, the quality of principal leadership,the strategies schools use to cope with teacher recruitment and hiring, and averageschool class sizes all have an independent association with the extent of out-of-fieldteaching in schools, after controlling for other factors.
2

INTRODUCTION
Few educational problems have received more attention in recent times thanthe failure to ensure that elementary and secondary classrooms are all staffed withqualified teachers. Over the past two decades, dozens of studies, commissions, andnational reports have drawn attention to the importance of the qualifications andquality of the teaching force. This concern is understandable. With teachercompensation being the largest single cost component of education in any country,teachers are a particularly important resource especially if, as most agree, studenteducational outcomes ultimately depend on the quality of their work.
Not surprisingly, the issue of teacher quality has also been at the heart of theongoing national debate over equality of educational opportunity. Unequal access toqualified teachers and, hence, to quality teaching is considered a primary factor in thestratification of educational resources, opportunities to learn, and, ultimately,educational outcomes. Commentators, researchers, and policymakers have long heldthat the most needy students in the United States—especially those in schools servingpoor, minority, and urban communities—are taught by the least qualified teachers(e.g., Rosenbaum, 1976; National Commission on Excellence in Education, 1983; Oakes,1985, 1990; Dreeben & Gamoran, 1986; Darling-Hammond, 1987; Kozol, 1991; Stevens1993; Elmore & Fuhrman 1995; Guiton & Oakes 1995; Bennefeld 1997; Haycock, 1998,2000; Urban League, 1999).
It is widely believed that perennial teacher shortages, presumably resultingfrom increasing student enrollments and a “graying” teacher workforce (see Ingersoll,2001b), disproportionately fall on and exacerbate staffing inequities in low-incomeand disadvantaged schools. In addition, the depth and breadth of the training andpreparation of prospective members of the teaching force vary widely; and, accordingto contemporary theory, disadvantaged school districts, unable to match the salaries,benefits, and resources offered by more affluent schools, have difficulty competingfor the more qualified teaching candidates, leading, in turn, to lower studentachievement. Some leading social critics have directly tied problems of inner-cityjoblessness and underemployment to a dearth of qualified teachers in poor, urbanpublic schools, resulting from teacher shortages. (e.g., Wilson 1996).
As a result, in recent years unequal access to qualified teachers has been cast asa major social problem and has received widespread coverage in the national media.The problem has also been the subject of a growing body of empirical research (e.g.,Hirsch, Koppich, & Knapp, 2001; National Commission on Teaching and America’sFuture, 1996, 1997) from which have come a number of reform and policy initiatives.
Numerous studies have examined overall levels and disparities of access toqualified teachers using nationally representative data (e.g., Blank & Gruebel. 1993;Blank & Langesen 1999; Choy et al. 1993; Henke, Choy, & Geis, 1996; Henke, Choy,Chen, Geis, & Alt, 1997; Horn, Hafner, & Owings, 1992; Oakes, 1985, 1990; Pascal,1987; Raudenbush, Fotiu & Cheong, 1998; Smerdon, 1999). These analyses havedocumented that the quality of teaching staffs does, indeed, vary across differenttypes of schools and that, in general, the quality of teachers are often lower indisadvantaged, low-income, and high-minority schools.
Because it is difficult to obtain large-scale data on the actual degree of qualityteaching provided to students in classrooms, most of this research turns to what ismore easily measured and more readily available: teacher qualifications. Althoughthe qualifications of teachers, such as their education, training, and experience, areonly indirect measures of the quality of teachers, most analysts agree they provideuseful information on this important educational resource (e.g., Haertel, 1991; Haney,Madus, & Kreitzer, 1987; Kennedy, 1992). Teaching, unlike many other occupations,
3

has an extensive body of empirical research documenting that teachers’ qualificationsare an important component of teacher performance (e.g., Ferguson, 1991; Greenwald,Hedges, & Laine, 1996; Hedges, Laine, & Greenwald, 1994; National Commission onTeaching and America’s Future, 1996, 1997).
Existing empirical research has shed much light on the distribution of qualifiedteachers across different kinds of schools. But it has not shed much light on the causesof these differences. There has been little empirical research investigating the sourcesof inadequacies and disparities in access to qualified teachers, especially usingnationally representative data. For example, there have been surprisingly few effortsthat closely examine with national data the breadth and depth of teacher shortages,how much impact they have on teacher qualifications, and in which kinds of schoolsthey occur most frequently (Ingersoll, 2001b). There have also been few efforts toisolate, with national data, which aspects of the context, policies, organization,administration, or conditions of districts and schools are related to a school’s successin providing qualified teachers for all classrooms.1
Teacher policy and reform has primarily been directed either at upgrading thequality of teachers or at increasing the quantity of teachers. To address the qualityissue, many states have pushed for more rigorous preservice and inservice teachereducation, training, and certification standards. In response to the quantity issue, ahost of initiatives and programs have sprung up that attempt to increase the supplyof available teachers by recruiting new candidates into teaching, especially to schoolsserving disadvantaged students. For example, a key goal of President Clinton’seducational agenda was to recruit thousands of new teachers to serve in disadvantagedschools. A wide range of alternative licensing programs has been implemented toease entry into teaching. Programs such as Troops-to-Teachers are designed to enticeprofessionals into mid-career changes to teaching. Other programs, such as Teach forAmerica, seek to lure the “best and brightest” into the profession. Finally, financialincentives such as signing bonuses, student loan forgiveness, housing assistance, andtuition reimbursement have all been instituted to aid teacher recruitment (Clinton,1999; Feistritzer, 1997; Kopp, 1992).
UNDERQUALIFIED TEACHING, EDUCATIONAL INEQUALITY, AND THEORGANIZATION OF SCHOOLS
This study examines the sources of inadequacies and inequities in teacherqualifications, especially in schools serving low-income, high minority enrollment,urban communities. Whereas the dominant viewpoint, as summarized above, holdsthat the source of the problem of unqualified teachers primarily lies in deficits ineither the quality or the quantity of teachers—a view hereafter referred to as theteacher deficit perspective—this study adopts a different perspective—one focusedon the organization of schools—to empirically explore the reasons why particular kindsof schools have less qualified teachers. The central hypothesis of this study is: tofully understand the problem of unqualified teachers, it is necessary to not onlyexamine the quantity and quality of the teaching force but also to examine thecharacteristics of the organizations within which teachers work. In other words, themanner in which schools are organized and teachers are employed and utilized canaccount for as much of the problem of underqualified teaching as do inadequacies inthe supply or training of teachers. (See Figure 1)
At the outset, it needs to be recognized that investigating the role of schooldecision makers in the problems of the educational system, especially fordisadvantaged communities, is a highly contentious subject. Some school critics,
4

especially those with a conservative political orientation, have argued that incompetentand corrupt school managers are a major factor in the plight of low-income, inner-city public schools. Liberal-left critics have forcefully responded that this viewpointunfairly places responsibility for the problems of low-performing schools on thevictims of these same problems and unfairly shifts responsibility away from systemicinequities in funding and resources embedded in the larger educational orsocioeconomic system (e.g., Kozol, 1991).
This study’s organizational perspective shifts attention away from this polarizeddebate and focuses on which aspects of schools—their practices, policies,characteristics, and conditions—affect the extent to which classrooms are staffed withqualified teachers. Understanding if and how school decision makers can eitherundermine or foster quality teaching is of vital importance because of the obviousimplications for devising reforms, policies, and interventions that address all the keyfactors at the root of the problem of underqualified teaching (e.g., Chester, Offenberg,& Xu, 2001).
This study focuses on one of the least recognized, least understood sources ofunderqualified teaching in schools—the problem of out-of-field teaching—teachersassigned by school administrators to teach subjects which do not match their trainingor education. This is a crucial factor because highly qualified teachers may actuallybecome highly unqualified if they are assigned to teach subjects for which they havelittle training or education. Until recently, it has also been an under-recognized issuelargely because of an absence of accurate data—a situation remedied with the releaseof the Schools and Staffing Survey (SASS) by the National Center for EducationStatistics (NCES) in the early 1990s.
In previous analyses (Ingersoll, 1995, 1996, 1999, 2000) I have used these data toprofile the levels and distribution of out-of-field teachers. The data document thatthere are high levels of out-of-field teaching in American schools. These findings havealso been replicated; NCES analysts have calculated levels of out-of-field teachingusing the same, or similar, data sources and have reached the same conclusion (e.g.Bandeira de Mello & Broughman, 1996; Bobbitt and McMillen, 1995; Smerdon, 1999).As a result, over the past couple of years the problem of out-of-field teaching hasbecome a prominent topic in the realm of educational policy, been widely reportedand commented upon in the national media, and been featured in a number of majoreducational reports (e.g., National Commission on Teaching and America’s Future,1996, 1997; Education Trust 1996, 1998; Education Week, 1997, 1998, 2000). However,despite this new awareness and attention, the problem of out-of-field teaching remainswidely misunderstood. At the heard of this misunderstanding is a crucial question:What are the reasons for the prevalence of out-of-field teaching in American schools?
Teacher Deficit Perspective
An Organizational Perspective
Inadequate Teacher Supply
Inadequate Teacher Training
Administrative Practices andOrganizational Characteristics
Underqualified Teachers, especially inDisadvantaged Schools
Underqualified Teachers, especially inDisadvantaged Schools
Decreases in SchoolPerformance
Decreases in SchoolPerformance
Figure 1. Two Perspectives on the Causes and Consequences ofUnderqualified Teaching
5

It is widely assumed that out-of-field teaching, like other kinds of underqualifiedteaching, is also a result of deficits in the quantity and quality of teachers. In contrastto the teacher deficit perspective, this study adopts an organizational perspective toinvestigate the sources of out-of-field teaching in schools. It seeks to build on earlierwork, by specifically focusing on the connection between out-of-field teaching andthe manner in which schools and teachers are organized, managed, and administered.Below I outline this perspective.
Unlike traditional professions, teachers have only limited authority over keyworkplace decisions. For example, teachers have little say over which courses theyare assigned to teach. Decisions concerning the hiring and the allocation of teachersto course and program assignments are primarily the responsibility and prerogativeof school principals (Ingersoll, 2000). The latter are charged with the often difficulttask of providing a broad array of programs and courses with limited resources, alimited budget, and a limited teaching staff. Along with these limitations, principals’staffing decisions can also be constrained by numerous other factors, such as teacherunion work rules, teacher seniority issues, school district regulations, class-sizeguidelines, and contractual obligations concerning the number and type of classassignments allocated to teaching employees. For example, in a typical secondaryschool, teacher employment contracts stipulate that full-time teaching staff must beassigned to teach five classes in a normal seven class-period day.
However, the data show that within these constraints school principals havean unusual degree of discretion in staffing decisions. Whereas teacher training is subjectto an elaborate array of state licensing requirements, there is far less regulation ofhow teachers are utilized once on the job (Education Week, 2000; Ingersoll, 1999;Robinson, 1985; Ruby, 1999). In this context, principals may find that assigning teachersto teach out of their fields is often not only legal, but also more efficient and lessexpensive than the alternatives. For example, rather than trying to find and hire anew science teacher to teach a newly state-mandated, but under-funded sciencecurriculum, a principal may find it more convenient to assign a couple of English andsocial studies teachers to cover a section or two in science. If a teacher suddenly leavesin the middle of a semester, a principal may opt to hire a readily available but notfully qualified substitute teacher rather than instigate a formal search for a new teacher.When faced with the choice between hiring a fully qualified candidate for an Englishposition and hiring a less qualified candidate who is also willing to coach a majorvarsity sport, a principal may find it more expedient to do the latter. If a full-timemusic teacher is under contract, but student enrollment is sufficient to fill only threemusic classes, the principal may find it both necessary and cost effective to assign themusic teacher to teach two classes in English, in addition to the three classes in music,in order to employ the teacher for a regular full-time complement of five classes persemester.
Faced with a myriad of such trade-offs and judgments, some degree of teachermisassignment by principals is probably unavoidable. However, while the SASS datashow that out-of-field teaching is widespread, the data also show there are large school-to-school differences in this practice. Notably, low-income and disadvantaged schoolshave more out-of-field teaching than most other kinds of schools (Ingersoll, 1999).This raises an important question that is at the center of this study: What accounts forlarge school differences in levels of out-of-field teaching?
This analysis addresses this question by investigating the relationships betweenthe degree of out-of-field teaching in schools and a number of possible factorssuggested by the above discussion. These include the demographic characteristics ofschools, such as low-income and minority student enrollment; factors suggested bythe teacher deficit perspective, such as the extent to which schools experiencedifficulties in recruiting qualified teaching staff for their teaching job openings; and,
6

finally, a number of administrative practices and organizational characteristicssuggested by an organizational perspective. These latter practices and characteristicsare described below.
ADMINISTRATIVE PRACTICES, ORGANIZATIONALCHARACTERISTICS, AND OUT-OF-FIELD TEACHING
Hiring Policies
While data from SASS show that school principals have a great deal of controlover teacher hiring decisions, the data also show that the central administrations ofpublic school districts vary in the extent to which they impose standards on theseschool-level decisions or have formal regulations concerning minimal trainingrequirements for new hires. For example, the data show that about two thirds of allschool districts formally require new teacher hires to hold a college major or minor inthe main field to be taught (Ingersoll, 2000). We would expect such regulations toconstrain the capacity of school principals to hire out-of-field candidates for openings.This analysis will examine whether the existence of these kinds of regulations is relatedto decreases in the amount of out-of-field teaching in schools.
Principal Leadership
The degree to which a school is faced with teacher recruitment and hiringdifficulties and the kinds of regulations imposed by district-level administrators mayshape a principal’s teacher hiring and staffing decisions. An organizational perspective,however, suggests there is also an overlooked role for the leadership skills of principalsin the employment, assignment, and utilization of teachers. This analysis will explorethis factor by examining whether there is a positive association between the generalleadership skill of principals and the degree of out-of-field teaching in schools.
Staffing Practices
Depending upon the constraints within which principals work, the degree ofdiscretion allowed to them, and their leadership skills, there could be numerousoptions, choices, and strategies available to principals in regard to teacher hiring andassignment (Ingersoll, 1999, 2000). As discussed previously, when faced with difficultyin finding qualified candidates to fill teaching openings, school principals might optto hire an available but underqualified teacher at the cost of a regular teacher salary,choose to reassign an existing teacher to cover part or all of the hard-to-staff classes atno additional salary, or opt to employ a long-term substitute teacher at a relativelylow salary. We would expect each of these choices to result in significantly more out-of-field teaching.
Alternatively, rather than resort to the above, principals might opt to leave somehard-to-staff teaching openings unfilled and shift student enrollment to existing classes.This would create larger classes, save salary costs, and, presumably, result in less out-of-field teaching. In other cases, especially in more affluent and advantagedcommunities, school officials might have the budgetary resources available to enhanceteacher recruitment efforts by providing higher starting salaries. This analysis willexamine the relationships between these contrasting managerial choices and the degreeof out-of-field teaching that exists in schools.
7
Teacher Unions
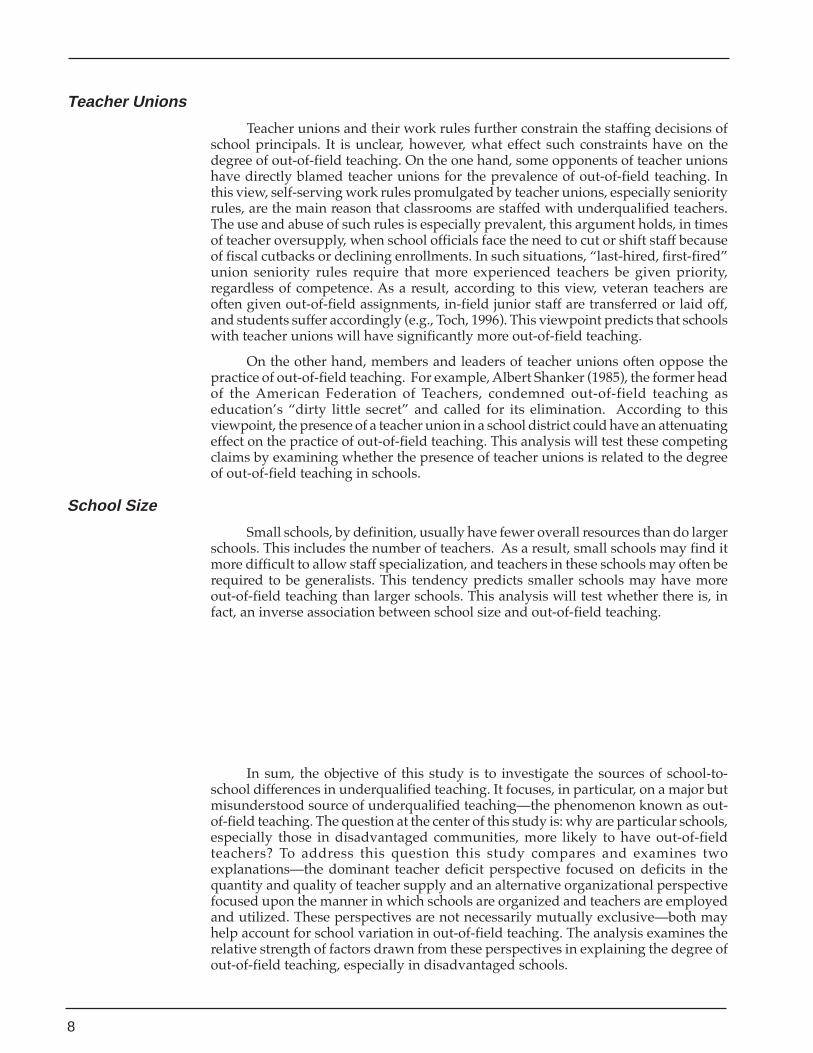
Teacher unions and their work rules further constrain the staffing decisions ofschool principals. It is unclear, however, what effect such constraints have on thedegree of out-of-field teaching. On the one hand, some opponents of teacher unionshave directly blamed teacher unions for the prevalence of out-of-field teaching. Inthis view, self-serving work rules promulgated by teacher unions, especially seniorityrules, are the main reason that classrooms are staffed with underqualified teachers.The use and abuse of such rules is especially prevalent, this argument holds, in timesof teacher oversupply, when school officials face the need to cut or shift staff becauseof fiscal cutbacks or declining enrollments. In such situations, “last-hired, first-fired”union seniority rules require that more experienced teachers be given priority,regardless of competence. As a result, according to this view, veteran teachers areoften given out-of-field assignments, in-field junior staff are transferred or laid off,and students suffer accordingly (e.g., Toch, 1996). This viewpoint predicts that schoolswith teacher unions will have significantly more out-of-field teaching.
On the other hand, members and leaders of teacher unions often oppose thepractice of out-of-field teaching. For example, Albert Shanker (1985), the former headof the American Federation of Teachers, condemned out-of-field teaching aseducation’s “dirty little secret” and called for its elimination. According to thisviewpoint, the presence of a teacher union in a school district could have an attenuatingeffect on the practice of out-of-field teaching. This analysis will test these competingclaims by examining whether the presence of teacher unions is related to the degreeof out-of-field teaching in schools.
School Size
Small schools, by definition, usually have fewer overall resources than do largerschools. This includes the number of teachers. As a result, small schools may find itmore difficult to allow staff specialization, and teachers in these schools may often berequired to be generalists. This tendency predicts smaller schools may have moreout-of-field teaching than larger schools. This analysis will test whether there is, infact, an inverse association between school size and out-of-field teaching.
8
In sum, the objective of this study is to investigate the sources of school-to-school differences in underqualified teaching. It focuses, in particular, on a major butmisunderstood source of underqualified teaching—the phenomenon known as out-of-field teaching. The question at the center of this study is: why are particular schools,especially those in disadvantaged communities, more likely to have out-of-fieldteachers? To address this question this study compares and examines twoexplanations—the dominant teacher deficit perspective focused on deficits in thequantity and quality of teacher supply and an alternative organizational perspectivefocused upon the manner in which schools are organized and teachers are employedand utilized. These perspectives are not necessarily mutually exclusive—both mayhelp account for school variation in out-of-field teaching. The analysis examines therelative strength of factors drawn from these perspectives in explaining the degree ofout-of-field teaching, especially in disadvantaged schools.

DATA AND METHODS
DataThe data for this study come from NCES’ Schools and Staffing Survey (SASS),
the largest and most comprehensive data set available on the staffing, occupational,and organizational characteristics of elementary and secondary schools. The surveywas specifically designed to remedy the lack of nationally representative andcomprehensive data on these issues (Haggstrom, Darling-Hammond, & Grissmer,1988).
The U.S. Census Bureau collected the SASS data for NCES from random samplesstratified by state, sector, and school level. To date, three independent cycles of SASShave been completed: 1987-1988, 1990-1991, and 1993-1994. (As of 12/01 the 1999-2000 SASS data had not been released; for information on SASS, see Choy et al., 1993or Henke et al., 1997.) Each cycle of SASS includes several sets of separate, but linked,questionnaires for school administrators and for a random sample of teachers withineach school. The response rate was relatively high: 86 percent for teachers and 94percent for administrators. The data used in this study are primarily from the 1993-1994 SASS. The sample contains about 46,700 teachers employed in about 9,000 publicelementary, secondary, and combined (K-12) schools. Throughout, this analysis usesdata weighted to compensate for the over- and under-sampling of the complexstratified survey design. Each observation is weighted by the inverse of its probabilityof selection in order to obtain unbiased estimates of population parameters.
Representing a wide range of information on the characteristics of teachers,schools, and school districts across the country, SASS is particularly useful foraddressing research questions on access to qualified teachers. Teachers reported theircertification status and the major and minor fields of study for degrees earned at boththe undergraduate and graduate levels. In addition, for each teacher sampled, datawere collected on the subject taught, grade level, and number of students enrolled foreach class period in the school day. From administrators, SASS obtained a wide rangeof information on school demographic characteristics, staffing procedures, teacherrecruiting difficulties, administrative practices, and organizational characteristics.
MethodsThere are two stages to the data analysis and data presentation. The first stage
documents levels of teacher qualifications and out-of-field teaching across differenttypes of schools. It focuses on establishing the role of out-of-field teaching as a majorsource of underqualified teachers, especially in disadvantaged schools. The secondstage then turns to an investigation of the sources of school-to-school variations inout-of-field teaching.
First Stage
One of the difficulties encountered in researching the problem of underqualifiedteachers has been a lack of consensus on the best standard by which to define a qualifiedteacher. Few would argue that teachers ought not be qualified; moreover, there existssubstantial empirical support for the reasonable proposition that the qualifications ofteachers are tied to student achievement (e.g., Greenwald et al., 1996; Raudenbush,Fotiu, & Cheong, 1999). But controversy swirls around how much education, whattypes of training, and which kinds of preparation teachers ought to have to beconsidered qualified in any given field (e.g., Haertel, 1991; Haney et al., 1987; Kennedy,1992).
9
Like much previous empirical research on teacher qualifications, this studyfocuses on a variety of indicators, such as teachers’ college degrees and teachingcertificates. And similar to previous empirical research, an important premise underliesthis analysis—that to be considered adequately qualified, teachers ought to have, as aminimal prerequisite, some agreed-upon credential (such as a degree or a certificate)in the fields they are assigned to teach. Having a credential signifying some level oftraining or education in a field does not guarantee one is a quality teacher, nor eventhat one is a qualified teacher, but the assumption underlying this research is that acredential is a necessary, if not sufficient, requirement of both.2
The first stage of the analysis presents descriptive statistics on levels of teachereducation, teacher certification, and teaching experience and the extent to which theselevels vary according to school poverty enrollment level, school minority enrollmentlevel, and school urbanicity. This stage of the analysis also presents data on the extentof out-of-field teaching.
Previous studies have used a number of different measures of out-of-fieldteaching, representing a range of standards.3 Some measures focus on whether teachershave a teaching certificate in the fields they teach, others focus on whether teachershave an undergraduate or graduate degree, and still others focus on whether teachershave both a certificate and a degree in the fields they are assigned to teach. Measuresof out-of-field teaching also vary according to whether they focus on the numbers ofteachers doing it or the numbers of students exposed to it and according to whichfields and subjects are examined and which grade levels are investigated. This projectwill use several different measures of out-of-field teaching, drawn from previous work.The first stage of the analysis focuses on the proportion of those teaching in fivedifferent fields without an undergraduate or graduate major or minor in that field.The five fields are general elementary education, and secondary-level mathematics,English, social studies, and science. I count both education and academic majors andminors as qualification to teach; for example, either a major in math or in matheducation counts as being qualified to teach math.4
Second Stage
Having documented cross-school levels of out-of-field teaching, the second stageof the analysis seeks to explain why particular schools are more or less likely to havedifferent levels of out-of-field teaching. In particular, the analysis focuses on the linkbetween the degree of out-of-field teaching in schools and factors representing thedemographic characteristics of the students, the teacher deficit perspective, and anorganizational perspective. This second stage begins with a summary of recent trendsin overall levels of teacher supply, demand, and shortages; the numbers of schoolsthat actually experience difficulty recruiting qualified faculty to fill their teachingopenings; and the extent to which these difficulties affect the levels of out-of-fieldteaching. The analysis then turns to a more advanced statistical analysis of the relativeassociation of various factors with out-of-field teaching at the secondary level. Thesecondary sub sample includes 23,867 teachers in grades 7-12. It includes all thoseteaching in any of eight fields, parallel to conventional departmental divisions at thesecondary level: English, mathematics, social studies, science, art/music, physicaleducation, foreign language, and vocational education. It excludes those employedin middle schools.
The dependent variable in this portion of the analysis is a second measure ofout-of-field teaching—for each secondary-level teacher, the percentage of their dailyclasses in which they do not have an academic or education undergraduate or graduatemajor or minor in the field taught.5 The analysis examines the relative association ofthis measure of out-of-field teaching with four groups of independent variables: teacher
10

qualifications, school demographic characteristics, school recruiting and hiringdifficulties, and school administrative practices and organizational characteristics.Table 1 provides summary statistics for these variables, and Figure 2 providesdefinitions.
For measures of teacher qualifications, the regression analysis includes controlsfor each teacher’s highest degree earned and total years of teaching experience. Forschool demographic characteristics, the analysis includes measures of school povertyenrollment, school minority enrollment, and school urbanicity. For school recruitingand hiring difficulties, the analysis includes a measure to control for whether schoolshad teaching job openings in the year of the survey and a measure to gauge the extentof difficulty these schools experienced with recruiting qualified faculty to fill theiropenings for 13 teaching fields. Finally, after controlling for the teacher and schoolfactors cited above, the analysis includes a number of factors previously introduced,reflecting school administrative practices and organizational characteristics. These
Mean StandardDeviation
Percent 7 - 12th classes taught by out-of-field teachers 16 35
Teacher Qualifications
Highest Degree (scale of 0-3) 1.6 .62
Teaching Experience (years) 16 9.4
School Demographic Characteristics
Percent students in school receiving free/reduced lunch 23 22.8
Percent minority students in school 28 28.5
Percent rural schools 43 -
Percent suburban schools 32 -
School Recruiting and Hiring Difficulties
Percent schools with teaching job openings 87 -
Hiring difficulties (scale of 0-13) 1.5 1.9
Administrative Practices/Organizational Characteristics
Major/minor required of hires (scale of 1-3) 2.6 .60
Prinicipal leadership (scale of 1-4) 2.1 .68
Hiring/assigning underqualified (scale of 0-4) .31 .61
Class size 23 8
Starting teacher salary ($) 23,177 3,358
Percent schools with teacher union 73
School size 1084 640
Table 1. Means and Standard Deviations for Variables Used inMultiple Regression Analysis of Out-of-Field Teaching atthe Secondary Level
11

Out-of-Field Teaching
• % Secondary Classes Out of Field: for each 7-12th grade teacher, percentage classes in which teacher does nothave an undergraduate or graduate major or minor in field taught. Both academic and education majors/minors are counted (e.g., math and math education). Measure includes all those teaching in any of eightfields, parallel to conventional departmental divisions at the secondary level: English, mathematics, socialstudies, science, art/music, physical education, foreign language, vocational education. It excludes thoseemployed in middle schools. (For more detail on this measure, see Ingersoll 1995)
Teacher Qualifications
• Highest Degree: a 4 category variable, where 0 = less than bachelor’s degree, 1 = bachelor’s degree, 2 =master’s degree, 3 = above master’s degree.
• Teaching Experience: total years of teaching experience
School Demographic Characteristics
• Poverty Enrollment: percentage of students receiving the federal free or reduced-price lunch program forstudents from families below poverty level
• Minority Enrollment: percentage of students that were black, Hispanic, American Indian, Asian and PacificIslander
• Rural: a dichotomous variable where 0 = central city or urban fringe/large town and 1 = rural/small town
• Suburban: a dichotomous variable where 0 = rural/small town or central city and 1 = urban fringe/largetown
School Recruiting and Hiring Difficulties
• Teaching Job Openings: a dichotomous variable where 0 = school had no teaching job opening(s) that yearand 1 = school had teaching job opening(s) that year
• Hiring Difficulties: On a scale of 0 to 13, sum of 13 teaching fields for which school administrator reportedeither “somewhat difficult,” “very difficult,” or “could not fill” in response to item which asked: “howdifficult or easy was it to fill the vacancies for this school year in each of the following fields?” The latterincludes: special education, ESL/ESOL/bilingual education, English, mathematics, social studies, physicalscience, life science, music, foreign languages, business or marketing, industrial arts, home economics, tradeand industry, agriculture.
Administrative Practices/Organizational Characteristics
• Major/Minor Required of Hires: on a scale of 1 = not used, 2 = used, 3 = required, school district requirementfor new hires having college major or minor in field to be taught, as reported by school administrators.
• Principal Leadership: on a scale of 1 = strongly disagree to 4 = strongly agree the school mean of 6 items askedof teachers about whether their principal: recognizes staff members for good work; knows what kind ofschool he/she wants; communicates his/her expectations; is supportive and encouraging; backs up teachers;and communicates with teachers about instructional practices. Factor analysis (with varimax rotationmethod) was used to develop this measure. Item loadings of .4 were considered necessary for inclusion.Items in the factor had high internal consistency (a > .7).
• Hiring or Assigning Underqualified: on a scale of 0 to 4, sum used of 4 possible methods to cover vacancies, asreported by school administrators: hire a less than fully qualified teacher; assign teacher of another subject orgrade level to teach the class; assign administrator or counselor to teach the class; use short-term or long-termsubstitutes. To avoid missing observations, this variable is calculated for all schools, even those withoutvacancies or without hiring difficulties that, by definition, would not have indicated use of these strategies.
• Average Class Size: school’s mean student enrollment per classroom.
• Starting Teacher Salary: normal yearly base salary for teacher with a bachelor’s degree and no experience, asreported by school administrators. Divided by 1,000, to make units refer to increments of $1,000.
• Presence of Teacher Union: a dichotomous variable where 0 = school district has no teacher union and 1 =school district does have one.
• School Size: student enrollment of school. Divided by 100, to make units refer to increments of 100 students.
Figure 2. Definitions of Measures Used in the Multiple Regression Analysis of Out-of-Field Teaching at the Secondary Level
12

latter measures include: 1) a variable assessing whether the school district has informalor formal rules stipulating that new teacher hires have a major or minor in the mainfield to be taught; 2) a measure representing teachers’ subjective ratings of theleadership skills of their principals; 3) a measure of the extent to which a school covershard-to-fill teaching openings by hiring underqualified teachers, reassigning teachersof another subject or grade level, or using short-term or long-term substitutes; and 4)measures of both school size and the school’s average class size, the normal yearlystarting salary provided by the school for new, inexperienced teachers, and whetherthere is a teacher union in the school district.
The purpose of this second portion of the analysis is to examine whether theproportion of secondary-level classes taught in schools by out-of-field teachers isrelated to the above measures of school administrative practices and organizationalcharacteristics, while controlling for school recruiting and hiring difficulties, schooldemographic characteristics, and the qualifications of the teachers sampled in theschool. The analysis proceeds by using multiple regression to estimate a mathematicalequation—a model—indicating the relative association of each of the variables withthe measure of out-of-field teaching. That is, the statistical association of each variablewith out-of-field teaching is individually determined, while the other variables areheld constant or, in other words, controlled.
The data in the analysis are couched at two levels—teacher level and schoollevel. Over the past two decades there has been much discussion concerning the mostappropriate multiple regression method for modeling multilevel data. Accuratelypredicting an outcome, such as out-of-field classes, for members of an organizationsuch as teachers, while taking into account the characteristics of both the teachers andthe organization, is a complex statistical task. Conventional multiple regressiontechniques operate at one level of analysis and, hence, cannot properly model anoutcome that is a product of factors at more than one level. As a result, researchersrecently have developed a number of statistical techniques specifically designed formodeling multilevel data. Such techniques have the advantage of allowing the analysisto simultaneously model the relationships between both individual teachercharacteristics and their own amount of out-of-field classes and between thecharacteristics of schools and the average amount of out-of-field classes of the teachersin those schools. This allows the analysis to account for variation in out-of-fieldteaching, both between teachers within schools and between teaching staffs acrossschools. That is, multilevel techniques do not assume that schools are entirely uniformentities, nor do they assume that they are entirely non-uniform entities. This analysisuses one particular multilevel program, SAS’ PROC MIXED, which has the additionaladvantage of allowing for the inclusion of the survey’s design weights.6
13

RESULTS
Levels of Teacher Qualifications and Out-of-Field Teaching The data show that most public elementary and secondary teachers have basic
education and training (see Table 2). Almost all public school teachers have completeda four-year college education. Ninety-nine percent of public school teachers hold abachelor's degree, and almost half have obtained graduate degrees. Moreover, 94percent of public school teachers have regular or full state-approved teachingcertificates.
The data also reveal some distinct cross-school differences in the qualificationsof teachers. Schools with high poverty enrollments, schools with high minorityenrollments, and those in urban areas sometimes have less access to qualified teachers.
Less than Bachelor’s Master’s No Less-than- RegularBachelor’s Degree Degree or Certification Regular Certification
Degree More Certification
Total .7 52 47 2 4 94
Poverty Enrollment
Low .9 45 54 1.5 3 96
High .6 56 43 4 6 90
Minority Enrollment
Low .6 51 48 1 3 96
High .9 52 47 4 7 89
Community
Rural .8 58 41 2 3 95
Suburban .7 46 53 2 3 96
Urban .7 49 50 3 5 92
Not Poor/White/Suburban .3 41 58 2 2 96
Poor/Minority/Urban .2 51 49 7 9 85
Notes:
• Less than Regular Certification includes all those with emergency, temporary, alternative, or provisionalcertification.
• Regular Certification includes all those with probationary, regular, standard, full, or advanced certification.(Probationary refers to initial license issued after satisfying all requirements except completion of probationaryperiod.)
• Low poverty refers to schools where 15% or less of the students receive publicly funded free or reduced pricelunches. High poverty refers to schools where over 80% do so.
• Low minority refers to schools where 15% or less of the students are minority. High minority refers to schoolswhere over 80% are. Middle categories of poverty and minority are not shown.
• Not Poor/White/Suburban refers to schools that are low poverty and low minority and suburban.• Poor/Minority/Urban refers to schools that are high poverty and high minority and urban.
Table 2. Percentage of elementary and secondary public school teachers, by highestdegree earned and by highest type of certification, by type of school.
14

For example, teachers in high-poverty schools are less likely to have graduate degreesthan are teachers in low-poverty schools. On the other hand, there is little differencebetween suburban and urban schools and between high-minority and low-minorityschools in the percentage of teachers with graduate degrees.
Disparities in teachers’ qualifications are more clear and distinct when thesedemographic characteristics are combined. For example, teachers in not poor/white/suburban schools (hereafter referred to as advantaged schools) are more likely to havegraduate degrees and more likely to have full certificates than those in poor/minority/urban schools (hereafter referred to as disadvantaged schools). But, it is also importantto recognize that these data tell us little of the quality of these qualifications; theremay be inequities in teacher qualifications not revealed here.
The experience levels of teachers in advantaged and disadvantaged schoolsalso differ, as shown in Table 3. Just over one tenth of all public school teachers arebeginners (three years or less) and just under one third are senior (more than 20 years).In disadvantaged schools, twice as many teachers are beginners and fewer teachersare senior than in advantaged schools. To many critics of educational equality, this isan important finding; experience in a teaching staff is considered a vital asset. However,it is necessary to recognize that not all share this view. Some place more value on
1 Year or less 3 Years or Less More than 20 years
Total 4.5 12.2 31.4
Poverty Enrollment
Low 3.6 10 35.3
High 5.6 17.5 26.3
Minority Enrollment
Low 3.9 10.7 33
High 5.2 15.8 30
Community
Rural 5 12.7 28.7
Suburban 3.9 11.4 35
Urban 4.4 12.4 31.3
Not Poor/White/Suburban 3 9.4 38
Poor/Minority/Urban 5.8 18.6 27
Notes:
• Low poverty refers to schools where 15% or less of the students receive publicly fundedfree or reduced price lunches. High poverty refers to schools where over 80% do so.
• Low minority refers to schools where 15% or less of the students are minority. Highminority refers to schools where over 80% are. Middle categories of poverty andminority are not shown.
• Not Poor/White/Suburban refers to schools that are low poverty and low minority andsuburban.
• Poor/Minority/Urban refers to schools that are high poverty and high minority andurban.
Table 3. Percentage of elementary and secondary public schoolteachers, by total teaching experience, by type of school.
15

youth than experience in teachers and view a disproportionately junior staff as anasset and a disproportionately senior staff as a liability. For example, Kozol (1991, p.51) argues that disadvantaged schools suffer from too many senior teachers and toofew “exciting, youthful teachers.” These data cannot resolve the debate over therelative merits of youth and experience in teachers. They do show, however, that onaverage Kozol is incorrect about one thing; disadvantaged schools have more juniorlevel staff than do advantaged schools. Moreover, not only are there more beginnersin disadvantaged schools, but beginners in those schools are less likely to be fullyqualified. Table 4 is identical to Table 2 except that it focuses only on beginning teachers.It shows that while almost all beginning teachers have at least bachelor degrees and81 percent have full certificates, in disadvantaged schools only 59 percent of beginningteachers have regular teaching certificates.
Less than Bachelor’s Master’s No Less-than- RegularBachelor’s Degree Degree or Certification Regular Certification
Degree More Certification
Total 1 82 17 6 13 81
Poverty Enrollment
Low 2 78 21 3 13 84
High .4 83 17 13 17 70
Minority Enrollment
Low 1 84 14 2 13 84
High .6 78 21 14 21 65
Community
Rural 1 87 12 4 12 84
Suburban 2 79 19 4 11 85
Urban .9 78 21 12 17 71
Not-Poor/White/Suburban .6 78 22 3 13 84
Poor/Minority/Urban .2 76 24 19 22 59
Notes:
• Beginning Teachers refers to teachers with 3 years or less total teaching experience.• Less than Regular Certification includes all those with emergency, temporary, alternative or provisional certification.• Regular Certification includes all those with probationary, regular, standard, full, or advanced certification.
(Probationary refers to initial license issued after satisfying all requirements except completion of probationaryperiod.)
• Low poverty refers to schools where 15% or less of the students receive publicly funded free or reduced pricelunches. High poverty refers to schools where over 80% do so.
• Low minority refers to schools where 15% or less of the students are minority. High minority refers to schoolswhere over 80% are. Middle categories of poverty and minority are not shown.
• Not Poor/White/Suburban refers to schools that are low poverty and low minority and suburban.• Poor/Minority/Urban refers to schools that are high poverty and high minority and urban.
Table 4. Percentage of beginning elementary and secondary public school teachersand by highest degree earned, by highest type of certification, by type ofschool.
16

However, the most glaring and prominent source of inadequate access toqualified teachers is not a lack of basic education or training of teachers, but rather alack of fit between teachers’ preparation and teachers’ class assignments: thephenomenon of out-of-field teaching. Whereas most teachers, even in disadvantagedschools, have a bachelor’s degree and a regular teaching certificate, many teachers atboth the elementary and the secondary levels are assigned to teach classes in fieldsthat do not match their educational background.
At the elementary school level, the data show that 12 percent of those who teachregular pre-elementary or general elementary classes do not have an undergraduateor graduate major or minor in the fields of pre-elementary education, early childhoodeducation, or elementary education (see column 1 of Table 5).7 Interestingly, the dataalso show that beginning elementary teachers are more prone than experiencedelementary teachers to be teaching out of their fields (see bottom row of Table 5).There are also cross-school disparities: elementary teachers in poor schools and inschools serving predominantly minority student populations are less likely to have amajor or minor in the field.
However, the standard by which one defines a qualified elementary teacherimpacts the amount of out-of-field teaching found in elementary schools. Out-of-fieldlevels drop significantly when looking at those without teaching certificates in contrastto those without a major or minor. In background analyses (not shown here), onlyfive percent of regular elementary teachers did not have regular certificates in thefields of pre-elementary education or elementary education.
The data also show that levels of out-of-field teaching are higher at the secondarylevel than at the elementary level.8 For example, about a third of all public secondaryschool math teachers have neither a major nor a minor in math, math education, orrelated disciplines, such as engineering or physics. About one quarter of all secondaryschool English teachers have neither a major nor a minor in English or related subjects,such as literature, communications, speech, journalism, English education, or readingeducation. In science, slightly lower levels—about one fifth of all public secondaryschool teachers—do not have at least a minor in one of the sciences or in scienceeducation. Finally, about a fifth of social studies teachers are without at least a minorin any of the social sciences, in public affairs, in social studies education, or in history(see columns 2-8 of Table 5).9
As is true in elementary schools, there are also large cross-school differences inout-of-field teaching in secondary schools. In most fields, teachers in high-povertyschools are more likely to be out of field than are teachers in more affluent schools.For example, almost a third of social studies teachers in high-poverty schools, asopposed to 16 percent in low-poverty schools, do not have at least a minor in socialstudies or a related discipline. To be sure, advantaged schools are not free of out-of-field teaching. Many teachers in these kinds of schools also teach out of their fields.But misassignment is clearly a major factor behind lack of access to qualified teachersin disadvantaged schools. The poverty and race gaps for out-of-field teaching (inTable 5) are distinctly wider than the poverty and race gaps for teacher qualifications(in Table 2). In other words, although teachers in disadvantaged schools are slightly morelikely to have fewer qualifications, they are far more likely to be misassigned than are those inadvantaged schools. These cross-school findings are consistent across all three cycles ofthe SASS data and with analyses that use other measures of out-of-field teaching,such as the percentage of classes or the percentage of students taught by out-of-fieldteachers (e.g., Haycock, 1998, 2000; Ingersoll, 1996).
At the secondary level, out-of-field teaching levels are similar whether one islooking at teachers without a major or minor or at teachers without certification intheir assigned fields. For example, I have found in other analyses that about a third of
17

(1) (2) (3) (4) (5) (6) (7) (8)
Elem. English Math Science Life Physical Social HistoryScience Science Studies
Total 12.2 24.1 31.4 19.9 32.9 56.9 19.3 53.1
Poverty Enrollment
Low 11.6 21.8 27.5 17.2 28.9 50.6 16.2 47.1
High 20.8 20.1 37.6 28.0 39.4 68.4 29.6 63.6
Minority Enrollment
Low 8.1 21.7 27.3 17.0 32.1 55.3 18.8 55.4
High 19.5 28.5 37.8 24.6 33.6 54.2 25.5 56.8
Community
Rural 8.3 23.1 30.2 19.5 34.1 60.2 19.5 56.8
Suburban 14.5 21.8 29.6 21.5 32.1 55.1 16.9 50.6
Urban 14.7 25.3 33.1 16.7 31.8 50.5 21.1 48.0
Not Poor/White/Suburban 13.8 - - - - - - -
Poor/Minority/Urban 21.3 - - - - - - -
Teacher’s Experience
Less than 5 years 15.2 26.1 31.7 19.7 36.1 56.8 21.3 54.8
More than 25 years 11.5 17.8 25.6 13.3 24.5 52.7 14.8 48.7
Notes:
• Column 1—Elementary includes all those teaching in the fields of prekindergarten, kindergarten or generalelementary in grades K-8. It includes those teaching in self-contained classes, where the teacher teaches multiplesubjects to the same class of students all or most of the day. It includes K-8 teachers employed in middle schools. Itexcludes departmentalized teachers who teach subject-matter courses to several classes of different students all ormost of the day. Elementary teachers with a major or minor in the fields of pre-elementary, early childhoodeducation, or elementary education are defined as in-field.
• Columns 2-7—The teaching fields of English, math, science and social studies only include departmentalizedteachers in grades 7-12. It excludes those employed in middle schools. For details on definitions of these assignmentfields and the major/minors defined as in-field in each, see Ingersoll 1999.
• Columns 5, 6, and 8—The estimates for life science, physical science, and history represent the percentage of teacherswithout at least a minor in those particular subfields. For example, in science, teachers (column 4) who hold a minorin any one of the sciences are defined as in-field. On the other hand, in physical science, teachers (column 6)—whichincludes physics, chemistry, space science, and geology—must hold a minor in one of those physical sciences to bedefined as in-field, rather than simply a minor in any science.
• Low poverty refers to schools where 15% or less of the students receive publicly funded free or reduced pricelunches. High poverty refers to schools where over 80% do so.
• Low minority refers to schools where 15% or less of the students are minority. High minority refers to schools whereover 80% are. Middle categories of poverty and minority are not shown.
• Not Poor/White/Suburban refers to schools that are low poverty and low minority and suburban.• Poor/Minority/Urban refers to schools that are high poverty and high minority and urban.• “-” means too few cases for reliable estimate.• Columns 5 and 6 (life science and physical science) are subfields of Column 4 (science), and Column 8 (history) is a
subfield of Column 7 (social studies).
Table 5. Percentage of public school teachers in selected field without a major or aminor in that field, by school type and teacher experience.
18

public secondary math teachers do not have teaching certificates in math—a figuresimilar to those lacking a major or minor in math (Ingersoll, 1999). But focusing onthose without certificates can lead one to underestimate the amount of underqualifiedteaching within broad multi-disciplinarian fields, such as science and social studies.Teachers in these fields are routinely required to teach any of a wide array of disciplinesand subfields within the department. However, simply having a certificate in thelarger field may not mean that teachers are qualified to teach all of the subjects withinthe field. For example, a teacher with a degree in biology and a certificate in sciencemay not be qualified to teach physics. Indeed, in science and in social studies, asshown in columns 5, 6, and 8 in Table 5, there are high levels of within-department,but out-of-subfield teaching. Over half of those teaching physical science classes(chemistry, physics, earth, or space science) are without a major or minor in any of thephysical sciences. Likewise, over half of all those teaching history are without a majoror minor in history.
Several points must be stressed concerning these data on out-of-field teaching.On the one hand, there is no doubt that some of these out-of-field teachers may actuallybe qualified even though they do not have a minor or major in the field. Some may bequalified by virtue of knowledge gained through previous jobs, through lifeexperiences, or through informal training. Others may have completed substantialcollege coursework in a field and have a certificate but lack a major or minor in thatfield.
On the other hand, these measures represent a relatively low standard by whichto define a qualified teacher. To many observers, even a moderate number of teacherslacking the minimal prerequisite of a college minor signals the existence of seriousproblems in schools. Indeed, if the definition of a qualified teacher is upgraded toinclude only those who hold both a college major and a teaching certificate in thefield, the amount of out-of-field teaching substantially increases. (Ingersoll, 2001c).Moreover, the actual numbers of students affected are not trivial: every year in eachof the fields of English, math, and history well over four million secondary-levelstudents are taught by teachers with neither a major nor a minor in the field.
It is also important to recognize the implications of these data for explainingthe sources of out-of-field teaching. Many of those who subscribe to the teacher deficitperspective assume that out-of-field teaching is a problem of poorly prepared teachers.In this view, a lack of adequate rigor, breadth, and depth, especially in academic andsubstantive coursework, in college or university teacher training programs results inmore out-of-field teaching.10 Proponents of this view often argue that the problemcan be remedied by requiring prospective teachers to complete a “real” undergraduatemajor in an academic discipline.
The data show, however, that most teachers have at least a bachelor’s degreeand a full certificate. Many of these teachers have education, not academic, degrees.But having an education degree does not mean a teacher lacks content training in aparticular subject or specialty. Very few teachers have only a generic major or minorin education, such as in secondary education or curriculum. Most have subject-areaeducation majors or minors, such as in math education, English education, etc.
Of course, critics of teacher education have long argued that subject-areaeducation degrees, such as math education, have tended to be overloaded withrequired courses in education to the neglect of coursework in the subject itself. This isnot a new criticism; indeed it was a major point made in the Nation at Risk reportreleased in 1983 (National Commission on Excellence in Education). Precisely becauseof such problems many states have, over the past two decades, upgraded teachereducation by, among other things, requiring education majors to complete substantialcoursework in an academic discipline. For instance, at many teacher-training
19

institutions a degree in math education currently requires as much coursework in themath department as does a degree in math itself (National Association of State Directorsof Teacher Education and Certification, 1997).
No doubt the teaching force has and can continue to benefit from highereducation and training standards, but this view of out-of-field teaching misses thedistinction between training and assignment. Many teachers are assigned by theirprincipals to teach classes that do not match the field of their degree or certification orboth. The data show that, while beginning teachers are more prone than experiencedteachers to be misassigned, those teaching out of field at either the elementary orsecondary level are typically veterans with an average of 14 years of teachingexperience, and about 45 percent of out-of-field teachers hold graduate degrees indisciplines other than the subjects in which they have been assigned to teach. Hence,out-of-field teachers are typically experienced and qualified individuals who havebeen assigned to teach in fields that do not match their training or education. This isa widespread phenomenon; the data show that each year some out-of-field teachingtakes place in well over half of all U.S. secondary schools and each year over one fifthof the public secondary teaching force does some out-of-field teaching. At thesecondary level, these misassignments typically involve one or two classes out of anormal daily schedule of five classes.
If not due to inadequacies in the training of teachers, what is the reason for out-of-field teaching? What accounts for the degree to which school administratorsmisassign teachers, especially in schools serving disadvantaged populations?
The Sources of Out-of-Field Teaching
Teacher Shortages
Data from SASS and other NCES data sources show that, consistent with theshortage predictions, demand for teachers has increased since the mid 1980s (e.g., seeIngersoll, 1999, 2001b). Since 1984, student enrollments have increased, most schoolshave had job openings for teachers, and the size of the teacher workforce (K-12) hasincreased, although the rate of these increases began to decline slightly in the late1990s (Gerald & Hussar, 1998; Snyder, Hoffman, & Geddes, 1997, pp. 12-13). Mostimportant, substantial numbers of schools with teaching openings have experienceddifficulties with recruitment. For example, in both 1990-1991 and 1993-1994 about 47percent of schools with openings reported some degree of difficulty finding qualifiedcandidates in one or more fields.
The data also show there are several problems with teacher shortages as anexplanation for out-of-field teaching. First, shortages cannot explain the high levelsof out-of-field teaching that exist in English and social studies, fields that have longbeen known to have teacher surpluses. Second, even when the rates of studentenrollment increases were at their peak, only a minority of the total population ofschools actually experienced recruitment problems in any given field. For instance,the data show that in 1993-1994, 35 percent of secondary schools had job openings forEnglish teachers, and about one quarter had at least some difficulty filling the openings.But, this represented only nine percent of all secondary schools. Similarly, 34 percentof secondary schools had job openings for math teachers and just under half of theseindicated they had at least some difficulty filling them, but this represented only 16percent of all secondary schools (Figure 3).11
Comparing the data in Figure 3 and Table 5 clearly shows that these recruitingand hiring difficulties do not account for all, or even most, out-of-field teaching. Forexample, while only nine percent of secondary schools had any difficulty filling their
20

openings for English teachers in 1993 (Figure 3), almost a quarter of all employedpublic secondary-school English teachers did not have a major or minor in English orrelated subjects in that same year (Table 5). Likewise, while only 16 percent of secondaryschools reported problems filling their openings for math teachers, about a third ofall employed math teachers did not have a major or minor in math. Additional analysisindicates that levels of out-of-field teaching were higher in schools reporting moredifficulties in finding qualified candidates for their job openings. But the data alsoindicate that about half of all misassigned teachers in any given year were employedin schools that reported no difficulties whatsoever finding qualified candidates fortheir job openings that year.
In sum, the data show that some schools face difficulties finding qualifiedteachers to fill positions, and this problem leads to out-of-field teaching assignments.But the data suggest that shortages and their attendant hiring difficulties are not thesole factor behind out-of-field teaching. Rather than simply focusing on macro,demographic sources of this problem, this analysis hypothesizes that out-of-fieldteaching also occurs because of the way schools are organized and administered.
Figure 3. Percentage schools with teaching vacancies andpercentage schools with difficulties filling teachingvacancies, by field
0 20 40 8060 100
Elementary
Percent
579
359
3416
2416
2716
85
2715
DifficultiesVacancies
English
Math
Life Sciences
Physical Sciences
ESOL or Bilingual
Special Education
Notes: Data on the four academic fields refer to schools serving secondary students, data for ESOLand special special education refer to all schools, and data on elementary positions refer to elementaryschools. “Difficulty filling teaching vacancies” includes all those schools reporting either: “somewhatdifficult”, “very difficult”, or “could not fill” in reference to filling vacancies for the current school year.
21

Predictors of Out-of-Field TeachingThis section presents the results of multiple regression analyses estimating the
relative association between the dependent variable—the percentage of out-of-fieldclasses—and four groups of independent variables: teacher qualifications, schooldemographic characteristics, school recruiting and hiring difficulties, and schooladministrative practices and organizational characteristics.
Model 1 Model 2
(b) (se) (b) (se)
Intercept 41.4* 3.3 44.9* 3.06
Teacher Qualifications
Highest Degree -2.9* .427 -3.2* .41
Teaching Experience -.16* .028 -.15* .027
School Demographic Characteristics
Poverty Enrollment .09* .015 - -
Minority Enrollment - - .11* .01
Rural -3.8* .919 -2.0* .93
Suburban -1.2 .925 -.45 .902
School Recruiting and Hiring Difficulties
Teaching Job Openings -1.7 1.01 -1.53 .956
Hiring Difficulties .03 .183 -.04 .176
Administrative Practices/Organizational Characteristics
Major/Minor Required of Hires -1.9* .53 -1.7* .517
Principal Leadership -1.3* .38 -1.5* .363
Hiring/Assigning Underqualified 1.1* .53 .65 .520
Average Class Size -.67* .033 -.66* .031
Starting Teacher Salary (by 1000) .23* .107 .04 .104
Presence of Teacher Union .84 .77 1.34 .754
School Size (by 100) -.02 .06 -.13* .058
Proportion of School-Level Variance Explained (Rsq) .16 .19
Sample Size (N) 18,770 19,921
Notes:
• *p < .05 (Unstandardized coefficients displayed)• Model 1 includes a variable for school poverty enrollment• Model 2 includes a variable for school minority enrollment
Table 6. Multilevel Multiple Regression Analysis of Percent Secondary Level ClassesOut of Field
22

Table 6 displays the results of these analyses. Because school poverty enrollmentand school minority enrollment are highly inter-correlated, I tested their effectsseparately; Model 1 includes a variable for school poverty enrollment, and Model 2includes a variable for school minority enrollment. Moreover, this part of the analysisfocuses solely on the secondary level: grades 7-12. The data in the previous stage ofthe analysis (Table 5) indicated that levels of out-of-field teaching are more pronouncedin secondary schools than in elementary schools. Moreover, to many observers theproblem in secondary schools is a more compelling case because classes at thesecondary level usually require a greater level of subject-matter mastery and trainingon the part of teachers than do those at the elementary-school level, and, hence, beingtaught by an out-of-field teacher could be more consequential for students at thatlevel.
The models show that the two control measures of teacher qualifications areboth related to the degree to which teachers are assigned out of their fields. Teacherswithout at least a bachelor’s degree are, by definition, out of field. Teachers’ experienceis also strongly related; beginning teachers are more likely to be misassigned than aremore senior teachers. The data presented earlier in Table 5 showed that teachers inboth high-poverty and high-minority schools are more often out-of-field; the data inTable 6 document that this association holds up after controlling for other factors.However, while teachers in urban schools are more often out-of-field than teachers inrural schools, the difference between out-of-field teaching in urban and suburbanschools is not statistically significant (at a 95 percent level of confidence).
Surprisingly, school hiring and hiring difficulties themselves do not appear tobe major factors related to the amount of out-of-field teaching in schools. As discussedearlier, there is a significant bivariate positive correlation between the degree to whicha school has difficulty finding qualified candidates to fill their openings and the degreeof out-of-field teaching in the school. But after controlling for other factors, thisrelationship becomes weak and statistically insignificant, as shown in Table 6.
The question of particular interest here is: after controlling for thesecharacteristics of teachers and schools, what administrative practices andorganizational characteristics of schools have an independent association with theaverage amount of out-of-field teaching in schools? The analysis shows that, indeed,several aspects of schools are related to misassignment. For example, school districtsvary in the extent to which they impose standards on the teacher hiring process, andthese hiring regulations are related to the average degree of out-of-field teaching inschools. The SASS data (see Ingersoll, 2000) show that about two thirds of schooldistricts require that new teacher hires hold a college major or minor in the field to betaught, and, as shown in Table 6, teachers in schools governed by these district-levelpolicies do less out-of-field teaching.
The data also show that an additional factor associated with the degree of outof-field teaching in a school is the perceived leadership effectiveness of the principal.Schools vary in how well their teachers rate the performance of their principals onattributes of “good” leadership (e.g., principals that recognize good teaching,communicate well, are supportive, back teachers up). The data in Table 6 showsignificantly less out-of-field teaching occurring in schools in which the teachers highlyrate the leadership performance of their principals. Of course, it is unclear from thisfinding which aspects of principals’ behavior may be related to their staffingassignment practices and whether the attitudes of teachers toward principals are acause or effect of such practices.
While difficulty in filling teaching vacancies does not have an independenteffect on the degree of out-of-field teaching, how school administrators choose tocope with their hiring difficulties does have an effect. Of those schools with teaching
23

openings, about one third reported the use of one or more of the following strategiesto cover their vacancies: hiring less than fully qualified teachers, reassigning teacherstrained in another field to teach the unstaffed classes, or using substitute teachers.Almost by definition these strategies result in out-of-field teaching, and, as expected,the analysis in Model 1 shows more out-of-field teaching in schools that employedthese methods to fill their vacancies. In Model 2, however, this factor is not quitestatistically significant (at a 95 percent level of confidence).
In contrast, other schools administrators might opt to expand class sizes or cancelclasses rather then use misassignment to cope with staffing difficulties. The analysisshows that average class sizes are strongly related to the degree of out-of-field teachingin schools. Schools with larger classes tend to have less out-of-field teaching.
Finally, the models tested the association of several other characteristics ofschools with misassignment. Smaller schools have more out-of-field teaching in Model2, although this predictor fails to achieve statistical significance in Model 1. Higherstarting teacher salaries are weakly associated with higher levels of out-of-fieldteaching in Model 1 and fail to achieve statistical significance in Model 2. The presenceof a teacher union is not related to the extent of out-of-field teaching in either model.
Notably, these analyses failed to find any factors representing either the teacherdeficit or the organizational perspectives that accounted for the effects of poverty andminority enrollment. In other words, none of the variables, when introduced to themodels, significantly reduced the estimates for the effects of poverty and minorityenrollment.
Several cautions and limitations need to be stressed. First, it must be rememberedthese multivariate findings do not show causality but represent associations betweenparticular school measures and the degree of out-of-field teaching in schools. Second,the regression models account for only a portion of school-to-school differences inout-of-field teaching. Further research is needed to refine and verify these exploratoryfindings. If borne out by further analysis, these findings do, however, suggestimportant implications for both theory and policy concerning the problem ofunderqualified teachers and teaching.
IMPLICATIONS
The source of the problem of underqualified teachers, according to mostresearchers and commentators, lies primarily in inadequacies in the quantity ofteachers produced (i.e., shortages) and in the quality of the preparation these teachingcandidates receive (i.e., low standards for teacher training; paucity of academic subject-matter coursework). Consistent with this teacher deficit perspective, the dominantpolicy responses have been attempts to upgrade the quality of teachers through morerigorous training, testing, and licensing requirements and to increase the quantity ofteachers supplied through various recruitment strategies.
In contrast, this study tests the extent to which the problem of unqualifiedteachers has to do with the manner in which schools are organized and teachers areemployed and utilized. To do so, this analysis targets the practice of out-of-fieldteaching and shows that it is widespread, especially in those schools servingdisadvantaged communities. Furthermore, the analysis shows that out-of-fieldteaching is not primarily due to a deficit in either the quality or the quantity of teachers.Rather, out-of-field teaching is a common administrative practice whereby otherwisequalified teachers are assigned by school principals to teach classes in subjects whichdo not match their fields of training. This practice takes place as often as not in schoolsthat do not suffer from teacher recruitment problems. Hence, this analysis suggests
24

that the above kinds of teacher reforms, while often highly worthwhile, will noteliminate the problem of underqualified teaching unless they also address the problemof misassignment. In short, recruiting large numbers of new candidates into teachingand mandating more rigorous training requirements for them will not solve theproblem of underqualified teaching if large numbers of such teachers, especially indisadvantaged schools, continue to be assigned to teach subjects other than those forwhich they were trained.
Focusing blame on teachers, on teacher training institutions, or on inexorable,macro demographic trends suggests that schools are simply victims and divertsattention from an important root of the problem—the way schools are organized andteachers are managed. A central objective of this analysis was to explore which aspectsof the organization and administration of schools factor into the degree ofmisassignment in schools. My results suggest that the way school administrators—especially school principals—respond to and cope with staffing decisions andchallenges affects the levels of out-of-field teaching more than does the extent to whichschools face teacher shortages and attendant hiring difficulties. When facing difficultyfinding qualified candidates to fill teaching job openings, some school principals resortto hiring less than fully qualified teachers, assigning teachers of one subject or gradelevel to teach classes in others, or employing substitute teachers to cover hard-to-staffclasses. These decisions, of course, result in more out-of-field teaching. Sometimesthese choices are unavoidable and some out of field teaching must be expected. Butthe results also show that school principals vary in their staffing strategies. Sometimes,top-down regulations shape the choices available. For example, school districts thathave formal regulations concerning minimal training requirements for new hires haveless out-of-field teaching. Interestingly, one of the stronger predictors of the amountof out-of-field teaching in schools is the leadership performance of principals. Themeasure used for the latter was a composite indicator based on evaluations by teachersand, hence, could be highly subjective. Like the other factors, however, it is also highlysuggestive.
What all of these findings collectively suggest is a role for managerial choice,agency, and responsibility—elements often overlooked in the educational literatureon the sources of underqualified teachers. One strategy for raising teaching quality inschools would be to improve the assignment of teachers already employed in schools.This would be a low-cost alternative or complement to strategies aiming to modifythe quality or quantity of teacher training graduates. It would also be an interventionthat could be undertaken immediately, as opposed to the lag time it takes formodifications in the output of teacher training institutions to actually lead to changesin classroom practice in schools.
While this analysis suggests some alternative staffing strategies for schoolleaders, it does not suggest that any of these options will be easy or cost free. Staffingdecisions involve some difficult trade-offs and tough choices for school administrators.For example, lowering class sizes, currently a popular reform idea, appears to comeat the expense of increasing out-of-field teaching. Likewise, the data suggest reducingthe size of schools, another currently popular reform idea, may also result in moreout-of-field teaching. The results also contradict the view that teacher unions are amajor source of out-of-field teaching. Schools with unions do not have more out-of-field teaching. Union work rules certainly have an impact on the management andadministration of schools, but eliminating teacher unions will not eliminate out-of-field teaching.
25

FUTURE RESEARCH POSSIBILITIES
The large-scale survey data analyzed here provide an overall portrait of thelevels and sources of out-of-field teaching and can suggest which factors are associatedwith out-of-field teaching. But they have obvious limits for understanding theprocesses behind school staffing. Follow-up field investigations are needed toilluminate the decision-making processes surrounding the hiring, assignment, andutilization of teachers in particular kinds of schools. What are the hidden incentivessystems within which administrators make staffing decisions? How do particularteachers come to be teaching particular classes? What are the reasons behind themisassignment of teachers?
Although this analysis has begun to explore the factors related to school-to-school differences in out-of-field teaching, it does not address adequately a largerquestion: Why is out-of-field teaching prevalent across the American K-12 educationsystem as a whole? In addition to close-up, micro-level field studies, a second avenuefor further research is macro-level, historical, and comparative investigation of theroots of this mode of organizing the work of teachers. One possible explanation isthat the prevalence of out-of-field teaching is rooted in the semi-professional status ofteaching—a predominantly female occupation.
Unlike Canada and many European and Asian nations, this country’s elementaryand secondary school teaching force is largely treated as lower-status, semi-skilledworkers, especially those working in disadvantaged schools. Since the turn of thecentury American educators have promoted the view that teaching, like the traditionalmale-dominated professions, is highly complex work requiring specialized knowledgeand skill and, like these professions, deserves commensurate prestige, authority, andcompensation. These efforts have, however, met only limited success (Lortie, 1969;Ingersoll, 2000). The comparison with traditional professions is stark. Few wouldrequire cardiologists to deliver babies, real estate lawyers to defend criminal cases,chemical engineers to design bridges, or sociology professors to teach English. Thecommonly held assumption is that such traditional professions require a great deal ofexpertise and, hence, specialization is necessary. In contrast, underlying out-of-fieldteaching is the assumption that female-dominated, pre-collegiate school teachingrequires far less skill, training, and expertise than these traditional professions, and,hence, specialization is less necessary. From this perspective, the continuing treatmentand status of teaching as a semi-profession has resulted in what the data tell us, thatout-of-field teaching is not simply an emergency condition, but a common and acceptedadministrative practice in many schools in this country, especially those indisadvantaged communities. From this perspective, the long-term solution toupgrading the quality of teaching is to upgrade the quality of the teaching job. Inshort, well-paid, well-respected professions that offer good working conditions wouldbe less inclined to resort to lowering standards as a coping mechanism.
26

ENDNOTES1 A notable exception is recent work by Darling-Hammond (1999) on state-
to-state differences in levels of qualified teachers. Her work traces the effectsof a range of state-level contextual factors such as the presence ofprofessional standards boards, the proportion of accredited teacher trainingprograms, and the extent of teacher hiring standards at the school-districtlevel on aggregate levels of qualified teachers in the state.
2 For further discussion of this debate over the necessity of teacherqualifications, see Ingersoll, 2001a.
3 For a detailed review and evaluation of a variety of different measures ofout-of-field teaching, see Ingersoll, 2001c.
4 For details on this first type of out-of-field teaching measure and a chartshowing the categorization of disciplines and subjects into fields of trainingand fields of teaching assignment, see Ingersoll, 1999.
5 For more detail on this second type of out-of-field teaching measure, seeIngersoll, 1995.
6 In the multilevel models, the level-1 (within-school) portion investigatesthe changes in the percent of out-of-field classes for each teacher in eachschool as a function of two of each teacher’s background characteristics(education and teaching experience) and random error. The regressioncoefficients are structural relations occurring with each school that indicatehow the percent of out-of-field classes in each school is distributed acrossthe measured teacher characteristics.
The level-2 (between-school) portion of the models investigates thechanges in each school’s mean percent of out-of-field classes, adjusted forteacher characteristics, as a function of a number of school-levelcharacteristics. These regression coefficients represent structuralrelationships between school-level characteristics and the adjusted meanof percent out-of-field classes for each school.
Because multilevel models are more general than multiple regressionmodels of the type estimated by ordinary least squares or probabilityweighted least squares, there are additional choices to make regarding thespecification of the model. These include: (1) whether to treat the slopecoefficients in the level-1 model as random or fixed and (2) whether to centerteacher characteristics data around the mean value for teachers in eachschool.
The models estimated here treat the intercept in the level-1 model asrandom and made up of two components: a component that is common toall teachers within a school and a component that is unique to each teacher.The common school component arises from unmeasured school-levelcharacteristics. Each of the remaining terms in the level-1 model (years ofteaching experience, education) are modeled as having fixed effects. Thisis how the slope coefficients in a standard linear regression analysis aremodeled. They are fixed parameters to be estimated, as opposed to randomparameters with means and standard deviations. For the model estimatedhere, there are no reasons to suspect that the effects of teacher characteristicshave random effects on out-of-field teaching, and the available data are notextensive enough (in terms of teachers per school) to estimate such a complexmodel, so it is not pursued in this analysis.
27

The models estimated here also do not center the teacher characteristicsdata around the school means. That is, the coefficients for the teachercharacteristics will not be expressed as deviations from the school meanbut as deviations from the entire sample. If one centers around the meanvalue for teachers in each school, then one uses the variation in teachercharacteristics within schools to estimate the effect of the teachercharacteristics on out-of-field teaching. If one does not center, then bothwithin- and between-school variation in teacher characteristics are used toestimate the effects of the teacher characteristics on out-of-field teaching.
Because there are not compelling theoretical reasons to do so and alsobecause of limitations in the within-school sample size, this analysis doesnot center the teacher data. Hence, in this analysis, the effects on out-of-field classes of, for instance, having more or less teaching experience do notrefer to comparisons within each school but across the entire sample ofteachers.
7 The data in column 1 of Table 5 refer to public elementary and middle school(grades K-8) teachers whose assignment is pre-elementary or generalelementary and who teach in self-contained classes. The latter refers to thosewho teach multiple subjects to the same students for all or most of the day.This excludes departmentalized elementary teachers and specialists suchas who teach art, music, physical education, math, or special education todifferent students throughout the day.
8 The data in columns 2-8 of Table 5 refer to public secondary school (grades7-12) teachers who are departmentalized. The latter refers to those whoteach subject-matter classes to different classes of students for all or most ofthe day. It excludes departmentalized teachers employed in middle schools.
9 See Ingersoll 1999 and 2001c for details on these particular measures.10 This viewpoint is especially common among news columnists. See for
example, the syndicated columns of David Broder, Thomas Sowell, MaggieGallagher the week of September 14 to 20th, 1996.
11 In Figure 3, the data on the four academic fields refer to schools servingsecondary students, the data for ESOL and special education refer to allschools, and the data on elementary positions refer to elementary schools.“A difficulty filling teaching vacancies” includes all those schools reportingeither: “somewhat difficult”; “very difficult”; or “could not fill”; in referenceto filling vacancies for the current school year.
12 See, Haycock, 1998; Stecher, Bohrnstedt, Kirst, McRobbie, & Williams, 2001;and Bohrnstedt, Stecher, & Wiley, 2000 for insightful discussion of theunanticipated outcomes of class-size reduction reforms.
28

REFERENCES
Bandeira de Mello, V., & Broughman, S. (1996). SASS by state. Washington, DC: U.S.Department of Education, National Center for Education Statistics.
Bennefield, R. (1997, October). Black America and the great debate over school reform.Crisis, 27-32.
Blank, R., & Gruebel, D. (1993). State indicators of science and mathematics education1993. State and national trends from the 1991-92 school year. Washington, DC: Councilof Chief State School Officers.
Blank, R., & Langesen, D. (1999). State indicators of science and mathematics education1999. State by State Trends and New Indicators from the 1997-98 School Year.Washington, DC: Council of Chief State School Officers.
Bobbitt, S., & McMillen, M. (1995). Qualifications of the public school teacher workforce.Washington, DC: National Center for Education Statistics.
Boe, E., & Gilford, D. (1992). Teacher supply, demand and quality. Washington, DC:National Academy Press.
Bohrnstedt, G., Stecher, B., & Wiley, E. (2000). The California class size reductionevaluation: Lessons learned. In M. C. Wang & J. D. Finn (Eds.), How small classeshelp teachers do their best (pp. 201-226). Philadelphia, PA: Temple University Centerfor Research in Human Development and Education.
Bryk, A., Lee, V., & Smith, J. (1990). High school organization and its effects on teachersand students: An interpretive summary of the research. In W. H. Clune & J. F.Witte (Eds.), Choice and control in American education, volume 1: The theory of choiceand control in education (pp. 135-226). New York: Falmer Press.
Chester, M., Offenberg, R., & Xu, M. (2001). Urban teacher transfer. Paper presented atthe Annual Meeting of the American Educational Research Association, Seattle,WA.
Clinton, W. (1999). State of the Union Address. Washington, DC: Government PrintingOffice.
Choy, S., Bobbitt, S., Henke, R., Medrich, E., Horn, L., &. Lieberman, J. (1993). Schoolsand staffing in the U.S.: A statistical profile, 1990-91. Washington, DC: National Centerfor Education Statistics.
Darling-Hammond, L. (1987). Teacher quality and equality. In P. Keating & J. I. Goodlad(Eds.), Access to knowledge. New York: College Entrance Examination Board.
Darling-Hammond, L. (1999). Teacher quality and student achievement: A review of statepolicy evidence. Center for the Study of Teaching and Policy, Seattle, WA: Universityof Washington.
Dreeben, R., & Gamoran, A. (1986). Race, instruction and learning. American SociologicalReview, 51, 660-669.
Education Trust (1996, 1998). Education Watch. Washington, DC: American Associationfor Higher Education.
Education Week (1997, 1998, 2000). Quality counts: A report on education in the 50 states.Washington, DC: Author.
Elmore, R., & Fuhrman, S. (1995). Opportunity to learn and the state role in education.Teachers' College Record, 96(3), 433-458.
29

Feistritzer, E. (1997). Alternative teacher certification: A state-by-state analysis 1997.Washington, DC: National Center for Education Information.
Ferguson, R. (1991). Paying for public education: New evidence on how and whymoney matters. Harvard Journal on Legislation, 28, 465-498.
Gerald, D., & Hussar, W. (1998). Projections of education statistics to 2008. Washington,DC: National Center for Education Statistics.
Greenwald, R., Hedges, L., & Laine, R. (1996). The effect of school resources on studentachievement. Review of Educational Research, 66, 361-396.
Guiton, G., & Oakes, J.( 1995). Opportunity-to-learn and conceptions of educationalequality. Educational Evaluation and Policy Analysis, 17(3), 323-336.
Haertel, E. (1991). New forms of teacher assessment. In Review of Research in Education(pp. 3-29). Washington, DC. American Educational Research Association.
Haggstrom, G. W., Darling-Hammond, L., & Grissmer, D. (1988). Assessing teachersupply and demand. Santa Monica, CA: Rand Corporation.
Haney, W., Madus, G., & Kreitzer, A. (1987). Charms talismanic: Testing teachers forthe improvement of American education. Review of Research in Education, 13, 169-238. Washington, DC: American Educational Research Association.
Haycock, K. (1998). Good teaching matters...a lot. Thinking K-16: A Publication of theEducation Trust 3(2), 3B14.
Haycock, K. (2000). No more settling for less. Thinking K-16: A Publication of the EducationTrust, 4(1), 3-12.
Hedges, L., Laine, R., & Greenwald, R. (1994). A meta-analysis of the effects ofdifferential school inputs on student outcomes. Educational Researcher, 23, 5-14.
Henke, R., Choy, S., & Geis, S. (1996). Schools and staffing in the U.S.: A statistical profile,1993-94. Washington, DC: National Center for Education Statistics.
Henke, R., Choy, S., Chen, X., Geis, S., & Alt, M. (1997). America’s teachers: Profile of aprofession, 1993-94. Washington, DC: National Center for Education Statistics.
Hirsch, E, Koppich, J,. & Knapp, M. (2001). Revisiting what states are doing to improvethe quality of teaching: An update on patterns and trends. Center for the Study ofTeaching and Policy, University of Washington.
Horn, L., Hafner, A., & Owings, J. (1992). A profile of American eighth-grade mathematicsand science instruction. National Education Longitudinal Study of 1988. Washington,DC: National Center of Education Statistics.
Ingersoll, R. (1995). Teacher supply, teacher qualifications and teacher turnover. Washington,DC: National Center for Education Statistics.
Ingersoll, R. (1996). Out-of-field teaching and educational equality. Washington, DC:National Center for Education Statistics.
Ingersoll, R. (1999).The problem of underqualified teachers in American secondaryschools. Educational Researcher, 28(2), 26-37.
Ingersoll, R. (2000). The status of teaching as a profession. In J. Ballantine & J. Spade(Eds.), Schools and society: A sociological approach to education (pp. 115-29). Belmont,CA: Wadsworth Press.
Ingersoll, R. (2001a). Misunderstanding the problem of out-of-field teaching.Educational Researcher, 30(1). 21- 22.
30

Ingersoll, R. (2001b). Teacher turnover and teacher shortages: An organizationalanalysis. American Educational Research Journal, 37(3).
Ingersoll, R. (2001c). Measuring out-of-field teaching. Manuscript submitted forpublication.
Kennedy, M. (1992). The problem of improving teacher quality while balancing supplyand demand. In E. Boe, & D. Gilford (Eds.), Teacher supply, demand and quality (pp.63-126). Washington, DC: National Academy Press.
Kopp, W. (1992). Reforming schools of education will not be enough. Yale Law andPolicy Review, 10, 58-68.
Kozol, J. (1991). Savage inequalities. New York: Harper-Collins.
Lortie, D. (1969). The balance of control and autonomy in elementary school teaching.In A. Etzioni A. (Ed.), The semi-professions and their organizations: Teachers, nursesand social workers (pp. 1-53). New York: Free Press.
National Association of State Directors of Teacher Education and Certification. (1997).Manual on Certification and Preparation of Educational Personnel in the United Statesand Canada.
National Commission on Excellence in Education. (1983). A Nation at risk: The imperativefor educational reform. Washington, DC: Government Printing Office.
National Commission on Teaching and America’s Future. (1996). What matters most:Teaching for America’s future. New York: NCTAF.
National Commission on Teaching and America’s Future. (1997). Doing what mattersmost: Investing in quality teaching. New York: NCTAF.
Oakes, J. (1985). Keeping track: How schools structure inequality. New Haven: YaleUniversity Press.
Oakes, J. (1990). Multiplying inequalities: The effects of race, social class, and tracking onopportunities to learn mathematics and science. Santa Monica, CA: The RANDCorporation.
Pascal, A. (1987). The qualifications of teachers in American high schools. Santa Monica,CA: The RAND Corporation.
Raudenbush, S., Fotiu, R., & Cheong, Y. (1998). Inequality of access to educationalresources. Educational Evaluation and Policy Analysis, 20, 253-267.
Raudenbush, S., Fotiu, R., & Cheong, Y. (1999). Synthesizing results from the trialstate assessment. Journal of Educational and Behavioral Statistics, 24(4), 413-438.
Robinson, V. (1985). Making do in the classroom: A report on the misassignment of teachers.Washington, DC: Council for Basic Education and American Federation ofTeachers.
Rosenbaum, J. (1976). Making inequality. New York: John Wiley & Sons.
Ruby, Allen. (1999). An Implementable Curriculum Approach in Improving ScienceInstruction in Urban Schools. Paper presented at the Annual Meeting of theAmerican Educational Research Association, Montreal.
Shanker, A. (1985, Oct. 27). Education’s dirty little secret. New York Times, p. E9.
Smerdon, B. (1999). Teacher quality: A report on the preparation and qualifications of publicschool teachers. Washington, DC: National Center for Education Statistics.
31

Snyder, T., Hoffman, C., & Geddes, C. (1997). The Digest of Education. Washington,DC: National Center for Education Statistics.
Stecher, B., Bohrnstedt, G., Kirst, M., McRobbie, J., & Williams, T. (2001). Class-sizereduction in California: A story of hope, promise and unintended consequences.Phi Delta Kappan, 82(9), 670-674.
Stevens, F. (1993). Applying an opportunity-to-learn conceptual framework to theinvestigation of the effects of teaching practices. Journal of Negro Education, 62(3),232-259.
Toch, T. (1996, February 26). Why teachers don’t teach: How teacher unions arewrecking our schools, U.S. News and World Report. 62-71.
Urban League. (1999). The state of black America. New York: Author.
Wilson, W. J. (1996). When work disappears: The world of the new urban poor. New York:Knopf.
32

Center Affiliates
American Association of Colleges of Teacher Education American Association of School AdministratorsAmerican Federation of Teachers Association for Supervision and Curriculum DevelopmentCouncil for Chief State School Officers International Reading AssociationNational Alliance of Business National Association of Elementary School PrincipalsNational Association of Secondary School Principals National Association of State Boards of EducationNational Board for Professional Teaching Standards National Conference of State LegislaturesNational Council for Accreditation of Teacher Education National Council for the Social StudiesNational Council of Teachers of English National Council of Teachers of MathematicsNational Education Association National Governors’ AssociationNational School Boards Association National Science Teachers AssociationNational Staff Development Council National Urban CoalitionNational Urban League Teachers Union Reform Network
Center Team
Principal Investigators and Co-Principal Investigators
U N I V E R S I T Y O F W A S H I N G T O N
Michael Knapp, Center DirectorJames BanksElizabeth DutroMargaret PleckiSam WineburgSheila Valencia
S TA N F O R D U N I V E R S I T Y
Linda Darling-HammondPamela GrossmanMilbrey McLaughlinJoan Talbert
U N I V E R S I T Y O F M I C H I G A N
Deborah Loewenberg BallDavid CohenEdward Silver
U N I V E R S I T Y O F P E N N S Y LVA N I A
Thomas CorcoranRichard Ingersoll
Researchers at Other InstitutionsBarnett Berry, University of North CarolinaRobert Floden, Michigan State UniversityDavid Monk, Pennsylvania State UniversityJon Snyder, University of California at Santa BarbaraJudy Swanson, Education Matters, Inc.Suzanne Wilson, Michigan State University
Contact Information
Michael S. Knapp, Center DirectorMiller Hall M201, College of EducationUniversity of Washington, Box 353600Seattle, WA 98195-3600email: [email protected]
Michele C. Ferguson, Center ManagerMiller Hall 203C, College of EducationUniversity of Washington, Box 353600Seattle, WA 98195-3600Phone: (206) 221-4114FAX: (206) 616-6762email: [email protected]
Sally Brown, Communications DirectorMiller Hall 404B, College of EducationUniversity of Washington, Box 353600Seattle, WA 98195-3600Phone: (206) 543-5319FAX: (206) 616-6762email: [email protected]
Web Addresshttp://www.ctpweb.org
CTP Research Reports
The Center’s Research Report series presents the findings of CTP studies, analyses, reviews, and conceptual work.In addition to internal review by Center members, each report has been reviewed externally by at least two scholarsand revised in light of the reviewers’ comments and suggestions. Along with CTP Working Papers, Policy Briefs, andOccasional Papers, these reports are available for download from the Center’s website: www.ctpweb.org