
Our Mission: Deliver Clean, Affordable, Reliable Energy ...
22
Our Mission: Deliver Clean, Affordable, Reliable Energy and Excellent Customer Service and Excellent Customer Service
Transcript of Our Mission: Deliver Clean, Affordable, Reliable Energy ...
Our Mission:Deliver Clean, Affordable, Reliable Energy
and Excellent Customer Serviceand Excellent Customer Service
( )
FY 2009Actual
FY 2010Amended
FY 2010CYE
FY 2011Proposed
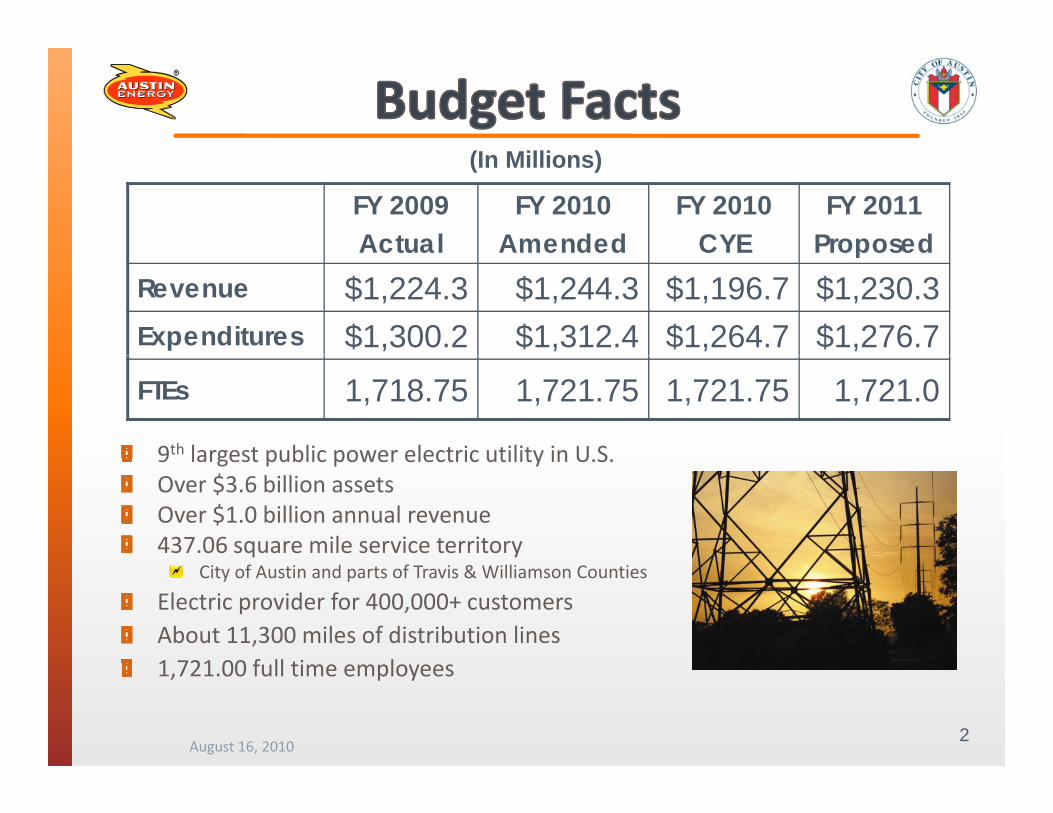
(In Millions)
c ua e ded C oposedRevenue $1,224.3 $1,244.3 $1,196.7 $1,230.3Expenditures $1,300.2 $1,312.4 $1,264.7 $1,276.7FTEs 1,718.75 1,721.75 1,721.75 1,721.0
9th largest public power electric utility in U S9 largest public power electric utility in U.S.Over $3.6 billion assetsOver $1.0 billion annual revenue437.06 square mile service territory
City of Austin and parts of Travis & Williamson Counties
Electric provider for 400,000+ customersAbout 11,300 miles of distribution lines1 721 00 f ll ti l
August 16, 20102
1,721.00 full time employees
#1 in voluntary renewable energy sales in U.S. for 8th consecutive year
ARRA grant recipient $23.9 million
G ti R l d t d bj t t d l t fGeneration Resource plan adopted, subject to development of Affordability Matrix
Energized the rebuilt Koenig Lane substation
Replaced over 55 miles of distribution line
Energized 100 MW peaking units at Sand Hill Energy Center
Initiated project to replace customer billing system
Preparation and testing for Nodal market which begins December 2010
Quality Management (ISO) certification for Customer Care; recertification for Electric Services Deliveryy
Completed installation of remaining automated meters
Austin designated as a pilot electric car city for the Chevy Volt
August 16, 20103
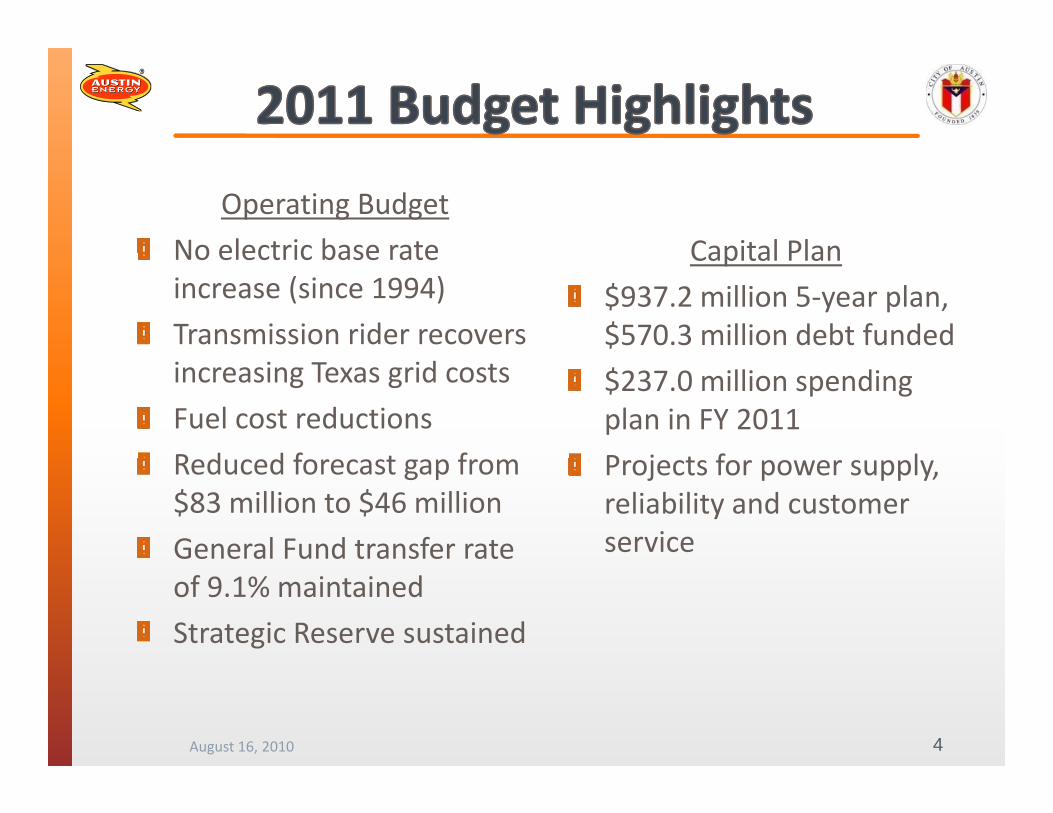
Operating Budget
No electric base rate Capital PlanNo electric base rate increase (since 1994)
Transmission rider recovers
Capital Plan
$937.2 million 5‐year plan, $570.3 million debt funded
increasing Texas grid costs
Fuel cost reductions
R d d f t f
$237.0 million spending plan in FY 2011
P j t f lReduced forecast gap from $83 million to $46 million
General Fund transfer rate
Projects for power supply, reliability and customer service
of 9.1% maintained
Strategic Reserve sustained
August 16, 2010 4
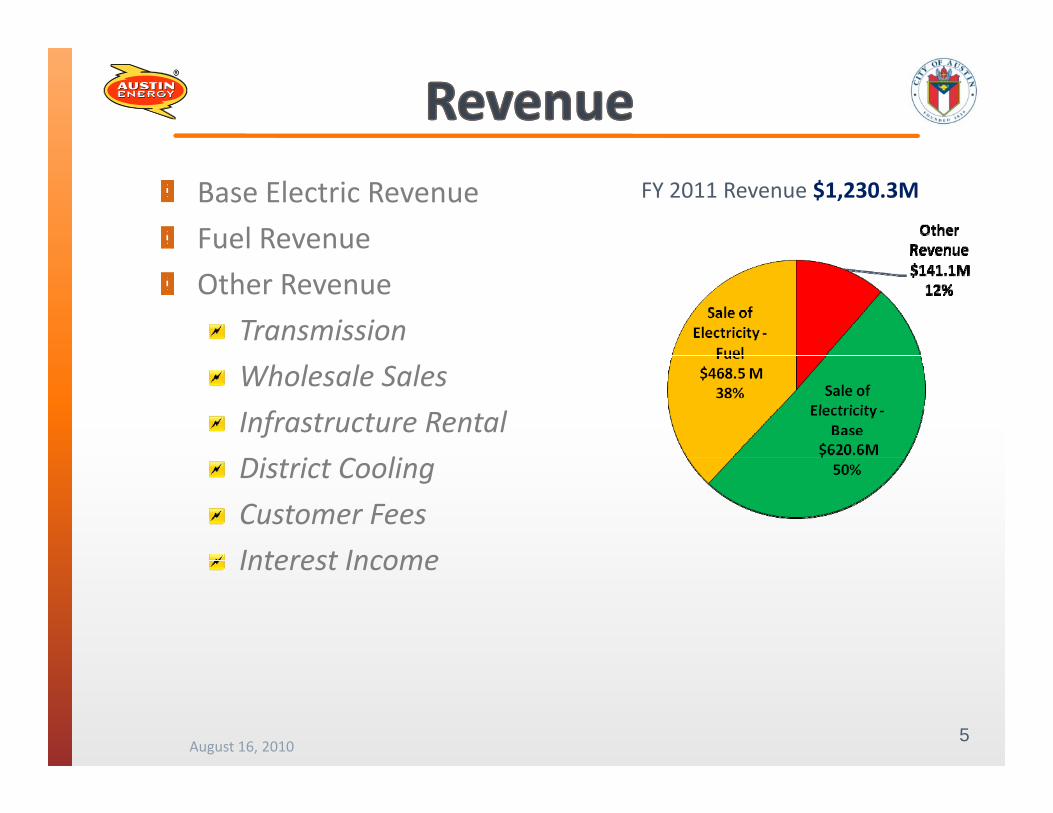
Base Electric Revenue
Fuel Revenue
FY 2011 Revenue $1,230.3M
Other Revenue
Transmission
Wholesale Sales
Infrastructure Rental
Di i C liDistrict Cooling
Customer Fees
Interest IncomeInterest Income
August 16, 20105

$1 263
$1,500Revenue History by Major Category (in millions)
$1,109.3 $1,089.0
$1,263.5$1,181.1
$1,242.3$1,194.7
$1,230.3
$1,000
$500
$0
2006 2007 2008 2009 2010 Budget 2010 CYE 2011 Proposed
Base Revenue Transmission Revenue Other Revenue Interest Income Fuel Revenue Total Revenue
August 16, 20106

10%
Retail kWh Sales ‐ % Change Year over Year
N li d W th ForecastActual
6%
8%
s Fiscal Year
Normalized Weather ForecastActual
4%
6%
ange
from
Previou
s
0%
2%
2002 2003 2004 2005 2006 2007 2008 2009 2010 2011
Percen
t cha
Fiscal Year
4%
‐2%
2002 2003 2004 2005 2006 2007 2008 2009 2010 CYE
2011 Proposed
Fiscal Year
Recession & Slow Recovery
Dot Com Bust
August 16, 20107
‐4%
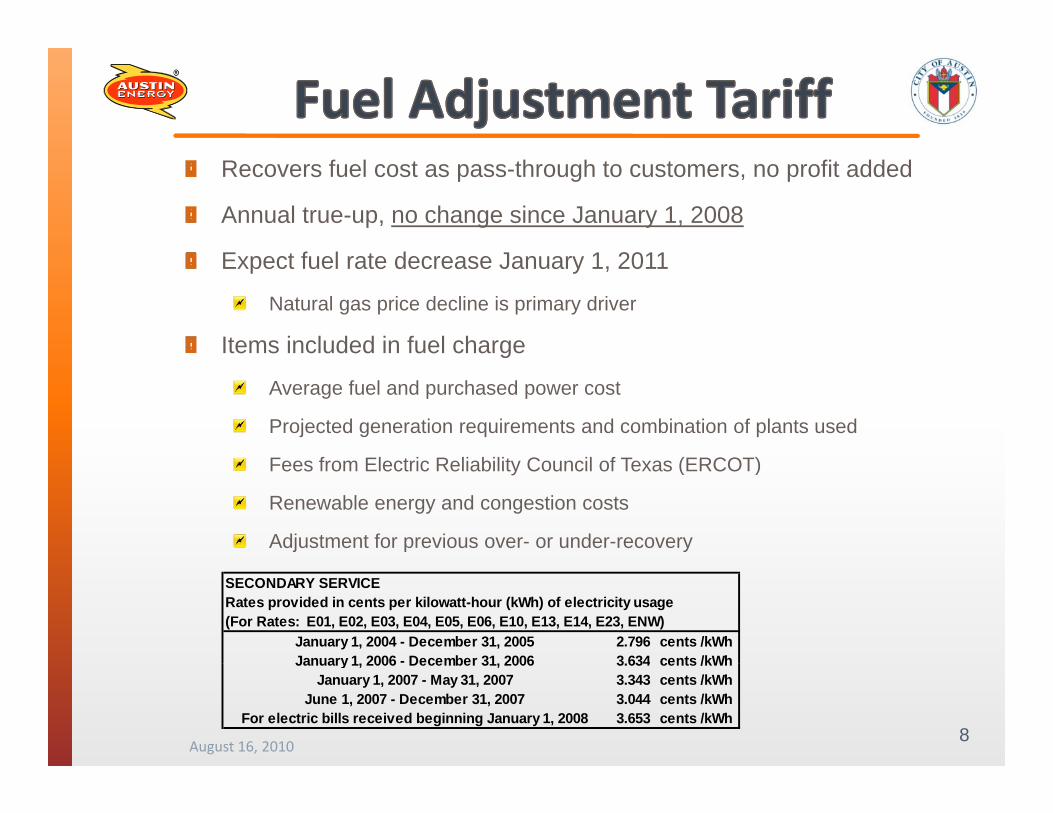
Recovers fuel cost as pass-through to customers, no profit added
Annual true-up, no change since January 1, 2008
E t f l t d J 1 2011Expect fuel rate decrease January 1, 2011
Natural gas price decline is primary driver
Items included in fuel chargeg
Average fuel and purchased power cost
Projected generation requirements and combination of plants used
F f El t i R li bilit C il f T (ERCOT)Fees from Electric Reliability Council of Texas (ERCOT)
Renewable energy and congestion costs
Adjustment for previous over- or under-recovery
SECONDARY SERVICERates provided in cents per kilowatt-hour (kWh) of electricity usage(For Rates: E01, E02, E03, E04, E05, E06, E10, E13, E14, E23, ENW)
January 1, 2004 - December 31, 2005 2.796 cents /kWhJanuary 1 2006 - December 31 2006 3 634 cents /kWh
August 16, 20108
January 1, 2006 December 31, 2006 3.634 cents /kWhJanuary 1, 2007 - May 31, 2007 3.343 cents /kWh
June 1, 2007 - December 31, 2007 3.044 cents /kWhFor electric bills received beginning January 1, 2008 3.653 cents /kWh
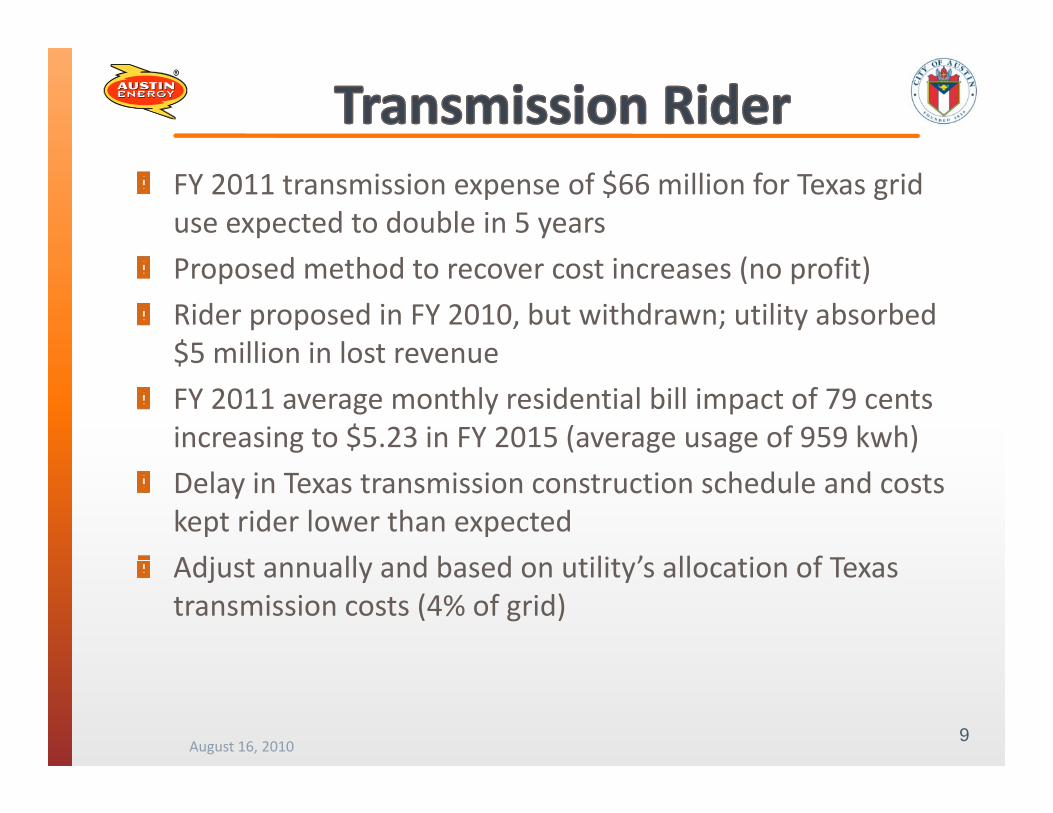
FY 2011 transmission expense of $66 million for Texas grid use expected to double in 5 years
Proposed method to recover cost increases (no profit)
Rider proposed in FY 2010, but withdrawn; utility absorbed $5 million in lost revenue$5 million in lost revenue
FY 2011 average monthly residential bill impact of 79 cents increasing to $5.23 in FY 2015 (average usage of 959 kwh)
Delay in Texas transmission construction schedule and costs kept rider lower than expected
Adj t ll d b d tilit ’ ll ti f TAdjust annually and based on utility’s allocation of Texas transmission costs (4% of grid)
August 16, 20109

$100
$150
$200 Residential Electric Bills - February 2010 Using 1,000 kWh
Highest Price Lowest Price
$148$141$144
Electric Bills for Major Texas Cities
Retail rates remain
$91 $90 $83 $90 $87
$0
$50
$100 Retail rates remain competitive compared to
other Texas utilities.
Summer 2010 and WinterCorpus Christi
Houston Dallas Austin Energy
San Antonio (CPS Energy)
$200 Residential Electric Bills - June 2010 Using 1 000 kWh
Summer 2010 and Winter 2010 bill comparison.
$100
$150
Residential Electric Bills - June 2010 Using 1,000 kWhHighest Price Lowest Price
$146$130
$139
Charts provided for informational purposes only. Average usage will vary by city. Prices may vary by season and usage.
Source: Public Utility Commission of Texas. Additional information on Texas providers can be f d
$92 $87 $83 $99 $95
$0
$50
C H t D ll A ti S A t i
found at www.puc.state.tx.us .
Average residential customer usage in AustinJune 2010 at 1,098 kWh. February 2010 at 808 kWh.
August 16, 2010 10
Corpus Christi
Houston Dallas Austin Energy
San Antonio
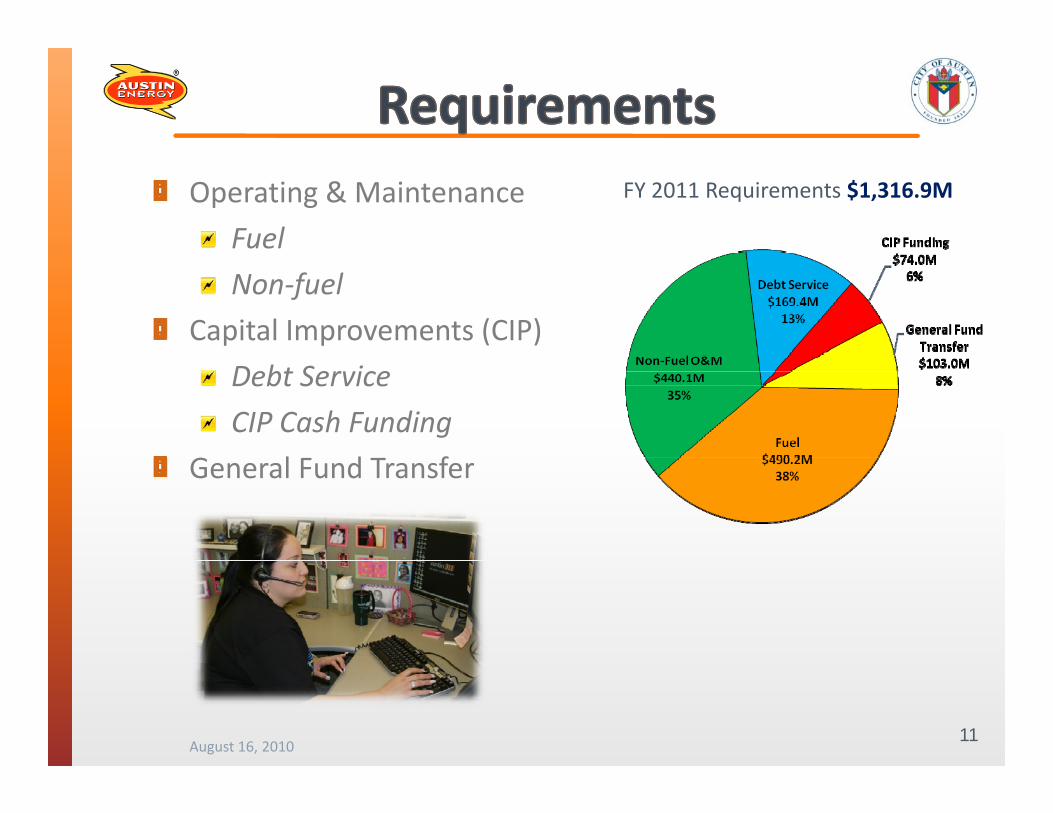
FY 2011 Requirements $1,316.9MOperating & Maintenance
Fuel
Non‐fuel
Capital Improvements (CIP)
Debt Service
CIP Cash Funding
G l F d T fGeneral Fund Transfer
August 16, 201011
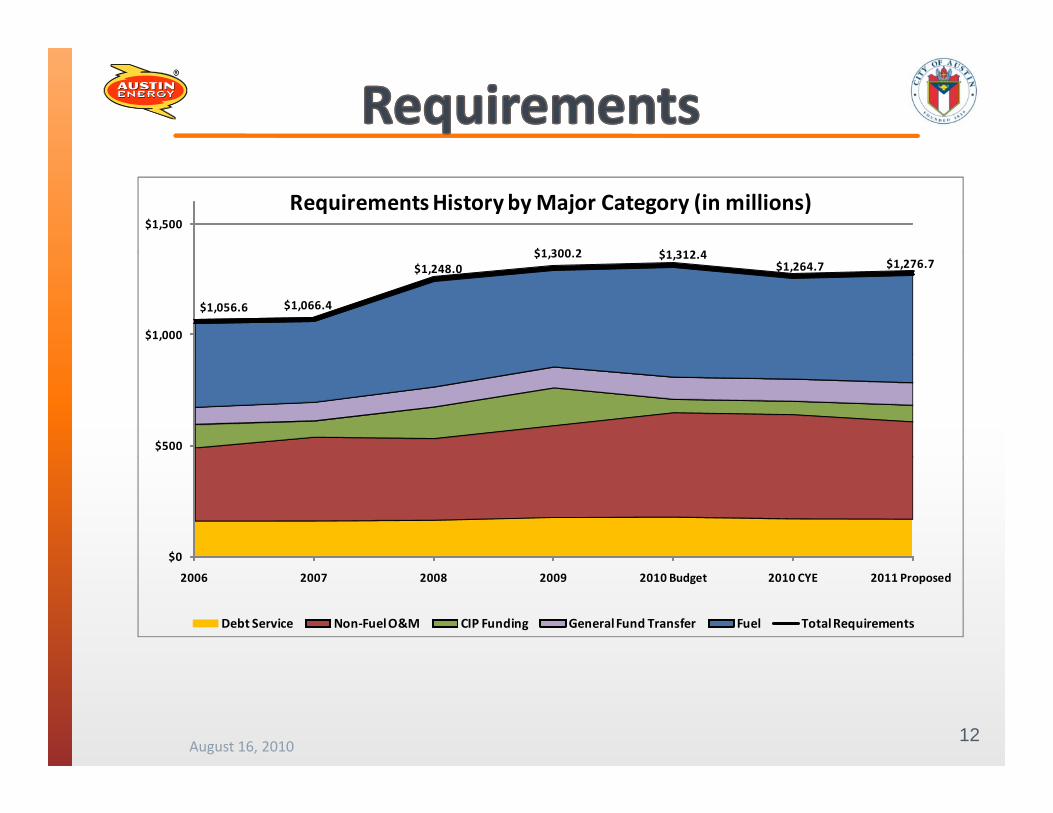
$1 300 2 $1 312 4
$1,500Requirements History by Major Category (in millions)
$1,056.6 $1,066.4
$1,248.0$1,300.2 $1,312.4
$1,264.7 $1,276.7
$1,000
$500
$0$0
2006 2007 2008 2009 2010 Budget 2010 CYE 2011 Proposed
Debt Service Non‐Fuel O&M CIP Funding General Fund Transfer Fuel Total Requirements
August 16, 201012
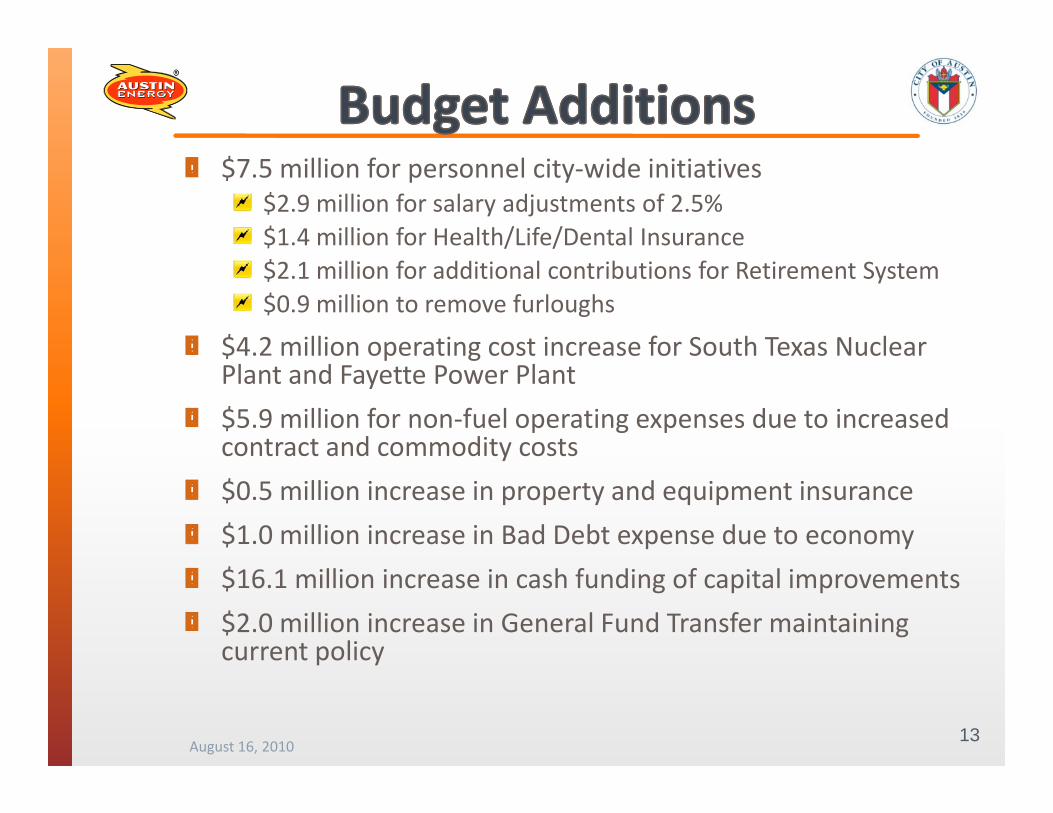
$7.5 million for personnel city‐wide initiatives$2.9 million for salary adjustments of 2.5%$1.4 million for Health/Life/Dental Insurance$2.1 million for additional contributions for Retirement System$0.9 million to remove furloughs
$4.2 million operating cost increase for South Texas Nuclear$4.2 million operating cost increase for South Texas Nuclear Plant and Fayette Power Plant
$5.9 million for non‐fuel operating expenses due to increased contract and commodity costsy
$0.5 million increase in property and equipment insurance
$1.0 million increase in Bad Debt expense due to economy
$16.1 million increase in cash funding of capital improvements
$2.0 million increase in General Fund Transfer maintaining current policy p y
13August 16, 2010
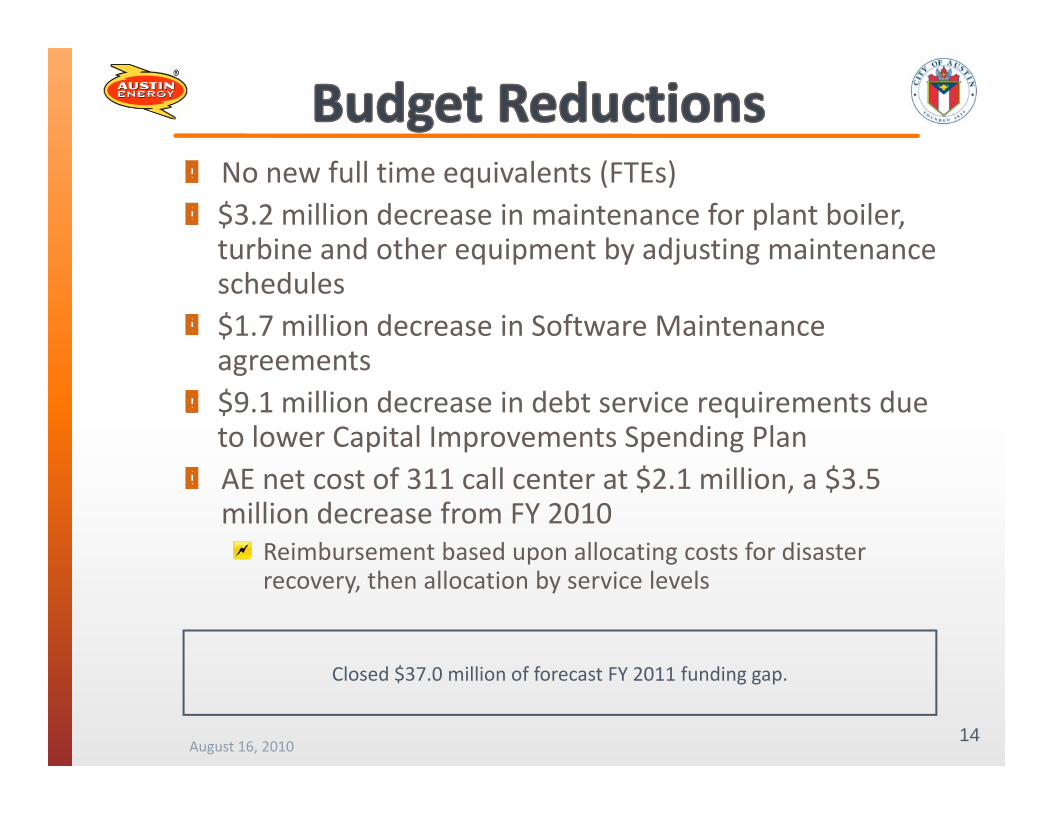
No new full time equivalents (FTEs)$3.2 million decrease in maintenance for plant boiler, turbine and other equipment by adjusting maintenanceturbine and other equipment by adjusting maintenance schedules$1.7 million decrease in Software Maintenance agreementsagreements$9.1 million decrease in debt service requirements due to lower Capital Improvements Spending Plan AE net cost of 311 call center at $2.1 million, a $3.5 million decrease from FY 2010
Reimbursement based upon allocating costs for disaster p grecovery, then allocation by service levels
14
Closed $37.0 million of forecast FY 2011 funding gap.
August 16, 2010

Rate and Business Model reviewNational Energy Regulatory Commission (NERC) reliability compliance program Reliability improvements
Mueller substationOngoing construction on electric service delivery system
C t I f ti d Billi t l tCustomer Information and Billing system replacementAdditional walk‐in customer service center NorthEnergy Efficiency programs funded at a historic high; solar program maintained at $4 0 millionprogram maintained at $4.0 million
$14.5 million for energy efficiency programs, an increase of $2.5 million (21%) over FY 2010 Budget
Economic Growth and Redevelopment Services Office pfunded at $9.9 million
August 16, 201015
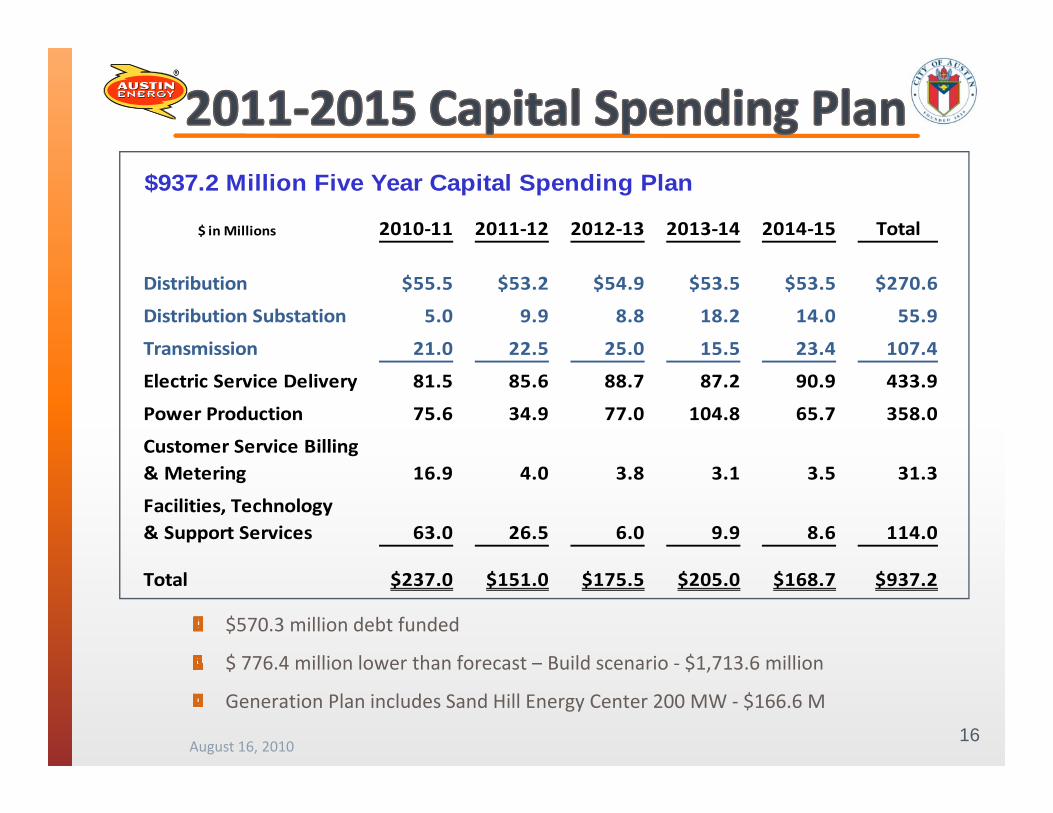
$937.2 Million Five Year Capital Spending Plan
$ in Millions 2010‐11 2011‐12 2012‐13 2013‐14 2014‐15 Total
Distribution $55.5 $53.2 $54.9 $53.5 $53.5 $270.6
Distribution Substation 5.0 9.9 8.8 18.2 14.0 55.9
Transmission 21.0 22.5 25.0 15.5 23.4 107.4
Electric Service Delivery 81.5 85.6 88.7 87.2 90.9 433.9
Power Production 75.6 34.9 77.0 104.8 65.7 358.0
Customer Service Billing& Metering 16.9 4.0 3.8 3.1 3.5 31.3
Facilities, Technology& Support Services 63.0 26.5 6.0 9.9 8.6 114.0
$570.3 million debt funded
$ 776 4 million lower than forecast – Build scenario $1 713 6 million
Total $237.0 $151.0 $175.5 $205.0 $168.7 $937.2
16
$ 776.4 million lower than forecast – Build scenario ‐ $1,713.6 million
Generation Plan includes Sand Hill Energy Center 200 MW ‐ $166.6 M
August 16, 2010
5 Year Plan - $937.2 Million
Distribution improvements $326.4MpTransmission improvements $107.5MOverall $32.9 million reduction in electric service deliverySand Hill Energy Center ‐ Total cost $166.6 M Build‐out C bi d C l G T bi 200 MW (FY 2013 2015)Combined Cycle Gas Turbine 200 MW (FY 2013‐2015)Fayette Power Project Scrubbers ‐ $32.5M in Plan ‐ Total cost $201.8M ‐ Complete by 2012Customer Information System replacement ‐ $12 6M in Plan ‐Customer Information System replacement $12.6M in Plan Total cost $36.4M – Complete mid‐year 2011 ‐Multi‐department projectRelocate System Control Center ‐ $63.1M in Plan ‐ Total cost $90 6M C l t 2012$90.6M ‐ Complete 2012Emerging Transportation Technologies (PHEV) – $361k in Plan ‐Total cost $27.2 millionMay need to accelerate some projects to FY 2011May need to accelerate some projects to FY 2011
17August 16, 2010

$101.0 $103.0
$120
Austin Energy's General Fund Transfer(in Millions of Dollars)
$58.0 $61.2$67.3 $69.6 $72.9 $76.7 $74.5 $77.4
$84.5$91.0 $95.0
$101.0
$60
$80
$100
$20
$40
$01999 2000 2001 2002 2003 2004 2005 2006 2007 2008 2009 2010
Amended2011
Proposed
Maintained at 9.1% since 1999, except 8.9% in 2002
Transfer % of Gross RevenueThree year average of two prior years & current year estimate
August 16, 201018

Texas Transmission Construction Program
National energy legislation’s impact on cost structure gy g p
Texas Nodal market begins December 2010
Uncertain fuel and energy prices with volatile historyUncertain fuel and energy prices, with volatile history
Capital intensive industry – construction costs
Changes in electric industry business model expected in long‐term
R t iRate review process
19August 16, 2010

National leader Energy Efficiency, Green Building and renewable energy
Quality management certification for electric service delivery, customer care and environmental protection
Partner in Pecan Street project
Customer Information and Billing System replacement
National Energy Regulatory Commission (NERC) reliability compliance programcompliance program
General Fund Transfer
Rates remain competitivep
Strong safety focus
Workforce development – partner with Austin Community College for Utility Lineman Certification
20August 16, 2010
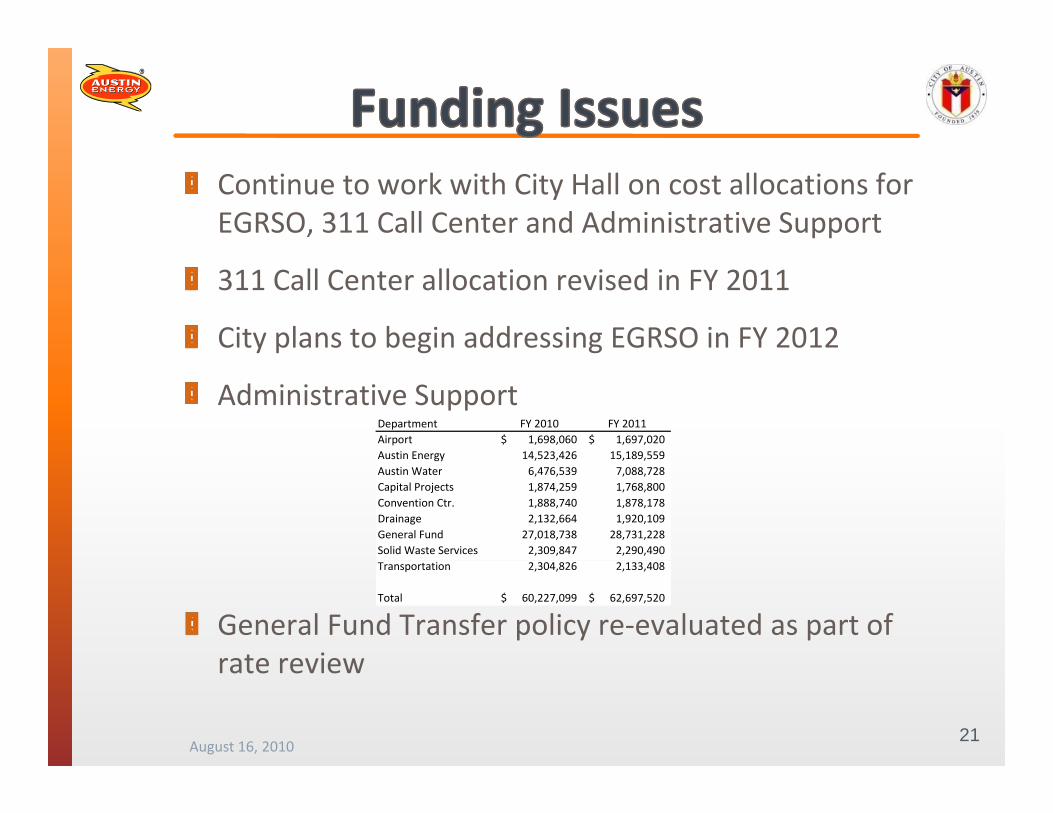
Continue to work with City Hall on cost allocations for EGRSO, 311 Call Center and Administrative Support
311 Call Center allocation revised in FY 2011
City plans to begin addressing EGRSO in FY 2012
Administrative Support Department FY 2010 FY 2011Airport 1,698,060$ 1,697,020$ Austin Energy 14,523,426 15,189,559Austin Energy 14,523,426 15,189,559 Austin Water 6,476,539 7,088,728 Capital Projects 1,874,259 1,768,800 Convention Ctr. 1,888,740 1,878,178 Drainage 2,132,664 1,920,109 General Fund 27,018,738 28,731,228 Solid Waste Services 2,309,847 2,290,490
General Fund Transfer policy re‐evaluated as part of rate review
Transportation 2,304,826 2,133,408
Total 60,227,099$ 62,697,520$
August 16, 201021
rate review

August 16, 2010 ‐ EUC Recommendation to City Council on AE’s Budget
August 25, 2010 – Council Budget Presentation
August 26, 2010 – Public Hearing on Transmission Rider and Fee Schedule
September 13, 14, and 15, 2010 – Council Budget Approval Readings
22August 16, 2010


