OUR MISSION 002 - ircenter.handelsblatt.com€¦ · 003. Financial Highlights 2017 (IFRS) 2017 2016...
238
Transcript of OUR MISSION 002 - ircenter.handelsblatt.com€¦ · 003. Financial Highlights 2017 (IFRS) 2017 2016...

OUR MISSIONTO BE THE BEST SPORTS COMPANY IN THE WORLD
OUR CORE BELIEF
ADID
AS
ANN
UAL
REPO
RT 2
017
002

TARGETS – RESULTS – OUTLOOK
TARGETS 2017 1, 2 RESULTS 2017 2 OUTLOOK 2018
Currency-neutral sales INCREASE AT A RATE BETWEEN 12% AND 14%
Currency-neutral sales INCREASE OF 16% Sales of € 21.218 BILLION
Currency-neutral sales INCREASE AT A RATE AROUND 10%
Gross margin INCREASE UP TO 0.3PP
Gross margin increase of 1.2pp to 50.4%
Gross margin INCREASE TO A LEVEL OF UP TO 50.7%
Other operating expenses (in % of net sales) BELOW PRIOR YEAR LEVEL
Other operating expenses (in % of net sales) decrease of 0.8pp to 41.9%
Other operating expenses (in % of net sales) BELOW PRIOR YEAR LEVEL
Operating margin INCREASE BETWEEN 0.2PP AND 0.4PP
Operating margin increase of 1.2pp to 9.8%
Operating margin INCREASE TO A LEVEL BETWEEN 10.3% AND 10.5%
Net income from continuing operations INCREASE AT A RATE BETWEEN 13% AND 15%
Net income from continuing operations 3 increase of 32% to € 1.430 BILLION
Net income from continuing operations 3 INCREASE AT A RATE BETWEEN 13% AND 17% to a level between € 1.615 billion and € 1.675 billion
Basic earnings per share from continuing operations INCREASE AT A RATE BETWEEN 13% AND 15%
Basic earnings per share from continuing operations 3 increase of 31% to € 7.05
Basic earnings per share from continuing operations 3 INCREASE AT A RATE BETWEEN 12% AND 16%
Average operating working capital (in % of net sales) MODEST INCREASE
Average operating working capital (in % of net sales) decrease of 0.7pp to 20.4%
Average operating working capital (in % of net sales) AROUND PRIOR YEAR LEVEL
Capital expenditure 4 AROUND € 1.1 BILLION
Capital expenditure 4 € 752 MILLION
Capital expenditure 4 AROUND € 900 MILLION
Shareholder value FURTHER INCREASE
adidas AG share price INCREASE OF 11% Dividend per share INCREASE OF 30% TO € 2.60 5
Shareholder value FURTHER INCREASE
1 As published on March 8, 2017; the outlook was updated over the course of the year.2 Figures reflect continuing operations as a result of the divestiture of the Rockport, TaylorMade, Adams Golf, Ashworth and CCM Hockey businesses.3 2017 excluding negative one-time tax impact of € 76 million.4 Excluding acquisitions and finance leases.5 Subject to Annual General Meeting approval.
1 TO OUR SHAREHOLDERS 2 GROUP MANAGEMENT REPORT – OUR COMPANY
3 GROUP MANAGEMENT REPORT – FINANCIAL REVIEW
4 CONSOLIDATED FINANCIAL STATEMENTS
5 ADDITIONAL INFORMATIONAD
IDAS
AN
NUA
L RE
PORT
201
7
003

Financial Highlights 2017 (IFRS)
2017 2016 Change
Operating Highlights (€ in millions)Net sales 1 21,218 18,483 15%Gross profit 1 10,703 9,100 18%Other operating expenses 1 8,882 7,885 13%EBITDA 1 2,511 1,953 29%Operating profit 1 2,070 1,582 31%Net income from continuing operations 1, 3 1,430 1,082 32%Net income attributable to shareholders 2, 3 1,173 1,017 15%
Key RatiosGross margin 1 50.4% 49.2% 1.2ppOther operating expenses in % of net sales 1 41.9% 42.7% (0.8pp)Operating margin 1 9.8% 8.6% 1.2ppEffective tax rate 1, 3 29.3% 29.6% (0.3pp)Net income attributable to shareholders in % of net sales 2, 3 5.5% 5.5% 0.0ppAverage operating working capital in % of net sales 1 20.4% 21.1% (0.7pp)Equity ratio 44.4% 42.6% 1.8ppNet borrowings/EBITDA 1 (0.2) 0.1 n.a.Financial leverage (7.5%) 1.6% (9.1pp)Return on equity 2 17.0% 15.7% 1.3pp
Balance Sheet and Cash Flow Data (€ in millions)Total assets 14,522 15,176 (4%)Inventories 3,692 3,763 (2%)Receivables and other current assets 3,277 3,607 (9%)Operating working capital 4,033 3,468 16%Net cash/(net borrowings) 484 (103) n.a.Shareholders’ equity 6,450 6,472 (0%)Capital expenditure 1 752 642 17%Net cash generated from operating activities 2 1,648 1,348 22%
Per Share of Common Stock (€)Basic earnings 1, 3 7.05 5.39 31%Diluted earnings 1, 3 7.00 5.29 32%Net cash generated from operating activities 2 8.14 6.73 21%Dividend 2.60 4 2.00 30%Share price at year-end 167.15 150.15 11%
Other (at year-end)Number of employees 1 56,888 58,902 (3%)Number of shares outstanding 203,861,234 201,489,310 1%Average number of shares 202,391,673 200,188,276 1%
1 Figures reflect continuing operations as a result of the divestiture of the Rockport, TaylorMade, Adams Golf, Ashworth and CCM Hockey businesses. 2 Includes continuing and discontinued operations.3 2017 excluding negative one-time tax impact of € 76 million.4 Subject to Annual General Meeting approval.
FINANCIAL HIGHLIGHTS 2017 (IFRS)
1 TO OUR SHAREHOLDERS 2 GROUP MANAGEMENT REPORT – OUR COMPANY
3 GROUP MANAGEMENT REPORT – FINANCIAL REVIEW
4 CONSOLIDATED FINANCIAL STATEMENTS
5 ADDITIONAL INFORMATIONAD
IDAS
AN
NUA
L RE
PORT
201
7
004

ABOUT THIS REPORTWith the Annual Report 2017, adidas communicates financial and non-financial information in a combined publication. The report provides a comprehensive overview of the financial, environmental and social performance of adidas in the 2017 financial year.
For the first time, we publish our Annual Report exclusively in a digital format. It is available as a full-content PDF and as a condensed Online Summary.
ADIDAS ANNUAL REPORT 2017 PDF
ADIDAS ANNUAL REPORT 2017, ONLINE SUMMARY↗ REPORT.ADIDAS-GROUP.COM
To enhance readability, registered trademarks as well as references to rounding differences are omitted in this publication. The adidas Annual Report 2017 is available in English and German.
THE FOLLOWING SYMBOLS INDICATE IMPORTANT INFORMATION:↗ There is more information online.
There is more information in a related table or diagram. There is more information within the report. These are parts of the non-financial statement that are
covered by a separate limited assurance engagement. SEE NON-FINANCIAL STATEMENT, P. 100
DATA AND FINANCIAL REPORTING STANDARDSThe reporting period is the financial year from January 1 to December 31, 2017. To ensure this report is as current as possible, it includes all relevant information available up to the Responsibility Statement dated February 23, 2018.
The consolidated financial statements and the Group Manage ment Report are prepared in accordance with the principles of the International Financial Reporting Standards (IFRS), as adopted by the European Union (EU), and additional requirements pursuant to the German Commercial Code (Handelsgesetzbuch – HGB).
Internal Control over Financial Reporting (ICoFR) provides reasonable assurance regarding the reliability of financial reporting and compliance with applicable laws and regu-lations. To monitor the effectiveness of ICoFR, accounting-related processes are regularly reviewed.
INDEPENDENT ASSURANCEThe consolidated financial statements prepared by adidas AG, including the statement of financial position, income statement, statement of comprehensive income, statement of changes in equity, statement of cash flows, and the notes as well as the Group Management Report have been audited by KPMG AG Wirtschaftsprüfungsgesellschaft. SEE INDEPENDENT AUDITOR’S
REPORT, P. 221
In addition, this report contains a combined non-financial statement for adidas AG and the Group. The content of the non-financial statement is covered by a separate limited assurance engagement of KPMG AG Wirtschaftsprüfungs-gesellschaft. SEE NON-FINANCIAL STATEMENT, P. 100 The assurance was conducted using the International Standard on Assurance Engagements ISAE 3000 (Revised). SEE INDEPENDENT AUDITOR’S
ASSURANCE REPORT, P. 226 The content of the non-financial statement combined with further information in this report and on our corporate website fulfills the Global Reporting Initiative’s (GRI) G4 ‘Core’ option. The GRI content index can be found online. ↗ ADIDAS-GROUP.COM/SUSTAINABILITY
It was not part of KPMG’s engagement to review the condensed online version of this report or references to external sources such as our corporate website.
FORWARD-LOOKING STATEMENTSOur Group Management Report contains forward-looking statements that reflect Management’s current view with respect to the future development of our company. The outlook is based on estimates that we have made on the basis of all the information available to us at the time of completion of this Annual Report. In addition, such forward-looking statements are subject to uncertainties which are beyond the control of the company. SEE RISK AND OPPORTUNITY REPORT, P. 131 In case the underlying assumptions turn out to be incorrect or described risks or opportunities materialize, actual results and developments may materially deviate (negatively or positively) from those expressed by such statements. adidas does not assume any obligation to update any forward-looking statements made in the Group Management Report beyond statutory disclosure obligations. SEE SUBSEQUENT EVENTS AND
OUTLOOK, P. 128
1 TO OUR SHAREHOLDERS 2 GROUP MANAGEMENT REPORT – OUR COMPANY
3 GROUP MANAGEMENT REPORT – FINANCIAL REVIEW
4 CONSOLIDATED FINANCIAL STATEMENTS
5 ADDITIONAL INFORMATIONAD
IDAS
AN
NUA
L RE
PORT
201
7
005

TO OUR SHAREHOLDERS
GROUP MANAGEMENT REPORT OUR COMPANY
GROUP MANAGEMENT REPORT FINANCIAL REVIEW
CONSOLIDATED FINANCIAL STATEMENTS
ADDITIONAL INFORMATION
Corporate Strategy 062adidas Brand Strategy 067Reebok Brand Strategy 070Sales and Distribution Strategy 072
Global Operations 074
Innovation 078
People and Culture 081
Sustainability 088
Non-Financial Statement 100
Ten-Year Overview 229
Glossary 232
Declaration of Support 236
Financial Calendar 237
Operational and Sporting Highlights 008
Letter from the CEO 016
Executive Board 020
Supervisory Board 024
Supervisory Board Report 027
Corporate Governance Report including the Declaration on Corporate Governance 033
Compensation Report 039
Our Share 057
ADIDAS ANNUAL REPORT 2017
Consolidated Statement of Financial Position 150
Consolidated Income Statement 152
Consolidated Statement of Comprehensive Income 153
Consolidated Statement of Changes in Equity 154
Consolidated Statement of Cash Flows 155
Notes 157Notes to the Consolidated Statement of Financial Position 169Notes to the Consolidated Income Statement 201Additional Information 205
Statement of Movements of Intangible and Tangible Assets 213
Shareholdings 215
Responsibility Statement 220
Independent Auditor’s Report 221
Independent Auditor’s Assurance Report 226
Internal Management System 102
Business Performance 105Economic and Sector Development 105Income Statement 107Statement of Financial Position and Statement of Cash Flows 111Treasury 115Financial Statements and Management Report of adidas AG 118Disclosures pursuant to § 315a Section 1 and § 289a Section 1 of the German Commercial Code 120
Business Performance by Segment 124Western Europe 124North America 124Greater China 125Russia/CIS 125Latin America 126Japan 126MEAA 126
Subsequent Events and Outlook 128Subsequent Events 128Outlook 128
Risk and Opportunity Report 131Illustration of Material Risks 136Illustration of Opportunities 144
Management Assessment of Performance, Risks and Opportunities, and Outlook 146
Group Management Report: This report contains the Group Management Report of the adidas Group, comprising adidas AG and its consolidated subsidiaries, and the Management Report of adidas AG.
006AD
IDAS
AN
NUA
L RE
PORT
201
7

ADID
AS
ANN
UAL
REPO
RT 2
017
ADID
AS
ANN
UAL
REPO
RT 2
017
007
T O O U RS H A R E H O L D E R S
Operational and Sporting Highlights 008
Letter from the CEO 016
Executive Board 020
Supervisory Board 024
Supervisory Board Report 027
Corporate Governance Report including the Declaration on Corporate Governance 033
Compensation Report 039
Our Share 057

OPERATIONAL AND SPORTING HIGHLIGHTS Q1 2017
‘ORIGINAL IS NEVER FINISHED’The new campaign and film launched by adidas Originals showcase visionaries from the worlds of music, skate, sport, style and art. Reaffirming the notion ‘Original is never finished’, the film features a remix of Frank Sinatra’s ‘My Way’ with a provocative, reimagined approach to today’s streetwear culture. With a multi-generational cast including Snoop Dogg and Dev Hynes, among others, adidas Originals re-interprets its own classics and turns to a new generation of creators to inspire them to redefine the meaning of originality. ↗ ADIDAS ORIGINALS ON YOUTUBE
REEBOK PRESENTS NEXT PHASE OF ‘BE MORE HUMAN’ CAMPAIGNA new rousing suite of films champions the hard work and physicality that lead people to more enriched lives, and cele-brates the value of human connection. The series examines the physical blemishes upon which life’s stories are written – from calloused, scarred hands to a worn-out pair of running shoes. It is the latest evolution of Reebok’s ‘Be More Human’ rally cry, which encourages people to be the best possible version of themselves physically, mentally and socially. ↗ REEBOK ON YOUTUBE
008AD
IDAS
AN
NUA
L RE
PORT
201
71 TO OUR SHAREHOLDERS 2 GROUP MANAGEMENT REPORT –
OUR COMPANY3 GROUP MANAGEMENT REPORT –
FINANCIAL REVIEW4 CONSOLIDATED FINANCIAL
STATEMENTS5 ADDITIONAL INFORMATION
OPERATIONAL AND SPORTING HIGHLIGHTS
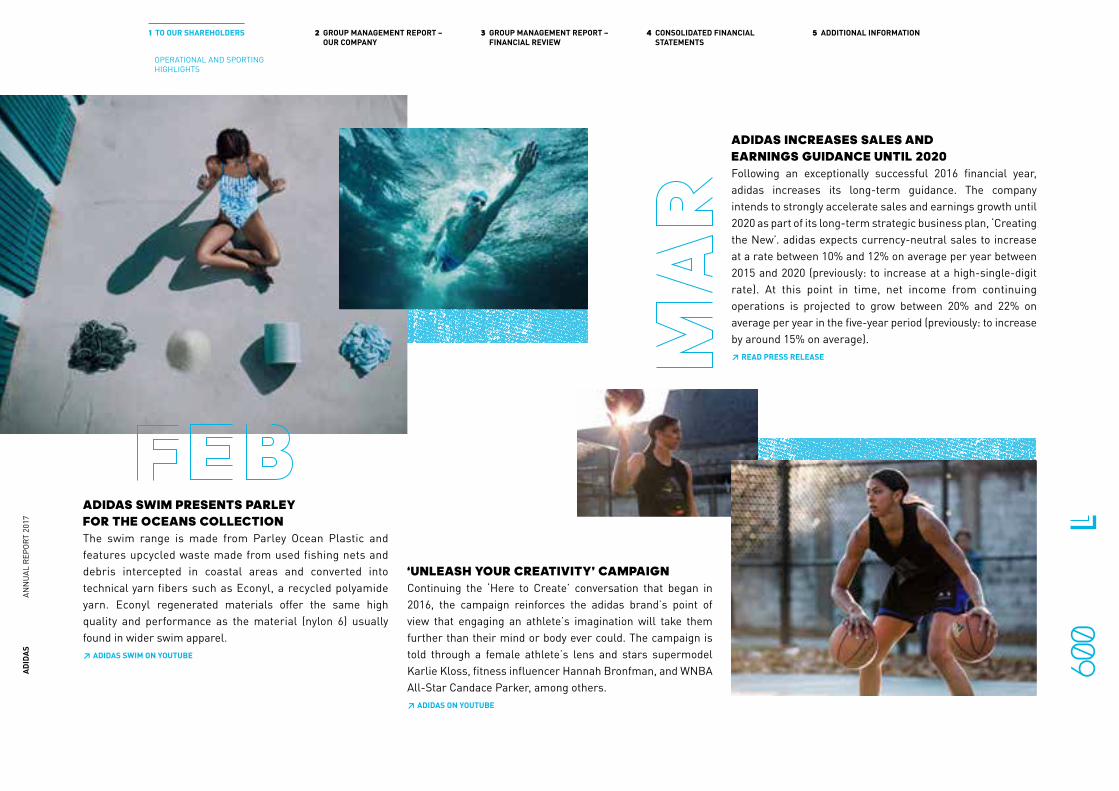
‘UNLEASH YOUR CREATIVITY’ CAMPAIGNContinuing the ‘Here to Create’ conversation that began in 2016, the campaign reinforces the adidas brand΄s point of view that engaging an athlete΄s imagination will take them further than their mind or body ever could. The campaign is told through a female athlete΄s lens and stars supermodel Karlie Kloss, fitness influencer Hannah Bronfman, and WNBA All-Star Candace Parker, among others.↗ ADIDAS ON YOUTUBE
ADIDAS SWIM PRESENTS PARLEY FOR THE OCEANS COLLECTIONThe swim range is made from Parley Ocean Plastic and features upcycled waste made from used fishing nets and debris intercepted in coastal areas and converted into technical yarn fibers such as Econyl, a recycled polyamide yarn. Econyl regenerated materials offer the same high quality and performance as the material (nylon 6) usually found in wider swim apparel.↗ ADIDAS SWIM ON YOUTUBE
ADIDAS INCREASES SALES AND EARNINGS GUIDANCE UNTIL 2020Following an exceptionally successful 2016 financial year, adidas increases its long-term guidance. The company intends to strongly accelerate sales and earnings growth until 2020 as part of its long-term strategic business plan, ‘Creating the New’. adidas expects currency-neutral sales to increase at a rate between 10% and 12% on average per year between 2015 and 2020 (previously: to increase at a high-single-digit rate). At this point in time, net income from continuing operations is projected to grow between 20% and 22% on average per year in the five-year period (previously: to increase by around 15% on average).↗ READ PRESS RELEASE
009AD
IDAS
AN
NUA
L RE
PORT
201
71 TO OUR SHAREHOLDERS 2 GROUP MANAGEMENT REPORT –
OUR COMPANY3 GROUP MANAGEMENT REPORT –
FINANCIAL REVIEW4 CONSOLIDATED FINANCIAL
STATEMENTS5 ADDITIONAL INFORMATION
OPERATIONAL AND SPORTING HIGHLIGHTS

PARLEY EDITIONS OF GAME-CHANGING RUNNING FOOTWEARadidas reveals the UltraBOOST, UltraBOOST X and Ultra-BOOST Uncaged Parley editions. The footwear features a blue colorway inspired by the shades of the ocean. Reusing an average of eleven plastic bottles per pair, the shoes’ laces, heel webbing, heel lining and sock liner covers are made from recycled PET material.↗ ADIDAS RUNNING ON YOUTUBE#PARLEY, #ULTRABOOST
FUTURECRAFT 4D — INDUSTRY’S FIRST APPLICATION OF DIGITAL LIGHT SYNTHESIS Futurecraft 4D is the world’s first high-performance footwear featuring midsoles crafted with light and oxygen using Digital Light Synthesis, a technology led by Silicon Valley-based tech company Carbon. The midsole pioneers a digital footwear component creation process that eliminates the necessity of traditional prototyping or molding. With Digital Light Synthesis, adidas operates on a completely different manu-facturing scale and sport performance quality, departing from 3D printing and bringing additive manufacturing in the sports industry into a new dimension. Ultimately, adidas aims to create more than 100,000 pairs of this high-performance footwear by the end of 2018.↗ ADIDAS.COM/FUTURECRAFT↗ ADIDAS ON YOUTUBE#FUTURECRAFT
ADIDAS AND SIEMENS SET TO COLLABORATE IN THE DIGITAL PRODUCTION OF SPORTING GOODSadidas and Siemens announce their intention to collaborate in the digital production of sporting goods. As part of a joint research and development program, the partners will be working to drive forward the digitalization of the adidas Speedfactory to ultimately develop capabilities for fast, transparent and individualized production. As a leader in digital factory automation and simulation solutions, Siemens brings invaluable expertise to the table. A digital Speedfactory ‘twin’ will allow the entire production process to be simulated, tested and optimized up-front. Merging the virtual and real worlds will help shorten the time to market, bring greater flexibility and provide improved manufacturing quality and efficiency.
REEBOK ANNOUNCES ‘COTTON + CORN’ SUSTAINABLE PRODUCTS INITIATIVEThe initiative is intended to bring plant-based footwear to the market in 2018. The first shoe ‘made from things that grow’ will have an upper comprised of organic cotton and a base originating from industrial grown corn, which is a non-food source. For the Cotton + Corn initiative, Reebok partnered with DuPont Tate & Lyle Bio Products, a leading manufacturer of high-performance bio-based solutions.
Q2 2017
010AD
IDAS
AN
NUA
L RE
PORT
201
71 TO OUR SHAREHOLDERS 2 GROUP MANAGEMENT REPORT –
OUR COMPANY3 GROUP MANAGEMENT REPORT –
FINANCIAL REVIEW4 CONSOLIDATED FINANCIAL
STATEMENTS5 ADDITIONAL INFORMATION
OPERATIONAL AND SPORTING HIGHLIGHTS

ADIDAS FOOTBALL LAUNCHES NEMEZIZNemeziz is the latest cleat designed to provide unprecedented agility for the game’s most fluid players. For the development of this shoe, adidas tapped into a common ritual in ancient battle, in dance and in sport: the use of taping for increased physical and mental strength. Nemeziz provides security, support and adaptability to suit players whose agility helps them dominate. ↗ ADIDAS FOOTBALL ON YOUTUBE
PERSONNEL CHANGES ON THE EXECUTIVE BOARD OF ADIDAS AG Effective May 11, Harm Ohlmeyer is appointed to succeed Robin J. Stalker as CFO and Labor Director of adidas AG. Karen Parkin is elevated to the Executive Board, responsible for Global Human Resources, effective May 12. Additionally, Gil Steyaert is appointed to the Executive Board as ordinary member effective May 12, and succeeds Glenn Bennett as Board Member responsible for Global Operations on August 5, 2017.↗ READ PRESS RELEASES↗ ADIDAS-GROUP.COM/EXECUTIVE-BOARD
ADIDAS AND JAMES HARDEN UNVEIL HARDEN LSHarden LS is a lifestyle evolution of the Harden Vol. 1 and continuation of the Harden signature line. The model utilizes multi-color Primeknit uppers, full-length BOOST, refreshed signature detailing and an uncaged toe box. It is available in four distinct colorways with the timing of each colorway release date being shared by James Harden exclusively on his social media channels.
011AD
IDAS
AN
NUA
L RE
PORT
201
71 TO OUR SHAREHOLDERS 2 GROUP MANAGEMENT REPORT –
OUR COMPANY3 GROUP MANAGEMENT REPORT –
FINANCIAL REVIEW4 CONSOLIDATED FINANCIAL
STATEMENTS5 ADDITIONAL INFORMATION
OPERATIONAL AND SPORTING HIGHLIGHTS

FIRST-EVER ULTRABOOST LACELESSWith innovation and creativity at the heart of adidas’ DNA, the launch of its first-ever laceless performance running silhouette marks a landmark occasion for the adidas brand. The shoe continues to challenge convention and once again sets new boundaries. ↗ ADIDAS RUNNING ON YOUTUBE
ADIDAS AND MAJOR LEAGUE SOCCER EXTEND PARTNERSHIP TO 2024 The extension of the existing apparel partnership represents the largest investment in American soccer to drive adidas’ North American business. The deal makes adidas the official supplier partner for the League. Earlier in 2017, adidas and Major League Soccer had already launched the newly designed Nativo, the Official Match Ball for the 2017 MLS season.↗ READ PRESS RELEASE
Q3 2017
Z.N.E. PULSE COLLECTIONadidas Athletics unveils its latest Z.N.E. collection, the first apparel range of its kind to be inspired by the rising heartbeat of athletes before a game. adidas worked closely with athletes during the development process, including collecting and analyzing data to help shape the Athletics Pulse range. This focused on the ‘pulse moment’ when athletes leave the locker room and head towards the field of play, a moment when the athletes’ heart rate peaks in anticipation. At the heart of the collection is the adidas Z.N.E. Pulse Knit Hoodie, crafted in breathable merino wool.
012AD
IDAS
AN
NUA
L RE
PORT
201
71 TO OUR SHAREHOLDERS 2 GROUP MANAGEMENT REPORT –
OUR COMPANY3 GROUP MANAGEMENT REPORT –
FINANCIAL REVIEW4 CONSOLIDATED FINANCIAL
STATEMENTS5 ADDITIONAL INFORMATION
OPERATIONAL AND SPORTING HIGHLIGHTS

‘DON'T BE QUIET PLEASE’ CAMPAIGNadidas, Pharrell Williams, Stan Smith and adidas sponsored tennis athletes Garbiñe Muguruza, Angelique Kerber, Sascha Zverev, Dominic Thiem and Jo-Wilfried Tsonga gather at Frederick Johnson Community Court in Harlem, New York, to host a tennis clinic with local youth organizations to kick off the launch of ‘Don’t Be Quiet Please’, a New York City-wide campaign inspiring individuals to make game-changing pledges.↗ ADIDAS ORIGINALS ON YOUTUBE#ADIDASPHARRELLWILLIAMS
ADIDAS COMPLETES DIVESTITURE OF CCM HOCKEY adidas announces that as of September 1 it has formally completed the previously announced divestiture of its CCM hockey business to a newly formed affiliate of Birch Hill Equity Partners.↗ READ PRESS RELEASE
ADIDAS LISTED IN DOW JONES SUSTAINABILITY INDICES For the 18th year in a row, adidas is included in the Dow Jones Sustainability Indices (DJSI), which evaluate the sustainability performance of the largest 2,500 companies listed in the Dow Jones Global Total Stock Market Index. In the ‘Textiles, Apparel & Luxury Goods Industry’, adidas is rated industry best in nine criteria: Brand Management, Customer Relation-ship Manage ment, Impact Measurement and Valuation, Materiality, Risk and Crisis Management, Supply Chain Management, Environ mental Policy and Management Systems, Corporate Citizenship and Philanthropy, and Human Rights.↗ READ PRESS RELEASE
013AD
IDAS
AN
NUA
L RE
PORT
201
71 TO OUR SHAREHOLDERS 2 GROUP MANAGEMENT REPORT –
OUR COMPANY3 GROUP MANAGEMENT REPORT –
FINANCIAL REVIEW4 CONSOLIDATED FINANCIAL
STATEMENTS5 ADDITIONAL INFORMATION
OPERATIONAL AND SPORTING HIGHLIGHTS

Q4 2017
ADIDAS COMPLETES DIVESTITURE OF TAYLORMADE, ADAMS GOLF AND ASHWORTH adidas announces that effective October 2 it has formally completed the previously announced divestiture of its TaylorMade, Adams Golf and Ashworth golf brands to a newly formed affiliate of KPS Capital Partners, LP. ↗ READ PRESS RELEASE
REEBOK OPENS GLOBAL FLAGSHIP STORE AT NEW BOSTON HEADQUARTERS Located at 25 Drydock Avenue within the Innovation and Design Building in Boston, the store is a truly unique retail experience. A key feature is the ‘YourReebok’ customization shop, allowing consumers to create custom and personalized products on site. The new location is the only Reebok store in the world where customers can have a customized version of the brand’s Classic Leather shoe, made by hand, on site. In addition, consumers can design personalized graphic apparel and accessories, produced on site in just minutes, and are able to test footwear prior to purchase in the store, in the surrounding neighborhood or at Reebok’s fitness facility.
LAUNCH OF AM4 PROJECT adidas announces the first major project to be created at its Speedfactory facility in Ansbach, Germany. The launch of the AM4 series heralds a significant moment for the brand in terms of the future of manufacturing, with Speedfactory being a facility that will allow adidas to explore, test and co-create with consumers, as well as constantly invent and reinvent design and define the future of how the brand creates. The launch also marks the start of a key city journey for adidas Speedfactory, with the adidas Made For London (AM4LDN) and the adidas Made for Paris (AM4PAR) being the first in a series of individually designed and manufactured running shoes that adidas will release in the six key cities.↗ ADIDAS ON YOUTUBE↗ READ PRESS RELEASE↗ ADIDAS.COM/SPEEDFACTORY#SPEEDFACTORY, #HERETOCREATE
014AD
IDAS
AN
NUA
L RE
PORT
201
71 TO OUR SHAREHOLDERS 2 GROUP MANAGEMENT REPORT –
OUR COMPANY3 GROUP MANAGEMENT REPORT –
FINANCIAL REVIEW4 CONSOLIDATED FINANCIAL
STATEMENTS5 ADDITIONAL INFORMATION
OPERATIONAL AND SPORTING HIGHLIGHTS
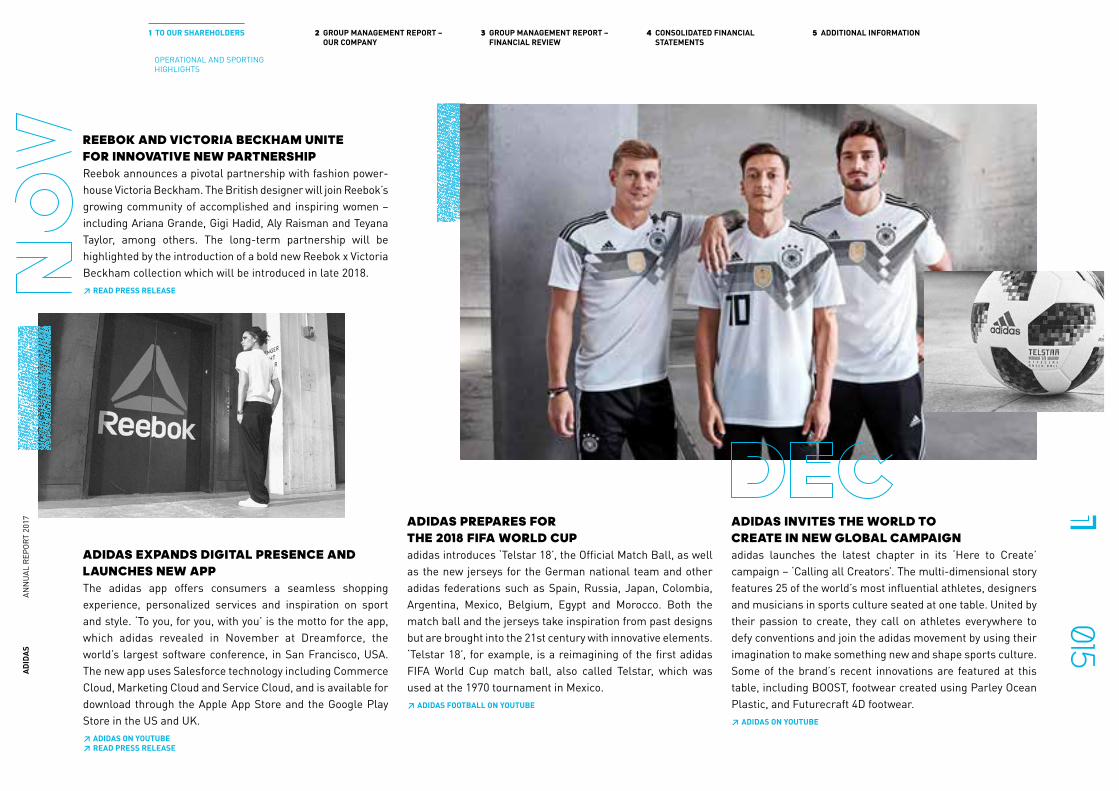
REEBOK AND VICTORIA BECKHAM UNITE FOR INNOVATIVE NEW PARTNERSHIPReebok announces a pivotal partnership with fashion power-house Victoria Beckham. The British designer will join Reebok’s growing community of accomplished and inspiring women – including Ariana Grande, Gigi Hadid, Aly Raisman and Teyana Taylor, among others. The long-term partnership will be highlighted by the introduction of a bold new Reebok x Victoria Beckham collection which will be introduced in late 2018.↗ READ PRESS RELEASE
ADIDAS EXPANDS DIGITAL PRESENCE AND LAUNCHES NEW APP The adidas app offers consumers a seamless shopping experience, personalized services and inspiration on sport and style. ‘To you, for you, with you’ is the motto for the app, which adidas revealed in November at Dreamforce, the world’s largest software conference, in San Francisco, USA. The new app uses Salesforce technology including Commerce Cloud, Marketing Cloud and Service Cloud, and is available for download through the Apple App Store and the Google Play Store in the US and UK.↗ ADIDAS ON YOUTUBE↗ READ PRESS RELEASE
ADIDAS PREPARES FOR THE 2018 FIFA WORLD CUP adidas introduces ‘Telstar 18’, the Official Match Ball, as well as the new jerseys for the German national team and other adidas federations such as Spain, Russia, Japan, Colombia, Argentina, Mexico, Belgium, Egypt and Morocco. Both the match ball and the jerseys take inspiration from past designs but are brought into the 21st century with innovative elements. ‘Telstar 18’, for example, is a reimagining of the first adidas FIFA World Cup match ball, also called Telstar, which was used at the 1970 tournament in Mexico.↗ ADIDAS FOOTBALL ON YOUTUBE
ADIDAS INVITES THE WORLD TO CREATE IN NEW GLOBAL CAMPAIGNadidas launches the latest chapter in its ‘Here to Create’ campaign – ‘Calling all Creators’. The multi-dimensional story features 25 of the world’s most influential athletes, designers and musicians in sports culture seated at one table. United by their passion to create, they call on athletes everywhere to defy conventions and join the adidas movement by using their imagination to make something new and shape sports culture. Some of the brand’s recent innovations are featured at this table, including BOOST, footwear created using Parley Ocean Plastic, and Futurecraft 4D footwear.↗ ADIDAS ON YOUTUBE
015AD
IDAS
AN
NUA
L RE
PORT
201
71 TO OUR SHAREHOLDERS 2 GROUP MANAGEMENT REPORT –
OUR COMPANY3 GROUP MANAGEMENT REPORT –
FINANCIAL REVIEW4 CONSOLIDATED FINANCIAL
STATEMENTS5 ADDITIONAL INFORMATION
OPERATIONAL AND SPORTING HIGHLIGHTS

L E T T E R F R O M T H E C E O K A S P E R R O R S T E D
» AT H L E T E S
W I L L N O T S E T T L E
F O R AV E R A G E .
A N D N E I T H E R
D O W E . «
LETTER FROM THE CEO
SEE VIDEO MESSAGE FROM OUR CEO ↗ REPORT.ADIDAS-GROUP.COM/#SHAREHOLDERS
016AD
IDAS
AN
NUA
L RE
PORT
201
71 TO OUR SHAREHOLDERS 2 GROUP MANAGEMENT REPORT –
OUR COMPANY3 GROUP MANAGEMENT REPORT –
FINANCIAL REVIEW4 CONSOLIDATED FINANCIAL
STATEMENTS5 ADDITIONAL INFORMATION
LETTER FROM THE CEO
ADID
AS
ANN
UAL
REPO
RT 2
017
DEAR SHAREHOLDERS,At adidas, we believe that, through sport, we have the power to change lives. This core belief guides the way we run our company, how we work with our partners, how we create our products, and how we engage with our consumers.
Athletes will not settle for average. And neither do we. Every day, we come to work to create and sell the best sports and fitness products in the world, and to offer the best service and consumer experience – and to do it all in a sustainable way.
WHAT MAKES A WINNING TEAMPhysical power is not enough – athletes need mental strength in their game. We foster an athlete’s mindset through three people behaviors that are at the core of our culture: Confidence, Collaboration, and Creativity.
Confidence allows athletes to make quick decisions on the field, to reach higher. Confidence enables us to be an industry leader and to redefine what today’s sports company looks like.
Every elite athlete relies on partners: coaches, team mates, and nutritionists. We, too, get stronger together through industry-leading collaborations. Internally, we are a team that plays to win and trusts in each other’s abilities and talents.
No great athlete succeeds by copying their predecessors’ training plans and strategies. It takes creativity to gain an edge and stand out. Our mission is to be the best sports company in the world by staying authentic to all athletes, tailoring to their unique needs, tastes, and experiences.
LEADERSHIP IN ACTIONConfidence, Collaboration, and Creativity are the foundations of the leadership framework we launched globally last year – it defines what great leadership at adidas looks like. In 2017, we saw three new leaders joining the Executive Board: Harm Ohlmeyer taking over as Chief Financial Officer, Karen Parkin being elevated to Board Member responsible for Human Resources, and Gil Steyaert becoming Board Member responsible for Global Operations. All three were internal promotions, a nod to our people potential.
To continue to excel in leadership development, we established a Core Leadership Group and an Extended Leadership Group consisting of leaders from our most important markets and
functions. Their job is to make sure we implement our strategy with excellence in every category and market, and to promote the development of future leaders, with a focus on female talent.
To align the interests of our senior leaders with those of the adidas AG shareholders, we also linked long-term remuneration of senior executives to the development of our share price.
PROGRESS ON OUR GAME PLAN: ‘CREATING THE NEW’An athlete’s mindset drives us to raise the standards for the entire industry. We have until 2020 to implement Creating the New, which is the right strategy to succeed in the highly attractive industry we are in. We are making great strides and clearly delivering against our financial ambition. But we are far from the finish line.
Speed, Cities, and Open SourceIn 2017, we picked up the pace in becoming the first true fast sports company in the world, based on our strategic choice Speed. The net sales share of speed-enabled products increased to 28% in 2017. We also made further progress to achieve a 20% higher share of full-price sales with this part of our business. In addition to embedding Speed in our existing supply chain and production processes, we explore new, disruptive business models and technologies. In our Speedfactories in Ansbach, Germany, and Atlanta, USA, smart manufacturing brings production closer to our consumer. Last year saw the first major product created at the Speedfactory: the AM4 series, an individually crafted shoe made exclusively for our global key cities.
To make our mark on a global scale, we need to win the consumer in major metropolitan centers. We over-invest to grow share of mind, share of market, and share of trend in six global mega Cities: London, Los Angeles, New York, Paris, Shanghai, and Tokyo. In 2017, we improved brand desire in most of these cities by delivering extraordinary experiences to our consumers. As a result, our key cities made an above-average contribution to the overall growth of our company and helped us win market share.
The direction of sport – and our company – is set by all creators. As defined in our strategic choice Open Source, we invite athletes, consumers, and partners to collaborate with our brands. By inspiring innovation in the industry and beyond, creative partnerships help us shape the future of sport – and the sports culture.
Our creative collaborations with Alexander Wang, Kanye West, and Stella McCartney to name a few, continued to drive brand desire and growth. By partnering up with the world’s best athletes and teams, we build communities of advocates. This also takes place on a local level;
017AD
IDAS
AN
NUA
L RE
PORT
201
71 TO OUR SHAREHOLDERS 2 GROUP MANAGEMENT REPORT –
OUR COMPANY3 GROUP MANAGEMENT REPORT –
FINANCIAL REVIEW4 CONSOLIDATED FINANCIAL
STATEMENTS5 ADDITIONAL INFORMATION
LETTER FROM THE CEO

the ‘adidas Runners’ community, for instance, currently has over 50,000 active runners in Western Europe alone.
Our appetite for collaboration allows us to share our sports knowledge by working with the best in other fields. Our partnership with Parley for the Oceans is a prime example: In 2017, we released multiple franchise silhouettes, such as the UltraBOOST, NMD and EQT, made of Parley Ocean Plastic. We also joined forces with Carbon, a pioneer in 3D printing, to launch a new product and platform: Futurecraft 4D. Driven by athlete data, a production process called ‘Digital Light Synthesis’ enables us to print previously impossible designs without labor-intensive and complex assembly.
Portfolio, adidas North America, Digital, and ONE adidas On top of focusing on Speed, Cities, and Open Source, along with our unique culture, we accelerated Creating the New with four priorities: Portfolio, adidas North America, Digital, and ONE adidas. We moved ahead with actively managing our brand portfolio and completed the divestiture of the TaylorMade, Adams Golf and Ashworth golf brands, as well as the CCM hockey business. In the meanwhile, the ‘Muscle-Up’ turnaround at Reebok is in full motion.
In North America, the largest sporting goods market in the world, we grew our adidas brand business by over 30% and kept building capabilities and infrastructure. Our global e-commerce business was up more than 50%. Digital, however, means much more to us; gearing up for the future, we are driving digital transformation across the entire organization. Finally, we are pulling levers to improve our operational efficiency and to become a more agile and truly global company.
SustainabilityIt is our obligation to operate responsibly. We have integrated sustainability in most aspects of our business, from product creation and supplier management to store concept development and facilities. Through our actions, we challenge and inspire everyone to contribute to a more sustainable future.
In 2017, we created more than one million pairs of shoes made with Parley Ocean Plastic, while 93% of all cotton we sourced globally was Better Cotton. Following our decision to go plastic-free at our offices, the changes we have implemented will avoid more than 40 tons of single-use plastic items per year.
Externally, our efforts continue to receive recognition, with adidas being listed in the Dow Jones Sustainability Indices for the 18th consecutive year, and being awarded the third re-accreditation of our social supply chain program by the Fair Labor Association. What’s more, this Annual Report marks the beginning of paper-free reporting – another testament to walking the talk in our daily business.
AN ATHLETE’S MINDSET TURNS TO PERFORMANCECompetition is in our DNA. We are constantly reassessing our processes, thinking of ways to get faster, stronger, and more attractive for the consumer. In this spirit, we continued to break records in the way we operate and the value we bring to our stakeholders.
2017 financial resultsIn 2017, we achieved record sales of € 21.2 billion, reflecting currency-neutral growth of 16%. The adidas brand continued to grab share of mind and market around the globe, growing at double-digit rates in all regions except Russia/CIS.
Despite currency headwinds, our gross margin climbed 120 basis points to 50.4%. We increased our investments into our brands while strictly managing costs. As a result, we fed the gross margin improvement through to the operating margin, which expanded to a level of 9.8%. Our net income from continuing operations, excluding the negative one-time impact of the US tax reform, grew more than twice as fast as our top line, up 32% to € 1.430 billion.
2018 outlookWe will continue our momentum in 2018, with a bias for quality growth. We are targeting a currency-neutral sales increase of around 10% against difficult comparisons, given two consecutive years of strong double-digit growth.
By increasingly leveraging our scalable operating model, net income is expected to once again grow significantly faster than revenues, to a level of more than € 1.6 billion. This will not only keep us on track toward our 2020 financial ambition, but also allows us to raise the bar once more: We are now targeting even higher net income growth, between 22% and 24% on average per year, for our current strategic cycle from 2015 until 2020.
018AD
IDAS
AN
NUA
L RE
PORT
201
71 TO OUR SHAREHOLDERS 2 GROUP MANAGEMENT REPORT –
OUR COMPANY3 GROUP MANAGEMENT REPORT –
FINANCIAL REVIEW4 CONSOLIDATED FINANCIAL
STATEMENTS5 ADDITIONAL INFORMATION
LETTER FROM THE CEO

IN CLOSINGOur mission is to be the best sports company in the world, but we are only as good as what our consumers, athletes, teams, partners, shareholders, and the media say about us. When all our stakeholders call us the best, market share, leadership, and profitability will follow.
This logic is reflected in our 2017 performance and 2018 outlook. Our strategy Creating the New paired with an athlete’s mindset enables us to deliver sustainable value for our stakeholders, our employees, and for society at large – now and in the future.
We will consistently put Creating the New into practice. Our strategy might span only until 2020 but, like any athlete, we keep aiming for better. We play to win.
Thank you for your ongoing support.
Sincerely yours,
K A S P E R R O R S T E DC E O
019AD
IDAS
AN
NUA
L RE
PORT
201
71 TO OUR SHAREHOLDERS 2 GROUP MANAGEMENT REPORT –
OUR COMPANY3 GROUP MANAGEMENT REPORT –
FINANCIAL REVIEW4 CONSOLIDATED FINANCIAL
STATEMENTS5 ADDITIONAL INFORMATION
LETTER FROM THE CEO

R O L A N D A U S C H E LG L O B A L S A L E S
K A S P E R R O R S T E DC H I E F E X E C U T I V E O F F I C E R
K A R E N P A R K I NG L O B A L H U M A N R E S O U R C E S
E R I C L I E D T K EG L O B A L B R A N D S
H A R M O H L M E Y E RC H I E F F I N A N C I A L O F F I C E R
G I L S T E Y A E R TG L O B A L O P E R A T I O N S
E X E C U T I V E B O A R D
020AD
IDAS
AN
NUA
L RE
PORT
201
71 TO OUR SHAREHOLDERS 2 GROUP MANAGEMENT REPORT –
OUR COMPANY3 GROUP MANAGEMENT REPORT –
FINANCIAL REVIEW4 CONSOLIDATED FINANCIAL
STATEMENTS5 ADDITIONAL INFORMATION
EXECUTIVE BOARD
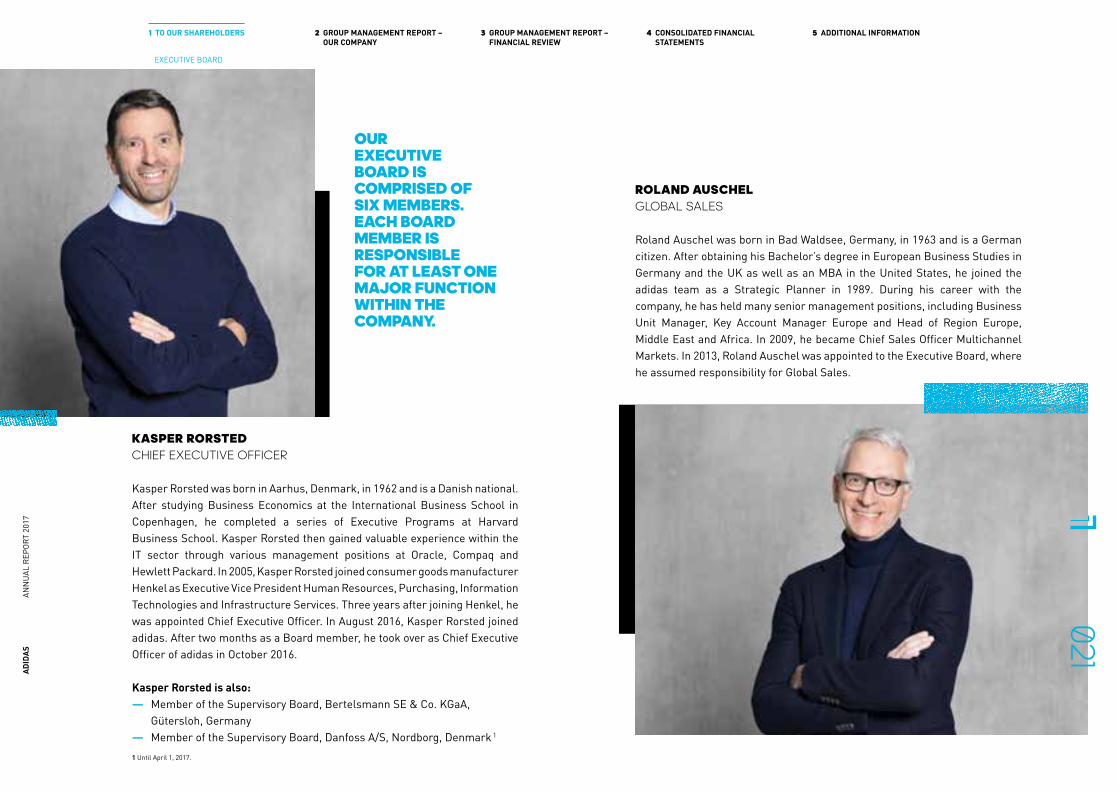
KASPER RORSTED CHIEF EXECUTIVE OFFICER
Kasper Rorsted was born in Aarhus, Denmark, in 1962 and is a Danish national. After studying Business Economics at the International Business School in Copenhagen, he completed a series of Executive Programs at Harvard Business School. Kasper Rorsted then gained valuable experience within the IT sector through various management positions at Oracle, Compaq and Hewlett Packard. In 2005, Kasper Rorsted joined consumer goods manufacturer Henkel as Executive Vice President Human Resources, Purchasing, Information Techno logies and Infra structure Services. Three years after joining Henkel, he was appointed Chief Executive Officer. In August 2016, Kasper Rorsted joined adidas. After two months as a Board member, he took over as Chief Executive Officer of adidas in October 2016.
Kasper Rorsted is also: — Member of the Supervisory Board, Bertelsmann SE & Co. KGaA,
Gütersloh, Germany — Member of the Supervisory Board, Danfoss A/S, Nordborg, Denmark 1
1 Until April 1, 2017.
ROLAND AUSCHEL GLOBAL SALES
Roland Auschel was born in Bad Waldsee, Germany, in 1963 and is a German citizen. After obtaining his Bachelor’s degree in European Business Studies in Germany and the UK as well as an MBA in the United States, he joined the adidas team as a Strategic Planner in 1989. During his career with the company, he has held many senior management positions, including Business Unit Manager, Key Account Manager Europe and Head of Region Europe, Middle East and Africa. In 2009, he became Chief Sales Officer Multichannel Markets. In 2013, Roland Auschel was appointed to the Executive Board, where he assumed responsibility for Global Sales.
OUR EXECUTIVE BOARD IS COMPRISED OF SIX MEMBERS. EACH BOARD MEMBER IS RESPONSIBLE FOR AT LEAST ONE MAJOR FUNCTION WITHIN THE COMPANY.
021AD
IDAS
AN
NUA
L RE
PORT
201
71 TO OUR SHAREHOLDERS 2 GROUP MANAGEMENT REPORT –
OUR COMPANY3 GROUP MANAGEMENT REPORT –
FINANCIAL REVIEW4 CONSOLIDATED FINANCIAL
STATEMENTS5 ADDITIONAL INFORMATION
EXECUTIVE BOARD

ERIC LIEDTKE GLOBAL BRANDS
Eric Liedtke, a US citizen, holds a Bachelor of Arts degree in Journalism from the University of Wisconsin-Madison. He joined adidas in 1994 as Global Line Manager for Cross Training in Portland/Oregon. During his 20-year career with adidas, he has held senior management positions of increasing responsibility at adidas America, including Director of Footwear Marketing and Vice President Brand Marketing. In 2006, Eric Liedtke moved to the corporate headquarters in Herzogenaurach, Germany, to become Senior Vice President Global Brand Marketing. From 2011, he held the position of Senior Vice President adidas Sport Performance, responsible for all adidas brand sports categories globally. Eric Liedtke has been Executive Board member since March 2014, responsible for Global Brands (the adidas and Reebok brands). In addition to his Executive Board position, he is a passionate member of the Steering Committee of Parley for the Oceans.
Eric Liedtke is also: — Member of the Board of Directors, Carbon, Inc., Redwood City, USA 2
2 Since December 19, 2017.
HARM OHLMEYER CHIEF FINANCIAL OFFICER 3
Harm Ohlmeyer was born in 1968 in Hoya, Germany, and is a German national. He holds a degree in Economics from Regensburg University, Germany, as well as an MBA from Murray State University, USA. Harm Ohlmeyer started his career with adidas in 1998 and gained extensive experience in the areas of Finance and Sales, including responsibility as Senior Vice President Finance TaylorMade-adidas Golf in Carlsbad, USA, Senior Vice President Finance adidas Brand and Senior Vice President Finance for Global Sales (adidas and Reebok). From 2011, he led the company’s e-commerce business, most recently as Senior Vice President Digital Brand Commerce. From 2014 to 2016, he held additional responsibility as Senior Vice President Sales Strategy and Excellence. Harm Ohlmeyer was appointed to the Executive Board effective March 7, 2017 and became Chief Financial Officer and Labor Director effective May 11, 2017.
3 Since May 11, 2017.
022AD
IDAS
AN
NUA
L RE
PORT
201
71 TO OUR SHAREHOLDERS 2 GROUP MANAGEMENT REPORT –
OUR COMPANY3 GROUP MANAGEMENT REPORT –
FINANCIAL REVIEW4 CONSOLIDATED FINANCIAL
STATEMENTS5 ADDITIONAL INFORMATION
EXECUTIVE BOARD

GIL STEYAERT GLOBAL OPERATIONS 5
Gil Steyaert was born in Belgium in 1962 and is a French national. He holds a degree in Business from ISC Paris Business School. Gil Steyaert started at adidas in 1999 as Joint Managing Director for France and has since worked in various local and regional roles with increasing responsibility. From 2003 to 2013, he was Managing Director North (UK, Ireland, Benelux and Scandinavia). Subsequently, he led Western Europe as Managing Director. Gil Steyaert was appointed to the Executive Board effective May 12, 2017 and took over responsibility for Global Operations on August 5, 2017.
5 Since August 5, 2017.
KAREN PARKIN GLOBAL HUMAN RESOURCES 4
Karen Parkin was born in 1965, is a British national and also holds a US passport. She obtained a Bachelor’s degree in Education from Sheffield Hallam University, UK, and completed the Business Management Leadership Program at Lancaster University Management School. Karen Parkin joined adidas in 1997 as Sales Director adidas UK, where she subsequently was Business Development Director from 2003 to 2005. In 2005, she moved to adidas America as Vice President Business Development, subsequently taking on responsibility for the supply chain function at adidas America in 2007 as Vice President Logistics and Supply Chain North America. In 2013 and 2014, Karen Parkin acted as Senior Vice President Global Supply Chain, based at the company’s headquarters in Herzogenaurach and at the adidas America headquarters in Portland, Oregon. Since 2014, she has held the position of Chief HR Officer. Karen Parkin was appointed to the Executive Board, responsible for Global Human Resources, effective May 12, 2017.
4 Since May 12, 2017.
GLENN BENNETT GLOBAL OPERATIONS 7
7 Until August 4, 2017.
ROBIN J. STALKER CHIEF FINANCIAL OFFICER 6
6 Until May 11, 2017.
FOR MORE INFORMATION ON THE ADIDAS AG EXECUTIVE BOARD↗ ADIDAS-GROUP.COM/
EXECUTIVE-BOARD
023AD
IDAS
AN
NUA
L RE
PORT
201
71 TO OUR SHAREHOLDERS 2 GROUP MANAGEMENT REPORT –
OUR COMPANY3 GROUP MANAGEMENT REPORT –
FINANCIAL REVIEW4 CONSOLIDATED FINANCIAL
STATEMENTS5 ADDITIONAL INFORMATION
EXECUTIVE BOARD
SUPERVISORY BOARD
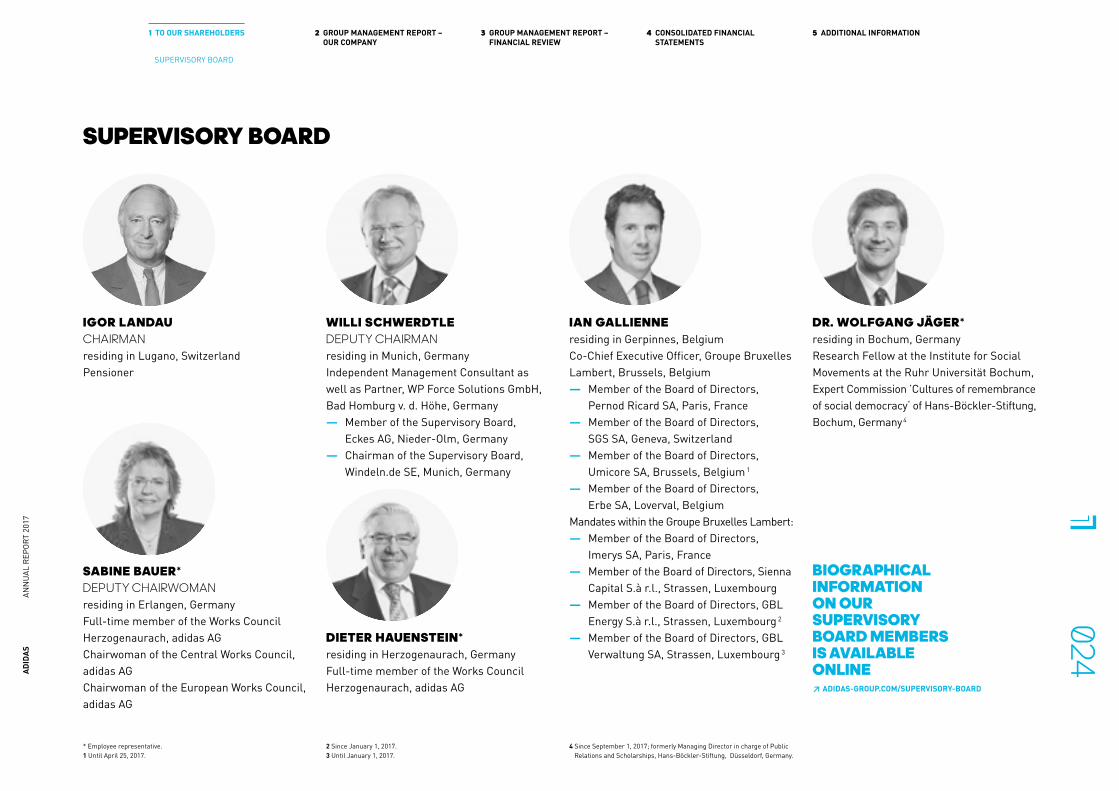
IGOR LANDAUCHAIRMANresiding in Lugano, SwitzerlandPensioner
WILLI SCHWERDTLEDEPUTY CHAIRMANresiding in Munich, GermanyIndependent Management Consultant as well as Partner, WP Force Solutions GmbH, Bad Homburg v. d. Höhe, Germany
— Member of the Supervisory Board, Eckes AG, Nieder-Olm, Germany
— Chairman of the Supervisory Board, Windeln.de SE, Munich, Germany
DIETER HAUENSTEIN*residing in Herzogenaurach, GermanyFull-time member of the Works Council Herzogenaurach, adidas AG
IAN GALLIENNEresiding in Gerpinnes, BelgiumCo-Chief Executive Officer, Groupe Bruxelles Lambert, Brussels, Belgium
— Member of the Board of Directors, Pernod Ricard SA, Paris, France
— Member of the Board of Directors, SGS SA, Geneva, Switzerland
— Member of the Board of Directors, Umicore SA, Brussels, Belgium 1
— Member of the Board of Directors, Erbe SA, Loverval, Belgium
Mandates within the Groupe Bruxelles Lambert: — Member of the Board of Directors,
Imerys SA, Paris, France — Member of the Board of Directors, Sienna
Capital S.à r.l., Strassen, Luxembourg — Member of the Board of Directors, GBL
Energy S.à r.l., Strassen, Luxembourg 2 — Member of the Board of Directors, GBL
Verwaltung SA, Strassen, Luxembourg 3
SABINE BAUER*DEPUTY CHAIRWOMANresiding in Erlangen, GermanyFull-time member of the Works Council Herzogenaurach, adidas AGChairwoman of the Central Works Council, adidas AG Chairwoman of the European Works Council, adidas AG
* Employee representative.1 Until April 25, 2017.
2 Since January 1, 2017.3 Until January 1, 2017.
4 Since September 1, 2017; formerly Managing Director in charge of Public Relations and Scholarships, Hans-Böckler-Stiftung, Düsseldorf, Germany.
BIOGRAPHICAL INFORMATION ON OUR SUPERVISORY BOARD MEMBERS IS AVAILABLE ONLINE↗ ADIDAS-GROUP.COM/SUPERVISORY-BOARD
DR. WOLFGANG JÄGER*residing in Bochum, GermanyResearch Fellow at the Institute for Social Movements at the Ruhr Universität Bochum, Expert Commission ’Cultures of remembrance of social democracy‘ of Hans-Böckler-Stiftung, Bochum, Germany 4
024AD
IDAS
AN
NUA
L RE
PORT
201
71 TO OUR SHAREHOLDERS 2 GROUP MANAGEMENT REPORT –
OUR COMPANY3 GROUP MANAGEMENT REPORT –
FINANCIAL REVIEW4 CONSOLIDATED FINANCIAL
STATEMENTS5 ADDITIONAL INFORMATION
SUPERVISORY BOARD
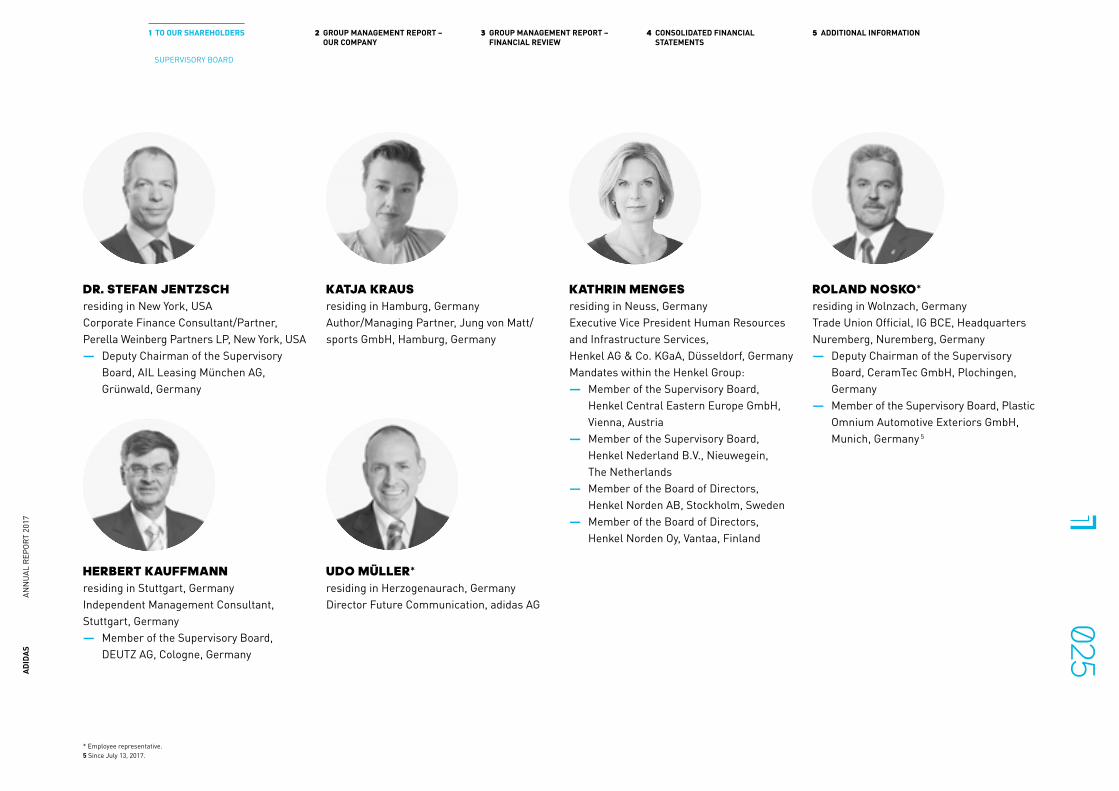
DR. STEFAN JENTZSCHresiding in New York, USACorporate Finance Consultant/Partner, Perella Weinberg Partners LP, New York, USA
— Deputy Chairman of the Supervisory Board, AIL Leasing München AG, Grünwald, Germany
KATHRIN MENGESresiding in Neuss, GermanyExecutive Vice President Human Resources and Infrastructure Services, Henkel AG & Co. KGaA, Düsseldorf, GermanyMandates within the Henkel Group:
— Member of the Supervisory Board, Henkel Central Eastern Europe GmbH, Vienna, Austria
— Member of the Supervisory Board, Henkel Nederland B.V., Nieuwegein, The Netherlands
— Member of the Board of Directors, Henkel Norden AB, Stockholm, Sweden
— Member of the Board of Directors, Henkel Norden Oy, Vantaa, Finland
ROLAND NOSKO*residing in Wolnzach, GermanyTrade Union Official, IG BCE, Headquarters Nuremberg, Nuremberg, Germany
— Deputy Chairman of the Supervisory Board, CeramTec GmbH, Plochingen, Germany
— Member of the Supervisory Board, Plastic Omnium Automotive Exteriors GmbH, Munich, Germany 5
KATJA KRAUSresiding in Hamburg, GermanyAuthor/Managing Partner, Jung von Matt/sports GmbH, Hamburg, Germany
HERBERT KAUFFMANNresiding in Stuttgart, GermanyIndependent Management Consultant, Stuttgart, Germany
— Member of the Supervisory Board, DEUTZ AG, Cologne, Germany
* Employee representative.5 Since July 13, 2017.
UDO MÜLLER*residing in Herzogenaurach, GermanyDirector Future Communication, adidas AG 025
ADID
AS
ANN
UAL
REPO
RT 2
017
1 TO OUR SHAREHOLDERS 2 GROUP MANAGEMENT REPORT – OUR COMPANY
3 GROUP MANAGEMENT REPORT – FINANCIAL REVIEW
4 CONSOLIDATED FINANCIAL STATEMENTS
5 ADDITIONAL INFORMATION
SUPERVISORY BOARD

NASSEF SAWIRISresiding in London, Great BritainChief Executive Officer & Member of the Board of Directors, OCI N.V., Amsterdam, The Netherlands
— Member of the Board of Directors, LafargeHolcim Ltd., Jona, Switzerland
Mandates within the OCI N.V. Group: — Member of the Board of Directors,
OCI Partners LP, Wilmington, Delaware, USA
STANDING COMMITTEESSteering Committee — Igor Landau (Chairman), Sabine Bauer*, Willi SchwerdtleGeneral Committee — Igor Landau (Chairman), Sabine Bauer*, Roland Nosko*, Willi SchwerdtleAudit Committee — Herbert Kauffmann (Chairman), Ian Gallienne 6, Dr. Wolfgang Jäger*, Hans Ruprecht*Finance and Investment Committee — Igor Landau (Chairman), Sabine Bauer*, Dr. Wolfgang Jäger*, Herbert KauffmannNomination Committee — Igor Landau (Chairman), Kathrin Menges, Willi SchwerdtleMediation Committee pursuant to § 27 section 3 Co-Determination Act (MitbestG) — Igor Landau, Sabine Bauer*, Willi Schwerdtle, Heidi Thaler-Veh*
* Employee representative.6 Committee member since March 7, 2017; previously Dr. Stefan Jentzsch until March 7, 2017.
HEIDI THALER-VEH*residing in Uffenheim, GermanyMember of the Central Works Council, adidas AG
KURT WITTMANN*residing in Markt Bibart, GermanyFull-time member of the Works Council Herzogenaurach, adidas AGFirst Deputy Chairman of the Works Council Herzogenaurach, adidas AG
HANS RUPRECHT*residing in Herzogenaurach, GermanyVice President Customer Service Central Europe West, adidas AG
026AD
IDAS
AN
NUA
L RE
PORT
201
71 TO OUR SHAREHOLDERS 2 GROUP MANAGEMENT REPORT –
OUR COMPANY3 GROUP MANAGEMENT REPORT –
FINANCIAL REVIEW4 CONSOLIDATED FINANCIAL
STATEMENTS5 ADDITIONAL INFORMATION
SUPERVISORY BOARD

S U P E R -V I S O R Y B O A R D R E P O R T I G O R L A N D A U C H A I R M A N O F T H E S U P E R V I S O R Y B O A R D
» T H E C O M P A N Y I S W E L L P O S I T I O N E D
T O C O N T I N U E T O G R O W P R O F I T A B L Y . «
027AD
IDAS
AN
NUA
L RE
PORT
201
71 TO OUR SHAREHOLDERS 2 GROUP MANAGEMENT REPORT –
OUR COMPANY3 GROUP MANAGEMENT REPORT –
FINANCIAL REVIEW4 CONSOLIDATED FINANCIAL
STATEMENTS5 ADDITIONAL INFORMATION
SUPER VISORY BOARD REPORT
DEAR SHAREHOLDERS,We look back on another exceptional year. Thanks to strong brands, unique partnerships and collaborations in the world of sport as well as a sharp focus on our consumers’ needs, the company was able to record another year of strong top- and bottom-line growth. Driven by innovative products and powerful marketing campaigns, the momentum experienced by our brands remained high throughout the year. This led to sales and earnings results that clearly surpassed targets set at the beginning of the year. These positive developments are the consequence of numerous measures which have been implemented to support the successful execution of our strategic business plan ‘Creating the New’. First introduced in 2015, Creating the New was updated with several complementary initiatives at the beginning of 2017 in order to grow the top and bottom line even faster than initially projected. Consequently, adidas updated its outlook for 2020 and presented an even more ambitious set of financial targets. In 2017 again, we generated double-digit sales growth rates in almost all regions, including in the focus markets North America and Greater China as well as the important e-commerce channel. Paired with an exceptional profitability improvement, this shows that the company’s success is both broad-based and well balanced. The divestiture of the TaylorMade, Adams Golf and Ashworth brands as well as the CCM Hockey business was completed during the course of 2017, which will allow the company to focus even more on the execution of its strategic business plan. Newly appointed members of the Executive Board have assumed their roles fast and smoothly, with Harm Ohlmeyer taking over as Chief Financial Officer, Karen Parkin being elevated to Executive Board Member responsible for Human Resources and Gil Steyaert becoming Executive Board Member responsible for Global Operations. All three appointments were internal ones, which speaks for the quality and depth of the organization’s pool of talent. Taking all this into consideration, the company is well positioned to continue to grow profitably in 2018 and beyond.
SUPERVISION AND ADVICE IN DIALOGUE WITH THE EXECUTIVE BOARDIn the year under review, we performed all of our tasks laid down by law, the Articles of Association, the German Corporate Governance Code (the ‘Code’) and the Rules of Procedure carefully and conscientiously, as in previous years. In 2017, we also followed intensively the work of the Executive Board. In this context, we regularly advised the Executive Board on the management of the company and diligently and continuously supervised its management activities. We assured ourselves of the legality, expediency and regularity of the management activities and found that there were no objections to be raised.
The Executive Board involved us directly and in a timely and comprehensible manner in all of the company’s fundamental decisions. After in-depth consultation and examination of the detailed information submitted to us by the Executive Board, we approved individual transactions where required by law.
The Executive Board informed us extensively and in a timely manner through written and oral reports. This information covered all relevant aspects of the company’s business strategy, business planning, including finance, investment and personnel planning, the course of business and the company’s financial position and profitability. We were also kept up to date on matters relating to the risk situation, risk management and compliance as well as all major decisions and business transactions.
The Executive Board always explained immediately and in a detailed manner any deviations in business performance from the established plans, and the Supervisory Board as a whole discussed these matters in depth.
The Executive Board regularly provided us with comprehensive written reports for the preparation of our meetings. We thus always had the opportunity to critically analyze the Executive Board’s reports and resolution proposals within the committees and within the Supervisory Board as a whole and to put forward suggestions before passing resolutions after in-depth examination and consultation. At the Supervisory Board meetings, the Executive Board was available to discuss and answer our questions. In the periods between our meetings, the Executive Board also provided us with extensive, timely monthly reports on the current business situation. We critically examined, specifically challenged and checked the plausibility of the information provided by the Executive Board.
In the year under review, we held seven regular meetings of the entire Supervisory Board, two of which took place outside Germany. The attendance rate of the members in the Supervisory Board meetings was around 95% in the year under review. The committee meetings, with the exception of one General Committee meeting and two Finance and Investment Committee meetings from which one member was excused in each case, were fully attended. The external auditor, KPMG AG Wirtschaftsprüfungsgesellschaft (‘KPMG’), attended all regular meetings of the Supervisory Board – the exception being the two meetings which took place outside Germany – insofar as no Executive Board matters were dealt with. KPMG also attended all meetings of the Audit Committee.
028AD
IDAS
AN
NUA
L RE
PORT
201
71 TO OUR SHAREHOLDERS 2 GROUP MANAGEMENT REPORT –
OUR COMPANY3 GROUP MANAGEMENT REPORT –
FINANCIAL REVIEW4 CONSOLIDATED FINANCIAL
STATEMENTS5 ADDITIONAL INFORMATION
SUPER VISORY BOARD REPORT

In the periods between meetings, the Supervisory Board Chairman and the Audit Committee Chairman maintained regular contact with the Chief Executive Officer and the Chief Financial Officer, conferring on matters such as corporate strategy, business planning and development, the risk situation and risk management as well as compliance. In addition, the Executive Board immediately informed the Supervisory Board Chairman about any significant events of fundamental importance for the management and for evaluating the situation and development of the company, where necessary also at short notice.
TOPICS FOR THE ENTIRE SUPERVISORY BOARDOur consultations and examinations focused on the following topics:
SITUATION AND BUSINESS DEVELOPMENTThe development of sales and earnings, the employment situation as well as the financial position of the company and the business development of the company’s individual business areas and markets were presented to us in detail by the Executive Board at every Supervisory Board meeting and were discussed regularly. Further topics which were always discussed were the possible impact of global economic developments as well as the development of our individual brands and markets.
At our February and March meeting, we dealt with the ‘Acceleration Plan’ and with the updated financial targets for 2020. Various initiatives for the key pillars ‘Portfolio, adidas North America, ONE adidas, Digital’ were launched in the context of the Acceleration Plan. Those initiatives aim at supporting the momentum experienced by our brands and accelerating sales and net income growth compared to the original five-year plan.
In August, we examined the topic of retail profitability. Furthermore, we dealt with the CSR Directive Implementation Act and the non-financial reporting legally required for the first time therein. In this connection, we assigned the Audit Committee the task of preparing the audit of the non-financial reporting by the Supervisory Board. We commissioned an external examination of the content pursuant to § 111 section 2 sentence 4 German Stock Corporation Act (Aktiengesetz – AktG). One topic of the October meeting was a detailed and sound analysis of the strategic business plan. In addition, the business in the Asia/Pacific region was discussed. At the December meeting, as stipulated in the Rules of Procedure of the Supervisory Board, one agenda item was the report by the Executive Board on the marketing and sponsorship agreements concluded in the respective calendar year.
TRANSACTIONS REQUIRING SUPERVISORY BOARD APPROVALIn accordance with statutory regulations and the Rules of Procedure of the Supervisory Board, certain transactions and measures require a formal resolution or the prior approval of the Supervisory Board.
The topic of our February and March meetings was, after thorough discussion, the approval of the 2017 Budget and Investment Plan presented by the Executive Board. In March, we resolved upon the resolutions to be proposed to the 2017 Annual General Meeting, including the proposal regarding the appropriation of retained earnings for the 2016 financial year as well as the proposal to change the Supervisory Board compensation.
At our February meeting, we additionally dealt with the planned divestiture of TaylorMade, Adams Golf, Ashworth and CCM Hockey and the integration of the FiveTen brand into adidas Outdoor. The competent Finance and Investment Committee ultimately approved the sale of TaylorMade and CCM Hockey.
COMPOSITION OF THE EXECUTIVE BOARDFollowing in-depth discussions about the resolution proposal prepared by the General Committee on the appointment of Harm Ohlmeyer as successor to the long-standing Chief Financial Officer Robin J. Stalker, we resolved at our March meeting to appoint Harm Ohlmeyer as Executive Board member with effect from March 7, 2017 and as Chief Financial Officer with effect from the end of the Annual General Meeting on May 11, 2017. We also resolved upon the conclusion of his Executive Board service contract. Prior to this, we had approved the mutually agreed termination of the Executive Board mandate of Robin J. Stalker with effect from the end of the Annual General Meeting on May 11, 2017. Furthermore, after in depth-consultation, we approved the conclusion of the corresponding termination agreement regarding the Executive Board service contract.
At the May meeting, we furthermore approved the mutually agreed termination of the long-standing Executive Board mandate of Glenn Bennett by the end of the third quarter of 2017 at the latest and approved the termination agreement to be concluded. In this context, we appointed Gil Steyaert, successor to Glenn Bennett, as Executive Board member with effect from May 12, 2017 and approved the conclusion of his Executive Board service contract.
029AD
IDAS
AN
NUA
L RE
PORT
201
71 TO OUR SHAREHOLDERS 2 GROUP MANAGEMENT REPORT –
OUR COMPANY3 GROUP MANAGEMENT REPORT –
FINANCIAL REVIEW4 CONSOLIDATED FINANCIAL
STATEMENTS5 ADDITIONAL INFORMATION
SUPER VISORY BOARD REPORT

Furthermore, Karen Parkin was appointed as member of the Executive Board for the newly created Executive Board function Human Resources. We resolved upon the appointment of Karen Parkin as member of the Executive Board with effect from May 12, 2017 and approved the conclusion of her Executive Board service contract.
In December, we resolved upon the termination of the appointment and the concurrent reappointment of Roland Auschel and Eric Liedtke with effect from January 1, 2018 and approved the conclusion of their new Executive Board service contracts. Thus, we were able to commit Roland Auschel and Eric Liedtke long-term to the company as both of them are key for the company and its successful development.
EXECUTIVE BOARD COMPENSATIONAll matters regarding Executive Board compensation were prepared comprehensively by the General Committee, as provided for in the Rules of Procedure of the Supervisory Board, explained to the Supervisory Board as a whole and submitted for resolution.
Each year at our February meeting of the entire Supervisory Board, the main subject is Executive Board compensation. At this meeting, following an in-depth review of the performance of the individual Executive Board members and their respective achievement of the targets set in the 2016 Performance Bonus Plan, we resolved upon the bonuses to be paid to the Executive Board members based on the 2016 Performance Bonus Plan. Furthermore, we also discussed in detail the criteria and key targets for the 2017 Performance Bonus Plan and the individual bonus target amounts and determined them for each Executive Board member.
In line with the Code, in the year under review we commissioned an external, independent compensation expert to review the structure of the Executive Board compensation and the individual compensation levels of the Executive Board members. The review found that the compensation meets the requirements of the German Stock Corporation Act and of the Code. However, current compensation levels could be oriented even more toward market standards. At our meetings in February and October, we considered in detail the results of the review of the compensation levels and structure. We agreed with the compensation expert’s assessment. On this basis and on the occasion of the reappointments of Roland Auschel and Eric Liedtke, we resolved in December to adjust their compensation in accordance with the results of the review by the independent compensation expert with effect from January 1, 2018.
COMPOSITION OF AND CHANGES ON THE SUPERVISORY BOARDThere were no personnel changes with regard to the full Supervisory Board in the reporting period. At the March meeting of the Audit Committee, the composition of the Audit Committee was addressed. Dr. Stefan Jentzsch stated that he would leave the Audit Committee for professional reasons. As his replacement, Ian Gallienne was elected as new member of the Audit Committee. At the May meeting of the Audit Committee, Herbert Kauffmann was reelected as Chairman of the Audit Committee.
With regard to the representation of women and men, the Supervisory Board complies with the statutory minimum quota pursuant to § 96 section 2 sentences 1, 3 and 4 AktG. Both the shareholder representatives and the employee representatives resolved in accordance with § 96 section 2 sentence 3 AktG that the minimum quota of 30% women and 30% men on the Supervisory Board shall be fulfilled separately for the shareholder representatives and the employee representatives.
The term of office of the Supervisory Board members, including the four members who were elected as new shareholder or employee representatives in the supplementary election, will expire as scheduled at the end of the Annual General Meeting in May 2019.
CORPORATE GOVERNANCEThe Supervisory Board regularly monitors the application and further development of the corporate governance regulations within the company, in particular the implementation of the recommendations of the Code. Therefore, in the year under review, we also dealt with the Code, in particular with the amendments resolved upon by the Government Commission on February 7, 2017.
The last Declaration of Compliance was issued by the Executive Board and Supervisory Board of adidas AG pursuant to § 161 AktG on February 13, 2017.
In February 2018, we discussed in depth the current 2018 Declaration of Compliance and then resolved upon it and made it permanently available to our shareholders on our corporate website. ↗ ADIDAS-GROUP.COM/S/CORPORATE-GOVERNANCE
At our May, August, October and December meetings, within the framework of our regular self-evaluation, we dealt with the planning and preparation of a new efficiency examination of the Supervisory Board and Audit Committee which began in late 2017 and will be concluded in 2018.
030AD
IDAS
AN
NUA
L RE
PORT
201
71 TO OUR SHAREHOLDERS 2 GROUP MANAGEMENT REPORT –
OUR COMPANY3 GROUP MANAGEMENT REPORT –
FINANCIAL REVIEW4 CONSOLIDATED FINANCIAL
STATEMENTS5 ADDITIONAL INFORMATION
SUPER VISORY BOARD REPORT

Pursuant to the new recommendation of the Code, we also developed a competency profile for the full Supervisory Board. Under consideration of the specific features which result from the activities of the organization as a globally present, public listed company, we ensured that the full Supervisory Board has the knowledge, skills and professional expertise required to properly perform its duties. Details can be found in the Corporate Governance Report including the Declaration on Corporate Governance (‘Corporate Governance Report’). SEE CORPORATE
GOVERNANCE REPORT INCLUDING THE DECLARATION ON CORPORATE GOVERNANCE, P. 33
In December, we discussed the independence of the members of the Supervisory Board and the respective independence criteria. A corresponding resolution was passed in February 2018. Based thereon, in the Supervisory Board’s assessment, currently all members are independent.
In the year under review, no conflicts of interest arose in regard to the Executive Board members. There were also no conflicts of interest within the Supervisory Board. It is pointed out that in December 2015, the Supervisory Board approved the conclusion of a three-year contract, effective January 1, 2016, with a company in which one Supervisory Board member is involved. The order volume is to be confirmed annually by the Supervisory Board. A resolution was passed by the Supervisory Board as regards the order volume for the 2018 financial year at the meeting in December 2017. In the view of the Supervisory Board, there was no conflict of interest. Nevertheless, as in the previous years, the Supervisory Board member concerned did not participate in the respective resolution.
Further information on corporate governance within the company can be found in the Corporate Governance Report. SEE CORPORATE GOVERNANCE REPORT INCLUDING THE DECLARATION ON
CORPORATE GOVERNANCE, P. 33
EFFICIENT COMMITTEE WORKIn order to perform our tasks in an efficient manner, we have established a total of six standing Supervisory Board committees.
The committees prepare resolutions and topics for the meetings of the entire Supervisory Board. Within the legally permissible framework and in appropriate cases, we have furthermore delegated the Supervisory Board‘s authority to pass certain resolutions to individual committees. With the exception of the Audit Committee, the Supervisory Board Chairman also chairs all the standing committees. The committee chairpersons inform the Supervisory Board about the content and results of the committee meetings at the subsequent meeting of the entire Supervisory Board.
— The Steering Committee did not meet in the year under review. — The General Committee held six meetings in the 2017 financial year. The main focus of
the meetings was the preparation of the resolutions of the Supervisory Board as a whole, detailed individually above, in particular the resolution on the changes on the Executive Board, the targets for the 2017 Performance Bonus, the target achievement of the 2016 Performance Bonus and the determination of the Executive Board compensation and review of its appropriateness. The drafting of the long-term compensation plan 2018/2020 (LTIP 2018/2020) was also an agenda item.
— The Audit Committee also held six meetings in the year under review. The Chief Financial Officer and the auditor were present at all meetings and reported to the committee members in detail.
In addition to the supervision of the accounting process, the committee’s work also focused on the comprehensive review of the first quarter report, the first half year report and the report on the first nine months together with the Chief Financial Officer and the auditor before the respective dates of publication, also the examination of the annual financial statements and the consolidated financial statements for 2016, including the combined Management Report of adidas AG and the Group, as well as the Executive Board’s proposal regarding the appropriation of retained earnings. Following an in-depth review of the audit reports with the auditor, the committee decided to recommend that the Supervisory Board approve the 2016 annual financial statements and consolidated financial statements. In addition, after obtaining the auditor‘s declaration of independence and after conclusion of a disclosure agreement, the Audit Committee prepared the Supervisory Board’s proposal to the Annual General Meeting concerning the selection of the auditor of the annual financial statements and the consolidated financial statements for the 2017 financial year and the auditor for the audit review of interim management reports (half year report and quarterly reports) for the 2017 financial year and, insofar as interim financial reports are to be prepared prior to the 2018 Annual General Meeting, for the 2018 financial year and recommended that the Supervisory Board propose KPMG to the Annual General Meeting in this respect. The Audit Committee declared to the Supervisory Board in this regard that the recommendation is free from undue influence by a third party and that no clause of the kind referred to in Article 16 section 6 of the EU Regulation No. 537/2014 of the European Parliament and of the Council of April 14, 2014 on specific requirements regarding the statutory audit of public-interest entities has been imposed upon it.
In the year under review, the CSR Directive Implementation Act was a regularly discussed topic at Audit Committee meetings. In particular, the Audit Committee dealt with the
031AD
IDAS
AN
NUA
L RE
PORT
201
71 TO OUR SHAREHOLDERS 2 GROUP MANAGEMENT REPORT –
OUR COMPANY3 GROUP MANAGEMENT REPORT –
FINANCIAL REVIEW4 CONSOLIDATED FINANCIAL
STATEMENTS5 ADDITIONAL INFORMATION
SUPER VISORY BOARD REPORT

preparation of the non-financial reporting which is to be audited by the Supervisory Board and which is legally required for the first time.
Furthermore, the Audit Committee dealt intensively with the monitoring of the effectiveness of the risk management system, the compliance management system, the internal control system and the internal audit system. Moreover, the committee addressed the findings of Internal Audit and the audit plan.
In addition, at every meeting of the Audit Committee, the Chief Compliance Officer gave regular reports.
— The Finance and Investment Committee held two meetings in the year under review, both of which were held by way of a conference call.
At the May meeting, the sale of TaylorMade was discussed and subsequently approved. At the June meeting, the committee approved the divestiture of CCM Hockey.
— The Nomination Committee held one meeting in the year under review to discuss the competency profile newly recommended by the Code.
— The Mediation Committee, established in accordance with the German Co-Determination Act (Mitbestimmungsgesetz — MitbestG), did not have to be convened in 2017.
EXAMINATION OF THE 2017 ANNUAL FINANCIAL STATEMENTS AND CONSOLIDATED FINANCIAL STATEMENTSKPMG audited the 2017 consolidated financial statements prepared by the Executive Board in accordance with § 315e German Commercial Code (Handelsgesetzbuch – HGB) in compliance with IFRS and issued an unqualified opinion thereon. The auditor also approved without qualification the 2017 annual financial statements of adidas AG, prepared in accordance with HGB requirements, and the combined Management Report of adidas AG and the Group. Furthermore, at the request of the Supervisory Board, KPMG audited the non-financial statement, which had to be prepared for the first time. The financial statements, the proposal put forward by the Executive Board regarding the appropriation of retained earnings and the auditor’s reports were distributed by the Executive Board to all Supervisory Board members in a timely manner. We examined the documents in depth, with a particular focus on legality and regularity, in the presence of the auditor at the Audit Committee meeting held on March 2, 2018 and at the Supervisory Board’s March 6, 2018 financial statements meeting, during which the
Executive Board explained the financial statements in detail. At both meetings, the auditor reported the material results of the audit, inter alia with regard to the priority topics agreed and the key audit matters and was available for questions and the provision of additional information. The auditor did not report any significant weaknesses with respect to the internal control and risk management system relating to the accounting process. We also discussed in depth with the Executive Board the proposal concerning the appropriation of retained earnings, which provides for a dividend of € 2.60 per dividend-entitled share and adopted this significant increase to € 2.60 compared with the previous year under consideration of the strong business development in the 2017 financial year, the company’s good financial situation and future prospects. Based on our own examinations of the annual and consolidated financial statements (including the non-financial statement), we came to the conclusion that there are no objections to be raised. At our financial statements meeting, therefore, following the recommendation of the Audit Committee, we approved the audit results and the financial statements including the non-financial statement prepared by the Executive Board. The annual financial statements of adidas AG were thus approved.
EXPRESSION OF THANKSOn behalf of the entire Supervisory Board, I wish to thank the members of the Executive Board and all adidas employees around the world for their great personal dedication and their ongoing commitment, and I also thank the employee representatives for their trusting collaboration.
I would particularly like to thank our departed long-standing Executive Board members Glenn Bennett and Robin J. Stalker who sustainably shaped the company. The success story of adidas is closely linked to Glenn Bennett’s responsibilities in the area of Global Operations. During Robin J. Stalker’s term of office as CFO, the company’s value increased from € 3 billion to more than € 30 billion. These are outstanding achievements, for which I would like to express my sincere appreciation to Glenn Bennett and Robin J. Stalker on behalf of the Supervisory Board and all adidas employees.
For the Supervisory Board
I G O R L A N DA U CHAIRMAN OF THE SUPERVISORY BOARD
March 2018
032AD
IDAS
AN
NUA
L RE
PORT
201
71 TO OUR SHAREHOLDERS 2 GROUP MANAGEMENT REPORT –
OUR COMPANY3 GROUP MANAGEMENT REPORT –
FINANCIAL REVIEW4 CONSOLIDATED FINANCIAL
STATEMENTS5 ADDITIONAL INFORMATION
SUPER VISORY BOARD REPORT

CORPORATE GOVERNANCE REPORT INCLUDING THE DECLARATION ON CORPORATE GOVERNANCE 1
Corporate Governance stands for responsible and trans-parent management and corporate control oriented toward a sustainable increase in value. We are convinced that good corporate governance is an essential foundation for sustainable corporate success and enhances the confidence placed in our company by our shareholders, business partners, employees and the financial markets. The following report includes the Corporate Governance Report and the Declaration on Corporate Governance issued by the Executive Board and Supervisory Board.
DECLARATION BY THE EXECUTIVE BOARD AND SUPERVISORY BOARD OF ADIDAS AG ON THE GERMAN CORPORATE GOVERNANCE CODE PURSUANT TO § 161 GERMAN STOCK CORPORATION ACT (AKTIENGESETZ – AKTG)The Executive Board and Supervisory Board of adidas AG issued their last Declaration of Compliance pursuant to § 161 AktG on February 13, 2017. For the period from the publication of the last Declaration of Compliance up to and including May 19, 2017, the following Declaration refers to the German Corporate Governance Code (hereinafter referred to as the ‘Code’) as amended on May 5, 2015. For the period as of May 20, 2017, the following Declaration refers to the
recommendations of the Code as amended on February 7, 2017, which was published in the Federal Gazette on April 24, 2017 and May 19, 2017 (corrected version).
The Executive Board and Supervisory Board of adidas AG declare that the recommendations of the ‘Government Commission on the German Corporate Governance Code’ have been and are met with the following deviations:
Definition of the target level of provision (section 4.2.3 subsection 3)For Executive Board members of adidas AG initially appointed on or after October 1, 2013 and for Executive Board members to be appointed in future, there are defined contribution pension plans which, due to their structure, do not aim to reach a defined target level of provision. In the view of the Supervisory Board, this structure leads to a higher degree of control and future planning capability with regard to the company’s expenses for pension plans.
Specification of a regular limit of length of membership for Supervisory Board members (section 5.4.1 subsection 2 sentence 2 in conjunction with sentence 1 new version)In accordance with section 5.4.1 subsection 2 sentence 2 in conjunction with sentence 1 of the Code, the Supervisory Board has specified concrete objectives for its composition. However, it has not specified a regular limit of length of membership for Supervisory Board members. The Supervisory Board is of the opinion that an extended length of membership of individual Supervisory Board members may, in the individual case, be in the interest of the company and of those entitled to elect members to the Supervisory Board, which would not be taken into consideration if there was a general limit.
Maximum number of non-group mandates held by members of the Supervisory Board (section 5.4.5 subsection 1 sentence 2)One member of the Supervisory Board, Ian Gallienne, holds more than three mandates in supervisory bodies of non-group companies with similar requirements. Ian Gallienne is Co-Chief Executive Officer of Groupe Bruxelles Lambert (GBL). GBL is a holding company and, in its capacity as an institutional investor represented by, inter alia, its Co-Chief Executive Officer, regularly holds mandates in supervisory bodies of its portfolio companies. All companies in which Ian Gallienne holds mandates in supervisory bodies are portfolio or group companies of GBL and these mandates thus have to be attributed to his main occupation as Co-Chief Executive Officer. Therefore, we are of the opinion that, as regards its intent and purpose, the recommendation of section 5.4.5 subsection 1 sentence 2 is not applicable to Ian Gallienne. However, as a precaution, we declare a deviation based on the good reasons set out above. Moreover, the Supervisory Board has assured itself that Ian Gallienne has sufficient time to perform his Supervisory Board mandate at adidas AG.
Herzogenaurach, February 2018
For the Executive Board For the Supervisory BoardKASPER RORSTED IGOR LANDAUChief Executive Officer Chairman of the Supervisory Board
The aforementioned Declaration of Compliance has been published on and can be downloaded from our website. ↗ ADIDAS-GROUP.COM/S/CORPORATE-GOVERNANCE
1 The Corporate Governance Report including the Declaration on Corporate Governance is an unaudited section of the combined Management Report.
ADID
AS
ANN
UAL
REPO
RT 2
017
0331 TO OUR SHAREHOLDERS 2 GROUP MANAGEMENT REPORT –
OUR COMPANY3 GROUP MANAGEMENT REPORT –
FINANCIAL REVIEW4 CONSOLIDATED FINANCIAL
STATEMENTS5 ADDITIONAL INFORMATION
CORPORATE GOVERNANCE REPORT INCLUDING THE DECLARATION ON CORPORATE GOVERNANCE
SUGGESTIONS OF THE GERMAN CORPORATE GOVERNANCE CODE LARGELY FULFILLEDIn addition to the recommendations, the Code contains a number of suggestions for good and responsible corporate governance, compliance with which is not required to be disclosed separately by law. adidas is compliant with the suggestions of the Code except for the suggestion outlined in section 4.2.3 subsection 2 sentence 9 of the Code according to which early disbursements of multiple-year, variable remu neration components should not be permitted.
SEE COMPENSATION REPORT, P. 39
DUAL BOARD SYSTEMAs a globally operating public listed company with its registered seat in Herzogenaurach, Germany, adidas AG is, inter alia, subject to the provisions of German stock corporation law. A dual board system, which assigns the management of the company to the Executive Board and advice and supervision of the Executive Board to the Supervisory Board, is one of the fundamental principles of German stock corporation law. These two boards are strictly separated both in terms of members and of competencies. In the interest of the company, however, both Boards cooperate closely.
COMPOSITION AND WORKING METHODS OF THE EXECUTIVE BOARDThe composition of our Executive Board, which consists of six members, reflects the international character of our company. No member of the Executive Board has accepted more than a total of three supervisory board mandates in non-group listed companies or in supervisory bodies of non-group companies with similar requirements. SEE EXECUTIVE BOARD. P. 20 The Executive Board is responsible for independently managing the company, determining the company’s strategic orientation, agreeing this with the Supervisory Board and ensuring its implementation. Further, it defines business targets, company policy and the organization of the company. Additionally, the
Executive Board ensures appropriate risk management and risk controlling as well as compliance with statutory regulations and internal guidelines. It is bound to the company’s interest and obligated to strive for a sustainable increase in company value.
Irrespective of the Executive Board’s overall responsibility, its members are individually responsible for managing their respective business areas in accordance with the Executive Board’s Business Allocation Plan. There are no Executive Board committees. The CEO is responsible in particular for leading the entire Executive Board as well as for guiding business development, including the coordination of the business segments, brands and markets. The members of the Executive Board keep each other informed regularly and comprehensively on all significant developments in their business areas and align on all cross-functional measures. Further details on collaboration within the Executive Board are governed by the Rules of Procedure of the Executive Board and the Business Allocation Plan. These documents specifically stipulate requirements for meetings and resolutions as well as for cooperation with the Supervisory Board.
At the Supervisory Board meetings, the Executive Board reports in writing and orally on the agenda items and resolution proposals and answers all questions from the individual Supervisory Board members. The CEO and the CFO maintain regular contact with the Chairman of the Supervisory Board and the Audit Committee Chairman and consult with them on key aspects of strategy, planning and business development as well as on questions of risk management and compliance within the company.
COMPOSITION AND WORKING METHODS OF THE SUPERVISORY BOARDOur Supervisory Board consists of 16 members. It comprises eight shareholder representatives and eight employee representatives in accordance with the German Co-Deter-mination Act (Mitbestimmungsgesetz – MitbestG). SEE
SUPERVISORY BOARD, P. 24 The shareholder representatives are elected by the shareholders at the Annual General Meeting, and the employee representatives by the employees. The last periodic election took place in 2014. In the 2016 financial year, supplementary elections of the Supervisory Board took place. The term of office of the current members of the Supervisory Board expires at the end of the 2019 Annual General Meeting.
Taking into account the recommendations of the Code, the Supervisory Board resolved upon the following objectives for its composition in February 2016 and confirmed these in November 2016:
— The composition of the Supervisory Board including members with international background shall be maintained to the current extent. Diversity in terms of expertise and experience on the grounds of origin, education or professional activity shall continue to be taken into account in the future.
— The number of women on the Supervisory Board, namely four, but no less than the number stipulated by law, shall be maintained. Furthermore, one woman shall be a member of the Nomination Committee.
— As in the past, all members of the Supervisory Board shall be independent. This presupposes that all employee representatives also in principle meet the independence criteria as defined by the Code. Substantial, not merely temporary conflicts of interest shall be avoided.
— The members of the Supervisory Board shall have sufficient time for performing their mandate.
— The age limit of, in general, 72 years at the time of election shall be taken into account.
ADID
AS
ANN
UAL
REPO
RT 2
017
0341 TO OUR SHAREHOLDERS 2 GROUP MANAGEMENT REPORT –
OUR COMPANY3 GROUP MANAGEMENT REPORT –
FINANCIAL REVIEW4 CONSOLIDATED FINANCIAL
STATEMENTS5 ADDITIONAL INFORMATION
CORPORATE GOVERNANCE REPORT INCLUDING THE DECLARATION ON CORPORATE GOVERNANCE

In accordance with the reasons stated in the Declaration of Compliance, we do not follow the recommendation to specify a regular limit of length of membership for Super-visory Board members.
Together, the members of the Supervisory Board have the knowledge, skills and professional expertise required to properly perform their duties. All of them are familiar with the sector in which the company operates. As they furthermore have extensive knowledge of various professional fields and many years of international experience, they bring a broad spectrum of expertise and experience to the performance of the Supervisory Board’s function. The number of female Supervisory Board members currently amounts to four. The members of our Supervisory Board do not exercise directorships or similar positions or advisory tasks for key competitors of the company. Further, they do not have business or personal relations with adidas AG, its Executive Board and Supervisory Board or a controlling shareholder which may cause a substantial and not merely temporary conflict of interest. Based on the aforementioned independence criteria and assuming that all of the employee representatives also in principle meet these criteria for Supervisory Board members as defined by the Code, in the Supervisory Board’s assessment, currently all of its members
are independent. The names of all Supervisory Board members are stated in this Annual Report. SEE SUPERVISORY
BOARD, P. 24 Based on the Supervisory Board’s assessment, the appropriate number of independent members of shareholder representatives amounts to at least 80% or six members. The age limit of, in general, 72 years at the time of election was taken into account in the selection process. The composition of the Supervisory Board consequently fully complies with the specified set of objectives.
In accordance with the recommendation of the Code, the Supervisory Board prepared a profile of skills and expertise (competency profile) for the entire Supervisory Board at its meeting in February 2018. According to this competency profile, the main objective is that the Supervisory Board is composed in such a way that it can fulfill its duties stipulated by law and in the Articles of Association in the interest of the company. This includes, above all, ensuring qualified supervision of and provision of advice to the Executive Board. To this end, criteria such as personality, integrity and independence are important. Moreover, based on their knowledge, skills and experience, the members of the Supervisory Board are expected to be able to perform the duties of a supervisory board member in an international company. For this purpose, the goal is that the entire Supervisory Board reflects the entire extent of knowledge and experience considered essential in view of adidas’ activities. This includes, inter alia, knowledge and experience in the areas of technology, digitalization, e-commerce and retail. Moreover, the Supervisory Board is expected to possess knowledge and experience in the business segments/markets important for adidas, in particular the Asian and US-American markets, and in the management of an international company. Furthermore, the entire Supervisory Board is to possess knowledge and experience in the areas of corporate strategy, compliance and corporate governance. At least one
independent member of the Supervisory Board shall possess expertise in the areas of accounting and annual auditing as well as specific expertise and experience with regard to the application of accounting principles and internal control systems. In particular, the Supervisory Board shall also consist of persons who have leadership experience in an international company because they hold a management position or because they are members of a supervisory board or a comparable body. The entire Supervisory Board currently fulfills the competency profile.
With regard to the Supervisory Board’s future composition, when proposing candidates to the Supervisory Board, the Nomination Committee will not only take into account the requirements of the law, the Code and the Supervisory Board’s Rules of Procedure but also the targets and criteria resolved upon and the competency profile prepared. The best interests of the company will continue to play a decisive role when nominating candidates for election.
The Supervisory Board supervises and advises the Executive Board in questions relating to the management of the company. The Executive Board regularly, expeditiously and comprehensively reports on business development and planning as well as on the risk situation including compliance and coordinates the strategy of the company and its implementation with the Supervisory Board. The Supervisory Board examines and approves the annual financial statements of adidas AG and the adidas Group, taking into consideration the auditor’s reports, and resolves upon the proposal of the Executive Board on the appropriation of retained earnings. Additionally, it resolves upon the resolution proposals to be presented to the Annual General Meeting. Certain business transactions and measures of the Executive Board with fundamental significance are subject to prior approval by the Supervisory Board or by a Supervisory Board committee.
Further information on corporate governance
More information on topics covered in this report can be found on our website↗ ADIDAS-GROUP.COM/S/CORPORATE-GOVERNANCEincluding:
— Articles of Association — Rules of Procedure of the Executive Board — Rules of Procedure of the Supervisory Board — Rules of Procedure of the Audit Committee — Supervisory Board Committees (composition and tasks) — CVs of Executive Board members and Supervisory Board members
ADID
AS
ANN
UAL
REPO
RT 2
017
0351 TO OUR SHAREHOLDERS 2 GROUP MANAGEMENT REPORT –
OUR COMPANY3 GROUP MANAGEMENT REPORT –
FINANCIAL REVIEW4 CONSOLIDATED FINANCIAL
STATEMENTS5 ADDITIONAL INFORMATION
CORPORATE GOVERNANCE REPORT INCLUDING THE DECLARATION ON CORPORATE GOVERNANCE

The Supervisory Board is also responsible for the appointment and dismissal of members of the Executive Board. When appointing members of the Executive Board, the Supervisory Board pays attention to the best possible composition of the Executive Board. Inter alia, experience, industry knowledge and personal expert qualifications play an important role in this regard. In addition, taking into account the international structure of the company, the Supervisory Board considers diversity. This applies, in particular, also with regard to age, internationality and other important personal qualities. The Supervisory Board further determines the Executive Board compensation system, examines it regularly and decides on the individual overall compensation of each Executive Board member. To this end, the relation between Executive Board compensation and that of senior management and the entire employees is taken into account, also in terms of its development over time. Further information on Executive Board compensation is compiled in the Compensation Report.
SEE COMPENSATION REPORT, P. 39
In order to increase the efficiency of its work and to deal with complex topics, the Supervisory Board has formed six permanent expert committees from within its members, which, inter alia, prepare its resolutions and, in certain cases, pass resolutions on its behalf. These committees are the Steering Committee, the General Committee, the Audit Committee, the Finance and Investment Committee, the Mediation Committee in accordance with § 27 section 3 MitbestG and the Nomination Committee. The chairmen of the committees report to the entire Supervisory Board on the results of the committee work on a regular basis. The composition of the committees can be found in the respective overview of the Supervisory Board. SEE SUPERVISORY BOARD, P. 24
Further information on the committees’ tasks is available on our website. ↗ ADIDAS-GROUP.COM/S/SUPERVISORY-BOARD-COMMITTEES
Apart from the tasks and responsibilities, the Rules of Procedure of the Supervisory Board and of the Audit Committee also set out the individual requirements expected of the members and the procedure for meetings and passing resolutions. These Rules of Procedure are available on our website. The Supervisory Board Report provides information on the activities of the Supervisory Board and its committees in the year under review. SEE SUPERVISORY BOARD REPORT, P. 27
The members of the Supervisory Board are individually responsible for undertaking any necessary training and professional development measures required for their tasks and, in doing so, are supported by adidas AG. The company informs the Supervisory Board regularly about current legislative changes as well as opportunities for external training, and provides the Supervisory Board with relevant specialist literature.
Every two years, the Supervisory Board and the Audit Committee examine the efficiency of their work. As a result, suggestions for even better cooperation can be made. The current efficiency examinations, which are being conducted with the help of an external consultant, began in late 2017 and will be concluded in 2018.
COMMITMENT TO THE PROMOTION OF THE EQUAL PARTICIPATION OF WOMEN AND MEN IN LEADERSHIP POSITIONSWhen filling leadership positions in the company, the Executive Board takes diversity into consideration and especially aims for an appropriate consideration of women. The Supervisory Board is also convinced that an increase in the number of women in leadership positions within the company is necessary to ensure that, in the future, an increased number of female candidates are available for Executive Board positions. The Supervisory Board thus supports the diversity
and inclusion initiatives of the company, particularly concerning the promotion of women in leadership positions.
SEE PEOPLE AND CULTURE, P. 81
Pursuant to the ‘Law on Equal Participation of Women and Men in Leadership Positions in the Private and Public Sector’, the percentage of women and men on the Supervisory Board must be at least 30% each. The shareholder representatives and the employee representatives have each resolved in accordance with § 96 section 2 sentence 3 AktG that this minimum quota shall be fulfilled separately for the shareholder representatives and the employee representatives. Both the shareholder representatives and the employee representatives fulfill the statutory minimum quota.
Furthermore, target figures for the percentage of female representation on the Executive Board and the first two management levels have been determined for adidas AG. All implementation periods expired for the first time on June 30, 2017. Since Karen Parkin’s appointment in May 2017, the target of appointing one woman to the Executive Board is fulfilled. The target figure of 18% for the first management level below the Executive Board was also fulfilled. The target figure of 30% for the second management level below the Executive Board was only just missed, at 29%, due to unplanned departures from the company.
The Supervisory Board or Executive Board have once again determined target figures and respective implementation deadlines for the percentage of female representation on the Executive Board of adidas AG as well as for the first and second management levels below the Executive Board. The target figures are as follows:
— The target figure for the Executive Board is 1/7 or 14.29%. The deadline for achieving this target figure is June 30, 2022.
ADID
AS
ANN
UAL
REPO
RT 2
017
0361 TO OUR SHAREHOLDERS 2 GROUP MANAGEMENT REPORT –
OUR COMPANY3 GROUP MANAGEMENT REPORT –
FINANCIAL REVIEW4 CONSOLIDATED FINANCIAL
STATEMENTS5 ADDITIONAL INFORMATION
CORPORATE GOVERNANCE REPORT INCLUDING THE DECLARATION ON CORPORATE GOVERNANCE
— The target figure for the first management level below the Executive Board is 24% and 30% for the second management level below the Executive Board. The implementation period for both targets expires on December 31, 2019.
AVOIDING CONFLICTS OF INTERESTThe members of the Executive Board and Supervisory Board are obligated to disclose any conflicts of interest to the Supervisory Board without any delay. Substantial transactions between the company and members of the Executive Board or persons in a close relation with them require Supervisory Board approval. Contracts between the company and members of the Supervisory Board also require Supervisory Board approval. The Supervisory Board reports any conflicts of interest, as well as the handling thereof, to the Annual General Meeting. In the year under review, neither the members of the Executive Board nor the members of the Supervisory Board – with the exception of the matter outlined in the Supervisory Board Report – faced any conflicts of interest.
SEE SUPERVISORY BOARD REPORT, P. 27
SHARE OWNERSHIP OF AND SHARE TRANSACTIONS CONDUCTED BY THE EXECUTIVE BOARD AND SUPERVISORY BOARDAn overview of the managers’ transactions notified to adidas AG in 2017 by persons discharging managerial responsibilities pursuant to Article 19 of the Market Abuse Regulation is published on our website. ↗ ADIDAS-GROUP.COM/S/MANAGERS-TRANSACTIONS
RELEVANT MANAGEMENT PRACTICESOur business activities are oriented towards the legal systems in the various countries and markets in which we operate. This implies a high level of social and environmental responsibility. Further information on company-specific practices which are applied in addition to statutory require-ments, such as our Code of Conduct, on compliance with working
and social standards, environmental responsibility, chemical management and our social commitment, such as supporting refugees, is available in this Annual Report and on our website.
SEE SUSTAINABILITY, P. 88 ↗ ADIDAS-GROUP.COM/SUSTAINABILITY
COMPLIANCE AND RISK MANAGEMENT Compliance with laws, internal and external provisions and responsible risk management are part of corporate governance at adidas. Our compliance management system is organizationally linked to the company’s risk and opportunity management system. As part of our global ‘Fair Play Concept’, the compliance management system establishes the organizational framework for company-wide awareness of our internal rules and guidelines and for the legally compliant conduct of our business. It underscores our strong commitment to ethical and fair behavior in our own organization and also sets the parameters for how we deal with others. The principles of our compliance management system are set out in the Risk and Opportunity Report. The risk and opportunity management system ensures risk-aware, opportunity-oriented and informed actions in a dynamic business environment in order to guarantee the competitiveness and sustainable success of adidas.
SEE RISK AND OPPORTUNITY REPORT, P. 131
TRANSPARENCY AND PROTECTION OF SHAREHOLDERS’ INTERESTSIt is our goal to inform all institutional investors, private shareholders, financial analysts, business partners, employees and the interested public about the company’s situation, at the same time and to an equal extent, through regular, transparent and up-to-date communication. We publish all essential information, such as press releases, ad hoc announcements and voting rights notifications as well as all presentations from roadshows and conferences, all financial reports and the financial calendar on our website. With our comprehensive Investor Relations activities, we maintain close and continuous contact with our current and potential share-holders. ↗ ADIDAS-GROUP.COM/S/INVESTORS SEE OUR SHARE, P. 57
In addition, we provide all documents and information on our Annual General Meeting on our website. The shareholders of adidas AG exercise their shareholders’ rights at the Annual General Meeting. Each share grants one vote. Our shareholders are involved in all fundamental decisions at the Annual General Meeting through their participation rights. It is our intention to support our shareholders in exercising their voting rights at the Annual General Meeting. At our next Annual General Meeting, taking place in Fuerth (Bavaria) on May 9, 2018, we will again provide our shareholders with the best possible service. Shareholders have the possibility, inter alia, to electronically register for the Annual General Meeting through our shareholder portal or to participate in voting by granting powers of representation and voting instructions online to the proxies appointed by the company. Further, all shareholders can follow the Annual General Meeting in full length live on the company’s website, subject to technical availability of the website.
SHARE-BASED PROGRAMSIn the 2017 financial year, a long-term incentive (LTI) plan, which is part of the long-term remuneration for senior
Further information on the principlesof our management
More information on topics covered in this report can be foundon our website at ↗ ADIDAS-GROUP.COMincluding:
— Code of Conduct — Sustainability — Social commitment — Risk and opportunity management and compliance — Information and documents on the Annual General Meeting — Managers’ transactions — Accounting and annual audit
ADID
AS
ANN
UAL
REPO
RT 2
017
0371 TO OUR SHAREHOLDERS 2 GROUP MANAGEMENT REPORT –
OUR COMPANY3 GROUP MANAGEMENT REPORT –
FINANCIAL REVIEW4 CONSOLIDATED FINANCIAL
STATEMENTS5 ADDITIONAL INFORMATION
CORPORATE GOVERNANCE REPORT INCLUDING THE DECLARATION ON CORPORATE GOVERNANCE

executives of adidas, was implemented. Based on this plan, the plan participants receive registered stock units (RSU).
SEE NOTE 27, P. 186 SEE PEOPLE AND CULTURE, P. 81
As per their contracts, each member of the Executive Board is entitled to participate in a Long-Term Incentive Plan set up for the Executive Board members. The new LTIP 2018/2020 aims to link the long-term compensation of the Executive Board even more strongly to the company’s performance and thus to the interests of the shareholders. Furthermore, the decisive assessment factors are to be simplified and made more transparent and the long-term compensation of the Executive Board and senior management is to be aligned. Against this background, the LTIP 2018/2020 is – in contrast to the previous LTIP 2015/2017 – share-based as it comprises the acquisition of adidas shares subject to a lock-up period.
SEE COMPENSATION REPORT, P. 39
ACCOUNTING AND ANNUAL AUDIT adidas AG prepares the annual financial statements in accordance with the provisions of the German Commercial Code (Handelsgesetzbuch – HGB) and the Stock Corporation Act. The annual consolidated financial statements are prepared in accordance with the principles of the International Financial Reporting Standards (IFRS), as adopted by the European Union (EU).
KPMG AG Wirtschaftsprüfungsgesellschaft was appointed as auditor for the 2017 annual financial statements and annual consolidated financial statements by the Annual General Meeting. The Supervisory Board had previously assured itself of the auditor’s independence.
SEE INDEPENDENT AUDITOR’S REPORT, P. 221ADID
AS
ANN
UAL
REPO
RT 2
017
0381 TO OUR SHAREHOLDERS 2 GROUP MANAGEMENT REPORT –
OUR COMPANY3 GROUP MANAGEMENT REPORT –
FINANCIAL REVIEW4 CONSOLIDATED FINANCIAL
STATEMENTS5 ADDITIONAL INFORMATION
CORPORATE GOVERNANCE REPORT INCLUDING THE DECLARATION ON CORPORATE GOVERNANCE

COMPENSATION REPORTFor adidas, transparent and comprehensible reporting on the compensation of the Executive Board and Supervisory Board is an essential element of good corporate governance. The Compensation Report is a component of the combined Management Report and outlines the principles of the compensation system for the members of the Executive Board and Supervisory Board as well as the level and structure of the compensation in accordance with the legal requirements and the recommendations of the German Corporate Governance Code (the ‘Code’) as amended on February 7, 2017.
COMPENSATION OF THE EXECUTIVE BOARD MEMBERS
Following preparation by the Supervisory Board’s General Committee, the compensation system for our Executive Board and the total compensation of each member of the Executive Board is determined and regularly reviewed by the entire Supervisory Board. The compensation and personnel topics dealt with by the Supervisory Board and General Committee in the year under review are described in detail in the Supervisory Board Report. SEE SUPERVISORY BOARD REPORT, P. 27
The compensation system is geared toward creating an incentive for successful, sustainably value-oriented corporate management and development. Against this background, more than 50% of the variable target compensation component is based upon multi-year performance criteria. The variable compensation components are designed in such a way that the incentive to achieve the long-term targets decisive for the multi-year variable target compensation component is higher
than the incentive to achieve the targets decisive for being granted the one-year variable compensation component. Corresponding contractual provisions ensure that this weighting can be maintained in the future. In terms of the appropriateness of the Executive Board compensation, when determining the compensation, the Supervisory Board takes into consideration factors such as the size and the global orientation, the economic situation, the success and outlook of the company, as well as the common level of the compensation in comparison with peer companies and with the compensation structure applicable for other areas of the company. To this end, the relation between the Executive Board compensation and that of Senior Management and employees overall is taken into account, both in total and in terms of its development over time, with the relevant groups of persons having been determined by the Supervisory Board. In addition, when determining the compensation, the tasks and contribution of each Executive Board member to the company’s success, their individual performance as well as the overall performance of the Executive Board are taken into consideration. The compensation system aims to appropriately remunerate exceptional performance, while diminishing variable compensation when targets are not met. Thus, in the Supervisory Board’s opinion, an appropriate level of compensation, which is reviewed annually by the Supervisory Board and adjusted if required, can be ensured.
The compensation system for the members of the Executive Board which has been applicable since the 2015 financial year was adopted by the shareholders at the Annual General Meeting on May 7, 2015. The Supervisory Board resolved to change individual elements of the existing compensation system described in the following with effect from the 2018 financial year. Details on the changed elements can be found following the description of the previous compensation system.
PREVIOUS COMPENSATION SYSTEMPreviously, in case of 100% target achievement, the total compensation (without other benefits and pension payments) was essentially made up of 35% fixed compensation, 30% annual Performance Bonus and 35% LTIP Bonus. In addition, there are various pension commitments. Moreover, at its equitable discretion, the Supervisory Board may grant a special bonus in case of extraordinary performance by an Executive Board member which is not related to performance criteria that were already decisive for granting the Performance Bonus or the LTIP Bonus. Such special bonus is limited to a maximum of 100% of the annual fixed salary of the calendar year for which the special bonus is granted.
The compensation system consists of the following components:
Non-performance-related componentsFixed compensationThe fixed compensation consists of the annual fixed salary. In principle, it is paid in twelve equal monthly installments and generally remains unchanged during the term of the service contract.
Other benefitsThe other benefits primarily consist of paying for, or providing the monetary value of, non-cash benefits and of other benefits such as premiums or contributions to insurance schemes normal for the market, the assumption of relocation costs, the provision of a company car or the use of the internal driver service or the payment of a car allowance and, if Executive Board members are also subject to taxation abroad, the costs for tax consultants selected by adidas. The total amount of these other benefits is capped at 5% of the total compensation comprising the fixed salary and a (possible) Performance Bonus granted in the respective financial year.
ADID
AS
ANN
UAL
REPO
RT 2
017
0391 TO OUR SHAREHOLDERS 2 GROUP MANAGEMENT REPORT –
OUR COMPANY3 GROUP MANAGEMENT REPORT –
FINANCIAL REVIEW4 CONSOLIDATED FINANCIAL
STATEMENTS5 ADDITIONAL INFORMATION
COMPENSATION REPORT

Performance-related componentsPerformance BonusAs the annual variable component, the Performance Bonus serves as compensation for the Executive Board’s performance in the past financial year in line with the short-term development of the company.
At the beginning of the financial year, the Supervisory Board establishes the respective weighted performance criteria and determines the individual amount of the Performance Bonus target amount for each member of the Executive Board, based on a target achievement of 100% (Bonus target amount). The
individual performance criteria are designed in such a way that the target achievement of the respective performance criterion may also be zero. When targets are clearly not met, the Performance Bonus may consequently be forfeited entirely.
At the end of the financial year, the precise target achievement of each Executive Board member, which is, in principle, based on a comparison of the predefined target values with the values achieved in the year under review, is examined. The Supervisory Board determines at its equitable discretion the factor by which the Bonus target amount is multiplied by adding up these degrees of target achievement (overall
degree of target achievement). The result is the individual amount of the Performance Bonus to be paid (bonus amount). When determining the degrees of target achievement and thus when determining the bonus amount, the Supervisory Board may take into account extraordinary developments which are not related to the performance of the Executive Board. The bonus amount is capped at a maximum of 150% of the individual Bonus target amount. If the overall degree of target achievement lies at or below 50%, the Executive Board member is not entitled to the Performance Bonus.
If an Executive Board member takes or leaves office during a financial year, the Performance Bonus is generally calculated pro rata temporis based on the degree of target achievement determined at the end of the financial year. In certain cases defined in the Terms & Conditions of the Performance Bonus, entitlement to the payout of a Performance Bonus is forfeited, unless the Supervisory Board determines otherwise at its equitable discretion.
The bonus amount is payable following approval of the consolidated financial statements of the past financial year.
Long-Term Incentive Plan 2015/2017 (LTIP 2015/2017)Based on the Long-Term Incentive Plan 2015/2017 (LTIP 2015/2017) measured over a three-year period, the LTIP Bonus serves – in line with sustainability-oriented develop-ment of the company – as compensation for the long-term performance of the Executive Board. On this basis, at the beginning of the 2015 financial year, the Supervisory Board defined five weighted performance criteria oriented toward sustainable growth of the company. Furthermore, at the beginning of 2015 or upon appointment to the Executive Board, the Supervisory Board defined the individual amount of the LTIP Bonus target amount for each Executive Board member, based on a target achievement of 100% (LTIP target amount).
Compensation system for Executive Board members in 2017 1
Fixed compensation 2017 Performance Bonus LTIP 2015/201735% of target direct compensation.
The fixed compensation is paid out monthly in twelve equal installments.
30% of target direct compensation.
For the performance criteria deter-mined at the beginning of the 2017 financial year, see the section ‘2017 Performance Bonus’ on page 47.
The bonus amount is payable following approval of the consolidated financial statements of the past financial year.
35% of target direct compensation.
For the performance criteria deter-mined in the 2015 financial year, see the section ‘LTIP 2015/2017’ on page 47.
Payout of the LTIP Bonus will be effected after the 2017 consolidated financial statements are approved.
Target direct compensation
(in case of 100% target achievement)
Cap of overall compensation
(maximumcompensation) Fixed compensation 2017 Performance Bonus
The Performance Bonus is capped at a maximum of 150% of the individual Bonus target amount. If the overall degree of target achievement lies at or below 50%, the Executive Board member is not entitled to the Performance Bonus.
LTIP 2015/2017The LTIP Bonus is capped at a maximum of 150% of the individual LTIP target amount. If the overall degree of target achievement lies at or below 50%, the Executive Board member is not entitled to the LTIP Bonus.
For the ultimate evaluation of the Executive Board’s performance, qualitative criteria are taken into account.
Fixed compensation One-year performance-related compensation Multi-year performance-related compensation
ADID
AS
ANN
UAL
REPO
RT 2
017
0401 TO OUR SHAREHOLDERS 2 GROUP MANAGEMENT REPORT –
OUR COMPANY3 GROUP MANAGEMENT REPORT –
FINANCIAL REVIEW4 CONSOLIDATED FINANCIAL
STATEMENTS5 ADDITIONAL INFORMATION
COMPENSATION REPORT

At the end of the 2017 financial year, the precise target achievement of each Executive Board member, which is based on a comparison of the predefined target values with the values achieved at the end of the three-year period covering the years 2015 to 2017, was examined. The Supervisory Board then determined at its equitable discretion the factor by which the LTIP target amount is multiplied by adding up these degrees of target achievement, while additionally taking into account qualitative criteria. The result is the individual amount of the LTIP Bonus to be paid (bonus amount). Payout of the LTIP Bonus will be effected after the 2017 consolidated financial statements are approved. When determining the degrees of target achievement and thus when determining the bonus amount, the Supervisory Board may take into account extraordinary developments which are not related to the performance of the Executive Board.
The LTIP Bonus is capped at a maximum of 150% of the individual LTIP target amount. If the overall degree of target achievement lies at or below 50%, the Executive Board member is not entitled to the LTIP Bonus. If an Executive Board member takes or leaves office during the term of the LTIP 2015/2017 (Performance Period), the LTIP Bonus is generally calculated on a pro rata basis. In certain cases defined in the Terms & Conditions of the LTIP 2015/2017, entitlement to the payout of an LTIP Bonus is generally forfeited, unless the Supervisory Board determines otherwise at its equitable discretion.
Pension commitmentsThe current members of the Executive Board generally have defined contribution pension plans. The pension entitlement of Glenn Bennett and Robin J. Stalker, who resigned from the Executive Board in the 2017 financial year, will be covered by the defined benefit pension plans granted to them.
Defined contribution pension plansThe defined contribution pension plans, each in the form of a direct commitment, basically have the same structure as the existing ‘ adidas Management Pension Plan’ for managers.
As part of the pension commitments, an amount equaling a percentage determined by the Supervisory Board, which is related to the individual annual fixed compensation, is credited to the virtual pension account of the individual Executive Board member each year. The Supervisory Board annually resolves on this percentage, which most recently was set at 50%. When making its decision, the Supervisory Board takes into account the targeted individual pension level and the resulting annual and long-term expenses for the company. The pension assets existing at the beginning of the respective calendar year shall yield a fixed interest rate of 3% p.a., however for no longer than until the pension benefits first become due. As a rule, interest shall be credited as at the close of December 31 in each calendar year, and on the due date in the year in which the pension benefits are first due. Entitlement to the pension benefits becomes vested immediately.
The entitlements to pension benefits comprise pensions to be received upon reaching the age of 65, or, on application, early retirement pensions to be received upon reaching the age of 62 (early pensions), or invalidity and survivors’ benefits.
On occurrence of the pension-triggering event, the pension benefits generally correspond to the balance of the pension account including accumulated interest on that date. In case
of invalidity or death prior to reaching the age of 62, for the minimum coverage, the Executive Board member’s pension account will be credited with the outstanding pension contributions for the time until the Executive Board member would have reached the age of 62, but no longer than for 120 months (without interest accrual). The pension benefits due upon death of the Executive Board member are payable to the widow, the widower or the registered civil partner and the children entitled to pension benefits as joint creditors.
At the option of the Executive Board member or the surviving dependents, the payout of all pension benefits is made either as a one-time payment or in up to ten equal annual install-ments. If no choice is made by the Executive Board member or by the surviving dependents, the pension benefits are paid out in three equal annual installments. As a rule, in case of a payout in annual installments, the installments are due in January of the respective year. The still outstanding install-ments of the benefit phase bear the maximum interest rate of the first due date of the pension benefits for the calculation of the actuarial reserve according to the German Actuarial Reserve Ordinance (DeckRV) for life insurance companies.
As regards insolvency insurance, the pension plans can be integrated into the existing trust model, the Contractual Trust Arrangement (CTA).
Defined benefit pension plansStarting from a base amount totaling 10% (Robin J. Stalker) or 20% (Glenn Bennett) of the respective pensionable income granted in the pension plan, a module of two percentage points of the pensionable income, or three percentage points since March 6, 2015, is created for the Executive Board members for each full year of tenure as an Executive Board member (in deviation herefrom, the starting date chosen for Glenn Bennett, who was a member of the Executive Board as of March 6, 1997 was January 1, 2000).
ADID
AS
ANN
UAL
REPO
RT 2
017
0411 TO OUR SHAREHOLDERS 2 GROUP MANAGEMENT REPORT –
OUR COMPANY3 GROUP MANAGEMENT REPORT –
FINANCIAL REVIEW4 CONSOLIDATED FINANCIAL
STATEMENTS5 ADDITIONAL INFORMATION
COMPENSATION REPORT

As its targeted level of provision, the Supervisory Board has determined for the Executive Board members a pension entitlement amounting to a maximum of 50% of an Executive Board member’s pensionable income. The amount of pensionable income currently equals the individual annual fixed salary indicated in the table ‘Benefits granted’.
The pension benefits comprise retirement pensions to be received upon reaching the age of 65 as well as disability and survivors’ benefits.
In the event that an Executive Board member leaves the company prior to reaching retirement age, the non-forfeiture of the pension entitlement will be in line with legal provisions. The pension entitlement is not, as legally envisaged, reduced pro rata temporis, i.e. it amounts to at least the base amount of the pension commitment made to the Executive Board member, plus the pension modules accumulated annually during the term of office.
Following the pension-triggering event, ongoing pensions are adjusted in line with the development of state pensions.
adidas Management Pension PlanThe Executive Board members who were active members of the Executive Board in the 2017 financial year and who belonged to the group of senior executives of adidas AG prior to their Executive Board appointments 1 will at the time of their retirement receive additional payments from the ‘ adidas Management Pension Plan’. Until their appointment as Executive Board members, adidas AG had contributed pension components under these supplementary provisions which were introduced for all of these senior executives of the company in 1989.
Commitments to Executive Board members upon termination of tenureUnless otherwise agreed in the individual case, if the service contract ends upon the Executive Board member reaching the age of 65 or upon non-renewal of the service contract, the Executive Board member is entitled to receive his annual fixed salary on a pro rata basis up to the date on which he leaves office as well as a potential prorated Performance Bonus and a potential prorated LTIP Bonus. Further, Executive Board members are subject to a post-contractual competition prohibition of two years. As consideration, for the duration of the competition prohibition, the Executive Board members generally receive a compensation amount totaling 50% of the fixed compensation last received, subject to offsetting (e.g. of income from other use of his work capacity). Under certain circumstances, the departing Executive Board member also receives a follow-up bonus 2. This follow-up bonus is payable in two tranches, twelve and 24 months following the end of the contract.
In case of premature termination of tenure in the absence of good cause, the Executive Board service contracts cap potential severance payments at a maximum of twice the total annual compensation, not exceeding payment claims for the remaining period of the service contract (Severance Payment Cap). If the service contract is terminated due to a change of control, a possible severance payment is limited to 150% of the Severance Payment Cap.
If an Executive Board member dies during his term of office, his spouse or partner receives or, alternatively, any dependent children receive, in addition to pension benefits, the pro rata annual fixed salary for the month of death and the following three months, but no longer than until the agreed end date of the service contract.
COMPENSATION SYSTEM APPLICABLE AS OF THE 2018 FINANCIAL YEARThe Supervisory Board resolved to change individual elements of the existing compensation system described above with effect from the 2018 financial year. In this way, the entire compensation system of the Executive Board is to be simplified and the assessment factors will be made more transparent. With the compensation system applicable as of the 2018 financial year, at least 80% of the variable compensation (Performance Bonus and LTIP) is directly linked to the short- and long-term sales and profitability targets externally communicated. At the same time, the compensation of the Executive Board members is being directly brought into line with the interests of the shareholders.
The changes to the compensation system concern the following aspects:
Apportionment of the overall paymentsThe components of the total compensation remain unchanged, consisting of fixed compensation, an annual Performance Bonus, an LTIP Bonus and other benefits and pension payments. In case of 100% target achievement, the share of the fixed compensation component in the total compensation (without other benefits and pension payments) still amounts to 35%; the annual Performance Bonus component, however, now only amounts to 25% (instead of the previous general value of 30%), while the share of the LTIP Bonus component is increased from the previous general value of 35% to 40%.
Performance-related components2018 Performance BonusAs the annual variable component, the Performance Bonus still serves as compensation for the Executive Board’s
1 Roland Auschel, Eric Liedtke, Harm Ohlmeyer and Robin J. Stalker.2 As regards the current members of the Executive Board, such a follow-up bonus was agreed with Roland Auschel and Eric Liedtke, in each case in the amount of 75% of the Performance Bonus granted to them
for the last full financial year. Furthermore, a follow-up bonus will be paid to Glenn Bennett (75%) and Robin J. Stalker (100%), who both departed from the Executive Board in 2017.
ADID
AS
ANN
UAL
REPO
RT 2
017
0421 TO OUR SHAREHOLDERS 2 GROUP MANAGEMENT REPORT –
OUR COMPANY3 GROUP MANAGEMENT REPORT –
FINANCIAL REVIEW4 CONSOLIDATED FINANCIAL
STATEMENTS5 ADDITIONAL INFORMATION
COMPENSATION REPORT
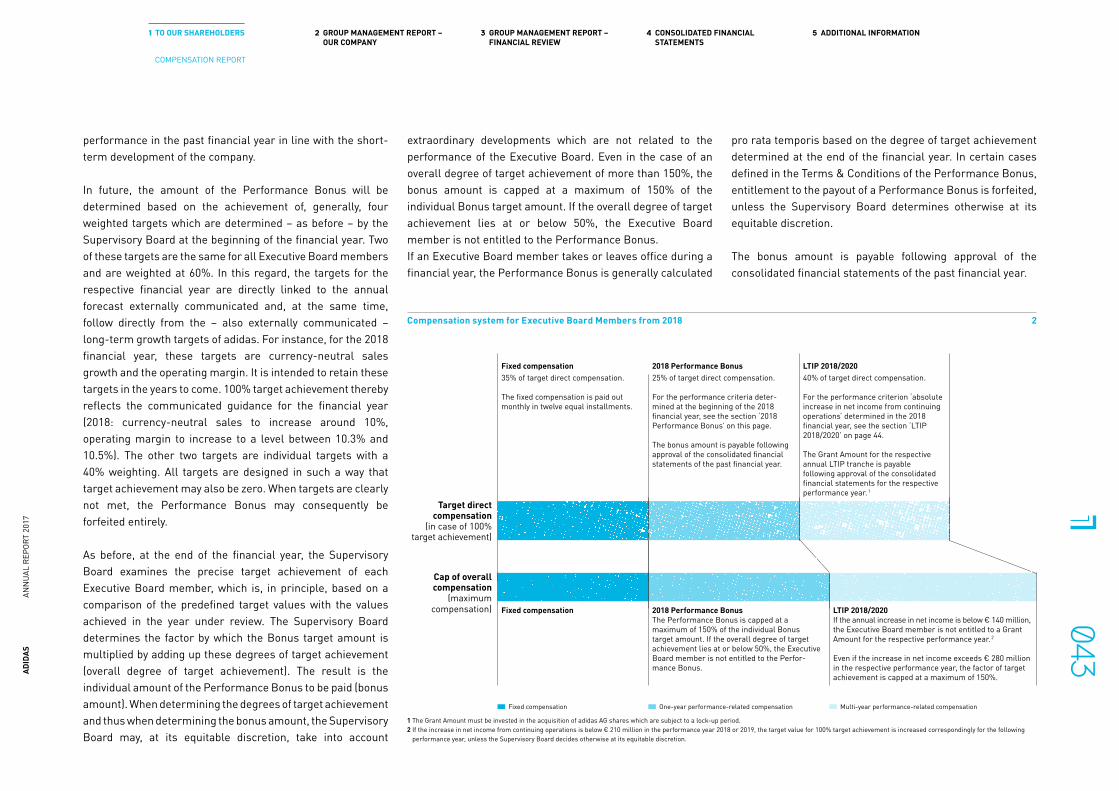
performance in the past financial year in line with the short-term development of the company.
In future, the amount of the Performance Bonus will be determined based on the achievement of, generally, four weighted targets which are determined – as before – by the Supervisory Board at the beginning of the financial year. Two of these targets are the same for all Executive Board members and are weighted at 60%. In this regard, the targets for the respective financial year are directly linked to the annual forecast externally communicated and, at the same time, follow directly from the – also externally communicated – long-term growth targets of adidas. For instance, for the 2018 financial year, these targets are currency-neutral sales growth and the operating margin. It is intended to retain these targets in the years to come. 100% target achievement thereby reflects the communicated guidance for the financial year (2018: currency-neutral sales to increase around 10%, operating margin to increase to a level between 10.3% and 10.5%). The other two targets are individual targets with a 40% weighting. All targets are designed in such a way that target achievement may also be zero. When targets are clearly not met, the Performance Bonus may consequently be forfeited entirely.
As before, at the end of the financial year, the Supervisory Board examines the precise target achievement of each Executive Board member, which is, in principle, based on a comparison of the predefined target values with the values achieved in the year under review. The Supervisory Board determines the factor by which the Bonus target amount is multiplied by adding up these degrees of target achievement (overall degree of target achievement). The result is the individual amount of the Performance Bonus to be paid (bonus amount). When determining the degrees of target achievement and thus when determining the bonus amount, the Supervisory Board may, at its equitable discretion, take into account
extraordinary developments which are not related to the performance of the Executive Board. Even in the case of an overall degree of target achievement of more than 150%, the bonus amount is capped at a maximum of 150% of the individual Bonus target amount. If the overall degree of target achievement lies at or below 50%, the Executive Board member is not entitled to the Performance Bonus.If an Executive Board member takes or leaves office during a financial year, the Performance Bonus is generally calculated
pro rata temporis based on the degree of target achievement determined at the end of the financial year. In certain cases defined in the Terms & Conditions of the Performance Bonus, entitlement to the payout of a Performance Bonus is forfeited, unless the Supervisory Board determines otherwise at its equitable discretion.
The bonus amount is payable following approval of the consolidated financial statements of the past financial year.
Compensation system for Executive Board Members from 2018 2
Fixed compensation 2018 Performance Bonus LTIP 2018/202035% of target direct compensation.
The fixed compensation is paid out monthly in twelve equal installments.
25% of target direct compensation.
For the performance criteria deter-mined at the beginning of the 2018 financial year, see the section ‘2018 Performance Bonus’ on this page.
The bonus amount is payable following approval of the consolidated financial statements of the past financial year.
40% of target direct compensation.
For the performance criterion ‘absolute increase in net income from continuing operations’ determined in the 2018 financial year, see the section ‘LTIP 2018/2020’ on page 44.
The Grant Amount for the respective annual LTIP tranche is payable following approval of the consolidated financial statements for the respective performance year. 1
Target direct compensation
(in case of 100% target achievement)
Cap of overall compensation
(maximumcompensation) Fixed compensation 2018 Performance Bonus
The Performance Bonus is capped at a maximum of 150% of the individual Bonus target amount. If the overall degree of target achievement lies at or below 50%, the Executive Board member is not entitled to the Perfor-mance Bonus.
LTIP 2018/2020If the annual increase in net income is below € 140 million, the Executive Board member is not entitled to a Grant Amount for the respective performance year. 2
Even if the increase in net income exceeds € 280 million in the respective performance year, the factor of target achievement is capped at a maximum of 150%.
Fixed compensation One-year performance-related compensation Multi-year performance-related compensation
1 The Grant Amount must be invested in the acquisition of adidas AG shares which are subject to a lock-up period.2 If the increase in net income from continuing operations is below € 210 million in the performance year 2018 or 2019, the target value for 100% target achievement is increased correspondingly for the following
performance year, unless the Supervisory Board decides otherwise at its equitable discretion.
ADID
AS
ANN
UAL
REPO
RT 2
017
0431 TO OUR SHAREHOLDERS 2 GROUP MANAGEMENT REPORT –
OUR COMPANY3 GROUP MANAGEMENT REPORT –
FINANCIAL REVIEW4 CONSOLIDATED FINANCIAL
STATEMENTS5 ADDITIONAL INFORMATION
COMPENSATION REPORT

Long-Term Incentive Plan 2018/2020 (LTIP 2018/2020)As of 2018, the previous LTIP 2015/2017 is replaced by a new Long-Term Incentive Plan 2018/2020 (LTIP 2018/2020). The LTIP 2018/2020 aims to link the long-term compensation of the Executive Board even more strongly to the company’s performance and thus to the interests of the shareholders. Furthermore, the decisive assessment factors are to be simplified and made more transparent and the long-term compensation of the Executive Board and Senior Management is to be aligned.
Against this background, the LTIP 2018/2020 – in contrast to the previous LTIP 2015/2017 – is share-based. It now consists of three annual tranches (2018, 2019 and 2020). Moreover, the assessment basis is extended. The compensation of the Executive Board members for each annual LTIP tranche is now no longer assessed based on a period of three years but based on a period of approximately four and a half years.
Each of the three annual LTIP tranches consists of a performance year and a subsequent lock-up period of about three years. At the beginning of 2018, the Supervisory Board determined as performance criterion for each of the three performance years (2018, 2019 and 2020) the absolute increase in net income from continuing operations compared to the respective previous year. In this respect, the target values for the annual LTIP tranches follow directly from the externally published long-term net income growth targets of the company. For instance, if net income from continuing operations increased by a total of € 630 million (100% target achievement) in the three-year period from 2018 to 2020, net income from continuing operations would amount to € 2,060 million in 2020. SEE TABLE BELOW Compared to 2015, this would correspond to an average increase in net income of 23% per year, which would be within the target corridor of 22% to 24%, as defined in our corporate strategy.
Performance yearGrowth target for net income from
continuing operations
2018 (compared to 2017 1) + € 210 million2019 (compared to 2018) + € 210 million2020 (compared to 2019) + € 210 million
1 The basis for 2017 is net income from continuing operations in the amount of € 1,430 million (without the negative tax-related one-time effect in the 2017 financial year).
If the increase in net income from continuing operations is below € 210 million in the performance year 2018 or 2019, the target value for 100% target achievement is increased correspondingly for the following performance year, unless the Supervisory Board decides otherwise at its equitable discretion. For instance, if net income increases by € 180 million in the performance year 2018, net income in the performance year 2019 must increase by € 240 million for a target achievement of 100%. However, if the increase in net income is higher than € 210 million in a performance year, the target for the following performance year remains unaffected by this. This means that compared to the previous year net income in the following performance year must still be increased by € 210 million for a target achievement of 100%, despite the higher net income achieved in the previous year.
Against this background, the Supervisory Board determined the individual amount of the annual LTIP target amount for each Executive Board member based on a target achievement of 100%.
The precise target achievement will be determined for the respective performance year on the basis of the adopted consolidated financial statements. In this respect, the Supervisory Board may, at its equitable discretion, take into account extraordinary developments which are not related to the performance of the Executive Board. The factor by which the annual LTIP target amount determined for the respective Executive Board member is multiplied is derived from the
amount of the actual increase in net income from continuing operations for the respective performance year:
Increase in net income from continuing operations compared to the previous year Factor
≥ + € 280 million 150%+ € 210 million 100%+ € 140 million 50%< + € 140 million 0%
If the actual increase in net income from continuing operations compared to the previous year is between the above-mentioned values, the factor is determined based on a sliding scale. If the annual increase in net income is below € 140 million, the factor is zero. Furthermore, the factor is capped at 150%, even if the increase in net income (significantly) exceeds € 280 million.
By multiplying the factor thus calculated with the annual LTIP target amount determined by the Supervisory Board for the respective Executive Board member based on a target achievement of 100%, the Grant Amount is determined, which is paid out to the Executive Board member for the respective annual LTIP tranche for the performance year following the adoption of the consolidated financial statements of adidas.
The Executive Board members have to invest the Grant Amount which remains after deducting applicable taxes and social security contributions into the acquisition of adidas AG shares. The shares purchased are subject to a lock-up period. The lock-up period ends in the third financial year after the acquisition of the shares upon expiry of the month in which the Annual General Meeting takes place. The Executive Board members may only dispose of the shares after expiry of the lock-up period. Due to this mechanism, the compensation which the Executive Board members eventually receive from
ADID
AS
ANN
UAL
REPO
RT 2
017
0441 TO OUR SHAREHOLDERS 2 GROUP MANAGEMENT REPORT –
OUR COMPANY3 GROUP MANAGEMENT REPORT –
FINANCIAL REVIEW4 CONSOLIDATED FINANCIAL
STATEMENTS5 ADDITIONAL INFORMATION
COMPENSATION REPORT

the LTIP 2018/2020 is directly dependent on the share price performance during the respective, approximately three-year lock-up period and thus dependent on the long-term performance of the company. The Executive Board members are entitled to any amounts distributed in connection with these shares during the lock-up period.
Therefore, taking the annual LTIP tranche for the 2018 financial year as an example, the LTIP 2018/2020 is structured as follows:
— In the 2019 financial year, the degree of target achievement for the 2018 performance year (increase in net income from continuing operations in the 2018 financial year compared to the 2017 financial year) is determined following the adoption of the consolidated financial statements for the 2018 financial year.
— The Grant Amount determined on this basis is paid out to the Executive Board members by the end of March 2019. If the increase in net income from continuing operations is below € 140 million, the Executive Board members do not receive a Grant Amount; if the increase in net income amounts to more than € 280 million, the cap of 150% applies.
— The Grant Amount (reduced by applicable taxes and social security contributions) is then invested into the acquisition of adidas AG shares.
— The Executive Board members may only dispose of these shares upon expiry of the month in which the Annual General Meeting in 2022 takes place (i.e. if the Annual General Meeting takes place in May 2022, the Executive Board members can dispose of the shares as of June 2022).
If an Executive Board member takes or leaves office during a performance year, the Grant Amount for the respective annual tranche of the LTIP 2018/2020 is generally calculated on a pro rata basis. The departed Executive Board member does not participate in the annual LTIP tranches for performance years which begin after the respective Executive Board member’s departure. In certain cases defined in the plan terms of the LTIP 2018/2020, any claims in connection with the LTIP 2018/2020 are generally forfeited and adidas AG shares already purchased, for which the lock-up period has not yet expired, must be transferred to adidas without compensation payments, unless the Supervisory Board determines other-wise at its equitable discretion.
Furthermore, the plan terms of the LTIP 2018/2020 contain malus and claw back provisions which allow the Supervisory Board, under certain circumstances, to reduce at its equitable discretion the compensation from the LTIP 2018/2020 until expiry of the lock-up period (malus) and beyond (claw back). Such circumstances are, in particular, material misstatements, for instance, in the financial reports as well as serious compliance violations.
In all other respects, the details of the previous compensation system also apply to the changed compensation system. The compensation system applicable as of the 2018 financial year will be presented to the 2018 Annual General Meeting for approval.
ADID
AS
ANN
UAL
REPO
RT 2
017
0451 TO OUR SHAREHOLDERS 2 GROUP MANAGEMENT REPORT –
OUR COMPANY3 GROUP MANAGEMENT REPORT –
FINANCIAL REVIEW4 CONSOLIDATED FINANCIAL
STATEMENTS5 ADDITIONAL INFORMATION
COMPENSATION REPORT
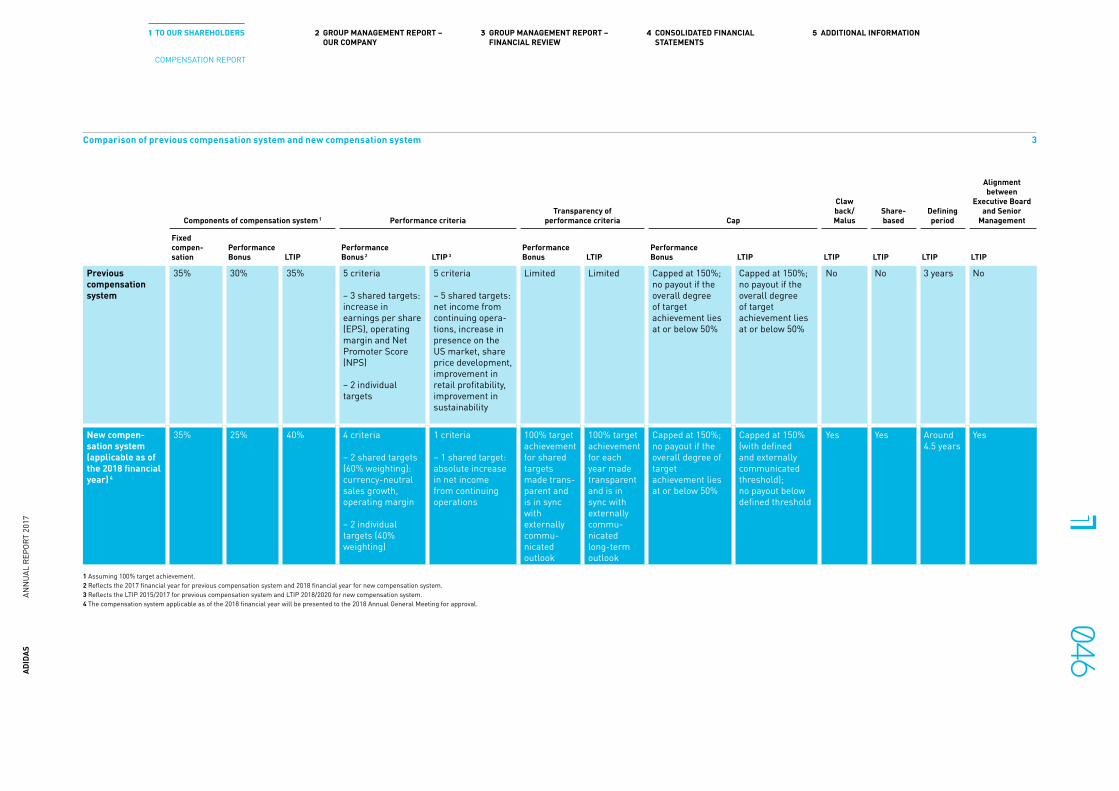
Comparison of previous compensation system and new compensation system 3
Components of compensation system 1 Performance criteriaTransparency of
performance criteria Cap
Claw back/Malus
Share-based
Defining period
Alignmentbetween
Executive Board and Senior
Management
Fixed compen-sation
PerformanceBonus LTIP
PerformanceBonus 2 LTIP 3
PerformanceBonus LTIP
PerformanceBonus LTIP LTIP LTIP LTIP LTIP
Previous compensation system
35% 30% 35% 5 criteria
– 3 shared targets: increase in earnings per share (EPS), operating margin and Net Promoter Score (NPS) – 2 individual targets
5 criteria
– 5 shared targets: net income from continuing opera-tions, increase in presence on the US market, share price development, improvement in retail profitability, improvement in sustainability
Limited Limited Capped at 150%;no payout if the overall degree of targetachievement lies at or below 50%
Capped at 150%;no payout if the overall degree of targetachievement lies at or below 50%
No No 3 years No
New compen-sation system (applicable as of the 2018 financial year) 4
35% 25% 40% 4 criteria
– 2 shared targets (60% weighting): currency-neutral sales growth, operating margin
– 2 individual targets (40% weighting)
1 criteria
– 1 shared target: absolute increase in net income from continuing operations
100% target achievement for shared targets made trans-parent and is in sync with externally commu-nicated outlook
100% target achievement for each year made transparent and is in sync with externally commu-nicated long-term outlook
Capped at 150%;no payout if the overall degree of targetachievement lies at or below 50%
Capped at 150%(with defined and externally communicated threshold);no payout below defined threshold
Yes Yes Around4.5 years
Yes
1 Assuming 100% target achievement.2 Reflects the 2017 financial year for previous compensation system and 2018 financial year for new compensation system. 3 Reflects the LTIP 2015/2017 for previous compensation system and LTIP 2018/2020 for new compensation system. 4 The compensation system applicable as of the 2018 financial year will be presented to the 2018 Annual General Meeting for approval.
ADID
AS
ANN
UAL
REPO
RT 2
017
0461 TO OUR SHAREHOLDERS 2 GROUP MANAGEMENT REPORT –
OUR COMPANY3 GROUP MANAGEMENT REPORT –
FINANCIAL REVIEW4 CONSOLIDATED FINANCIAL
STATEMENTS5 ADDITIONAL INFORMATION
COMPENSATION REPORT
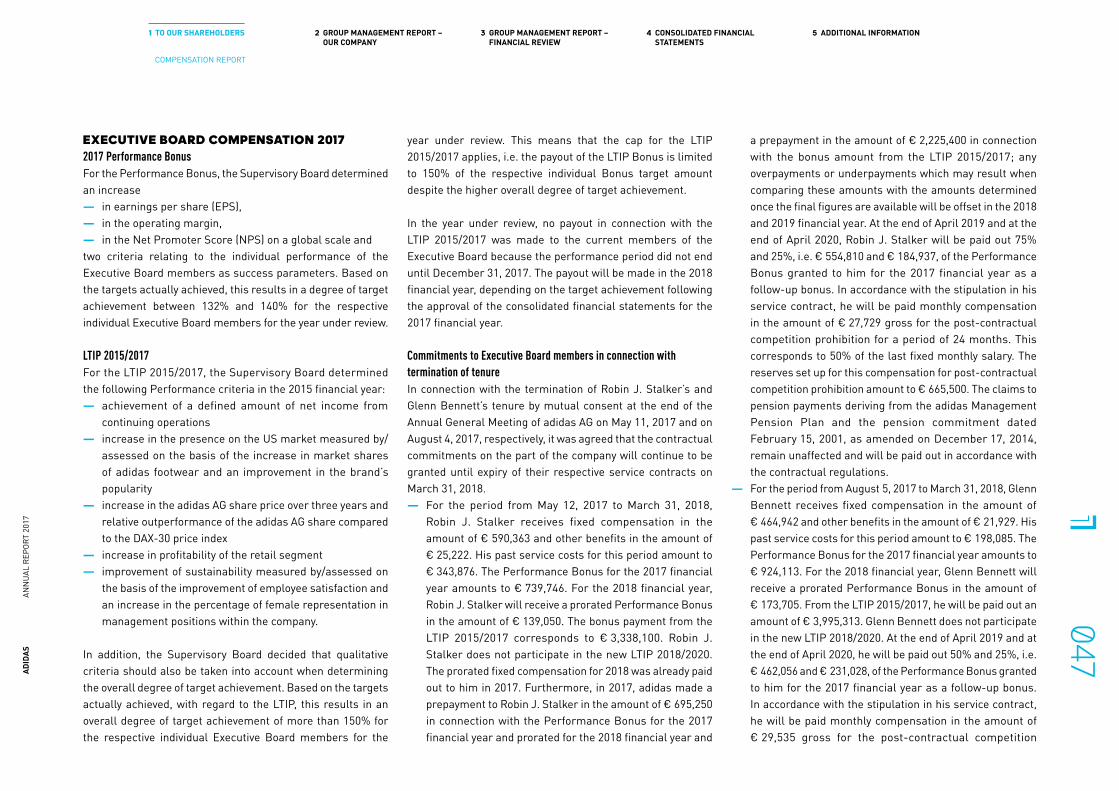
EXECUTIVE BOARD COMPENSATION 20172017 Performance BonusFor the Performance Bonus, the Supervisory Board determined an increase
— in earnings per share (EPS), — in the operating margin, — in the Net Promoter Score (NPS) on a global scale and
two criteria relating to the individual performance of the Executive Board members as success parameters. Based on the targets actually achieved, this results in a degree of target achievement between 132% and 140% for the respective individual Executive Board members for the year under review.
LTIP 2015/2017For the LTIP 2015/2017, the Supervisory Board determined the following Performance criteria in the 2015 financial year:
— achievement of a defined amount of net income from continuing operations
— increase in the presence on the US market measured by/assessed on the basis of the increase in market shares of adidas footwear and an improvement in the brand’s popularity
— increase in the adidas AG share price over three years and relative outperformance of the adidas AG share compared to the DAX-30 price index
— increase in profitability of the retail segment — improvement of sustainability measured by/assessed on
the basis of the improvement of employee satisfaction and an increase in the percentage of female representation in management positions within the company.
In addition, the Supervisory Board decided that qualitative criteria should also be taken into account when determining the overall degree of target achievement. Based on the targets actually achieved, with regard to the LTIP, this results in an overall degree of target achievement of more than 150% for the respective individual Executive Board members for the
year under review. This means that the cap for the LTIP 2015/2017 applies, i.e. the payout of the LTIP Bonus is limited to 150% of the respective individual Bonus target amount despite the higher overall degree of target achievement.
In the year under review, no payout in connection with the LTIP 2015/2017 was made to the current members of the Executive Board because the performance period did not end until December 31, 2017. The payout will be made in the 2018 financial year, depending on the target achievement following the approval of the consolidated financial statements for the 2017 financial year.
Commitments to Executive Board members in connection with termination of tenureIn connection with the termination of Robin J. Stalker’s and Glenn Bennett’s tenure by mutual consent at the end of the Annual General Meeting of adidas AG on May 11, 2017 and on August 4, 2017, respectively, it was agreed that the contractual commitments on the part of the company will continue to be granted until expiry of their respective service contracts on March 31, 2018.
— For the period from May 12, 2017 to March 31, 2018, Robin J. Stalker receives fixed compensation in the amount of € 590,363 and other benefits in the amount of € 25,222. His past service costs for this period amount to € 343,876. The Performance Bonus for the 2017 financial year amounts to € 739,746. For the 2018 financial year, Robin J. Stalker will receive a prorated Performance Bonus in the amount of € 139,050. The bonus payment from the LTIP 2015/2017 corresponds to € 3,338,100. Robin J. Stalker does not participate in the new LTIP 2018/2020. The prorated fixed compensation for 2018 was already paid out to him in 2017. Furthermore, in 2017, adidas made a prepayment to Robin J. Stalker in the amount of € 695,250 in connection with the Performance Bonus for the 2017 financial year and prorated for the 2018 financial year and
a prepayment in the amount of € 2,225,400 in connection with the bonus amount from the LTIP 2015/2017; any overpayments or underpayments which may result when comparing these amounts with the amounts determined once the final figures are available will be offset in the 2018 and 2019 financial year. At the end of April 2019 and at the end of April 2020, Robin J. Stalker will be paid out 75% and 25%, i.e. € 554,810 and € 184,937, of the Performance Bonus granted to him for the 2017 financial year as a follow-up bonus. In accordance with the stipulation in his service contract, he will be paid monthly compensation in the amount of € 27,729 gross for the post-contractual competition prohibition for a period of 24 months. This corresponds to 50% of the last fixed monthly salary. The reserves set up for this compensation for post-contractual competition prohibition amount to € 665,500. The claims to pension payments deriving from the adidas Management Pension Plan and the pension commitment dated February 15, 2001, as amended on December 17, 2014, remain unaffected and will be paid out in accordance with the contractual regulations.
— For the period from August 5, 2017 to March 31, 2018, Glenn Bennett receives fixed compensation in the amount of € 464,942 and other benefits in the amount of € 21,929. His past service costs for this period amount to € 198,085. The Performance Bonus for the 2017 financial year amounts to € 924,113. For the 2018 financial year, Glenn Bennett will receive a prorated Performance Bonus in the amount of € 173,705. From the LTIP 2015/2017, he will be paid out an amount of € 3,995,313. Glenn Bennett does not participate in the new LTIP 2018/2020. At the end of April 2019 and at the end of April 2020, he will be paid out 50% and 25%, i.e. € 462,056 and € 231,028, of the Performance Bonus granted to him for the 2017 financial year as a follow-up bonus. In accordance with the stipulation in his service contract, he will be paid monthly compensation in the amount of € 29,535 gross for the post-contractual competition
ADID
AS
ANN
UAL
REPO
RT 2
017
0471 TO OUR SHAREHOLDERS 2 GROUP MANAGEMENT REPORT –
OUR COMPANY3 GROUP MANAGEMENT REPORT –
FINANCIAL REVIEW4 CONSOLIDATED FINANCIAL
STATEMENTS5 ADDITIONAL INFORMATION
COMPENSATION REPORT
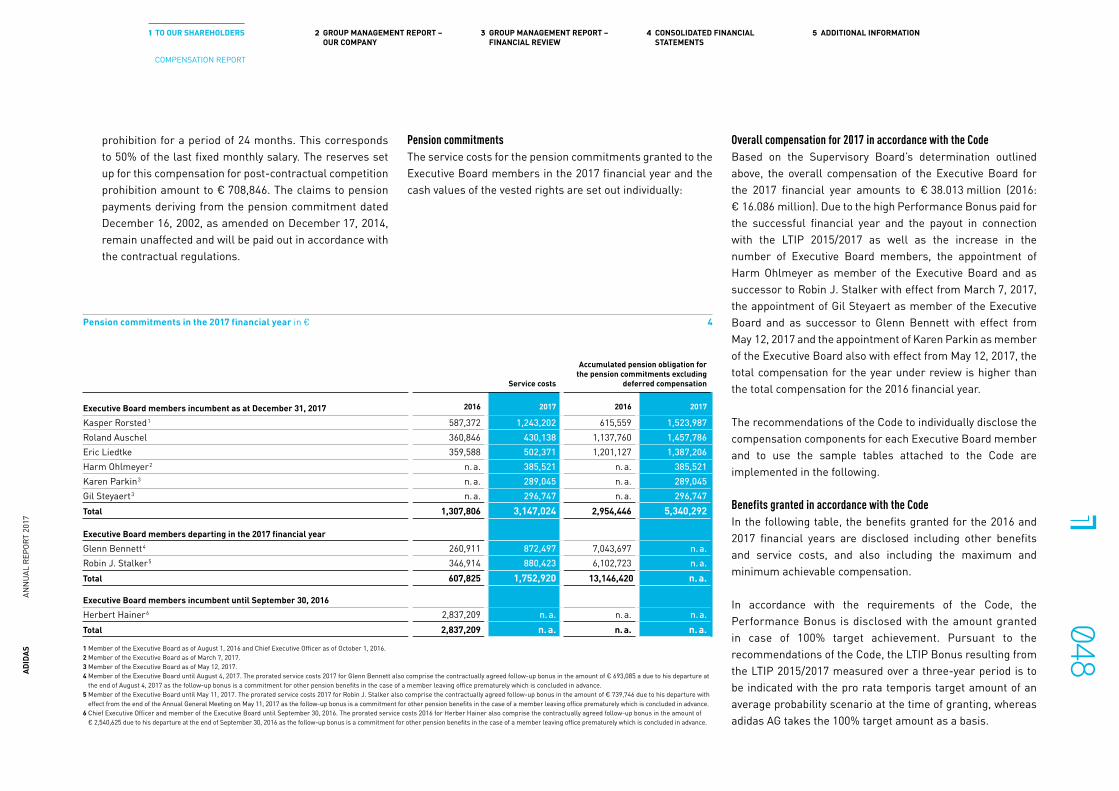
prohibition for a period of 24 months. This corresponds to 50% of the last fixed monthly salary. The reserves set up for this compensation for post-contractual competition prohibition amount to € 708,846. The claims to pension payments deriving from the pension commitment dated December 16, 2002, as amended on December 17, 2014, remain unaffected and will be paid out in accordance with the contractual regulations.
Pension commitmentsThe service costs for the pension commitments granted to the Executive Board members in the 2017 financial year and the cash values of the vested rights are set out individually:
Overall compensation for 2017 in accordance with the CodeBased on the Supervisory Board’s determination outlined above, the overall compensation of the Executive Board for the 2017 financial year amounts to € 38.013 million (2016: € 16.086 million). Due to the high Performance Bonus paid for the successful financial year and the payout in connection with the LTIP 2015/2017 as well as the increase in the number of Executive Board members, the appointment of Harm Ohlmeyer as member of the Executive Board and as successor to Robin J. Stalker with effect from March 7, 2017, the appointment of Gil Steyaert as member of the Executive Board and as successor to Glenn Bennett with effect from May 12, 2017 and the appointment of Karen Parkin as member of the Executive Board also with effect from May 12, 2017, the total compensation for the year under review is higher than the total compensation for the 2016 financial year.
The recommendations of the Code to individually disclose the compensation components for each Executive Board member and to use the sample tables attached to the Code are implemented in the following.
Benefits granted in accordance with the CodeIn the following table, the benefits granted for the 2016 and 2017 financial years are disclosed including other benefits and service costs, and also including the maximum and minimum achievable compensation.
In accordance with the requirements of the Code, the Performance Bonus is disclosed with the amount granted in case of 100% target achievement. Pursuant to the recommendations of the Code, the LTIP Bonus resulting from the LTIP 2015/2017 measured over a three-year period is to be indicated with the pro rata temporis target amount of an average probability scenario at the time of granting, whereas adidas AG takes the 100% target amount as a basis.
Pension commitments in the 2017 financial year in € 4
Service costs
Accumulated pension obligation for the pension commitments excluding
deferred compensation
Executive Board members incumbent as at December 31, 2017 2016 2017 2016 2017
Kasper Rorsted 1 587,372 1,243,202 615,559 1,523,987 Roland Auschel 360,846 430,138 1,137,760 1,457,786 Eric Liedtke 359,588 502,371 1,201,127 1,387,206 Harm Ohlmeyer 2 n. a. 385,521 n. a. 385,521 Karen Parkin 3 n. a. 289,045 n. a. 289,045 Gil Steyaert 3 n. a. 296,747 n. a. 296,747 Total 1,307,806 3,147,024 2,954,446 5,340,292
Executive Board members departing in the 2017 financial yearGlenn Bennett 4 260,911 872,497 7,043,697 n. a. Robin J. Stalker 5 346,914 880,423 6,102,723 n. a. Total 607,825 1,752,920 13,146,420 n. a.
Executive Board members incumbent until September 30, 2016Herbert Hainer 6 2,837,209 n. a. n. a. n. a. Total 2,837,209 n. a. n. a. n. a.
1 Member of the Executive Board as of August 1, 2016 and Chief Executive Officer as of October 1, 2016. 2 Member of the Executive Board as of March 7, 2017.3 Member of the Executive Board as of May 12, 2017.4 Member of the Executive Board until August 4, 2017. The prorated service costs 2017 for Glenn Bennett also comprise the contractually agreed follow-up bonus in the amount of € 693,085 a due to his departure at
the end of August 4, 2017 as the follow-up bonus is a commitment for other pension benefits in the case of a member leaving office prematurely which is concluded in advance.5 Member of the Executive Board until May 11, 2017. The prorated service costs 2017 for Robin J. Stalker also comprise the contractually agreed follow-up bonus in the amount of € 739,746 due to his departure with
effect from the end of the Annual General Meeting on May 11, 2017 as the follow-up bonus is a commitment for other pension benefits in the case of a member leaving office prematurely which is concluded in advance. 6 Chief Executive Officer and member of the Executive Board until September 30, 2016. The prorated service costs 2016 for Herber Hainer also comprise the contractually agreed follow-up bonus in the amount of
€ 2,540,625 due to his departure at the end of September 30, 2016 as the follow-up bonus is a commitment for other pension benefits in the case of a member leaving office prematurely which is concluded in advance.
ADID
AS
ANN
UAL
REPO
RT 2
017
0481 TO OUR SHAREHOLDERS 2 GROUP MANAGEMENT REPORT –
OUR COMPANY3 GROUP MANAGEMENT REPORT –
FINANCIAL REVIEW4 CONSOLIDATED FINANCIAL
STATEMENTS5 ADDITIONAL INFORMATION
COMPENSATION REPORT

Benefits granted in € 5
Kasper RorstedExecutive Board member, Chief Executive Officer
since August 1, 2016 and October 1, 2016, respectivelyRoland Auschel
Executive Board member, Global Sales
2016 2017 2017 (min.) 2017 (max.) 2016 2017 2017 (min.) 2017 (max.)
Fixed compensation 833,333 2,000,000 2,000,000 2,000,000 650,000 750,000 750,000 750,000Other benefits 18,800 452 452 452 17,943 17,943 17,943 17,943Total 852,133 2,000,452 2,000,452 2,000,452 667,943 767,943 767,943 767,943One-year variable compensation 1, 2 625,000 1,714,286 0 2,571,429 557,000 642,857 0 964,286Multi-year variable compensation 833,333 2,000,000 0 3,000,000 616,667 750,000 0 1,125,000
LTIP 2015/2017 3, 4 833,333 2,000,000 0 3,000,000 616,667 750,000 0 1,125,000Total 2,310,466 5,714,738 2,000,452 7,571,881 1,841,609 2,160,800 767,943 2,857,228Service costs 5, 6 587,372 1,243,202 1,243,202 1,243,202 360,846 430,138 430,138 430,138Overall compensation 2,897,838 6,957,940 3,243,654 8,815,083 2,202,455 2,590,938 1,198,081 3,287,366
Eric LiedtkeExecutive Board member, Global Brands
Harm OhlmeyerExecutive Board member, Chief Financial Officer
since March 7, 2017 and since the end of the Annual General Meeting on May 11, 2017, respectively
2016 2017 2017 (min.) 2017 (max.) 2016 2017 2017 (min.) 2017 (max.)
Fixed compensation 650,000 820,000 820,000 820,000 n. a. 561,603 561,603 561,603Other benefits 13,396 12,575 12,575 12,575 n. a. 14,650 14,650 14,650Total 663,396 832,575 832,575 832,575 n. a. 576,254 576,254 576,254One-year variable compensation 1, 2 557,000 702,857 0 1,054,286 n. a. 481,374 0 722,061Multi-year variable compensation 616,667 820,000 0 1,230,000 n. a. 561,603 0 842,405
LTIP 2015/2017 3, 4 616,667 820,000 0 1,230,000 n. a. 561,603 0 842,405Total 1,837,062 2,355,432 832,575 3,116,861 n. a. 1,619,231 576,254 2,140,720Service costs 5, 6 359,588 502,371 502,371 502,371 n. a. 385,521 385,521 385,521Overall compensation 2,196,650 2,857,803 1,334,946 3,619,232 n. a. 2,004,752 961,775 2,526,241
ADID
AS
ANN
UAL
REPO
RT 2
017
0491 TO OUR SHAREHOLDERS 2 GROUP MANAGEMENT REPORT –
OUR COMPANY3 GROUP MANAGEMENT REPORT –
FINANCIAL REVIEW4 CONSOLIDATED FINANCIAL
STATEMENTS5 ADDITIONAL INFORMATION
COMPENSATION REPORT

Benefits granted in € 5
Karen ParkinExecutive Board member, Global Human Resources
since May 12, 2017
Gil SteyaertExecutive Board member, Global Operations
since May 12, 2017 and August 5, 2017, respectively
2016 2017 2017 (min.) 2017 (max.) 2016 2017 2017 (min.) 2017 (max.)
Fixed compensation n. a. 437,829 437,829 437,829 n. a. 437,829 437,829 437,829Other benefits n. a. 14,070 14,070 14,070 n. a. 8,590 8,590 8,590Total n. a. 451,899 451,899 451,899 n. a. 446,419 446,419 446,419One-year variable compensation 1, 2 n. a. 375,282 0 562,923 n. a. 375,282 0 562,923Multi-year variable compensation n. a. 437,829 0 656,743 n. a. 437,829 0 656,743
LTIP 2015/2017 3, 4 n. a. 437,829 0 656,743 n. a. 437,829 0 656,743Total n. a. 1,265,010 451,899 1,671,565 n. a. 1,259,529 446,419 1,666,085Service costs 5, 6 n. a. 289,045 289,045 289,045 n. a. 296,747 296,747 296,747Overall compensation n. a. 1,554,055 740,944 1,960,610 n. a. 1,556,276 743,166 1,962,832
Herbert HainerChief Executive Officer
until September 30, 2016
Glenn BennettExecutive Board member, Global Operations
until August 4, 2017
2016 2017 2017 (min.) 2017 (max.) 2016 7 2017 8, 9 2017 (min.) 2017 (max.)
Fixed compensation 1,200,000 n. a. n. a. n. a. 721,474 421,115 421,115 421,115Other benefits 26,917 n. a. n. a. n. a. 35,056 19,862 19,862 19,862Total 1,226,917 n. a. n. a. n. a. 756,531 440,977 440,977 440,977One-year variable compensation 1, 2 1,355,000 n. a. n. a. n. a. 686,602 694,822 0 1,042,233Multi-year variable compensation 1,694,000 n. a. n. a. n. a. 903,665 887,847 0 1,331,771
LTIP 2015/2017 3, 4 1,694,000 n. a. n. a. n. a. 903,665 887,847 0 1,331,771Total 4,275,917 n. a. n. a. n. a. 2,346,798 2,023,647 440,977 2,814,981Service costs 5, 6 2,837,209 n. a. n. a. n. a. 260,911 872,497 872,497 872,497Overall compensation 7,113,126 n. a. n. a. n. a. 2,607,709 2,896,144 1,313,475 3,687,479
ADID
AS
ANN
UAL
REPO
RT 2
017
0501 TO OUR SHAREHOLDERS 2 GROUP MANAGEMENT REPORT –
OUR COMPANY3 GROUP MANAGEMENT REPORT –
FINANCIAL REVIEW4 CONSOLIDATED FINANCIAL
STATEMENTS5 ADDITIONAL INFORMATION
COMPENSATION REPORT

Benefits granted in € 5
Robin J. StalkerChief Financial Officer
until the end of the Annual General Meeting on May 11, 2017
2016 2017 10 2017 (min.) 2017 (max.)
Fixed compensation 665,500 241,512 241,512 241,512Other benefits 20,018 7,265 7,265 7,265Total 685,518 248,777 248,777 248,777One-year variable compensation 1, 2 540,000 556,200 0 834,300Multi-year variable compensation 741,800 741,800 0 1,112,700
LTIP 2015/2017 3, 4 741,800 741,800 0 1,112,700Total 1,967,318 1,546,777 248,777 2,195,777Service costs 5, 6 346,914 880,423 880,423 880,423Overall compensation 2,314,232 2,427,199 1,129,199 3,076,199
1 Contractually agreed Performance Bonus target amount 2016 for Kasper Rorsted due to his intra-year appointment to the Executive Board with effect from August 1, 2016. Contractually agreed Performance Bonus target amount 2016 due to the termination of Herbert Hainer’s Executive Board mandate (with effect from the end of September 30, 2016) during the plan term.
2 Contractually agreed Performance Bonus target amount 2017 due to the intra-year appointment of Harm Ohlmeyer (with effect from March 7, 2017), Karen Parkin (with effect from May 12, 2017) and Gil Steyaert (with effect from May 12, 2017) to the Executive Board. Contractually agreed Performance Bonus target amount 2017 due to the termination of the Executive Board mandates of Robin J. Stalker (with effect from the end of the Annual General Meeting on May 11, 2017) and Glenn Bennett (with effect from the end of August 4, 2017) during the plan term.
3 Contractually agreed LTIP Bonus target amount 2015/2017 due to the appointment of Kasper Rorsted (with effect from August 1, 2016) , Harm Ohlmeyer (with effect from March 7, 2017), Karen Parkin (with effect from May 12, 2017) and Gil Steyaert (with effect from May 12, 2017) to the Executive Board during the plan term.4 Contractually agreed LTIP Bonus target amount 2015/2017 due to the termination of the Executive Board mandates of Herbert Hainer (with effect from the end of September 30, 2016), Robin J. Stalker (with effect from the end of the Annual General Meeting on May 11, 2017) and Glenn Bennett (with effect from the end of
August 4, 2017) during the plan term.5 Service costs 2016 stated pro rata temporis due to the intra-year termination of Herbert Hainer’s Executive Board mandate with effect from the end of September 30, 2016. The service costs 2016 for Herbert Hainer also comprise the contractually agreed follow-up bonus in the amount of € 2,540,625 due to his departure
with effect from the end of September 30, 2016 as the follow-up bonus is a commitment for other pension benefits in the case of a member leaving office prematurely which is concluded in advance.6 Service costs 2017 stated pro rata temporis due to the intra-year termination of the Executive Board mandates of Robin J. Stalker (with effect from the end of the Annual General Meeting on May 11, 2017) and Glenn Bennett (with effect from the end of August 4, 2017). The service costs 2017 for Robin J. Stalker and Glenn
Bennett also comprise the contractually agreed follow-up bonus (Robin J. Stalker: in the amount of € 739,746 , Glenn Bennett: in the amount of € 693,085 ) due to the intra-year departures as the follow-up bonus is a commitment for other pension benefits in the case of a member leaving office prematurely which is concluded in advance.
7 Exchange rate 1.10690 $/€ (annual average rate 2016).8 Exchange rate 1.12662 $/€ annual average rate 2017).9 Executive Board compensation stated pro rata temporis due to the intra-year termination of Glenn Bennett’s Executive Board mandate at the end of August 4, 2017. Glenn Bennett’s service contract terminates with effect from March 31, 2018. The variable compensation components (Performance Bonus and LTI) granted
for the 2017 financial year were already fully earned by Glenn Bennett during his term of office as Executive Board member. In addition to the overall compensation set out, Glenn Bennett received the following compensation for the period from August 5, 2017 to December 31, 2017: fixed compensation in the amount of € 287,730 and other benefits in the amount of € 13,571. This compensation and the service costs for the period from August 5, 2017 to December 31, 2017 in the amount of € 122,585 are set out in the Compensation Report as part of the overall payments to former members of the Executive Board.
10 Executive Board compensation stated pro rata temporis due to the intra-year termination of Robin J. Stalker’s Executive Board mandate with effect from the end of the Annual General Meeting on May 11, 2017. Robin J. Stalker’s service contract terminates with effect from March 31, 2018. The variable compensation components (Performance Bonus and LTI) granted for the 2017 financial year were already fully earned by Robin J. Stalker during his term of office as Executive Board member. In addition to the overall compensation set out, Robin J. Stalker received the following compensation for the period from May 12, 2017 to December 31, 2017: fixed compensation in the amount of € 423,988 and other benefits in the amount of € 18,725. This compensation and the service costs for the period from May 12, 2017 to December 31, 2017 in the amount of € 246,965 are set out in the Compensation Report as part of the overall payments to former members of the Executive Board.
ADID
AS
ANN
UAL
REPO
RT 2
017
0511 TO OUR SHAREHOLDERS 2 GROUP MANAGEMENT REPORT –
OUR COMPANY3 GROUP MANAGEMENT REPORT –
FINANCIAL REVIEW4 CONSOLIDATED FINANCIAL
STATEMENTS5 ADDITIONAL INFORMATION
COMPENSATION REPORT
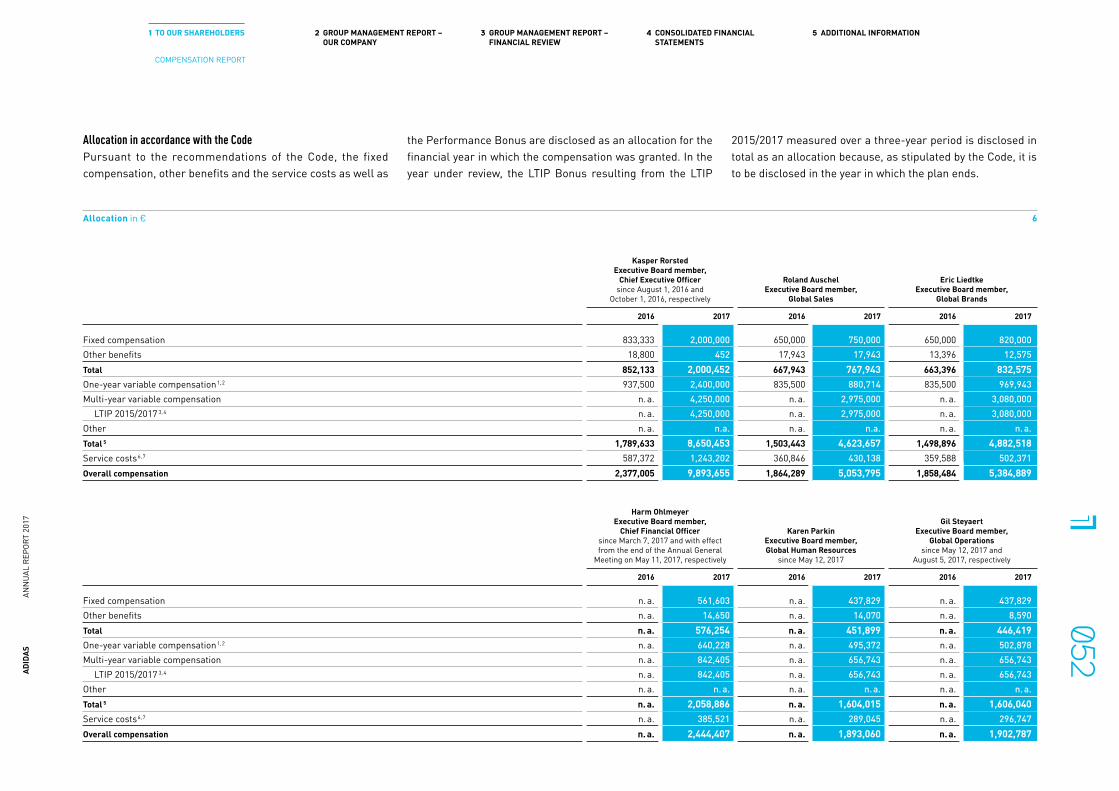
Allocation in accordance with the CodePursuant to the recommendations of the Code, the fixed com pensation, other benefits and the service costs as well as
the Performance Bonus are disclosed as an allocation for the financial year in which the compensation was granted. In the year under review, the LTIP Bonus resulting from the LTIP
2015/2017 measured over a three-year period is disclosed in total as an allocation because, as stipulated by the Code, it is to be disclosed in the year in which the plan ends.
Allocation in € 6
Kasper RorstedExecutive Board member,
Chief Executive Officersince August 1, 2016 and
October 1, 2016, respectively
Roland AuschelExecutive Board member,
Global Sales
Eric Liedtke Executive Board member,
Global Brands
2016 2017 2016 2017 2016 2017
Fixed compensation 833,333 2,000,000 650,000 750,000 650,000 820,000Other benefits 18,800 452 17,943 17,943 13,396 12,575Total 852,133 2,000,452 667,943 767,943 663,396 832,575One-year variable compensation 1, 2 937,500 2,400,000 835,500 880,714 835,500 969,943Multi-year variable compensation n. a. 4,250,000 n. a. 2,975,000 n. a. 3,080,000
LTIP 2015/2017 3, 4 n. a. 4,250,000 n. a. 2,975,000 n. a. 3,080,000Other n. a. n.a. n. a. n.a. n. a. n. a.Total 5 1,789,633 8,650,453 1,503,443 4,623,657 1,498,896 4,882,518Service costs 6, 7 587,372 1,243,202 360,846 430,138 359,588 502,371Overall compensation 2,377,005 9,893,655 1,864,289 5,053,795 1,858,484 5,384,889
Harm OhlmeyerExecutive Board member,
Chief Financial Officersince March 7, 2017 and with effect from the end of the Annual General
Meeting on May 11, 2017, respectively
Karen ParkinExecutive Board member, Global Human Resources
since May 12, 2017
Gil Steyaert Executive Board member,
Global Operationssince May 12, 2017 and
August 5, 2017, respectively
2016 2017 2016 2017 2016 2017
Fixed compensation n. a. 561,603 n. a. 437,829 n. a. 437,829Other benefits n. a. 14,650 n. a. 14,070 n. a. 8,590Total n. a. 576,254 n. a. 451,899 n. a. 446,419One-year variable compensation 1, 2 n. a. 640,228 n. a. 495,372 n. a. 502,878Multi-year variable compensation n. a. 842,405 n. a. 656,743 n. a. 656,743
LTIP 2015/2017 3, 4 n. a. 842,405 n. a. 656,743 n. a. 656,743Other n. a. n. a. n. a. n. a. n. a. n. a.Total 5 n. a. 2,058,886 n. a. 1,604,015 n. a. 1,606,040Service costs 6, 7 n. a. 385,521 n. a. 289,045 n. a. 296,747Overall compensation n. a. 2,444,407 n. a. 1,893,060 n. a. 1,902,787
ADID
AS
ANN
UAL
REPO
RT 2
017
0521 TO OUR SHAREHOLDERS 2 GROUP MANAGEMENT REPORT –
OUR COMPANY3 GROUP MANAGEMENT REPORT –
FINANCIAL REVIEW4 CONSOLIDATED FINANCIAL
STATEMENTS5 ADDITIONAL INFORMATION
COMPENSATION REPORT

Allocation in € 6
Herbert HainerChief Executive Officer
until September 30, 2016
Glenn BennettExecutive Board member,
Global Operationsuntil August 4, 2017
Robin J. Stalker Chief Financial Officer
until the end of the Annual General Meeting on May 11, 2017
2016 2017 8 2016 9 2017 10, 11 2016 2017 12
Fixed compensation 1,200,000 n. a. 721,474 421,115 665,500 241,512Other benefits 26,917 n. a. 35,056 19,862 20,018 7,265Total 1,226,917 n. a. 756,531 440,977 685,518 248,777One-year variable compensation 1, 2 2,032,500 n. a. 1,029,903 924,113 810,000 739,746Multi-year variable compensation n. a. n. a. n. a. 3,995,313 n. a. 3,338,100
LTIP 2015/2017 3, 4 n. a. n. a. n. a. 3,995,313 n. a. 3,338,100Other n. a. n. a. n. a. n. a. n. a. n. a.Total 5 3,259,417 n. a. 1,786,434 5,360,404 1,495,518 4,326,623Service costs 6, 7 2,837,209 n. a. 260,911 872,497 346,914 880,423Overall compensation 6,096,626 n. a. 2,047,345 6,232,901 1,842,432 5,207,045
1 Contractually agreed Performance Bonus target amount 2016 for Kasper Rorsted due to his intra-year appointment to the Executive Board with effect from August 1, 2016. Contractually agreed Performance Bonus target amount 2016 due to the termination of Herbert Hainer’s Executive Board mandate (with effect from the end of September 30, 2017) during the plan term.
2 Contractually agreed Performance Bonus target amount 2017 due to the intra-year appointments of Harm Ohlmeyer (with effect from March 7, 2017), Karen Parkin (with effect from May 12, 2017) and Gil Steyaert (with effect from May 12, 2017) to the Executive Board. Contractually agreed Performance Bonus target amount 2017 due to the termination of Robin J. Stalker’s (with effect from the end of the Annual General Meeting on May 11, 2017) and Glenn Bennett’s (with effect from the end of August 4, 2017) Executive Board mandates during the plan term.
3 Contractually agreed LTIP Bonus target amount 2015/2017 due to the appointment of Kasper Rorsted (with effect from August 1, 2016) , Harm Ohlmeyer (with effect from March 7, 2017), Karen Parkin (with effect from May, 12 2017) and Gil Steyaert (with effect from May 12, 2017) to the Executive Board during the plan term.4 Contractually agreed LTIP Bonus target amount 2015/2017 due to the termination of the Executive Board mandates of Robin J. Stalker (with effect from the end of the Annual General Meeting on May 11, 2017) and Glenn Bennett (with effect from August 4, 2017) during the plan term.5 The compensation components set out above constitute the overall compensation both for the 2017 financial year and for the previous year, which have to be set out individually in accordance with German Commercial Law.6 Service costs stated pro rata temporis due to the intra-year termination of Herbert Hainer’s Executive Board mandate with effect from the end of September 30, 2016. The service costs 2016 for Herbert Hainer also comprise the contractually agreed follow-up bonus in the amount of € 2,540,625 due to his departure with
effect from the end of September 30, 2016 as the follow-up bonus is a commitment for other pension benefits in the case of a member leaving office prematurely which is concluded in advance.7 Service costs stated pro rata temporis due to the intra-year termination of the Executive Board mandates of Robin J. Stalker (with effect from the end of the Annual General Meeting on May 11, 2017) and Glenn Bennett (with effect from the end of August 4, 2017). The service costs 2017 for Robin J. Stalker and Glenn
Bennett also comprise the contractually agreed follow-up bonuses (Robin J. Stalker: in the amount of € 739,746, Glenn Bennett: in the amount of € 693,085) due to their intra-year departures as the follow-up bonus is a commitment for other pension benefits in the case of a member leaving office prematurely which is concluded in advance.
8 In addition to the overall compensation stated, Herbert Hainer received an LTIP Bonus 2015/2017 in the amount of € 5,082,000. This compensation is set out in the Compensation Report as part of the overall payments to former members of the Executive Board. 9 Exchange rate 1.10690 $/€ (annual average rate 2016).10 Exchange rate 1.12662 $/€ (annual average rate 2017).11 Executive Board compensation stated pro rata temporis due to the intra-year termination of Glenn Bennett’s Executive Board mandate at the end of August 4, 2017. Glenn Bennett’s service contract terminates with effect from March 31, 2018. The variable compensation components (Performance Bonus and LTI) granted
for the 2017 financial year were already fully earned by Glenn Bennett during his term of office as Executive Board member. In addition to the overall compensation set out, Glenn Bennett received the following compensation for the period from August 5, 2017 to December 31, 2017: fixed compensation in the amount of € 287,730 and other benefits in the amount of € 13,571. This compensation and the service costs for the period from August 5, 2017 to December 31, 2017 in the amount of € 122,585 are set out in the Compensation Report as part of the overall payments to former members of the Executive Board.
12 Executive Board compensation stated pro rata temporis due to intra-year termination of Robin J. Stalker’s Executive Board mandate with effect from the end of the Annual General Meeting on May 11, 2017. Robin J. Stalker’s service contract terminates with effect from March 31, 2018. The variable compensation components (Performance Bonus and LTI) granted for the 2017 financial year were already fully earned by Robin J. Stalker during his term of office as Executive Board member. In addition to the overall compensation set out, Robin J. Stalker received the following compensation for the period from May 12, 2017 to December 31, 2017: fixed compensation in the amount of € 423,988 and other benefits in the amount of € 18,725. This compensation and the service costs for the period from May 12, 2017 to December 31, 2017 in the amount of € 246,965 are set out in the Compensation Report as part of the overall payments to former members of the Executive Board.
ADID
AS
ANN
UAL
REPO
RT 2
017
0531 TO OUR SHAREHOLDERS 2 GROUP MANAGEMENT REPORT –
OUR COMPANY3 GROUP MANAGEMENT REPORT –
FINANCIAL REVIEW4 CONSOLIDATED FINANCIAL
STATEMENTS5 ADDITIONAL INFORMATION
COMPENSATION REPORT

Overall payments to former members of the Executive Board and their surviving dependentsIn the 2017 financial year, overall payments to former members of the Executive Board and their surviving dependents amounted to € 13.520 million (2016: € 8.754 million). The increase is attributable, on the one hand, to the inclusion of the bonus paid to Herbert Hainer in connection with the LTIP 2015/2017 in the overall payments for 2017. On the other, the increase is attributable, in particular, also to the inclusion of the compensation and the service costs for Robin J. Stalker for the period from May 12, 2017 to March 31, 2018 and for Glenn Bennett for the period from August 5, 2017 to March 31, 2018 as well as the compensation for the post-contractual competition prohibition and the follow-up bonus in connection with the termination of their Executive Board mandates in the overall payments. For details, see the section ‘Commitments to Executive Board members in connection with termination of tenure’. SEE PAGE 47
Provisions for pension entitlements for the former members of the Executive Board who resigned on or before December 31, 2005 and their surviving dependents were created, amounting to € 44.587 million (2016: € 45.821 million) in total as at December 31, 2017.
There are pension commitments toward six former Executive Board members who resigned after December 31, 2005, which are covered by a pension fund or a pension fund in combination with a reinsured pension trust fund. From this, indirect obligations amounting to € 40.106 million (2016: € 29.472 million) arise for adidas AG, for which no accruals were established due to financing through the pension fund and pension trust fund. This increase is attributable, in particular, to the resignation of Robin J. Stalker and Glenn Bennett.
The dynamization of the pensions paid to former Executive Board members is effected in accordance with statutory regulations or regulations under collective agreements, unless a surplus from the pension fund is used for an increase in pension benefits after pension payments have already begun.
Review of Executive Board compensationIn the 2017 financial year, the Supervisory Board had the Executive Board compensation system reviewed with regard to appropriateness by an independent external compensation expert. In doing so, the overall annual target compensation of the individual Executive Board members and the structure of the Executive Board compensation were examined in detail. This review found that while the compensation meets the requirements of the German Stock Corporation Act and the Code, it could be aligned even more closely with customary market levels. Against this background, the Supervisory Board resolved in December 2017 to increase the compen-sation of Roland Auschel and Eric Liedtke with effect from January 1, 2018.
MiscellaneousThe Executive Board members do not receive any additional compensation for mandates within adidas. The Executive Board members have not received any loans and advance payments from adidas AG; due to his departure from the Executive Board, prepayments were made to Robin J. Stalker with regard to the 2017 Performance Bonus and prorated for 2018 as well as with regard to the LTIP 2015/2017. SEE PAGE 47
COMPENSATION OF THE SUPERVISORY BOARD MEMBERS
COMPENSATION SYSTEMIn accordance with § 18 of adidas AG’s Articles of Association, the compensation of the Supervisory Board members consists of two components: fixed compensation and additional compensation for membership in committees. The Supervisory Board members are not granted variable compensation. Furthermore, the Supervisory Board members receive attendance fees and are reimbursed for expenses they incur.
Fixed compensation for Supervisory Board functionEach member receives fixed compensation which is paid following the end of the respective financial year. The Chairman of the Supervisory Board and his deputies receive higher fixed compensation.
Member ChairmanDeputy Chairman/
Chairwoman
General calculation
Amount deter-mined by the
Annual General Meeting (base
amount)
300% of the base amount
200% of the base amount
Amount until June 30, 2017 (based on full year)
€ 50,000 € 150,000 € 100,000
Amount from July 1, 2017 (based on full year)
€ 80,000 € 240,000 € 160,000
ADID
AS
ANN
UAL
REPO
RT 2
017
0541 TO OUR SHAREHOLDERS 2 GROUP MANAGEMENT REPORT –
OUR COMPANY3 GROUP MANAGEMENT REPORT –
FINANCIAL REVIEW4 CONSOLIDATED FINANCIAL
STATEMENTS5 ADDITIONAL INFORMATION
COMPENSATION REPORT

Additional compensation for membership in committeesFurthermore, the Supervisory Board members receive additional compensation for membership in certain committees; in this regard, too, compensation is increased if the chairmanship of a committee is assumed. In accordance with § 18 of the Articles of Association, the amount of the respective additional compensation is based on the fixed compensation (base amount) determined for the Supervisory Board members by the Annual General Meeting and depends on the tasks and responsibilities connected with the respective committee membership.
General Committee and Finance and Investment
Committee Audit Committee
Member Chairman Member Chairman
General calculation (in % of the base amount)
50% 100% 100% 150%200% since July 1, 2017
Amount until June 30, 2017 (based on full year)
€ 25,000 € 50,000 € 50,000 € 75,000
Amount from July 1, 2017 (based on full year)
€ 40,000 € 80,000 € 80,000 € 160,000
The compensation paid for a committee chairmanship also covers the membership in such committee. The members of the Steering Committee, the Mediation Committee, the Nomination Committee and committees which are established ad hoc do not receive additional compensation. If a Supervisory Board member is a member of more than one committee, the member only receives compensation for his task in the committee with the highest compensation.
Reduced fixed compensation and additional compensation in case of membership for only part of financial yearIf a member belongs to the Supervisory Board or a committee for only part of a financial year, the fixed compensation and additional compensation are reduced accordingly on a pro rata temporis basis.
Attendance feesFurthermore, for meetings requiring personal attendance, an attendance fee is granted. Until June 30, 2017, the at-tendance fee amounted to € 750 and since July 1, 2017 it amounts to € 1,000.
ExpensesThe Supervisory Board members are reimbursed for necessary expenses and travel expenses incurred in connection with their mandates as well as for the VAT payable on their compensation, insofar as they charge for it separately.
SUPERVISORY BOARD COMPENSATION 2017Fixed compensation and attendance feesThe total compensation paid to our Supervisory Board in the 2017 financial year amounted to € 1.78 million (2016: € 1.26 million). In addition, attendance fees totaling € 126,750 (2016: € 70,500) were paid. The increase in the total compensation for the 2017 financial year compared to the 2016 financial year is attributable, in particular, to the fact that the Annual General Meeting on May 11, 2017 approved the amendment to the Articles of Association regarding the adjustment of the Supervisory Board compensation with effect from July 1, 2017. Moreover, as the Annual General Meeting on May 12, 2016 resolved to enlarge the Supervisory Board by four members, 2017 was the first full financial year during which the Supervisory Board was composed of 16 members.
MiscellaneousThe Supervisory Board members have not received any loans or advance payments from adidas AG.
ADID
AS
ANN
UAL
REPO
RT 2
017
0551 TO OUR SHAREHOLDERS 2 GROUP MANAGEMENT REPORT –
OUR COMPANY3 GROUP MANAGEMENT REPORT –
FINANCIAL REVIEW4 CONSOLIDATED FINANCIAL
STATEMENTS5 ADDITIONAL INFORMATION
COMPENSATION REPORT
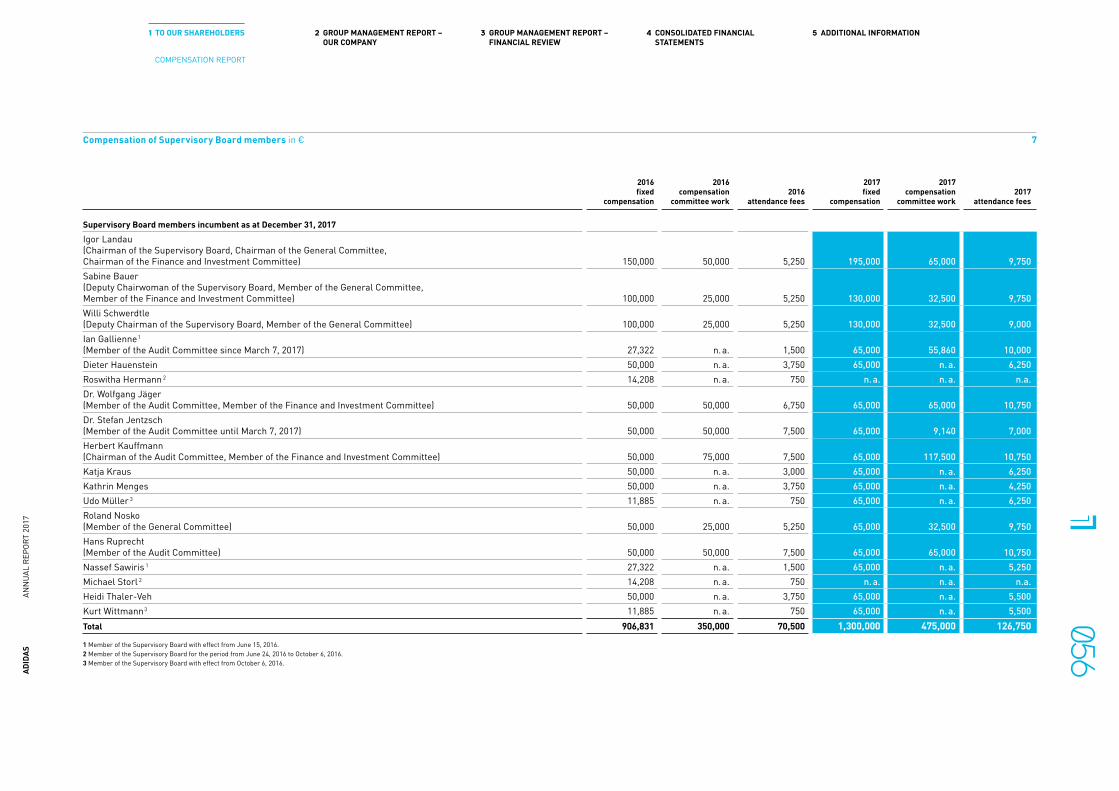
Compensation of Supervisory Board members in € 7
2016 fixed
compensation
2016 compensation
committee work2016
attendance fees
2017 fixed
compensation
2017 compensation
committee work2017
attendance fees
Supervisory Board members incumbent as at December 31, 2017Igor Landau (Chairman of the Supervisory Board, Chairman of the General Committee, Chairman of the Finance and Investment Committee) 150,000 50,000 5,250 195,000 65,000 9,750Sabine Bauer(Deputy Chairwoman of the Supervisory Board, Member of the General Committee, Member of the Finance and Investment Committee) 100,000 25,000 5,250 130,000 32,500 9,750Willi Schwerdtle(Deputy Chairman of the Supervisory Board, Member of the General Committee) 100,000 25,000 5,250 130,000 32,500 9,000Ian Gallienne 1
(Member of the Audit Committee since March 7, 2017) 27,322 n. a. 1,500 65,000 55,860 10,000Dieter Hauenstein 50,000 n. a. 3,750 65,000 n. a. 6,250Roswitha Hermann 2 14,208 n. a. 750 n. a. n. a. n.a.Dr. Wolfgang Jäger(Member of the Audit Committee, Member of the Finance and Investment Committee) 50,000 50,000 6,750 65,000 65,000 10,750Dr. Stefan Jentzsch(Member of the Audit Committee until March 7, 2017) 50,000 50,000 7,500 65,000 9,140 7,000Herbert Kauffmann(Chairman of the Audit Committee, Member of the Finance and Investment Committee) 50,000 75,000 7,500 65,000 117,500 10,750Katja Kraus 50,000 n. a. 3,000 65,000 n. a. 6,250Kathrin Menges 50,000 n. a. 3,750 65,000 n. a. 4,250Udo Müller 3 11,885 n. a. 750 65,000 n. a. 6,250Roland Nosko (Member of the General Committee) 50,000 25,000 5,250 65,000 32,500 9,750Hans Ruprecht (Member of the Audit Committee) 50,000 50,000 7,500 65,000 65,000 10,750Nassef Sawiris 1 27,322 n. a. 1,500 65,000 n. a. 5,250Michael Storl 2 14,208 n. a. 750 n. a. n. a. n.a.Heidi Thaler-Veh 50,000 n. a. 3,750 65,000 n. a. 5,500Kurt Wittmann 3 11,885 n. a. 750 65,000 n. a. 5,500Total 906,831 350,000 70,500 1,300,000 475,000 126,750
1 Member of the Supervisory Board with effect from June 15, 2016.2 Member of the Supervisory Board for the period from June 24, 2016 to October 6, 2016.3 Member of the Supervisory Board with effect from October 6, 2016.
ADID
AS
ANN
UAL
REPO
RT 2
017
0561 TO OUR SHAREHOLDERS 2 GROUP MANAGEMENT REPORT –
OUR COMPANY3 GROUP MANAGEMENT REPORT –
FINANCIAL REVIEW4 CONSOLIDATED FINANCIAL
STATEMENTS5 ADDITIONAL INFORMATION
COMPENSATION REPORT

OUR SHAREDespite some minor setbacks throughout the year, international stock markets ended the year 2017 on a positive note. While the DAX-30 and the EURO STOXX 50 increased by 13% and 6%, respectively, the MSCI World Textiles, Apparel & Luxury Goods Index was up 32%. The adidas AG share traded fairly in line with international stock markets and ended 2017 with an increase of 11% compared to the prior year. As a result of the strong operational performance in 2017 as well as Management’s confidence in the strength of the company’s financial position and long-term growth aspirations, we intend to propose a dividend per share of € 2.60 at our 2018 Annual General Meeting.
ADIDAS AG SHARE CONTINUES UPSWING IN 2017In 2017, international stock markets ended the year on a positive note, despite some minor setbacks throughout the year. The strong performance was supported by business-friendly policy decisions following the US elections, including
a significant US tax reform, strong global economic growth, the outcome of the French parliamentary election as well as accommodative monetary policies by central banks around the world. The Federal Reserve’s decisions on interest rate increases and balance sheet cuts, the strengthening of the euro, terror attacks and geopolitical risks only temporarily put pressure on international equity markets. As a result, the DAX-30 increased a strong 13%, while the EURO STOXX 50 gained 6% in 2017. The MSCI World Textiles, Apparel & Luxury Goods Index ended the year with a 32% increase. SEE TABLE 9 The adidas AG share traded fairly in line with international stock markets and ended the year 11% above the 2016 year-end level. In particular, the publication of the company’s 2020 acceleration plan, including an increase in the company’s financial 2020 ambition, strongly supported the positive trend of the share during the course of 2017. In addition, the release of strong financial results, driven by the relentless execution of the strategic business plan ‘Creating the New’, which resulted in an upgrade of the company’s full year 2017 outlook at the end of July, helped to reinforce investors’ confidence
in the successful execution of Creating the New and the company’s ability to sustainably grow revenues and improve margins in the years to come. Consequently, the adidas AG share reached a new all-time high of € 199.95 on August 4, 2017. However, unfavorable newsflow regarding the US retail environment as well as some profit-taking and strategic asset re-allocation executed by capital market participants, following the strong share price development during the first nine months, temporarily put pressure on the adidas AG share towards the end of 2017. Consequently, the adidas AG share closed the year at € 167.15 and thus 11% above the prior year-end level. SEE DIAGRAM 8
LEVEL 1 ADR PERFORMS IN LINE WITH COMMON STOCKOur Level 1 ADR closed 2017 at US $ 99.82, representing an increase of 27% versus the prior year level (2016: US $ 78.55). The more pronounced increase of the Level 1 ADR price compared to the ordinary share price was due to the depreciation of the US dollar versus the euro in 2017. The number of Level 1 ADRs outstanding decreased to 7.1 million at year-end 2017 compared to 8.8 million at the end of 2016. The average daily trading volume decreased to around 60,200 ADRs in 2017 (2016: around 101,200). Further information on our ADR program can be found on our website. ↗ ADIDAS-GROUP.COM/ADR
Performance of the adidas AG share and important indices at year-end 2017 in %
9
1 year 3 years 5 years 10 years
adidas AG 11 190 148 226DAX-30 13 32 70 60EURO STOXX 50 6 11 33 (20)MSCI World Textiles, Apparel & Luxury Goods 32 26 52 133
Source: Bloomberg.Five-year share price development 1 8
| Dec. 31, 2012 Dec. 31, 2017 |
300
250
200
150
100
50
1 Index: December 31, 2012 = 100. adidas AG DAX-30 EURO STOXX 50 MSCI World Textiles, Apparel & Luxury Goods Index
ADID
AS
ANN
UAL
REPO
RT 2
017
0571 TO OUR SHAREHOLDERS 2 GROUP MANAGEMENT REPORT –
OUR COMPANY3 GROUP MANAGEMENT REPORT –
FINANCIAL REVIEW4 CONSOLIDATED FINANCIAL
STATEMENTS5 ADDITIONAL INFORMATION
OUR SHARE

payout of € 530 million (2016: € 405 million) reflects a payout ratio of 37.1% (2016: 37.4%) of net income from continuing operations excluding the negative one-time tax impact as a result of the US tax reform in 2017. SEE TABLE 10 This is within the target range of between 30% and 50% of net income from continuing operations as defined in our dividend policy.
SHAREHOLDER RETURN PROGRAM EXPIRED On October 1, 2014, adidas AG announced a multi-year shareholder return program of up to € 1.5 billion in total to be completed by December 31, 2017. The shareholder return program was executed by buying back shares via the stock exchange under the authorization given by the Annual General Meeting on May 8, 2014, and on May 12, 2016, for the period
ADIDAS AG SHARE MEMBER OF IMPORTANT INDICESThe adidas AG share is included in a variety of high-quality indices around the world, most importantly the DAX-30, the EURO STOXX 50 Index as well as the MSCI World Textiles, Apparel & Luxury Goods Index, which comprises our major competitors. At December 31, 2017, our weighting in the DAX-30, which is calculated on the basis of free float market capitalization and twelve-month share turnover, improved to 3.01% (2016: 2.89%). Our higher weighting compared to the prior year was due to the increase in market capitalization of adidas AG. Within the DAX-30, we ranked 11 on market capitalization (2016: 14) and 12 on turnover (2016: 12) at year-end 2017. Our weighting in the EURO STOXX 50 Index, which is based on free-float market capitalization, amounted to 1.28% on December 31, 2017 (2016: 1.31%). Additionally, in recognition of our social and environmental efforts, adidas AG is listed in several key sustainability indices. SEE TABLE 10
MORE THAN 90% OF THE CONVERTIBLE BOND CONVERTEDIn March 2012, adidas AG successfully issued a convertible bond, due on June 14, 2019, for an aggregate nominal amount of € 500 million. Proceeds from the offering have allowed the company to further optimize its debt structure. The bonds were priced with a 0.25% annual coupon and a conversion premium of 40% above the reference price of € 59.61, resulting in an initial conversion price of € 83.46 per share. As a consequence of contractual provisions relating to dividend protection, the conversion price was adjusted to € 81.13 per share. This adjustment became effective on May 12, 2017. The bonds have been callable by the issuer since June 2017. In 2017, 2,814,470 shares were transferred following the exercise of conversion rights, all of which were serviced from treasury shares of the company. The remaining bonds were convertible into up to 377,190 new or existing adidas AG shares.
SEE NOTE 18, P. 175 Consequently, as at December 31, 2017, 94%
of the convertible bond was con verted (2016: 48%). The convertible bond closed the year 12% above the prior year level at € 205.91 (2016: € 183.40).
DIVIDEND PROPOSAL OF € 2.60 PER SHAREAs a result of the strong operational performance in 2017, the company’s robust financial position as well as Manage-ment’s confidence in our long-term growth aspirations, the adidas AG Executive and Supervisory Boards will recommend paying a dividend of € 2.60 per dividend-entitled share to shareholders at the Annual General Meeting (AGM) on May 9, 2018. This represents an increase of 30% compared to the prior year dividend (2016: € 2.00). Subject to the meeting’s approval, the dividend will be paid on May 15, 2018. The total
The adidas AG share 10
2017 1 2016 Important indices
Number of shares outstanding 2 shares 203,861,234 201,489,310 — DAX-30— EURO STOXX 50— MSCI World Textiles, Apparel &
Luxury Goods— Deutsche Börse Prime Consumer— Dow Jones Sustainability Indices
(World and Europe)— ECPI Ethical Equity Indices
(Euro and EMU)— ECPI ESG Equity (Euro and World)— Ethibel Sustainability Indices
(Global and Europe)— Euronext Vigeo (Eurozone 120,
Europe 120)— FTSE4Good Index Series— MSCI Global Sustainability Indexes— MSCI SRI Indexes— STOXX Global ESG Leaders
Basic earnings per share 3 € 7.05 5.39Diluted earnings per share 3 € 7.00 5.29Year-end price € 167.15 150.15Year high € 199.95 159.50Year low € 143.80 83.45Market capitalization4 € in millions 34,075 30,254Dividend per share € 2.60 5 2.00Dividend payout € in millions 530 4 405Dividend payout ratio 3 % 37.1 4 37.4Dividend yield % 1.6 1.3Shareholders’ equity per share 4 € 31.64 32.12Price-earnings ratio at year-end 6 % 23.7 27.8Average trading volume per trading day 7 shares 653,389 892,646
1 2017 excluding negative one-time tax impact of € 76 million.2 All shares carry full dividend rights.3 Based on net income from continuing operations.4 Based on number of shares outstanding at year-end.5 Subject to Annual General Meeting approval.6 Based on basic EPS from continuing operations.7 Based on number of shares traded on all German stock exchanges.
ADID
AS
ANN
UAL
REPO
RT 2
017
0581 TO OUR SHAREHOLDERS 2 GROUP MANAGEMENT REPORT –
OUR COMPANY3 GROUP MANAGEMENT REPORT –
FINANCIAL REVIEW4 CONSOLIDATED FINANCIAL
STATEMENTS5 ADDITIONAL INFORMATION
OUR SHARE

through to May 11, 2021. The authorization covers the repurchase of up to 10% of the company’s share capital on the stock exchange. The total number of shares bought back by adidas AG within the framework of the shareholder return program amounted to 11,146,969. This corresponds to a notional amount of € 11,146,969 in the nominal capital and consequently 5.33% of the company’s nominal capital. The total aggregate acquisition costs (excluding incidental purchasing costs) for the shareholder return program amounted to around € 900 million.
STRONG INTERNATIONAL INVESTOR BASEBased on our share register, we estimate that adidas AG currently has more than 70,000 shareholders (2016: 60,000). In our latest ownership analysis conducted in January 2018, we identified almost 100% of our shares outstanding. Institutional investors represent the largest investor group, holding 87% of shares outstanding (2016: 87%). Private investors and undisclosed holdings account for 10% (2016: 8%). Lastly, adidas AG currently holds 3% of the company’s shares as treasury shares (2016: 4%); this decline versus the prior year reflects treasury shares transferred following the exercise of conversion rights from the convertible bond partly offset by shares purchased as part of our share buyback program. SEE DIAGRAM 12
In terms of geographical distribution, the North American market currently accounts for 40% of institutional share-holdings (2016: 40%), followed by the UK with 18% (2016: 21%). Identified German institutional investors hold 11% of shares outstanding (2016: 8%). Belgium and France account for 9% (2016: 9%) and 6% (2016: 5%), respectively. 15% of institutional shareholders were identified in other regions of the world (2016: 17%). SEE DIAGRAM 13
Shareholder structure by investor group 1 12
1 As of January 2018.
10%Private investors and undisclosed holdings
87%Institutional investors
3%Treasury shares
Shareholder structure by region 1, 2 13
1 As of January 2018.2 Reflects institutional investors only.
9%Belgium
11%Germany
15%Rest of world
6%France
18%United Kingdom
40%North America
adidas AG high and low share prices per month 1 in € 11
Jan. Feb. Mar. Apr. May Jun. Jul. Aug. Sep. Oct. Nov. Dec.
230
210
190
170
150
130
30-day moving average High and low share prices Source: Bloomberg.
1 Based on daily Xetra closing prices.
155.
40
158.
40
183.
20
185.
70
184.
15
177.
60 193.
00
199.
95
199.
20
196.
10
187.
70
180.
60
144.
30
143.
80 159.
80
175.
60
169.
85
164.
35
168.
35 183.
20
187.
85
186.
35
175.
20
167.
15
ADID
AS
ANN
UAL
REPO
RT 2
017
0591 TO OUR SHAREHOLDERS 2 GROUP MANAGEMENT REPORT –
OUR COMPANY3 GROUP MANAGEMENT REPORT –
FINANCIAL REVIEW4 CONSOLIDATED FINANCIAL
STATEMENTS5 ADDITIONAL INFORMATION
OUR SHARE

ADIDAS AG SHARE RECEIVES STRONG ANALYST SUPPORTBoth the company and the adidas AG share continued to receive strong analyst support in 2017. Around 40 analysts from investment banks and brokerage firms regularly published research reports on adidas. The vast majority of analysts are confident about the medium- and long- term potential of the company. This is reflected in the recommendation split for our share as at December 31, 2017. 46% of analysts recommended investors to ’buy’ our share (2016: 27%). 46% advised to ‘hold’ our share (2016: 56%) and 8% of the analysts recommended to ‘sell’ our share (2016: 17%).
SUCCESSFUL INVESTOR RELATIONS ACTIVITIES adidas AG strives to maintain close contact to institutional and private shareholders as well as analysts. In 2017, Management and the Investor Relations team spent 46 days on roadshows (2016: 47) and also spent 21 days presenting at 14 national and international conferences (2016: 28 days at 16 con ferences). Furthermore, in order to present additional information around Creating the New, our strategic business plan until 2020, as well as the newly introduced acceleration plan, we hosted an Investor Day on March 14 at the company’s head-quarters in Herzogenaurach, Germany. More than 100 investors and analysts attended the event in person.
For the fourth time in five years, adidas was awarded a Red Dot Communication Design Award for its Annual Report. In addition, the adidas Investor Relations team won the prestigious European IR Magazine Award in the following categories: ‘Best in sector: Consumer Discretionary’ and ‘Best in region: Germany’.
VOTING RIGHTS NOTIFICATIONS PUBLISHEDAll voting rights notifications received in 2017 and thereafter in accordance with §§ 33 et seq. of the German Securities Trading Act (Wertpapierhandelsgesetz – WpHG) (§§ 21 et seq. German Securities Trading Act old version) can be viewed on our corporate website. ↗ ADIDAS-GROUP.COM/VOTING_RIGHTS_NOTIFICATIONS Information on reportable shareholdings that currently exceed or fall below a certain threshold can also be found in the Notes section of this Annual Report. SEE NOTE 26, P. 182
MANAGERS’ TRANSACTIONS REPORTED ON CORPORATE WEBSITEManagers’ transactions involving adidas AG shares (ISIN DE000A1EWWW0) or related financial instruments, as defined by Article 19 of the European Market Abuse Regulation (MAR), conducted by members of our Executive or Supervisory Boards, by key executives or by any person in close relationship with these persons, are reported on our website.↗ ADIDAS-GROUP.COM/S/MANAGERS-TRANSACTIONS
EXTENSIVE FINANCIAL INFORMATION AVAILABLE ONLINEWe offer extensive information around our share as well as the company’s strategy and financial results on our corporate website. Our event calendar lists all conferences and roadshows we attend and provides all presentations for download. In addition to live webcasts of all major events such as the Annual General Meeting, Investor Days and our IR Tutorial Workshops, we also offer webcasts of our quarterly conference calls. ↗ ADIDAS-GROUP.COM/S/INVESTORS
ADID
AS
ANN
UAL
REPO
RT 2
017
0601 TO OUR SHAREHOLDERS 2 GROUP MANAGEMENT REPORT –
OUR COMPANY3 GROUP MANAGEMENT REPORT –
FINANCIAL REVIEW4 CONSOLIDATED FINANCIAL
STATEMENTS5 ADDITIONAL INFORMATION
OUR SHARE

G R O U P M A N A G E M E N T
R E P O R TO U R C O M P A N Y
Corporate Strategy 062adidas Brand Strategy 067Reebok Brand Strategy 070Sales and Distribution Strategy 072
Global Operations 074
Innovation 078
People and Culture 081
Sustainability 088
Non-Financial Statement 100
Group Management Report: This report contains the Group Management Report of the adidas Group, comprising adidas AG and its consolidated subsidiaries, and the Management Report of adidas AG.
061AD
IDAS
AN
NUA
L RE
PORT
201
7
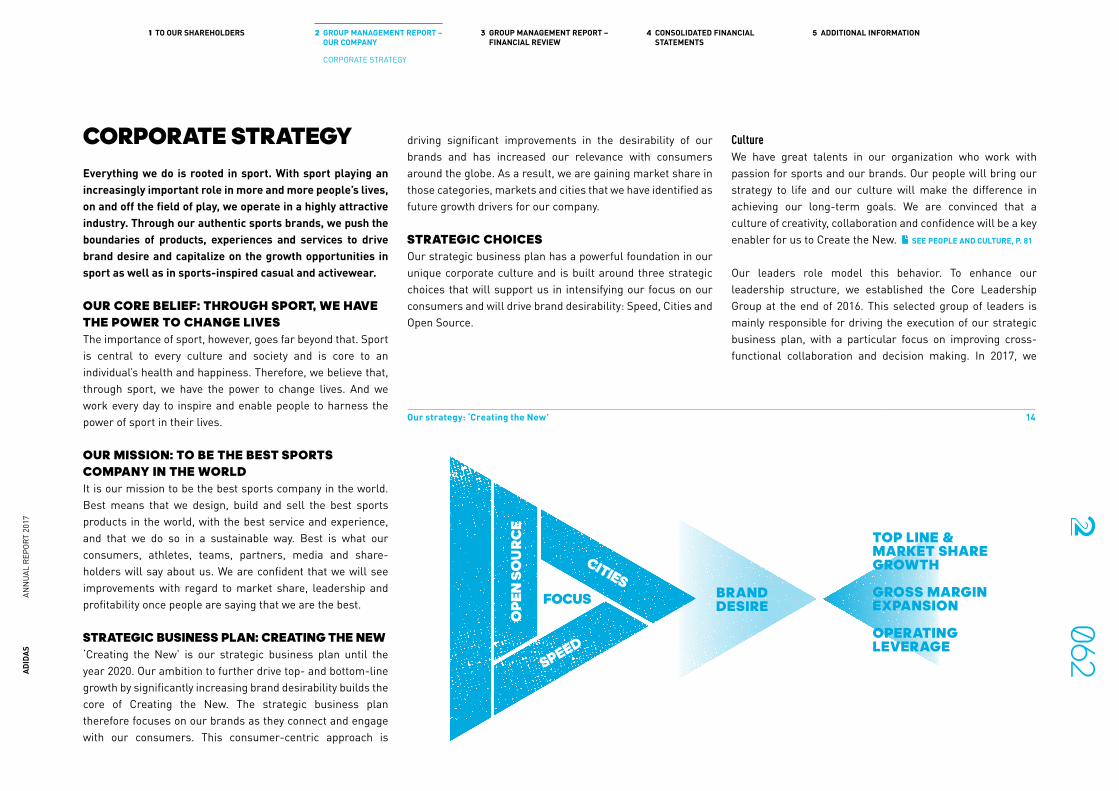
CORPORATE STRATEGYEverything we do is rooted in sport. With sport playing an increasingly important role in more and more people’s lives, on and off the field of play, we operate in a highly attractive industry. Through our authentic sports brands, we push the boundaries of products, experiences and services to drive brand desire and capitalize on the growth opportunities in sport as well as in sports-inspired casual and activewear.
OUR CORE BELIEF: THROUGH SPORT, WE HAVE THE POWER TO CHANGE LIVESThe importance of sport, however, goes far beyond that. Sport is central to every culture and society and is core to an individual’s health and happiness. Therefore, we believe that, through sport, we have the power to change lives. And we work every day to inspire and enable people to harness the power of sport in their lives.
OUR MISSION: TO BE THE BEST SPORTS COMPANY IN THE WORLDIt is our mission to be the best sports company in the world. Best means that we design, build and sell the best sports products in the world, with the best service and experience, and that we do so in a sustainable way. Best is what our consumers, athletes, teams, partners, media and share-holders will say about us. We are confident that we will see improvements with regard to market share, leadership and profitability once people are saying that we are the best.
STRATEGIC BUSINESS PLAN: CREATING THE NEW‘Creating the New’ is our strategic business plan until the year 2020. Our ambition to further drive top- and bottom-line growth by significantly increasing brand desirability builds the core of Creating the New. The strategic business plan therefore focuses on our brands as they connect and engage with our consumers. This consumer-centric approach is
driving significant improvements in the desirability of our brands and has increased our relevance with consumers around the globe. As a result, we are gaining market share in those categories, markets and cities that we have identified as future growth drivers for our company.
STRATEGIC CHOICESOur strategic business plan has a powerful foundation in our unique corporate culture and is built around three strategic choices that will support us in intensifying our focus on our consumers and will drive brand desirability: Speed, Cities and Open Source.
CultureWe have great talents in our organization who work with passion for sports and our brands. Our people will bring our strategy to life and our culture will make the difference in achieving our long-term goals. We are convinced that a culture of creativity, collaboration and confidence will be a key enabler for us to Create the New. SEE PEOPLE AND CULTURE, P. 81
Our leaders role model this behavior. To enhance our leadership structure, we established the Core Leadership Group at the end of 2016. This selected group of leaders is mainly responsible for driving the execution of our strategic business plan, with a particular focus on improving cross-functional collaboration and decision making. In 2017, we
Our strategy: ‘Creating the New’ 14
FOCUS
TOP LINE &MARKET SHAREGROWTH
GROSS MARGINEXPANSION
OPERATINGLEVERAGE
BRANDDESIRE
CITIES
SPEED
OP
EN S
OU
RC
E
CU
LTU
RE
ADID
AS
ANN
UAL
REPO
RT 2
017
0621 TO OUR SHAREHOLDERS 2 GROUP MANAGEMENT REPORT –
OUR COMPANY3 GROUP MANAGEMENT REPORT –
FINANCIAL REVIEW4 CONSOLIDATED FINANCIAL
STATEMENTS5 ADDITIONAL INFORMATION
CORPORATE STRATEGY

continued to sharpen our leadership structure by adding an Extended Leadership Group which supports the Core Leadership Group in implementing our strategy and which will serve as a succession pipeline for Core Leadership Group members. The Leadership Framework, introduced in 2017, unites all leaders in our company through a clear definition of what strong leadership looks like at adidas.
We believe that a performance culture is essential to successfully executing our strategy. To further promote a performance culture within our company, we have finalized a new way of developing our people and evaluating their performance. In addition, we made major progress in recalibrating our approach to compensation and benefits. Long-term remuneration for our senior management, for instance, will be simplified and linked to the development of the company’s bottom line and our share price going forward in order to further align the interests of our senior leaders with the interests of our shareholders.
As a company, we value diversity and promote inclusivity. While today our employee base is already very diverse in terms of nationalities, we also aim to continuously increase the share of females in leadership positions. With the appointment of Karen Parkin to the Executive Board in May 2017, we have made further progress in this regard. In addition, between July 2015 and June 2017, the share of women at Board-1 level increased from 11% to 18%, and at Board-2 level the percentage of women grew from 26% to 29% during the same period. SEE PEOPLE AND CULTURE, P. 81
Speed Driving brand desirability begins with putting our consumers at the heart of everything we do and serving them in the best possible way. This involves ensuring that consumers always find fresh and desirable products where and when they want them and with an unrivaled brand experience. This, in turn,
higher share of full-price sales with this part of our business compared to the regular range.
In addition to focusing on Speed in our existing supply chain and production processes, we also explore new, disruptive business models and technologies to make us faster. At the end of 2015, we opened our first Speedfactory SEE GLOSSARY in Ansbach, Germany. Using smart manufacturing instead of centralized production, it brings production closer to where the consumer is. It opens doors to the creation of products completely unique to the fit and functional needs of our consumers, through a combination of the craft of shoemaking and cutting-edge technology. 2017 saw the first major product to be created at the Speedfactory: The AM4 series, an individually designed and manufactured shoe made for our global key cities, went into production. In addition, we opened a second Speedfactory in Atlanta, USA, to create product more quickly for and closer to the US consumer. Bringing the two factories up to speed is what we are focusing on in 2018. And while Speedfactory enables us to rethink conventional manu-facturing processes, it also enables us to continuously learn from it, which in turn will help us to also improve efficiency and increase opportunities within the traditional supply chain, which will remain the backbone of our global sourcing activity.
SEE GLOBAL OPERATIONS, P. 74 SEE INNOVATION, P. 78
CitiesUrbanization continues to be a global megatrend. Most of the global population lives in cities and already today cities account for around 80% of global GDP. Cities are shaping global trends and consumers’ perception, perspectives and buying decisions. To be successful in the future, we therefore need to win the consumer in the world’s most influential cities. We have identified six global megacities in which we want to over-proportionally invest to grow share of mind, share of market, share of trend: London, Los Angeles, New York, Paris, Shanghai and Tokyo.
means to us being able to anticipate what consumers want and reacting accordingly in a timely manner. Being fast will give us a decisive competitive advantage. The benefits include higher product availability, reduced inventory risk, incremental net sales and higher margins. Speed is therefore a critical and powerful lever for us.
We are using our industry-leading experience to further evolve our entire business model end-to-end, from range planning to product creation, sourcing, supply chain, go-to-market and sales. In this context, our Speed concept builds on three programs:
— Never out of stock: We strengthen our existing ‘never-out-of-stock’ business proposition by setting a global, permanent offer with longer life cycles and continuous reproduction and replenishment. This ensures our most iconic and desired products are permanently available to our consumers.
— Planned responsiveness: Systematically monitoring trends at the point of sale enables us to better read demand signals, re-order seasonal products on shorter lead times and deliver them within the season. By doing so, we can repeat seasonal product successes and fulfil higher consumer demand than initially forecast.
— In-season creation: We create ranges later in the season to ensure we capture the latest trends in our industry. This, in turn, helps us to create unexpected newness and drive brand desire.
Since the launch of the Speed programs, we have steadily expanded the coverage. All categories and markets have now been fully onboarded and started to capitalize on the benefits of the Speed programs. The net sales share of speed-enabled products has continuously increased to a level of 28% in 2017 which is fully in line with our overall ambition to increase the share of speed-enabled products to at least 50% by 2020. In addition, we are making further progress to achieve a 20%
ADID
AS
ANN
UAL
REPO
RT 2
017
0631 TO OUR SHAREHOLDERS 2 GROUP MANAGEMENT REPORT –
OUR COMPANY3 GROUP MANAGEMENT REPORT –
FINANCIAL REVIEW4 CONSOLIDATED FINANCIAL
STATEMENTS5 ADDITIONAL INFORMATION
CORPORATE STRATEGY

We aim to deliver extraordinary experiences to consumers in these cities across all touchpoints by engaging more deeply with them in communities where they live, places where they work, fields, courts and streets where they play and doors where they shop. At the same time, we strive to create high synergies between our activation and commercial efforts. This also includes aligning our initiatives with similar activities of key retail partners.
It is our goal to create an end-to-end ecosystem in these cities which connects consumers to relevant products, through bottom-up activation and holistic retail experiences:
— Activation: Our global key cities offer a unique platform to activate our brands. Key successes in 2017 include the ‘Green Light Run’ in Tokyo, receiving six Cannes awards, as well as the Parley ‘Run for the Oceans’ in New York City and the launch of our new football footwear franchise Nemeziz in London, which have not only created brand heat in the respective cities but also received significant global social media coverage.
— Products: We continue to drive a multi-pronged strategy of product introductions, focused across all six cities, including global campaign launches and exclusive collections. With the launch of the AM4 series in 2017, we introduced the first shoe that was co-created with consumers from our global key cities and tailored to their unique demands. Produced in our Speedfactory, the AM4 saw its debut in London and Paris at the end of 2017, with the remaining four global key cities to follow in 2018.
— Experiences: We are committed to providing premium retail experiences to our consumers with executions that connect, engage and inspire them. The opening of our second adidas Originals flagship store in London in 2017 set a new benchmark in the industry. Moreover, in collaboration with our retail partners, we made significant progress in transforming retail spaces into premium shopping spaces in key doors within key trade zones.
The 2017 results for several KPIs (NPS and market share) signal we are well on track to achieve our long-term target to double revenues in our global key cities by the end of 2020 compared to 2015. Our global cities make an above-average contribution to the overall growth of our company and help us achieve market share gains. In addition, we also experienced a relative improvement in brand desire in most of our key cities.
Open Source Open Source is a collaboration-based innovation model that aims to build brand advocacy by opening the brands’ doors to the consumer and by inviting him or her to co-create the future of sport and sports culture with us. It is about learning and sharing, about starting conversations between the brand, external experts and consumers and about giving them the chance to have an impact on what we do. We provide access for externals to tools and resources we use to create, thereby acquiring and nurturing creative capital, and explore new territories so as to create unprecedented brand value for the consumer beyond mere transactional businesses.
We have defined three strategic initiatives for Open Source: — Creative collaborations: Creative collaborations increase
our creative capital through new tools, new environments and new perspectives from outside creative thinkers. They are meant to give creativity a platform and provide the right tools for ideas to blossom. With the Brooklyn Creator Farm, for example, a design space and creation hub, we offer urban creative talent a platform and invite them in to fuel innovation in sport with their ideas, outside any regular seasonal product creation calendars. Following the initial set-up phase in 2016, the creator farm has meanwhile started to have a visible impact on our creative direction and leaves a footprint in the local creative community. In addition, we have evolved our successful
creative partnerships with Alexander Wang, Kanye West and Stella McCartney, among others, to further drive brand desire and growth.
— Athlete collaborations: Through athlete collaborations we aim to build communities of athletes that help shape the future of their sport together with us. Such collaborations include relationships with the world’s best athletes and teams, but they also take place on a local level. To directly engage and interact with a broader consumer community, we have expanded our digital and physical space projects in 2017. For instance, ‘adidas runners’, a highly engaged community of runners, now counts over 50,000 active runners in Western Europe alone. Other collaborations include Wanderlust, a producer of the largest yoga lifestyle events in the world, or our Tango League, a grassroots event for the football enthusiast, among others.
— Partner collaborations: The strategic initiatives in the area of partner collaborations intend to open up our knowledge of sport by working with the best in other fields. By exchanging core competencies, we will create unique value for our brands and ultimately also for our consumers. Our partnership with Parley for the Oceans SEE GLOSSARY
serves as a prime example. As a founding member of the organization, our support goes far beyond financial aid to fund beach clean-ups. In 2017, we launched multiple franchise silhouettes, such as the UltraBOOST, NMD or EQT, made out of Parley Ocean Plastic SEE GLOSSARY. In total, we have produced more than one million pairs of shoes using Parley Ocean Plastic. SEE SUSTAINABILITY, P. 88 In addition, we joined forces with Carbon, a company pioneering in the field of 3D printing, to launch a new product and platform: Futurecraft 4D. Driven by athlete data, a production process called ‘Digital Light Synthesis’ enables us to print previously impossible designs without labor-intensive and complex assembly. The Futurecraft 4D shoe launched in 2017 and will be expanded in the course of 2018. SEE INNOVATION, P. 78
ADID
AS
ANN
UAL
REPO
RT 2
017
0641 TO OUR SHAREHOLDERS 2 GROUP MANAGEMENT REPORT –
OUR COMPANY3 GROUP MANAGEMENT REPORT –
FINANCIAL REVIEW4 CONSOLIDATED FINANCIAL
STATEMENTS5 ADDITIONAL INFORMATION
CORPORATE STRATEGY
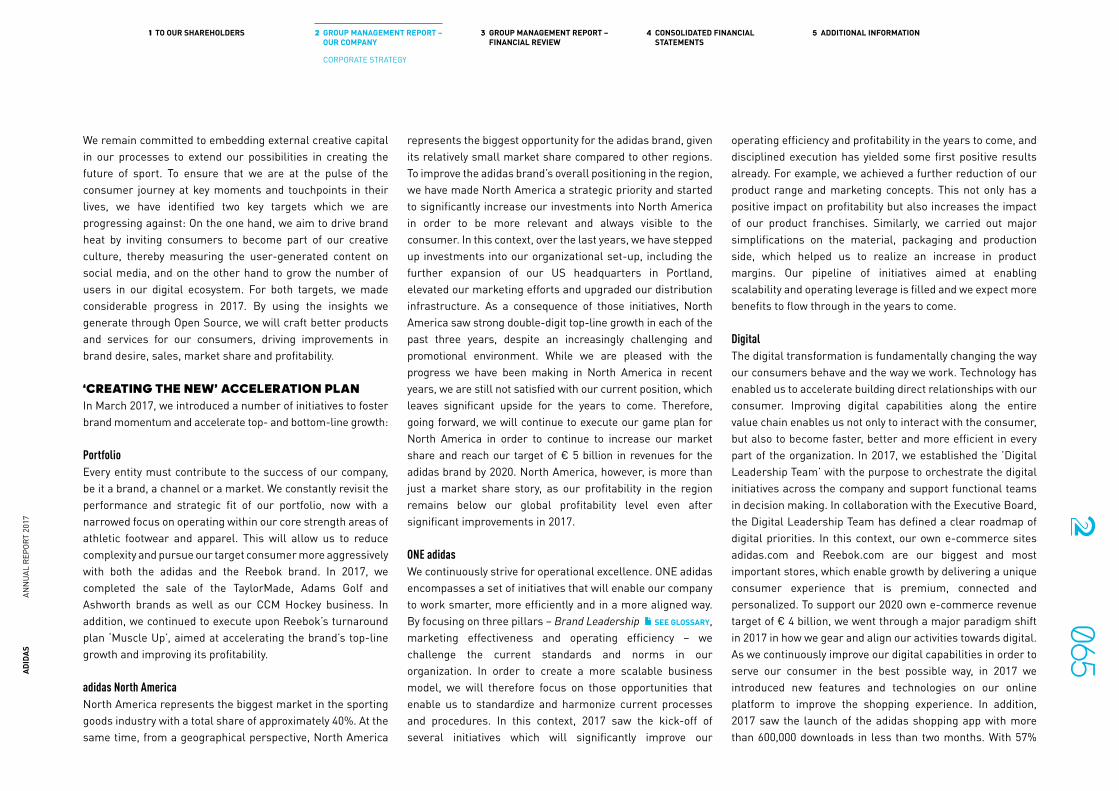
We remain committed to embedding external creative capital in our processes to extend our possibilities in creating the future of sport. To ensure that we are at the pulse of the consumer journey at key moments and touchpoints in their lives, we have identified two key targets which we are progressing against: On the one hand, we aim to drive brand heat by inviting consumers to become part of our creative culture, thereby measuring the user-generated content on social media, and on the other hand to grow the number of users in our digital ecosystem. For both targets, we made considerable progress in 2017. By using the insights we generate through Open Source, we will craft better products and services for our consumers, driving improvements in brand desire, sales, market share and profitability.
‘CREATING THE NEW’ ACCELERATION PLANIn March 2017, we introduced a number of initiatives to foster brand momentum and accelerate top- and bottom-line growth:
PortfolioEvery entity must contribute to the success of our company, be it a brand, a channel or a market. We constantly revisit the performance and strategic fit of our portfolio, now with a narrowed focus on operating within our core strength areas of athletic footwear and apparel. This will allow us to reduce complexity and pursue our target consumer more aggressively with both the adidas and the Reebok brand. In 2017, we completed the sale of the TaylorMade, Adams Golf and Ashworth brands as well as our CCM Hockey business. In addition, we continued to execute upon Reebok’s turnaround plan ‘Muscle Up’, aimed at accelerating the brand’s top-line growth and improving its profitability.
adidas North AmericaNorth America represents the biggest market in the sporting goods industry with a total share of approximately 40%. At the same time, from a geographical perspective, North America
represents the biggest opportunity for the adidas brand, given its relatively small market share compared to other regions. To improve the adidas brand’s overall positioning in the region, we have made North America a strategic priority and started to significantly increase our investments into North America in order to be more relevant and always visible to the consumer. In this context, over the last years, we have stepped up investments into our organizational set-up, including the further expansion of our US headquarters in Portland, elevated our marketing efforts and upgraded our distribution infrastructure. As a consequence of those initiatives, North America saw strong double-digit top-line growth in each of the past three years, despite an increasingly challenging and promotional environment. While we are pleased with the progress we have been making in North America in recent years, we are still not satisfied with our current position, which leaves significant upside for the years to come. Therefore, going forward, we will continue to execute our game plan for North America in order to continue to increase our market share and reach our target of € 5 billion in revenues for the adidas brand by 2020. North America, however, is more than just a market share story, as our profitability in the region remains below our global profitability level even after significant improvements in 2017.
ONE adidasWe continuously strive for operational excellence. ONE adidas encompasses a set of initiatives that will enable our company to work smarter, more efficiently and in a more aligned way. By focusing on three pillars – Brand Leadership SEE GLOSSARY, marketing effectiveness and operating efficiency – we challenge the current standards and norms in our organization. In order to create a more scalable business model, we will therefore focus on those opportunities that enable us to standardize and harmonize current processes and procedures. In this context, 2017 saw the kick-off of several initiatives which will significantly improve our
operating efficiency and profitability in the years to come, and disciplined execution has yielded some first positive results already. For example, we achieved a further reduction of our product range and marketing concepts. This not only has a positive impact on profitability but also increases the impact of our product franchises. Similarly, we carried out major simplifications on the material, packaging and production side, which helped us to realize an increase in product margins. Our pipeline of initiatives aimed at enabling scalability and operating leverage is filled and we expect more benefits to flow through in the years to come.
DigitalThe digital transformation is fundamentally changing the way our consumers behave and the way we work. Technology has enabled us to accelerate building direct relationships with our consumer. Improving digital capabilities along the entire value chain enables us not only to interact with the consumer, but also to become faster, better and more efficient in every part of the organization. In 2017, we established the ’Digital Leadership Team’ with the purpose to orchestrate the digital initiatives across the company and support functional teams in decision making. In collaboration with the Executive Board, the Digital Leadership Team has defined a clear roadmap of digital priorities. In this context, our own e-commerce sites adidas.com and Reebok.com are our biggest and most important stores, which enable growth by delivering a unique consumer experience that is premium, connected and personalized. To support our 2020 own e-commerce revenue target of € 4 billion, we went through a major paradigm shift in 2017 in how we gear and align our activities towards digital. As we continuously improve our digital capabilities in order to serve our consumer in the best possible way, in 2017 we introduced new features and technologies on our online platform to improve the shopping experience. In addition, 2017 saw the launch of the adidas shopping app with more than 600,000 downloads in less than two months. With 57%
ADID
AS
ANN
UAL
REPO
RT 2
017
0651 TO OUR SHAREHOLDERS 2 GROUP MANAGEMENT REPORT –
OUR COMPANY3 GROUP MANAGEMENT REPORT –
FINANCIAL REVIEW4 CONSOLIDATED FINANCIAL
STATEMENTS5 ADDITIONAL INFORMATION
CORPORATE STRATEGY

growth, our e-commerce platform was by far the fastest-growing channel in 2017.
FINANCIAL AMBITION UNTIL 2020Creating long-term value for our shareholders drives our overall decision-making process. Therefore, we are focused on rigorously managing those factors under our control, making strategic choices that will drive sustainable revenue and earnings growth and, ultimately, operating cash flow. We are committed to increasing returns to shareholders with above-industry-average share price performance and dividends. SEE INTERNAL MANAGEMENT SYSTEM, P. 102
Our unique corporate culture and the three strategic choices will continue to be step-changers with regard to brand desirability and brand advocacy. In combination with the initiatives that are part of our acceleration plan, this will enable us:
— To achieve top-line growth significantly above industry average: We aim to increase currency-neutral revenues annually between 2015 and 2020 at a rate between 10% and 12% on average (initially, in March 2015: high-single-digit currency-neutral increase).
— To win significant market share across key categories and markets: We have defined key categories within the adidas and Reebok brands that will spur our growth going forward. From a market perspective, we have defined clear roles for each of our markets, depending on macroeconomic trends, the competitive environment and our brand strength in the respective markets.
— To improve our profitability sustainably: We plan to substantially improve the company’s profitability, growing our net income from continuing operations by an average of between 22% and 24% per year between 2015 and 2020 (initially, in March 2015: increase at around 15%; updated in March 2017: increase between 20% and 22%).
— To deliver on our commitment to increase shareholder returns: Creating the New includes a strong commitment to generating increasing returns for our shareholders. Given our firm confidence in the strength of the company’s financial position and future growth ambitions, we target a consistent dividend payout ratio in a range between 30% and 50% of net income from continuing operations.
ADID
AS
ANN
UAL
REPO
RT 2
017
0661 TO OUR SHAREHOLDERS 2 GROUP MANAGEMENT REPORT –
OUR COMPANY3 GROUP MANAGEMENT REPORT –
FINANCIAL REVIEW4 CONSOLIDATED FINANCIAL
STATEMENTS5 ADDITIONAL INFORMATION
CORPORATE STRATEGY

ADIDAS BRAND STRATEGY
MISSION: TO BE THE BEST SPORTS BRAND IN THE WORLDThe adidas brand has a long history and deep-rooted connection with sport. Its broad and diverse sports portfolio, from major global sports such as football and running, to regional heartbeat sports such as American football and rugby, has enabled the brand to transcend cultures and become one of the most recognized and iconic global brands, on and off the field of play. The adidas brand’s mission is to be the best sports brand in the world, by designing, building and selling the best sports products in the world, with the best service and experience.
Driven by a relentless pursuit of innovation as well as decades of accumulating sports science expertise, the adidas brand has developed a truly unique and comprehensive sports offering. Spanning footwear, apparel, equipment and services, the brand caters for all, from elite professional athletes and teams to any individual who wants to make sport part of their lives. We help athletes of all levels to make a difference – in their game, in their lives, in their world. This is anchored in our core belief that, through sport, we have the power to change lives.
CONSUMER OBSESSION: CREATING FOR THE CREATORSThe consumer is at the heart of everything the adidas brand does. By constantly developing desirable products and inspiring experiences, the brand strives to build a strong image, trust and loyalty with consumers. Through ‘Creating the New’, the adidas brand has refined its strategic direction, operational processes and incentive systems, to foster a culture of consumer obsession across its entire organization.
— Operating model: To ensure long-term success, it is important that we continue to challenge ourselves to learn and grow. We must constantly iterate to become faster and
stronger. Therefore, the adidas brand continues to evolve directed by the guiding principles of Brand Leadership SEE
GLOSSARY, our operating model. The aim of Brand Leader ship is to provide an organizational structure which enables a ‘consumer-obsessed’ culture that can act with speed, agility and empowerment. In 2017, to further strengthen collaboration and alignment in execution across the sport-specific categories, we combined all of the sport-specific business units under one leadership. Similarly, we have created a new business unit called Core, which caters to the value consumer across categories. Moreover, to simplify the interaction between global and local organizations, we consolidated Brand Management and Concept-to-Consumer into a holistic marketing function. Finally, to streamline and align the two most future-facing functions, we consolidated Creative Direction and our Future Team to create continuity and creative fidelity stretching from upstream innovation, engineering and sports science through future design, advanced design, brand design and seasonal creative direction.
— Creator archetype: Owing to the rapid evolution of sport and sports culture, the adidas brand targets key consumer groups and influencers to create brand desirability and momentum through a well-defined consumer segmentation strategy. The consumer grid comprises six key quadrants (Male Athlete, Female Athlete, Young Creator, Streetwear Hound, Amplifier and Value Consumer), which are not mutually exclusive. Within this grid, it is key to win the most influential consumers, defined as the creator archetype. True to the brand’s values, these influential consumers define themselves as a work in progress – are all doers and makers, first to adopt, focused on what’s new and what’s next. A large portion of creators live, play and work in the world’s most influential and aspirational cities, a key reason for the company’s Cities strategic choice. In 2017, the adidas brand accelerated global and local marketing initiatives to amplify the brand’s creator positioning in the marketplace.
— Consumer centricity: Companies that put the consumer’s voice as a centerpiece of their decision-making process have proven higher levels of success in creating brand advocacy. Therefore, we implemented a global Net Promoter Score (NPS) ecosystem in order to drive brand momentum in a measurable and objective manner. NPS, first introduced in 2015, has become an important part of the adidas brand’s advocacy program. Through this program, we strive to understand consumers’ perception (positive and negative) of the brand and the key drivers which motivate them to recommend the brand to their friends. SEE INTERNAL MANAGEMENT SYSTEM, P. 102
PRODUCT FRANCHISES: CREATE THE MOST DESIRED SYMBOLS IN SPORTWe are convinced that footwear has the highest influence on brand perception among product categories. Footwear is also the most powerful driver of NPS, which in turn translates directly into consumer purchase intent and our potential to grow market share. Therefore, the adidas brand is focused on relentlessly creating newness in footwear, as a function of cutting-edge technological innovation with references to history, drawing from deep knowledge and an archive which are unrivaled in the industry. At the same time, the brand has a clear strategy to reduce the number of footwear models, putting a stronger focus on key franchises that can really make a difference for the brand. Such footwear franchises are defined as long-term concepts that we commit to for a multi-year period. The goal of franchises is not only to shape sport, but also to influence culture. They are built to create trends, rather than follow. They are targeted directly at the consumer through iconic features, stories and functions, and have the potential to be iterated and expanded over time. Their life cycles are being carefully managed, to ensure longevity. In addition, franchises will be prioritized throughout the value chain, building on the company’s strategic choices of Speed, Cities and Open Source. The adidas brand expects its top
ADID
AS
ANN
UAL
REPO
RT 2
017
0671 TO OUR SHAREHOLDERS 2 GROUP MANAGEMENT REPORT –
OUR COMPANY3 GROUP MANAGEMENT REPORT –
FINANCIAL REVIEW4 CONSOLIDATED FINANCIAL
STATEMENTS5 ADDITIONAL INFORMATION
CORPORATE STRATEGYadidas Brand Strategy
footwear franchises to represent at least 30% of the brand's footwear business by 2020. In 2017, key adidas brand franchises included modern icons such as the UltraBOOST, PureBOOST, Alphabounce, ‘X’, Nemeziz, NMD and EQT as well as a blend of past icons such as the Superstar, Stan Smith and Gazelle.
Following on from the strong success in footwear, in 2017 the adidas brand started to extend its franchise methodology and approach to apparel. Focused on a set of initiatives that have proven to be successful in footwear, the brand aims at accelerating its performance in apparel going forward. In this context, 2017 saw the successful evolution of the Z.N.E. Hoodie as part of the new Athletics apparel product line. The Z.N.E. Hoodie, specifically engineered to remove distractions and maximize athletes’ focus in the make or break period before they compete, was succeeded by the Z.N.E. pants and a suite of related apparel products during the course of the year that live up to the same promise. At the same time, the adidas brand increased its resources and focal point on apparel innovation with a clear focus on fit, feel and aesthetic. This will include the further development of the recently launched Alphaskin franchise, a rejuvenation of the Clima platform, as well as more iterations within exciting growth platforms such as Primeknit in the years to come.
WOMEN’S: A NEW DIMENSION TO DRIVE GROWTHWinning the female consumer is an imperative for the adidas brand and offers tremendous growth potential. Women are active in all sports and, to a large extent, dominate social media and household shopping behavior. Given the magnitude of the business opportunity, in 2017, the adidas brand further invested resources in building a cross-functional women’s organization and support infrastructure to set direction for creative, ranging, merchandising and marketing and to steer cross-category planning.
The adidas brand will relentlessly focus on five products for her: the bra, the tee, the tank, the tights and the running shoe. These are the five products the brand will innovate against, with the aim to create the best the industry has ever known in these five items. In 2017, the first results of this approach proved successful, with strong double-digit growth for our women’s business resulting in an increase in the share of total business for the women’s segment. A key highlight in this context was the launch of two global marketing campaigns: ‘Unleash Your Creativity’ telling the story of 15 female athletes who defy convention as well as a running-specific campaign ‘Fearless AF’, which aims to break down the stereotypes about female runners. In addition, the adidas brand increased its roster of female influencers around Karlie Kloss, Hannah Bronfman and Robin Arzon and continued to build on the partnership with Wanderlust, organizer of some of the largest yoga lifestyle events in the world.
MARKETING INVESTMENTS: MEAN MORE BY DOING LESSThe adidas brand is focused on creating inspirational and innovative marketing concepts that drive consumer advocacy and build brand equity. As a result, we are committed to continue increasing our absolute marketing investments going forward. While the brand currently spends almost half of its marketing investments on partnership assets, with the remainder on brand marketing activities such as digital, advertising, point-of-sale and grassroots activations, we will decrease the ratio of marketing investments spent on promotion partnerships SEE GLOSSARY to less than 45% by 2020. In addition, the brand will consolidate and focus resources to have the biggest effect on the creator and the brand’s key franchises. This will be achieved by focusing on three priorities:
— Reason to believe: By harnessing the brand’s creator positioning, the emotion of sport, and the power of sport to change lives, the adidas brand will communicate a reason to believe in the brand, letting the world know what distinguishes adidas from the competition.
— Reason to buy: The second priority is to harmonize and deliver globally consistent and impactful communication around the brand’s key franchises. By investing more money against fewer items, the adidas brand will strive to elevate and maintain the iconic status of its key franchises, giving the consumer clear and compelling reasons to buy the product.
— Sports communities: Sports communities is where loyalty is built and earned. The adidas brand defines sports communities as those places where athletes are fully immersed in their sport with peers and friends. It’s the football cage, the run base or the street court. Until 2020, the brand will therefore significantly step up its grassroots and local activation efforts, led by initiatives in the world’s most influential cities.
In terms of partnership assets, while reducing the ratio of marketing spend and the number of partnerships, the adidas brand will nonetheless continue to bring its products to the biggest stages in the world through:
— Events with global reach: such as the FIFA World Cup, the UEFA EURO, the UEFA Champions League, Roland Garros (French Open) and the Boston Marathon.
— High-profile teams: such as the national association football teams of Germany, Spain, Argentina, Mexico, Colombia, Belgium and Japan, as well as top clubs such as Manchester United, Real Madrid, Bayern Munich, Juventus and Flamengo Rio de Janeiro in football, the New Zealand All Blacks in rugby, and American universities such as Miami, Arizona State and Texas A&M.
— High-profile individuals: such as football stars Lionel Messi, Paul Pogba, Gareth Bale, Mesut Özil and Gabriel Jesus, basketball stars James Harden, Damian Lillard and Andrew Wiggins, marathon record holder Dennis Kimetto, American football players Aaron Rodgers and Von Miller, baseball athletes Kris Bryant and Carlos Correa as well as tennis stars Garbiñe Muguruza and Alexander Zverev.
ADID
AS
ANN
UAL
REPO
RT 2
017
0681 TO OUR SHAREHOLDERS 2 GROUP MANAGEMENT REPORT –
OUR COMPANY3 GROUP MANAGEMENT REPORT –
FINANCIAL REVIEW4 CONSOLIDATED FINANCIAL
STATEMENTS5 ADDITIONAL INFORMATION
CORPORATE STRATEGYadidas Brand Strategy
In addition, the adidas brand also has a number of strategic partnerships and creative collaborations in place. The strategic partnership with Kanye West is likely to be the most significant one ever created between an athletic brand and a non-athlete, while the collaboration between adidas Originals and Pharrell Williams remains highly influential. Top designers and design studios the brand works with include Yohji Yamamoto, Stella McCartney, Raf Simons, Gosha Rubchinskiy and Alexander Wang.
SUSTAINABILITYThe adidas brand is committed to sustainability and our strategic partnership with Parley for the Oceans SEE GLOSSARY
serves as a prime example. adidas has changed the game by starting mass production of shoes using Parley Ocean Plastic
SEE GLOSSARY, and the brand continues to push for a more eco-innovative future. In 2017, we created more than one million pairs of shoes using Parley Ocean Plastic and restated our ambition to reduce the use of virgin plastic. During 2017, the initiative was extended to adidas Originals, yielding pioneering outcomes such as the EQT Support ADV Parley, as well as to apparel performance products in the form of four Major League Soccer (MLS) football jerseys.
SEE SUSTAINABILITY, P. 88
ROLE OF CATEGORIESThe adidas brand has assigned each category a role and ambition until 2020, allowing the brand to exploit short- and medium-term potential, while at the same time incubating long-term opportunities for the brand. There are four overarching roles: Lead, Grow, Amplify and Authenticate.
Lead — To lead in the sporting goods industry, we believe it is a
must to lead in the world’s most popular sport, football. As such, the adidas brand aspires to be the number one football brand in every market by 2020. This will be driven
by focusing on winning the football creator in key cities as well as increasing investment in the brand’s football footwear franchises. In 2017, the adidas brand pursued its full reset of its football footwear business with the continued focus on the ‘X’, Nemeziz and Copa franchises as well as playing off its strong product heritage with the re-introduction of the Predator.
— The adidas brand also strives for leadership in lifestyle in every market with Originals. Not only is adidas the original sports brand, it also was the first brand to bring sport to the street. Brand credibility and heritage is an important prerequisite to win the discerning streetwear hound consumer. These consumers are looking for substance and craft and are inspired by stories and design. Growth in this category will be driven by iconic products from the brand’s past such as the Samba, Stan Smith, Gazelle and Superstar as well as pioneering new contemporary silhouettes inspired by elements from the past and the future, such as NMD, EQT, Tubular and Swift Runner, which account for approximately 50% of the adidas Originals footwear offering.
Grow — The running category is the adidas brand’s biggest
growth opportunity across all genders and price points SEE GLOSSARY. The brand’s goal is to double sales in the
category by 2020 compared to the 2015 financial year. Many innovations in the sports industry start in running. With groundbreaking innovation in materials such as Boost and pioneering new manufacturing processes being driven through Speedfactory, the timing is perfect for the adidas brand to strike in this category. To spur growth, amongst other things, adidas Running will significantly refine and evolve its franchise strategy for the male and female athlete, increase its investment in running communities and grassroots activations such as the Berlin and Boston
Runbases, as well as play a central role in driving the future of digital in sport in cooperation with Runtastic.
— The second category where the adidas brand is focused on driving significant market share gains is adidas Core. adidas Core targets a more price-conscious consumer, particularly in emerging markets, offering entry-price point styles across all categories. To ensure success, the adidas Core formula employs a ‘fast fashion’ business model. This means quick reaction to emerging trends through shorter lead times and excellence in retail execution.
SEE INNOVATION, P. 78
Amplify — The training category is the adidas brand’s largest
performance category and is also the apparel engine of the brand. Led by cutting-edge innovation in fabrics and materials, the adidas brand aims to significantly increase its apparel footprint through Training, which provides products for general training purposes as well as for specific sports, as well as through Athletics, which is geared to capturing the sports mindset of every athlete off the pitch. Given the high visibility of its products in all markets, this category plays a central role in amplifying the brand message and DNA.
Authenticate — In order to be the best sports brand in the world, the adidas
brand also needs to be true to sports on a local level. As such, the brand will continue to cater to a wide range of sports such as golf, basketball, American football, baseball, outdoor, rugby, tennis, handball, volleyball, swimming and boxing. To maximize impact and resources, in key markets and cities, the adidas brand will prioritize those sports that are most significant in terms of local culture, participation and national pride.
ADID
AS
ANN
UAL
REPO
RT 2
017
0691 TO OUR SHAREHOLDERS 2 GROUP MANAGEMENT REPORT –
OUR COMPANY3 GROUP MANAGEMENT REPORT –
FINANCIAL REVIEW4 CONSOLIDATED FINANCIAL
STATEMENTS5 ADDITIONAL INFORMATION
CORPORATE STRATEGYadidas Brand Strategy
REEBOK BRAND STRATEGY
MISSION: TO BE THE BEST FITNESS BRAND IN THE WORLDReebok is an American-inspired global brand with a deep fitness heritage and the mission of being the best fitness brand in the world. To realize this mission, the past years have been characterized by a transformation from traditional sports to fitness. The three sides of the Reebok Delta, a symbol of change and transformation, represent the physical, mental and social changes that occur when individuals embrace the challenge of bettering themselves in the gym, in their lives and in the world.
Throughout this journey, Reebok has invested in its training and running businesses to develop products that cater to all fitness routines, while returning to its fitness roots in Classics to support a fashion-forward lifestyle outside of the gym. Driven by its ambition to be the innovation leader in fitness, Reebok continues to merge its iconic past with new technologies that revolutionize both performance and lifestyle products.
CONSUMER OBSESSION: THE GAME CHANGERS Reebok’s consumer obsession focuses on being distinctive, relevant, and authentic with its focus consumers – the Game Changers. These consumers, equally women and men, of all ages, are driven by becoming their absolute best mentally, socially and physically. The Game Changers participate in a range of activities, are fitness-centric and are inspired by the broader fitness world. They share four essential qualities to create a unified mindset: self-betterment, perseverance, confidence and non-complacency. These are the core values that hold the Game Changers together. They blend fitness into their lives, care about style, and are passionate about what they do. Through robust research and interaction with consumers, Reebok has taken significant time to understand the complexities of their fitness lifestyle across both product
performance needs and style desires, and seeks to exceed expectations across the spectrum.
Within that consumer group, Reebok will continue to focus on the female Game Changers going forward. Rooted in Reebok’s heritage, the brand is putting women at the heart of everything the brand does. This female-centric approach, with women being the focal point of content strategy, marketing activation and distribution, is a fundamentally different approach compared to other brands in the industry. It will allow Reebok to become truly dual-gender with the goal of its women’s business representing 50% of the brand’s net sales. In recent years, the brand has made significant strides in having a distinct position with women by signing prominent influencers that are relevant to her.
PRODUCT FRANCHISES: LEVERAGING THE BRAND’S FITNESS DNAReebok recognizes the importance of building strong footwear and apparel franchises, establishing innovative but repeatable product lines that become annuities for the brand and core items for the consumer. This is not only essential for enhancing consumer perception and brand consideration, but also essential for the efficiency of the Reebok brand.
For this reason, Reebok is heavily investing into franchises, making them a key priority going forward. By 2020, Reebok expects footwear franchises to represent at least 25% of the brand’s total footwear business. Key franchises include performance products SEE GLOSSARY such as the CrossFit Nano or the recently launched FloatRide Run that have been authenticated by their respective communities, as well as styles that are unique to Reebok’s fitness DNA, such as the Classic Leather and the Freestyle. In apparel, Reebok has established franchises specifically for women, such as the Lux Tight, which debuted in 2017. 2018 will see the introduction of
further apparel franchises focused on the female Game Changers.
Reebok puts a strong emphasis on innovation. The brand is committed to maintaining a full and innovative product pipeline, bringing new technologies, styles and processes to life. In this context, 2018 will see the launch of the PureMove Bra, a revolutionary sports bra featuring patented fabric technology that adapts to movement and intensity. Beyond technology platforms, Reebok is further investing into innovation that consumers can relate to, fostered by unique collaborations and stories. For example, in 2017 the brand launched the Reebok Innovation Collective, a consumer-facing platform to highlight this type of storytelling. SEE INNOVATION, P. 78
MARKETING INVESTMENTS: AMPLIFYING BRAND PURPOSE AND DRIVING SCALEReebok is focused on creating inspirational marketing capabilities that build brand equity and consumer advocacy, while unleashing powerful brand messages. A key element of Reebok’s marketing and communication strategy is to connect emotionally to consumers through its ‘Be More Human’ platform, supported by a number of relevant assets and influencers in the digital ecosystem.
— Be More Human: Inspiring people to be their absolute best physically, mentally and socially is not only the brand’s guiding principle, but also the essence of Reebok’s global marketing campaign Be More Human. Launched in 2015, Be More Human celebrates everyday people who choose to embrace fitness and lead more fulfilling and less self-focused lives. A suite of films launched in 2017 marks the evolution of Be More Human, opening the aperture to even more types of fitness and people, but with the same message that physicality unlocks a better version of yourself. To celebrate the launch, ReebokONE trainers
ADID
AS
ANN
UAL
REPO
RT 2
017
0701 TO OUR SHAREHOLDERS 2 GROUP MANAGEMENT REPORT –
OUR COMPANY3 GROUP MANAGEMENT REPORT –
FINANCIAL REVIEW4 CONSOLIDATED FINANCIAL
STATEMENTS5 ADDITIONAL INFORMATION
CORPORATE STRATEGYReebok Brand Strategy

were available across several US cities, offering workouts in exchange for a simple handshake as a way to physically and socially connect people through fitness. The campaign is supported by ‘Stories of Progress’, an online collection of inspirational influencer testimonials, and related content at brand events, retailers and Reebok FitHub locations.
— Authentic and influential fitness assets: To amplify the brand and increase its relevance vis-à-vis the fitness consumer, Reebok has entered into a series of partnerships with some of the world’s most influential artists and athletes, such as Future, Gigi Hadid and J.J. Watt. In 2017, music artist Ariana Grande, actress Nina Dobrev and high-profile designer Victoria Beckham joined Reebok’s strong roster of brand ambassadors. In addition, to validate its authenticity as the best fitness brand in the world, Reebok has entered into partnerships with some of the fastest-growing and most innovative organizations in the fitness world, such as CrossFit, Ragnar, Midnight Runners and Les Mills. Finally, continuing to build relationships with fitness instructors is a crucial component of Reebok’s goal of connecting with the global fitness community. With over 100,000 fitness instructors currently being part of its global network, Reebok has made major progress towards its goal to be the brand of choice for instructors around the world.
— Digital ecosystem: Reebok is changing the way it operates digitally to realize maximum growth potential. The brand recognizes the need to be relevant and authentic in the digital ecosystem, particularly for women. As a result, this ecosystem is the main channel for communication and marketing initiatives as well as from a commercial perspective, providing experiences and products online. Reebok is focused on improving speed, usability and consumer experience on Reebok.com, both mobile and desktop, with 2018 seeing further enhancements to Reebok’s digital ecosystem.
ROLE OF THE CATEGORIESRunning, Training and Classics each play vital roles for the Game Changers. Consequently, Reebok is focusing on those three categories to amplify its impact on the fitness enthusiast and leverage commercial opportunities from major fitness activities to lifestyle. Reebok Running’s insight-driven and consumer-led approach supports authentic and desired cushioning experiences, leveraging innovative technologies for high-performance runners. Additionally, Reebok Running has also developed several contemporary silhouettes, which epitomize the intersection of innovation and style. Reebok Training remains central to Reebok’s Game Changer mindset and offers a complete range of both highly specialized and versatile products that are at the forefront of fitness and true to the culture and community that Game Changers train and live in. Reebok Classics fuses the brand’s fitness heritage with the modern looks of fitness reflected in Running and Training to support the Game Changer consumer who seeks to reflect a fitness lifestyle in every aspect of life.
‘MUSCLE UP’: REEBOK TRANSFORMATION STRENGTHENS BRAND FUNDAMENTALSOver the last years, Reebok has made major progress in its transformation from a general sports brand to a 100% fitness-focused brand. While Reebok has recorded top-line growth for several years in a row, the brand’s overall market share remains below levels seen in the past. In addition, there has been no growth in Reebok’s home market, North America, in the recent past and the brand’s margins are not accretive to the company’s overall profitability.
Therefore, and as announced in 2016, Reebok continued to execute upon its turnaround plan ‘Muscle Up’ in 2017, aimed at accelerating Reebok’s top-line growth in the US and improving its overall profitability. As part of this plan, the company has created one united team for Reebok in North America. As a result, Reebok’s global and US organizations
were merged under one leadership team to streamline Reebok’s organization and create an environment that is fully dedicated to fitness. In this context, Reebok moved its headquarters to a new location in the heart of the city of Boston during the course of 2017.
Furthermore, to win in North America, efficient and effective distribution is key to Reebok’s future success in this all-important market. The company has therefore accelerated its initiatives to streamline Reebok’s store base in the market. In total, the company will close nearly 50% of its own stores in the US market – both concept stores and factory outlets – with the majority of closures having been executed during 2017. At the same time, the brand is also streamlining its wholesale business, putting a clear focus on retailers helping Reebok to elevate brand equity and improve the quality of its growth.
In addition to streamlining Reebok’s organizational set-up and progressing on the brand’s turnaround efforts in the US market, an integral part of Muscle Up is focused on rethinking the core fundamentals of Reebok’s end-to-end operations. Initiatives span across product development, go-to-market initiatives and marketing effectiveness to measures that help accelerate Reebok’s product margins.
Executing against those initiatives will have a positive impact on Reebok’s operational and financial performance and will accelerate the brand’s top-line growth as well as significantly lift the brand’s profitability in the years to come. In 2017, the first full year of executing Muscle Up, Reebok has already realized meaningful profitability improvements, as reflected by the brand’s increase in gross margin of 4.0 percentage points to a level of 40.7%.AD
IDAS
AN
NUA
L RE
PORT
201
7
0711 TO OUR SHAREHOLDERS 2 GROUP MANAGEMENT REPORT –
OUR COMPANY3 GROUP MANAGEMENT REPORT –
FINANCIAL REVIEW4 CONSOLIDATED FINANCIAL
STATEMENTS5 ADDITIONAL INFORMATION
CORPORATE STRATEGYReebok Brand Strategy
SALES AND DISTRIBUTION STRATEGY
TRANSFORMING THE MARKETPLACEOur Global Sales function drives the commercial performance of the company by converting brand desire into profitable and sustainable business growth. It is our ambition to deliver the best shopping experience within the sporting goods industry across all consumer touchpoints. We strive to transform the marketplace by moving from managing the marketplace as it exists today toward shaping and growing our future destiny. Our objective is to establish scalable business solutions in order to deliver premium experiences, thereby meeting and surpassing consumer expectations with an integrated brand offering.
DRIVING OPERATIONAL EXCELLENCE ACROSS OUR GLOBAL MARKETSOur sales strategy is crafted by a centralized and integrated marketplace team which supports the flawless execution of our brand strategies and drives operational excellence across the globe. In this context, in 2017 we continued to execute our strategic business plan until 2020, ‘Creating the New’, across our nine global markets. During the course of 2017, we also completed all preparatory work to consolidate the markets Greater China, Japan, South Korea and South-East Asia/Pacific, creating one consolidated market for Asia Pacific (APAC). This will allow us to better serve the converging consumer and customer demands in the region in the years to come. In a changing global landscape, our diverse market portfolio is an important asset in maximizing the business, elevating our competitiveness and achieving our ambitions towards 2020.
SEAMLESS CONSUMER JOURNEY ACROSS OUR CHANNELS
With more than 2,500 own-retail stores, around 13,000 mono-branded franchise stores and approximately 150,000
wholesale doors, we have an unrivaled network of consumer touchpoints within our industry. In addition, through our own e-commerce channel, our single biggest store available to consumers in over 40 countries, we are leveraging a consistent global framework. We are also seeing considerable success in leveraging our strong cross-functional partnerships with key wholesale partners, which is critical for ensuring a consumer journey to the full extent. By seamlessly integrating the channels within our market portfolio, we are uniquely positioned to pursue and succeed in strategies that deliver premium consumer experiences and increase the productivity of our distribution footprint. As we replicate this model to capitalize on new consumer opportunities through own retail destinations (own retail stores and own e-commerce sites) as well as our wholesale partner doors (wholesale managed spaces and e-wholesale) we create halo effects across all consumer touchpoints, resulting in further marketplace expansion.
In 2017, we advanced our sales strategy with several initiatives focused, amongst others, on premium consumer experience, marketplace transformation and productivity of the sales platform.
Premium consumer experiencesWe aim to be ‘omni-present’ along the consumer journey and strive to capture the full sales potential on the platforms available to our consumers. We also strive to minimize occasions when consumer demand is not met, by offering innovative solutions. Based on these objectives, we focus on the following omni-channel initiatives:
— ‘Inventory Check’ which allows online shoppers to view in-store product availability.
— ‘Click & Collect’ which allows consumers to order online and purchase or reserve items for pick-up in a local store.
— ‘Ship from Store’ which allows us to service consumers faster than before by turning our stores into mini distribution centers.
— ‘Buy Online, Return to Store’ which not only provides consumers with a convenient way to return product purchases but also offers new buying opportunities.
— ‘Partner Program’ which enables us to expand our online offering to a larger group of consumers by making it available to selected key wholesale partners.
— ‘Endless Aisle’ which provides in-store visitors with access to our full range of products through our e-commerce platform.
— Our newly introduced ‘adidas shopping App’ is an always-on connection to the adidas brand and offers premium shopping experiences.
In 2017, we deployed a strategic mix of these capabilities across all our markets in our own-retail operations and at key wholesale partner locations. For example, based on the initial success of the Partner Program in 2016, we continued to onboard multiple partners across Western Europe and North America in 2017. In addition, 2017 saw the successful introduction of the adidas shopping App in Western Europe and the US. The App is directly linked to the adidas e-commerce store and provides consumers with personal conversations, a frictionless checkout, seamless order tracking as well as personalized content. The success of the App will be significantly enhanced by continued investments in Customer Relationship Management (CRM), which will enable us to develop a deeper consumer understanding and connection.
Marketplace transformation Our goal is to leverage and scale the success of our initiatives across our channels to better serve consumers. The key contributor to this approach is controlled space. Whenever we can actively manage the way our brands and products are presented at the point of sale, the impact on the consumer
ADID
AS
ANN
UAL
REPO
RT 2
017
0721 TO OUR SHAREHOLDERS 2 GROUP MANAGEMENT REPORT –
OUR COMPANY3 GROUP MANAGEMENT REPORT –
FINANCIAL REVIEW4 CONSOLIDATED FINANCIAL
STATEMENTS5 ADDITIONAL INFORMATION
CORPORATE STRATEGYSales and Distribution Strategy

experience, and ultimately on our operational and financial performance, is significant. We have the power to do so in own retail (including e-commerce) and in wholesale (franchise stores, wholesale managed space and in e-wholesale). By 2020, we aim to generate more than 60% of our revenues through controlled space.
For us, own retail acts as a catalyst to our controlled space ambition. We amplify our success in own retail by translating key learnings to franchise stores and expanding franchising as a business model in existing as well as into new geographies. After the successful launch of our adidas flagship store in New York City in 2016, we opened our biggest ever adidas Originals flagship store in Chicago in 2017. We expect these flagships to set new standards in terms of product presentation, execution and service that will be replicated across all other channels. We expect e-commerce to continue to be the fastest-growing channel that we operate, with revenues forecast to grow to € 4 billion in 2020. In wholesale, we will continue to expand our footprint with a focus on prioritized key accounts, targeting important consumer hotspots and trade zones, especially those that are part of our Cities initiative. Strategic partnerships to operate controlled space remain an important thrust of this expansion.
Cities and trade zonesIn 2017, we saw continued success in New York City, Los Angeles, Paris, London, Shanghai and Tokyo. The combined revenue growth for our six key cities outpaced the company's overall top-line development. In addition, our Net Promoter Score (NPS) SEE GLOSSARY relatively outperformed in most of these key cities. To further drive momentum, we will continue to prioritize consumer insights, retail executions and wholesale partnerships across those cities. We have also started to focus on those cities by looking at them on a trade zone level, rather than on a key account and key doors perspective. Our intention is to create one holistic premium
shopping experience for our consumers within these key commercial areas across all identified distribution points of wholesale and own retail. The learnings from this transformation program provide a further boost to our Cities strategic choice and enable us to scale this opportunity up, by rolling it out to a much greater number of cities where we will apply a focus of investments in areas where our focus consumers live, play and shop.
Specialty Sales In 2017, we established the Specialty Sales organization. The objective of this organization is to drive brand heat and desire in boutiques and sneaker stores, thereby directly catering to our most influential consumers. The team provides superior service levels, customized range access across selected categories, such as running and Originals, as well as exceptional campaign roll-outs across the globe and has a clear alignment with our key cities and trade zones. Following initial success in 2017, with strong growth generated in boutiques and sneaker stores, we will continue to focus on growing our Specialty Sales initiatives in 2018 and beyond.
Productivity and efficiency of sales platformWe are committed to further driving productivity improvements across our sales platform through a multi-faceted approach:
— Premium presentation: Our physical selling spaces are an important factor in driving Net Promoter Score (NPS) and full-price sell-through. We further evolved the brand experience through the launch and expansion of premium store concepts such as Stadium SEE GLOSSARY and Neighbourhood SEE GLOSSARY for the adidas brand as well as FitHub SEE GLOSSARY for the Reebok brand. Our own-retail concepts are designed for scalability. Consequently, we will continue to roll them out across our store base, which yields benefits across channels, considering the positive spillover impact on our wholesale and franchise partners.
— Consumer service excellence: In 2017, we established the Sales Academy. The program helps us to transform the culture and effectiveness of our sales teams. As a result, consumers enjoy significantly elevated service levels which have proven commercially rewarding through higher conversion rates SEE GLOSSARY and increased average selling prices.
— Personalized interaction: Our commitment to deliver a premium shopping experience is reflected online through our digital brand flagship stores, adidas.com and reebok.com, as well as our newly created adidas shopping App. E-commerce and digital communication are powerful tools for our brands to engage with consumers.
— Insight-driven decision-making: We continue to invest in our analytical capabilities and technical infrastructure to become faster and more insight-driven in decision-making. Leveraging data such as cross-channel product sell-through and consumer purchasing behaviors delivers actionable insights in areas such as assortment planning and product life cycle management.
— Distribution channel mix: Based on a thorough analysis of the profitability of our distribution channels in each of our markets, in 2017 we started an optimization program to shift focus and resources to our most profitable channels. By doing so, we aim at further improving the distribution mix of our company and consequently the efficiency of our Global Sales organization.
We are confident that our sales strategy will help us realize significant improvements in brand desirability, as measured by our NPS, net sales, market share and profitability.
SEE INTERNAL MANAGEMENT SYSTEM, P. 102
ADID
AS
ANN
UAL
REPO
RT 2
017
0731 TO OUR SHAREHOLDERS 2 GROUP MANAGEMENT REPORT –
OUR COMPANY3 GROUP MANAGEMENT REPORT –
FINANCIAL REVIEW4 CONSOLIDATED FINANCIAL
STATEMENTS5 ADDITIONAL INFORMATION
CORPORATE STRATEGYSales and Distribution Strategy

GLOBAL OPERATIONS Global Operations manages the development, production
planning, sourcing and distribution of the vast majority of our products. The function strives to increase efficiency throughout the company’s supply chain and ensures the highest standards in product quality, availability and delivery for our customers as well as our own-retail and e-commerce activities at competitive costs.
CLEARLY DEFINED PRIORITIES FOR GLOBAL OPERATIONSGlobal Operations delivers upon its mission to create the best product by focusing on innovative materials and manufacturing capabilities as well as to provide the best service by enabling product availability as the consumer chooses through the company’s omni-channel approach to supply chain agility.
The strategy of Global Operations is an extension of the overall adidas strategy – thus the consumer is at the center of everything we do. The function strengthens brand desirability by providing the right product to consumers – in the right quality, size, color and style, in the right place, at the right time, across the entire range of the company’s channels and brands. Additionally, Global Operations builds capabilities that further improve supply chain efficiencies, while mitigating costs, thereby ensuring a continuously competitive supply chain.
Within our strategic business plan ‘Creating the New’, Global Operations focuses on delivering against three strategic priorities driven by several initiatives:
— Become the first fast sports company. — Create a seamless consumer experience. — Transform the way we create and manufacture.
By delivering on these priorities, Global Operations leverages efficiencies across infrastructure and processes and ensures a competitive digital ecosystem and supply chain. This continues to be underlined by our ‘On-Time In-Full’ (OTIF) metric, a non-financial KPI for our company, measuring the adidas delivery performance toward our customers and our own-retail stores. SEE INTERNAL MANAGEMENT SYSTEM, P. 102 In 2017, adidas delivered 78% of its adidas and Reebok brand products ‘on time’ and ‘in full’ (2016: 77%), which is broadly in line with the overall target of around 80%. For 2018, Global Operations strives to increase OTIF further towards the targeted 80% level. OTIF was measured for 74% of net sales of all adidas and Reebok brand products in 2017. It is also planned to further roll out OTIF to those markets that are currently not in scope, thereby increasing the overall share of adidas and Reebok brand products measured against ‘on time’ and ‘in full’.
BECOME THE FIRST FAST SPORTS COMPANY‘Speed’ is a strategic priority for the company. Our ambition is to be the first fast sports company in the sporting goods industry. SEE CORPORATE STRATEGY, P. 62 Global Operations is a key enabler for this by leveraging market and sell-through data in new ways as well as by responding quickly to deliver concepts that are fresh and desirable and made available
when and where they are wanted by the consumer across our wholesale, retail and e-commerce channels. Bringing products to market faster allows our customers and direct-to-consumer channel to place orders closer to the actual time of sale, facilitating buying decisions that are based on better market knowledge. Consequently, we will move away from predominantly developing products in advance of seasonal merchandising calendars and toward creation and production capabilities that respond to consumer demands with in-season development and rapid replenishment manufacturing. Fresher and more desirable products will increase the company’s full-price share of sales and reduce the risk of overbuying. In 2017, we made further progress around our Speed strategic priority and we are well on track to achieve our target of at least 50% of the company’s net sales through speed-enabled articles by 2020. For this part of our business, we expect to achieve a 20% higher share of full-price sales compared to the regular range which, driven by higher brand and product desirability, will also see significant increases in the full-price sell-through.
In 2017, Global Operations continued to expand its efforts to ‘enable later ordering’ and further reduced production lead times. The function succeeded in providing 60 days or less production lead times on approximately 80% of apparel
Global Operations in go-to-market process 15
Global Operations
Marketing
Briefing
Design
Concept
ProductDevelopment
Product Creation
Sourcing
Manufacturing
Supply ChainManagement
Distribution
GlobalSales
Sales
ADID
AS
ANN
UAL
REPO
RT 2
017
0741 TO OUR SHAREHOLDERS 2 GROUP MANAGEMENT REPORT –
OUR COMPANY3 GROUP MANAGEMENT REPORT –
FINANCIAL REVIEW4 CONSOLIDATED FINANCIAL
STATEMENTS5 ADDITIONAL INFORMATION
GLOBAL OPERATIONS

volumes throughout the year. The vast majority of footwear (around 85%) and hardware (around 95%) volumes are already on 60 days or less production lead times. In addition to shortening our overall production lead times, Global Operations has scaled its fast replenishment capabilities of best-selling articles, creating more articles within seasons based on actual sell-through data and ensuring constant availability of long lifecycle products. Across all product categories, replenishment capabilities have been established on 30 days production lead times. Even faster production lead times of on average less than 10 days have been established for customized footwear products, which are available via our own e-commerce website.
adidas is leveraging its strengths in sourcing and partnering with industrial and academic experts to develop smart manufacturing solutions that can react quickly to consumer trends. In this context, Speedfactory SEE GLOSSARY is one initiative, aimed at moving production closer to key markets while developing high-quality performance products faster than ever before. Powered by end-to-end automated manufacturing processes and innovative materials, Speedfactory allows us to support the growing demand for product personalization in a socially and environmentally responsible way. In addition, it helps us to provide faster reaction times to consumer needs and to enhance the consumer experience, by enabling consumers to co-create in an interactive production process. Insights gained from our Speedfactories will enable us to drive digital manufacturing also into our existing supply chain. SEE CORPORATE STRATEGY, P. 62
CREATE A SEAMLESS CONSUMER EXPERIENCEGlobal Operations has a strong track record for establishing state-of-the-art infrastructure, processes and systems that are required to support the company’s growth ambition. It has been successfully consolidating and improving legacy structures, thereby reducing complexity and costs for the
company. The function is focused on innovative distribution capabilities, with the goal of providing the best service by enabling product availability as the consumer chooses through the omni-channel approach to supply chain agility.
By creating a higher commonality of our products across the various channels, Global Operations ensures higher flexibility at each consumer touchpoint. This, in turn, enables a broader range of products to be available at the point of sale, including online orders able to be picked up in our own-retail stores or shipped from a store and own-retail stores able to sell inventory available in other own-retail stores. SEE SALES AND
DISTRIBUTION STRATEGY, P. 72
In 2017, Global Operations focused on further optimizing its distribution center network, while at the same time preparing it for future consumer demand and supporting the company’s overall growth ambition. In this context, in 2017 we continued to build two new distribution centers in Rieste/Germany and Suzhou/China - both of which are expected to go live in 2018. In addition, we started with the construction of a new distribution center in Pennsylvania/USA and began to expand our existing West Coast facility, aimed at supporting our future growth expectations for North America, in particular around the company’s e-commerce and own-retail businesses. Lastly, to improve our consumer service in the UK, 2018 will see the addition of a new e-commerce facility to our existing distri bution network in the market.
TRANSFORM THE WAY WE CREATE AND MANUFACTUREGlobal Operations is driving innovation in new materials, new product constructions and new ways of manufacturing that deliver consumer value and enable competitive advantage. By investing in tools that more directly connect design and factory production, Global Operations is changing traditional models of development to deliver constant freshness and
increased speed-to-market capabilities. At the same time, the function also plays a critical role in driving operational efficiency for the company. In particular, through material and packaging consolidation, Global Operations aims at mitigating material and labor costs.
We constantly look for the next generation of materials by focusing, amongst others, on knitted footwear, direct-to-textile digital printing and sustainable materials. Building on our successful partnership with Parley for the Oceans SEE
GLOSSARY, 2017 saw the introduction of new footwear and apparel products using sustainable materials. In 2018, we will continue to roll out Parley Ocean Plastic SEE GLOSSARY across our key categories, with running footwear and football apparel playing a major role. To facilitate the growing demand for Parley Ocean Plastic we are in the process of establishing an operations set-up dedicated to sustainable material sourcing.
SEE SUSTAINABILITY, P. 88
Through its focus on ‘Digital Creation’, Global Operations has already started to improve the product creation process from concept to shelf. Based on 3D software tools, we are today able to look at product solutions the way the consumer sees them at an early stage during the creation process. This enables creation teams to iterate faster, take product decisions quicker and reduce drop rates SEE GLOSSARY. In addition, 3D technology allows for more frequent and rapid virtual product iterations without increasing the need for physical samples. After testing 3D software tools across all major business units in 2016, many of our business units have started to leverage 3D technology as a new way of working in the product creation process during 2017.
In addition to focusing on managing a more concentrated portfolio of key footwear franchises, Global Operations also continues to implement its modular approach to our apparel business. Transitioning to a set pre-season selection of
ADID
AS
ANN
UAL
REPO
RT 2
017
0751 TO OUR SHAREHOLDERS 2 GROUP MANAGEMENT REPORT –
OUR COMPANY3 GROUP MANAGEMENT REPORT –
FINANCIAL REVIEW4 CONSOLIDATED FINANCIAL
STATEMENTS5 ADDITIONAL INFORMATION
GLOBAL OPERATIONS
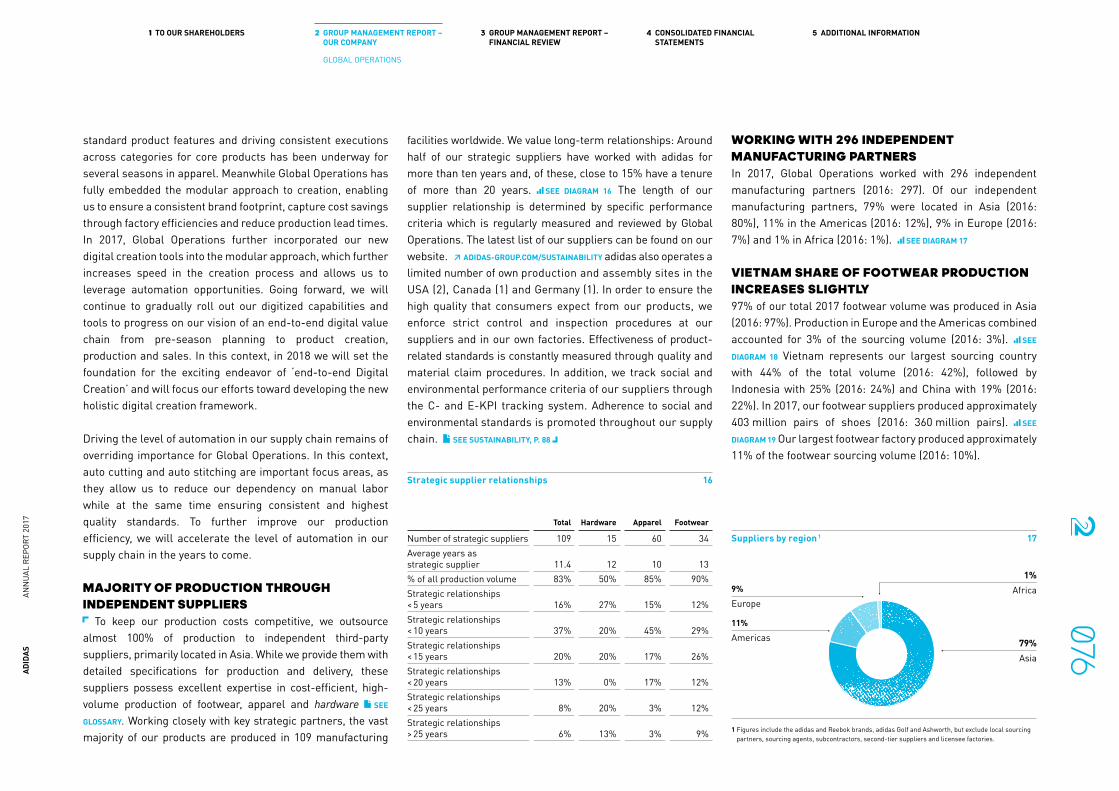
standard product features and driving consistent executions across categories for core products has been underway for several seasons in apparel. Meanwhile Global Operations has fully embedded the modular approach to creation, enabling us to ensure a consistent brand footprint, capture cost savings through factory efficiencies and reduce production lead times. In 2017, Global Operations further incorporated our new digital creation tools into the modular approach, which further increases speed in the creation process and allows us to leverage automation opportunities. Going forward, we will continue to gradually roll out our digitized capabilities and tools to progress on our vision of an end-to-end digital value chain from pre-season planning to product creation, production and sales. In this context, in 2018 we will set the foundation for the exciting endeavor of ‘end-to-end Digital Creation’ and will focus our efforts toward developing the new holistic digital creation framework.
Driving the level of automation in our supply chain remains of overriding importance for Global Operations. In this context, auto cutting and auto stitching are important focus areas, as they allow us to reduce our dependency on manual labor while at the same time ensuring consistent and highest quality standards. To further improve our production efficiency, we will accelerate the level of automation in our supply chain in the years to come.
MAJORITY OF PRODUCTION THROUGH INDEPENDENT SUPPLIERS
To keep our production costs competitive, we outsource almost 100% of production to independent third-party suppliers, primarily located in Asia. While we provide them with detailed specifications for production and delivery, these suppliers possess excellent expertise in cost-efficient, high-volume production of footwear, apparel and hardware SEE
GLOSSARY. Working closely with key strategic partners, the vast majority of our products are produced in 109 manufacturing
facilities worldwide. We value long-term relationships: Around half of our strategic suppliers have worked with adidas for more than ten years and, of these, close to 15% have a tenure of more than 20 years. SEE DIAGRAM 16 The length of our supplier relationship is determined by specific performance criteria which is regularly measured and reviewed by Global Operations. The latest list of our suppliers can be found on our website. ↗ ADIDAS-GROUP.COM/SUSTAINABILITY adidas also operates a limited number of own production and assembly sites in the USA (2), Canada (1) and Germany (1). In order to ensure the high quality that consumers expect from our products, we enforce strict control and inspection procedures at our suppliers and in our own factories. Effective ness of product-related standards is constantly measured through quality and material claim procedures. In addition, we track social and environmental performance criteria of our suppliers through the C- and E-KPI tracking system. Adherence to social and environ mental standards is promoted throughout our supply chain. SEE SUSTAINABILITY, P. 88
WORKING WITH 296 INDEPENDENT MANUFACTURING PARTNERSIn 2017, Global Operations worked with 296 independent manufacturing partners (2016: 297). Of our independent manufacturing partners, 79% were located in Asia (2016: 80%), 11% in the Americas (2016: 12%), 9% in Europe (2016: 7%) and 1% in Africa (2016: 1%). SEE DIAGRAM 17
VIETNAM SHARE OF FOOTWEAR PRODUCTION INCREASES SLIGHTLY97% of our total 2017 footwear volume was produced in Asia (2016: 97%). Production in Europe and the Americas combined accounted for 3% of the sourcing volume (2016: 3%). SEE
DIAGRAM 18 Vietnam represents our largest sourcing country with 44% of the total volume (2016: 42%), followed by Indonesia with 25% (2016: 24%) and China with 19% (2016: 22%). In 2017, our footwear suppliers produced approximately 403 million pairs of shoes (2016: 360 million pairs). SEE
DIAGRAM 19 Our largest footwear factory produced approximately 11% of the footwear sourcing volume (2016: 10%).
Suppliers by region 1 17
1 Figures include the adidas and Reebok brands, adidas Golf and Ashworth, but exclude local sourcing partners, sourcing agents, subcontractors, second-tier suppliers and licensee factories.
9%Europe
11%Americas 79%
Asia
1%Africa
Strategic supplier relationships 16
Total Hardware Apparel Footwear
Number of strategic suppliers 109 15 60 34Average years as strategic supplier 11.4 12 10 13% of all production volume 83% 50% 85% 90%Strategic relationships < 5 years 16% 27% 15% 12%Strategic relationships < 10 years 37% 20% 45% 29%Strategic relationships < 15 years 20% 20% 17% 26%Strategic relationships < 20 years 13% 0% 17% 12%Strategic relationships < 25 years 8% 20% 3% 12%Strategic relationships > 25 years 6% 13% 3% 9%
ADID
AS
ANN
UAL
REPO
RT 2
017
0761 TO OUR SHAREHOLDERS 2 GROUP MANAGEMENT REPORT –
OUR COMPANY3 GROUP MANAGEMENT REPORT –
FINANCIAL REVIEW4 CONSOLIDATED FINANCIAL
STATEMENTS5 ADDITIONAL INFORMATION
GLOBAL OPERATIONS

CHINA REMAINS LARGEST SOURCE COUNTRY FOR APPARELIn 2017, we sourced 93% of the total apparel volume from Asia (2016: 93%). The Americas represented 4% of the volume, Europe 3% and Africa 1% (2016: the Americas 3%, Europe 4% and Africa less than 1%). SEE DIAGRAM 20 China is the largest source country, representing 23% of the produced volume (2016: 27%), followed by Cambodia with 22% (2016: 22%) and Vietnam with 18% (2016: 17%). In total, our suppliers produced approximately 404 million units of apparel in 2017 (2016:
382 million units). SEE DIAGRAM 21 The largest apparel factory produced approximately 10% of this apparel volume in 2017 (2016: 11%).
CHINA SHARE OF HARDWARE PRODUCTION INCREASES In 2017, 82% of our hardware products, such as balls and bags, was produced in Asia (2016: 79%). European countries accounted for 16% (2016: 18%), while the Americas represented 2% of the total volume (2016: 3%). SEE DIAGRAM 22
China remained our largest source country, accounting for 40% of the sourced volume (2016: 36%), followed by Pakistan and Turkey with 18% and 15%, respectively (2016: 17% and 16%, respectively). The total hardware sourcing volume was approximately 110 million units (2016: 109 million units), with the largest factory accounting for 15% of production (2016: 12%). SEE DIAGRAM 23
Apparel production by region 1 20
1 Figures include the adidas and Reebok brands, adidas Golf and Ashworth.
Hardware production by region 1 22
1 Figures include the adidas and Reebok brands, adidas Golf and Ashworth.
Hardware production 1, 2 in million units 23
2017 1102016 1092015 1132014 992013 94
1 Figures include the adidas and Reebok brands, adidas Golf and Ashworth.2 2013 restated due to a reclassification of certain apparel accessories from apparel to hardware.
Apparel production 1, 2 in million units 21
2017 4042016 3822015 3642014 3092013 292
1 Figures include the adidas and Reebok brands, adidas Golf and Ashworth.2 2013 restated due to a reclassification of certain apparel accessories from apparel to hardware.
4%Americas
3%Europe
16%Europe
93%Asia
82%Asia
1%Africa
2%Americas
Footwear production1 in million pairs 19
2017 4032016 3602015 3012014 2582013 256
1 Figures include the adidas and Reebok brands, adidas Golf and Ashworth.
Footwear production by region 1 18
1 Figures include the adidas and Reebok brands, adidas Golf and Ashworth.
2%Americas
1%Europe
97%Asia
ADID
AS
ANN
UAL
REPO
RT 2
017
0771 TO OUR SHAREHOLDERS 2 GROUP MANAGEMENT REPORT –
OUR COMPANY3 GROUP MANAGEMENT REPORT –
FINANCIAL REVIEW4 CONSOLIDATED FINANCIAL
STATEMENTS5 ADDITIONAL INFORMATION
GLOBAL OPERATIONS
INNOVATIONCreating innovative products to meet the needs of professional and everyday athletes as well as consumers is a prerequisite to strengthening our market position in the sporting goods industry and a premise to being the best sports company in the world. We therefore remain highly committed to maintaining a full and innovative product pipeline, bringing new groundbreaking technologies and processes to life, investing into forward-looking and sustainable ways of production and exploring the many possibilities of digitalization across our entire value chain. True to the vision of creative collaboration, our innovation approach is widely based on our Open Source mindset which is clearly visible in our numerous collaborations with athletes and consumers, universities, industry-leading companies as well as national and international governments and research organizations.
MEETING THE NEEDS AND EXPECTATIONS OF OUR CONSUMERInnovation within the company follows a decentralized approach. In line with their respective strategic and long-term visions and distinctive positioning, each brand runs its own innovation activities. However, fundamental research as well as expertise and competencies in sustainable product creation are shared across the company.
For the adidas brand, innovation is focused on meeting the needs and expectations of our consumer. The modern innovation landscape extends beyond product and increasingly requires innovation teams to consider the development of experiences and services and to provide greater levels of transparency and direct integration of our consumer through co-creation. In partnership with our consumer insight teams, foresight and trend analysis efforts are shared on an ongoing basis, documenting shifts in society
and culture. This provides the starting point to build concepts of relevance.
The FUTURE team at adidas is tasked to develop a strong portfolio of innovation capabilities such as new materials, production processes and consumer-centric scientific research to provide a platform for meaningful concept development. Projects are incubated within the company and aligned to the broader sourcing, marketing, creative and strategic functions across the organization, ensuring a robust and impactful innovation pipeline.
To further strengthen long-term research capabilities, adidas implemented a centralized project team in 2017 in order to drive the process for the application and management of publicly funded research projects. Located within the FUTURE team, the team is responsible to collaborate with governmental organizations on local, national and European level to develop key projects with strong consortia partners, tackling major societal challenges that will impact our consumer and industry.
This approach also reflects our commitment to the Open Source mindset, where we seek to build value together with athletes and consumers, universities, industry-leading companies as well as national and international governments and research organizations. In addition to opening up our doors to valuable feedback, we also get inspired by and receive input from knowledgeable and valued partners. Whether we work with Parley for the Oceans on products partially created from upcycled plastic waste ('Parley Ocean Plastic' SEE GLOSSARY), intercepted before it reaches the ocean from beaches and coastal communities, with BASF, the world’s leading chemical company, on Boost, an industry-first cushioning technology designed to deliver maximum energy return, responsiveness and comfort to athletes, or Speedfactory, a revolutionary automated production concept
in cooperation with Oechsler AG, Manz AG, BASF and Kurtz Ersa – we will continue to unlock further potential through collaborations. In addition to these already established partnerships, we announced a new collaboration with Siemens, a global leader in the fields of industry, energy and healthcare, as well as for infrastructure solutions, to drive the digitalization of Speedfactory. In addition, we commenced a partnership with Carbon, a Silicon Valley-based tech company working to revolutionize product creation through hardware, software and molecular science, to enable mass production of additively manufactured components, coming to life in the Futurecraft 4D, the first performance footwear crafted with light and oxygen.
FIVE PILLARS OF INNOVATIONWithin our innovation principles, we identified five strategic pillars, which enable us to develop the best products and experiences for athletes and consumers, while at the same time drive game-changing innovations in the fields of manufacturing, digital and sustainability.
Athlete innovationOur clear focus is to produce the best and most innovative products for athletes to enable them to perform at their very best. To achieve this, we work closely together with athletes and teams as well as numerous universities and industry-leading companies, to deliver against the needs of our target consumer.
Manufacturing innovationTo simplify manufacturing, enable product innovation and increase speed-to-market capabilities by bringing the production of apparel and footwear closer to the consumer, the company’s innovation activities are also focused on new manufacturing technologies. Our goal is to combine state-of-the-art information technology with new manufacturing processes and innovative products. For this reason, we
ADID
AS
ANN
UAL
REPO
RT 2
017
0781 TO OUR SHAREHOLDERS 2 GROUP MANAGEMENT REPORT –
OUR COMPANY3 GROUP MANAGEMENT REPORT –
FINANCIAL REVIEW4 CONSOLIDATED FINANCIAL
STATEMENTS5 ADDITIONAL INFORMATION
INNOVATION

commit ourselves to long-term cooperation with industry-leading companies and organizations to take a leading role in manufacturing innovation.
Digital and experience innovation The adidas brand was amongst the first in the industry to comprehensively bring data analytics to the athlete. With decades of continuous investment in sports science, sensor technology and digital communication platforms, adidas has already taken a leading role in terms of changing the sporting goods industry through technology. With the increasing speed of digitalization, this field will remain one of our core areas.
Sustainability innovationOur commitment to manage our business in a responsible way has long been one of the company’s principles. To stay at the forefront of sustainable innovation, adidas is pursuing a proactive approach to establish internationally recognized best practices and achieve scalable improvements. As part of our sustainability roadmap we have set ourselves the target for 2020 to invest in materials, processes and innovative machinery which will allow us to upcycle materials into products and reduce waste. SEE SUSTAINABILITY, P. 88
Female athlete innovationOur long-term commitment to the female athlete continues to be a focus for the company. To fuel the growth of our women’s business, we have taken a holistic approach to understanding the female athlete’s performance and non-performance needs throughout her active life by looking at this target group as an integrated part of our business but from a separate and unique angle. With a focus on the female athlete, it is crucial to fully understand the particular anatomy and specific product needs of the female consumer to help unlock her full potential. To enable this, we are working to establish a robust network of industry leaders and academic experts with our ‘Path to Expert’ approach, which will help to accelerate the
building of insights and foresights that keep us at the forefront of product innovation.
SUCCESSFUL COMMERCIALIZATION OF INNOVATIONSWe believe developing industry-leading technologies and user experiences is only one aspect of being an innovation leader. Equally important is the successful commercialization of those technological innovations:
Futurecraft 4D: High-performance footwear featuring midsoles crafted with light and oxygen using Digital Light Synthesis, a technology led by Carbon. The Futurecraft 4D’s midsole pioneers a digital footwear component creation process that eliminates the necessity of traditional prototyping or molding. With the new technology, adidas now operates on a completely different manufacturing scale and sport performance quality, officially departing from 3D printing and bringing additive manufacturing in the sports industry into a new dimension. Ultimately, adidas aims to create more than 100,000 pairs of this high-performance footwear by the end of 2018.
adizero Sub2: A high-performance marathon shoe created to take athletes below the two-hour barrier. It explores the performance of a range of state-of-the-art materials in different temperatures and environments and on different surfaces. The shoe delivers the best of adidas running technology in an extremely fast, lightweight form and marks the debut of adidas’ new Boost Light innovation. Engineered specifically for elite athletes on race day, Boost Light is the brand’s lightest-ever foam and retains the industry-leading energy return.
UltraBOOST X: A lightweight running shoe for the female runner, featuring a Boost midsole, an adaptive arch as well as a Primeknit upper for perfect fit and flexibility. The ARAMIS system, a motion tracking technology that enables a detailed
analysis into the movement of the body, was used to allow adidas’ innovation teams to see exact points where female runners need the most support and where their foot needs room for natural expansion. This process led to the unique design of the UltraBOOST X shoe.
AM4 Series: The first major project to be created at the adidas Speedfactory facility in Ansbach, Germany and in 2018 also in Atlanta, USA. The adidas Made For London (AM4LDN) and the adidas Made for Paris (AM4PAR) shoes are the first in a series of individually designed and manufactured running shoes adidas will release in six key cities around the world. In the coming months, Los Angeles, New York, Tokyo and Shanghai will also have bespoke product created tailored to the unique demands and using local market insight of each respective city.
Prime SP Parley: The first 3D knitted sprint spike, created with plastic taken from beaches and coastal communities before reaching the oceans. The silhouette focuses both on the needs of sprinters, by incorporating a Primeknit upper for support and a laser-welded frame for reduced weight, and on the needs of the world, by integrating Parley Ocean Plastic and protecting our oceans from marine plastic pollution.
adidas Alphaskin: A new base-layer technology constructed to match the body’s movements in sport. Alphaskin was developed using the ARAMIS motion-capture system instead of a traditional static mannequin for testing, in order to find out where fabric constrains an athlete’s performance. The new design eliminates seams to help athletes focus on their performance in competition and training. Alphaskin offers kinetic wrapping in a range of compression levels that suit each athlete’s personal preference.
Reebok Floatride Run: The first shoe featuring Reebok’s new Floatride Foam technology. The unique and consistent cell structure of Floatride Foam delivers soft, responsive
ADID
AS
ANN
UAL
REPO
RT 2
017
0791 TO OUR SHAREHOLDERS 2 GROUP MANAGEMENT REPORT –
OUR COMPANY3 GROUP MANAGEMENT REPORT –
FINANCIAL REVIEW4 CONSOLIDATED FINANCIAL
STATEMENTS5 ADDITIONAL INFORMATION
INNOVATION
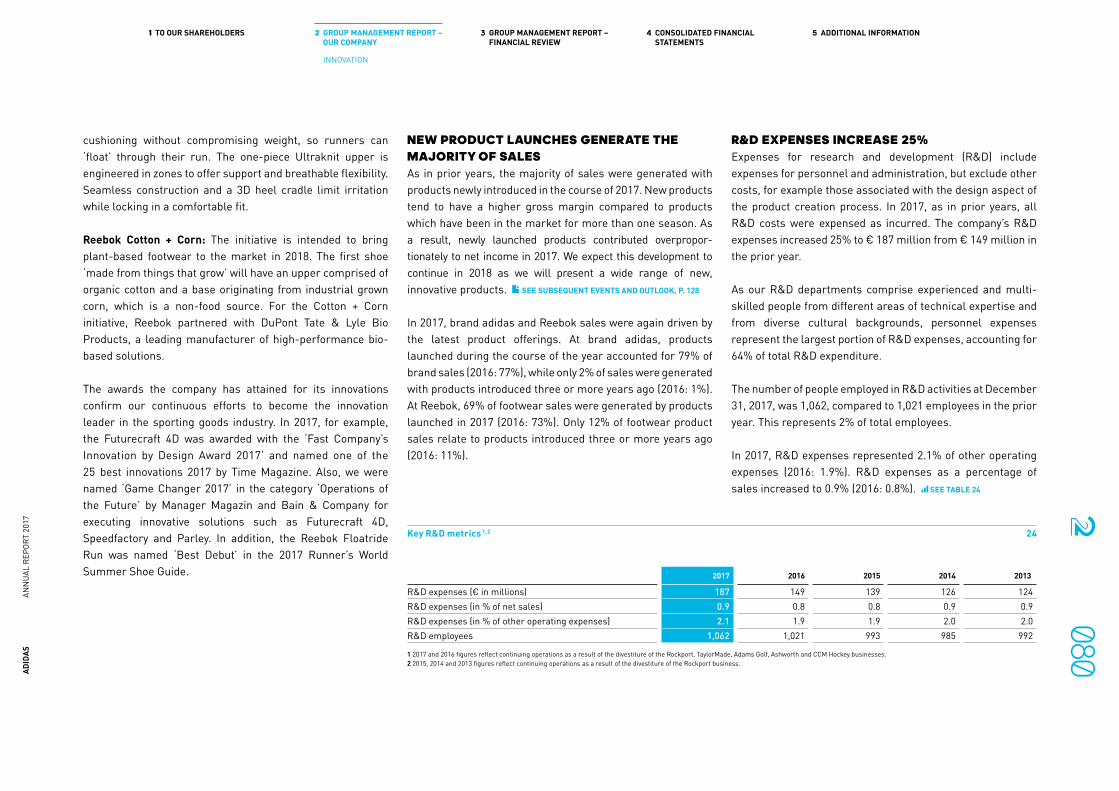
cushioning without compromising weight, so runners can ‘float’ through their run. The one-piece Ultraknit upper is engineered in zones to offer support and breathable flexibility. Seamless construction and a 3D heel cradle limit irritation while locking in a comfortable fit.
Reebok Cotton + Corn: The initiative is intended to bring plant-based footwear to the market in 2018. The first shoe ‘made from things that grow’ will have an upper comprised of organic cotton and a base originating from industrial grown corn, which is a non-food source. For the Cotton + Corn initiative, Reebok partnered with DuPont Tate & Lyle Bio Products, a leading manufacturer of high-performance bio-based solutions.
The awards the company has attained for its innovations confirm our continuous efforts to become the innovation leader in the sporting goods industry. In 2017, for example, the Futurecraft 4D was awarded with the ‘Fast Company’s Innovation by Design Award 2017’ and named one of the 25 best innovations 2017 by Time Magazine. Also, we were named ‘Game Changer 2017’ in the category ‘Operations of the Future’ by Manager Magazin and Bain & Company for executing innovative solutions such as Futurecraft 4D, Speedfactory and Parley. In addition, the Reebok Floatride Run was named ‘Best Debut’ in the 2017 Runner’s World Summer Shoe Guide.
NEW PRODUCT LAUNCHES GENERATE THE MAJORITY OF SALESAs in prior years, the majority of sales were generated with products newly introduced in the course of 2017. New products tend to have a higher gross margin compared to products which have been in the market for more than one season. As a result, newly launched products contributed overpro por-tionately to net income in 2017. We expect this development to continue in 2018 as we will present a wide range of new, innovative products. SEE SUBSEQUENT EVENTS AND OUTLOOK, P. 128
In 2017, brand adidas and Reebok sales were again driven by the latest product offerings. At brand adidas, products launched during the course of the year accounted for 79% of brand sales (2016: 77%), while only 2% of sales were generated with products introduced three or more years ago (2016: 1%). At Reebok, 69% of footwear sales were generated by products launched in 2017 (2016: 73%). Only 12% of footwear product sales relate to products introduced three or more years ago (2016: 11%).
R&D EXPENSES INCREASE 25%Expenses for research and development (R&D) include expenses for personnel and administration, but exclude other costs, for example those associated with the design aspect of the product creation process. In 2017, as in prior years, all R&D costs were expensed as incurred. The company’s R&D expenses increased 25% to € 187 million from € 149 million in the prior year.
As our R&D departments comprise experienced and multi-skilled people from different areas of technical expertise and from diverse cultural backgrounds, personnel expenses represent the largest portion of R&D expenses, accounting for 64% of total R&D expenditure.
The number of people employed in R&D activities at December 31, 2017, was 1,062, compared to 1,021 employees in the prior year. This represents 2% of total employees.
In 2017, R&D expenses represented 2.1% of other operating expenses (2016: 1.9%). R&D expenses as a percentage of sales increased to 0.9% (2016: 0.8%). SEE TABLE 24
Key R&D metrics 1, 2 24
2017 2016 2015 2014 2013
R&D expenses (€ in millions) 187 149 139 126 124R&D expenses (in % of net sales) 0.9 0.8 0.8 0.9 0.9R&D expenses (in % of other operating expenses) 2.1 1.9 1.9 2.0 2.0R&D employees 1,062 1,021 993 985 992
1 2017 and 2016 figures reflect continuing operations as a result of the divestiture of the Rockport, TaylorMade, Adams Golf, Ashworth and CCM Hockey businesses.2 2015, 2014 and 2013 figures reflect continuing operations as a result of the divestiture of the Rockport business.
ADID
AS
ANN
UAL
REPO
RT 2
017
0801 TO OUR SHAREHOLDERS 2 GROUP MANAGEMENT REPORT –
OUR COMPANY3 GROUP MANAGEMENT REPORT –
FINANCIAL REVIEW4 CONSOLIDATED FINANCIAL
STATEMENTS5 ADDITIONAL INFORMATION
INNOVATION

PEOPLE AND CULTUREAt adidas, we believe that our people are the key to the company’s success. Their performance, well-being and knowledge have a significant impact on brand desire, consumer satisfaction and, ultimately, our financial performance. Through the delivery of our People Strategy, we focus our efforts on four fundamentals: the attraction and retention of the right talents, role model leadership, diversity and inclusion, as well as the creation of a unique corporate culture.
PEOPLE STRATEGY ENABLES A CULTURE FOR DELIVERING ‘CREATING THE NEW’
As an integral part of our corporate strategy ‘Creating the New’, the People Strategy is a testament to thinking that our 2020 strategy can only be executed if we speak to our people
on all levels and win both their hearts and minds. The People Strategy consists of four pillars that serve as a basis for creating the culture and environment for our people in order to successfully support Creating the New. SEE DIAGRAM 25
These four pillars also serve as a tool for prioritization, sense-checking and measuring our HR actions and initiatives. The People Strategy is implemented through a portfolio of projects which will directly deliver into each of the four pillars. In 2017, we made good progress by delivering the following initiatives.
Meaningful reasons to join and stayKicked off in 2015, our internal career development program Talent Carousel entered its third year, with the first generation graduating in 2017. The program encourages employees from all over the world to apply and become one of 20 finalists to take a cross-functional and international career step by starting a new role in a new location. Candidates remain in the
program for 24 months with the right to return to their home location while being developed with the goal of them assuming Senior Management positions in the future.
In 2017, we continued our central onboarding process at our headquarters in Herzogenaurach, Germany, which ensures new starters enjoy a high-quality, consistent experience upon joining the company. In addition, we piloted a digital pre-onboarding app available initially to new joiners in our Digital Brand Commerce teams across Herzogenaurach, Portland, Amsterdam and Zaragoza. The app allows us to engage with new hires immediately upon their signing of an employment contract. Through research into other organizations, we learned that connecting with new joiners and providing them with a cultural onboarding before their first day on the job shortens their ramp-up time as it reduces complexity in the initial stages, ensuring they are highly engaged from day one. Both our pre-onboarding platform and in-person experience provide important learnings for a global onboarding initiative which aims at introducing standard onboarding tools in the next two years.
Our Learning Campus provides access to learning opportunities for employees globally. Through this digital platform, our people are able to develop skills to support their current performance and future career development. In 2017, we saw additional functional learning opportunities become accessible under the Learning Campus umbrella.
Introduced in 2016 in Germany, the US, the Netherlands and Hong Kong, our employee Stock Purchase Plan was rolled out to Greater China, Taiwan and the Hong Kong market organization in 2017. By the end of the year, 45% of our total employee population were eligible to take part in the program, and around 3,600 decided to participate. It is planned to extend this program to further countries in the coming years.
The four pillars of our People Strategy 25
People StrategyDefines and inspires the right organizational culture for Creating the New
Attraction & retention of the right talents
Role model leadership Diversity & inclusion Culture
Meaningful reasons to joinand stay
Role models who inspire us Bring forward fresh and diverse perspectives
A creative climate to make a difference
Attract and retain great talent by offering personal experiences, choices and individual careers.
Nurture and inspire role model leadership.
Represent and live the diversity of our consumers in our people.
It is our goal to develop a culture that cherishes collaboration, creativity and confidence – three behaviors we deem crucial to the successful delivery of our corporate strategy.
Choice & Agility & Speed
ADID
AS
ANN
UAL
REPO
RT 2
017
0811 TO OUR SHAREHOLDERS 2 GROUP MANAGEMENT REPORT –
OUR COMPANY3 GROUP MANAGEMENT REPORT –
FINANCIAL REVIEW4 CONSOLIDATED FINANCIAL
STATEMENTS5 ADDITIONAL INFORMATION
PEOPLE AND CULTURE
Our offices in the Netherlands, Spain and China received awards from the Top Employer Institute for their efforts to provide an exceptional work environment for our people. With its certification, the Top Employer Institute recognized adidas’ People Strategy, its organization-wide Learning & Develop ment framework which encourages different kinds of learning and its career management model. adidas promotes and encourages employee mobility across the organization and holds line managers accountable for developing the succession pipeline.
In the neighboring forest at our headquarters, we opened the company’s first-ever outdoor kindergarten group with 20 children, extending our child-care offer in a unique way. Also, we laid the foundation stone for our second day-care center on campus. It will open in October 2018, providing spots for a total of another 138 children: 75 for kindergarten children, 48 for nursery children, and 15 spots for short-term or emergency day care.
Role models who inspire usIn 2017, we made significant progress with this People Strategy pillar. Two new leadership groups were created, with a third one in the making:
— The Core Leadership Group (CLG) is the most senior group, made up of around 20 members from our Executive Leadership population. Members of this group jointly represent top positions and roles across our company. These functional and geographical experts partner with the Executive Board in teaching and overseeing the cross-functional execution of the Creating the New strategy, accelerating its delivery, as well as mentoring and sponsoring the next generation of leaders. The CLG also serves as the succession pool for the Board.
— The Extended Leadership Group (ELG) currently has around 100 members. This new community of leaders collaborates across functions to lead the implementation
of the strategic initiatives that form the Creating the New portfolio as well as the functional and market project portfolios. They drive continuous improvement across the organization and also mentor and sponsor younger leaders. The ELG serves as a succession pool for the CLG.
— A third group – the Global High Potential Group (GHIPO) – will be formed in the first quarter of 2018. Within this group, which will consist of 50 members, we are striving for a 50:50 gender balance. With the GHIPO group we want to identify and develop high potentials who have the ability to take on more complex, demanding and higher-level responsibilities at a global executive level. The GHIPO program will develop participants’ capability against a consistent future Senior Management profile.
In an effort to drive clarity and accountability, the CLG has created the company’s first global Leadership Framework. It is based on the three company behaviors creativity, collaboration, confidence (the ‘3Cs’) and articulates the particular behaviors that are expected of leaders at adidas. The framework was developed jointly with employees worldwide who provided feedback on what great leadership within adidas looks like to them. It now provides a global and universal language that is inclusive, reduces the need for local interpretations and outlines concrete behaviors that serve as a measure of leadership effectiveness. It will also be built into the way we hire and promote as well as rate performance. The framework was activated and cascaded to employees globally through the CLG and ELG groups. Employees’ awareness of the framework as well as its overall effectiveness are measured via our monthly employee experience survey ‘People Pulse’.
We continued to deliver our people manager training ‘Fit2Lead’ across the US, Asia and EMEA (Europe, Middle East and Africa). This training is specially designed for all first-time people managers who lead up to five people. It provides them
with basic knowledge on how to become a good people manager, manage their business and continue to develop themselves throughout their career. The course can also be booked by managers who would like to refresh their people management skills. Since 2016, this curriculum is complemented by the ’Fit2Lead Experienced Manager’ training that is geared towards managers who bring more than five years of manage ment experience and/or lead or influence larger teams.
Bring forward fresh and diverse perspectivesWe delivered our 'BIG Deal' gender intelligence training to the Board and their direct reports, covering 387 executives across nearly all our market subsidiaries within the course of a year. ‘BIG’ stands for Balanced, Inclusive, Gender Intelligent. BIG Deal is a one-day workshop designed to give participants new insights and practical tools that support them in building an inclusive company culture. Participants are challenged to re-visit and think critically about some of their key thoughts and beliefs around diversity, stereotyping and gender in the workplace.
Functional and local market teams continued to develop dedicated plans to invest in a stronger female talent pipeline, data analysis on gender balance and action plans to establish a more balanced organization in terms of gender, age and origin.
Our employee resource groups across the organization with an employee base of more than 700 members per group regularly hold awareness events and activations garnering corporate support for topics such as women’s, LGBTQ, age and origin as well as giving employees from all walks of life a voice.
A creative climate to make a differenceIn a continued effort to provide our employees with the best work environment possible, further construction work has started on our headquarters campus in Herzogenaurach. A
ADID
AS
ANN
UAL
REPO
RT 2
017
0821 TO OUR SHAREHOLDERS 2 GROUP MANAGEMENT REPORT –
OUR COMPANY3 GROUP MANAGEMENT REPORT –
FINANCIAL REVIEW4 CONSOLIDATED FINANCIAL
STATEMENTS5 ADDITIONAL INFORMATION
PEOPLE AND CULTURE

new building called ‘Arena’ will become the company’s new main office in the first half of 2019, offering over 2,000 employees a new home, centralizing most of the employees in Herzogenaurach on the World of Sports campus. 2017 also saw the construction of a third future workplace space, ’Base’, following the successes of ‘Pitch 1’ and ‘Pitch 2’. Employees based in these buildings work according to the activity-based working concept. They no longer have assigned desks but can choose from a multitude of different types of rooms and spaces based on the tasks they have on hand. Change management in these new buildings is supported through a dedicated mobile app as well as employee-led feedback groups and regular feedback surveys.
Our ‘MakerLabs’ at our headquarters in Herzogenaurach and in Portland, USA, serve as dedicated spaces providing tools such as laser cutters and 3D printers and know-how to help employees realize their ideas and create prototypes. The ‘MakerLab’ idea has its roots in the ‘hacker space’ concept, where all employees are given free rein to create and bring their ideas to life.
HR FOUNDATIONS FOR OUR PEOPLE STRATEGY In 2017, the adidas HR function further evolved People
OneView – a self-service online portal that allows employees, leaders and HR Partners to both access and manage the most important personal and work data such as salary, career and team information as well as HR applications. By providing direct access to People OneView, users are empowered to manage their most important personal data without having to go via their HR Partner. HR Partners in turn regain valuable time to counsel and support employees. In 2017, two new modules were added to the platform: Dashboarding gives HR Partners and senior leaders access to certain HR-specific metrics and standard reports, Org Viewing provides all employees with full transparency over the organizational structure of the company.
The year was also focused on further stabilizing and enhancing the HR Shared Service Center function for Germany. All employee queries relating to compensation, benefits, time management and HR systems are being centrally channeled and managed through this department. HR Partners are thus enabled to focus fully on supporting line managers and employees on topics such as career counseling, people management and coaching. In the first half of 2018, a new HR Shared Service Center will be going operational in Portland.
MEASURING THE SUCCESS OF OUR HR INITIATIVES
Our HR function measures the success and the effectiveness of the company’s efforts with regard to its people initiatives through a set of chosen KPIs. We use two people KPIs: employee experience as an internal measure and employer rankings as an external measure.
Employee engagementWe have set ourselves important goals of becoming the best sports company in the world by becoming a truly consumer-centric organization and putting our people at the heart of everything we do. When it comes to measuring whether we are living up to these ambitions, our consumers and people are the best data sources.
We are convinced that our employees’ feedback will play a crucial role in our pursuit of creating a world-class employee experience so we can continue to attract and retain top talent. We can only tell if we are successful by asking our people and hence empower them to share their feedback on a regular basis. In support of this thinking, the adidas Executive Board approved the launch of ‘People Pulse’ for all office employees with an email account. Kicked off in June 2017, People Pulse is adidas’ new approach and system platform for measuring the level of employee satisfaction with the experience adidas provides as an employer.
People Pulse allows for the monthly measurement of employeeNPS (eNPS). SEE INTERNAL MANAGEMENT SYSTEM, P. 102
The calculation logic of the eNPS score is identical with brand NPS: Based on the main question ‘On a scale of 0-10, how likely are you to recommend adidas as a place to work?’, the total share of detractors (responses below 7) is deducted from the total share of promoters (responses scoring 9 and 10), producing the eNPS score. This new approach as well as a new focus on collecting open-comment feedback from employees on a regular basis allowed the reduction of the questionnaire to a short pulse check of seven questions maximum, with the eNPS question at the center.
The People Pulse cadence is made up of two components: — The eNPS question which is asked every month to allow
for tracking over time — A focus topic which changes monthly and is directly derived
from the company’s strategic agenda as well as the new Leadership Framework and the 3Cs. The cycle repeats itself every six months
2017 marked the creation of the baseline eNPS score which was needed to establish the measurement of KPI improvement over time, as well as to produce internal benchmarks. Research shows that external benchmarks for eNPS are not meaningful to compare the level of positive employee experience between companies as People Pulse is specifically tailored to adidas’ needs as well as its Creating the New strategy and People Strategy. A direct like-for-like comparison of the adidas eNPS score to that of other companies is therefore not feasible. In line with the NPS industry standard approach, the focus lies on incremental improvement of the baseline score vs. the score for each pulse. For external benchmarking, we continue to use top employer rankings such as Glassdoor and Universum, where adidas’ attractiveness as an employer is compared to that of other companies in similar
ADID
AS
ANN
UAL
REPO
RT 2
017
0831 TO OUR SHAREHOLDERS 2 GROUP MANAGEMENT REPORT –
OUR COMPANY3 GROUP MANAGEMENT REPORT –
FINANCIAL REVIEW4 CONSOLIDATED FINANCIAL
STATEMENTS5 ADDITIONAL INFORMATION
PEOPLE AND CULTURE
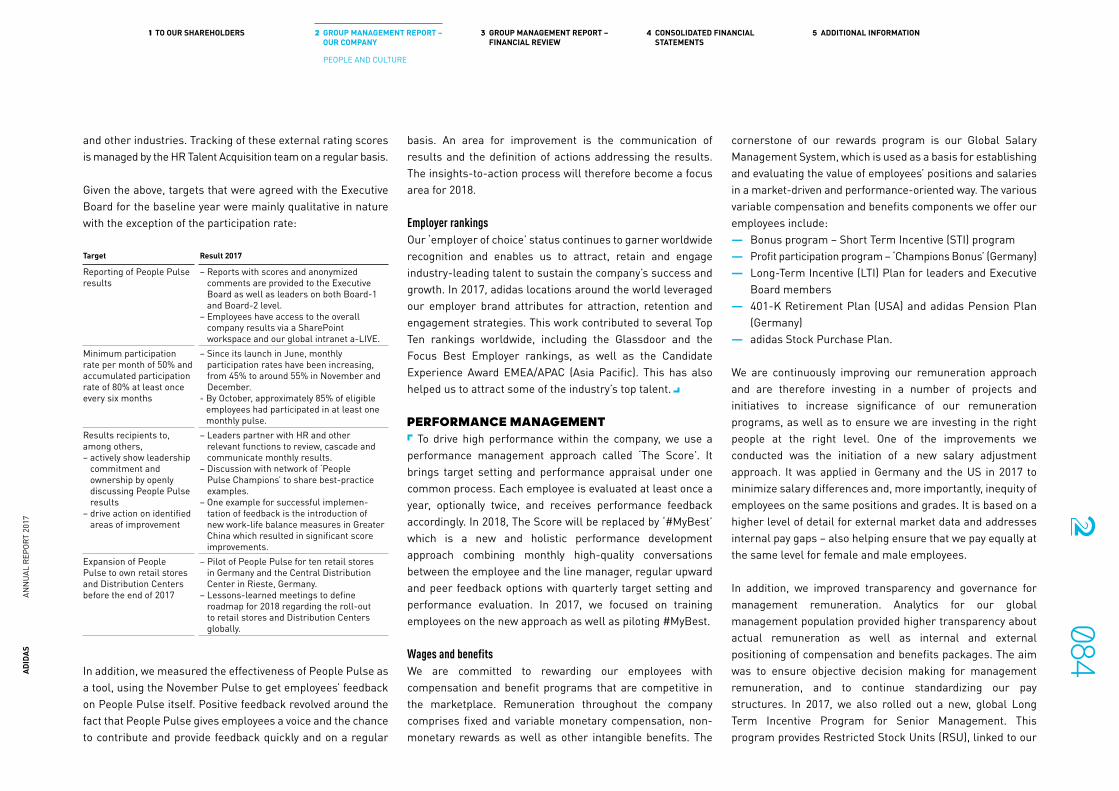
and other industries. Tracking of these external rating scores is managed by the HR Talent Acquisition team on a regular basis.
Given the above, targets that were agreed with the Executive Board for the baseline year were mainly qualitative in nature with the exception of the participation rate:
Target Result 2017
Reporting of People Pulse results
– Reports with scores and anonymized comments are provided to the Executive Board as well as leaders on both Board-1 and Board-2 level.
– Employees have access to the overall company results via a SharePoint workspace and our global intranet a-LIVE.
Minimum participation rate per month of 50% and accumulated participation rate of 80% at least once every six months
– Since its launch in June, monthly participation rates have been increasing, from 45% to around 55% in November and December.
- By October, approximately 85% of eligible employees had participated in at least one monthly pulse.
Results recipients to, among others, – actively show leadership
commitment and ownership by openly discussing People Pulse results
– drive action on identified areas of improvement
– Leaders partner with HR and other relevant functions to review, cascade and communicate monthly results.
– Discussion with network of ‘People Pulse Champions’ to share best-practice examples.
– One example for successful implemen-tation of feedback is the introduction of new work-life balance measures in Greater China which resulted in significant score improvements.
Expansion of People Pulse to own retail stores and Distribution Centers before the end of 2017
– Pilot of People Pulse for ten retail stores in Germany and the Central Distribution Center in Rieste, Germany.
– Lessons-learned meetings to define roadmap for 2018 regarding the roll-out to retail stores and Distribution Centers globally.
In addition, we measured the effectiveness of People Pulse as a tool, using the November Pulse to get employees’ feedback on People Pulse itself. Positive feedback revolved around the fact that People Pulse gives employees a voice and the chance to contribute and provide feedback quickly and on a regular
basis. An area for improvement is the communication of results and the definition of actions addressing the results. The insights-to-action process will therefore become a focus area for 2018.
Employer rankingsOur ‘employer of choice’ status continues to garner worldwide recognition and enables us to attract, retain and engage industry-leading talent to sustain the company’s success and growth. In 2017, adidas locations around the world leveraged our employer brand attributes for attraction, retention and engagement strategies. This work contributed to several Top Ten rankings worldwide, including the Glassdoor and the Focus Best Employer rankings, as well as the Candidate Experience Award EMEA/APAC (Asia Pacific). This has also helped us to attract some of the industry’s top talent.
PERFORMANCE MANAGEMENT To drive high performance within the company, we use a
performance management approach called ‘The Score’. It brings target setting and performance appraisal under one common process. Each employee is evaluated at least once a year, optionally twice, and receives performance feedback accordingly. In 2018, The Score will be replaced by ‘#MyBest’ which is a new and holistic performance development approach combining monthly high-quality conversations between the employee and the line manager, regular upward and peer feedback options with quarterly target setting and performance evaluation. In 2017, we focused on training employees on the new approach as well as piloting #MyBest.
Wages and benefitsWe are committed to rewarding our employees with compensation and benefit programs that are competitive in the marketplace. Remuneration throughout the company comprises fixed and variable monetary compensation, non-monetary rewards as well as other intangible benefits. The
cornerstone of our rewards program is our Global Salary Management System, which is used as a basis for establishing and evaluating the value of employees’ positions and salaries in a market-driven and performance-oriented way. The various variable compensation and benefits components we offer our employees include:
— Bonus program – Short Term Incentive (STI) program — Profit participation program – ‘Champions Bonus’ (Germany) — Long-Term Incentive (LTI) Plan for leaders and Executive
Board members — 401-K Retirement Plan (USA) and adidas Pension Plan
(Germany) — adidas Stock Purchase Plan.
We are continuously improving our remuneration approach and are therefore investing in a number of projects and initiatives to increase significance of our remuneration programs, as well as to ensure we are investing in the right people at the right level. One of the improvements we conducted was the initiation of a new salary adjustment approach. It was applied in Germany and the US in 2017 to minimize salary differences and, more importantly, inequity of employees on the same positions and grades. It is based on a higher level of detail for external market data and addresses internal pay gaps – also helping ensure that we pay equally at the same level for female and male employees.
In addition, we improved transparency and governance for management remuneration. Analytics for our global management population provided higher transparency about actual remuneration as well as internal and external positioning of compensation and benefits packages. The aim was to ensure objective decision making for management remuneration, and to continue standardizing our pay structures. In 2017, we also rolled out a new, global Long Term Incentive Program for Senior Management. This program provides Restricted Stock Units (RSU), linked to our
ADID
AS
ANN
UAL
REPO
RT 2
017
0841 TO OUR SHAREHOLDERS 2 GROUP MANAGEMENT REPORT –
OUR COMPANY3 GROUP MANAGEMENT REPORT –
FINANCIAL REVIEW4 CONSOLIDATED FINANCIAL
STATEMENTS5 ADDITIONAL INFORMATION
PEOPLE AND CULTURE

Earnings per Share (EPS) targets and to our share price performance. It closely links the goals of our Senior Management with those of our shareholders – sustainable success and long-term growth – and fosters company ownership mentality. We will introduce a similar plan for the Executive Board in 2018. SEE NOTE 27, P. 186
Our subsidiaries also grant a variety of benefits to employees, depending upon locally defined practices and country-specific regulations and norms.
DEVELOPMENT AND TRAININGTalent and succession management
The quality of current and future talent and leadership is key to our success. With specifically designed talent management tools, we identify talents at all levels of our company who have the potential to become future leaders or key players within the organization. In order to prepare them for more complex future roles, they participate in targeted development programs and have tailored individual development plans.
Apprenticeships and internships: Our development programs are complemented by apprenticeship and internship programs. The adidas apprenticeship offers young people who want to join our company directly out of school the opportunity to gain business experience in a two- to three-year rotation program. It includes vocational training in retail, shoe technology and IT, as well as integrated study programs in fields such as digital commerce, finance or international business. At the end of 2017, we employed 65 apprentices in Germany (2016: 63) and 37 integrated study program students (2016: 35). Our global internship program offers students three to six months of work experience within adidas. In 2017, we employed 765 interns in Germany (2016: 623).Trainee program: The Functional Trainee Program (FTP) is an 18-month program providing graduates with an international background and excellent educational credentials the
opportunity to start a functional career within adidas. The program comprises six three-month assignments in various departments. At least one of these assignments takes place abroad. At year-end 2017, we employed 63 participants in our global FTP (2016: 49).Succession management: Our succession management approach aims to ensure stability and certainty in business continuity. We achieve this through a globally consistent succession plan which covers successors for director-level positions and above. We conduct regular reviews to ensure individual development plans are in place to prepare successors for their potential next steps.
Employee collaboration and learningWe believe that a robust and state-of-the-art internal communication platform is essential for driving employee engagement and fostering learning as well as open collaboration within our organization. We use an enterprise collaboration platform called ‘a-LIVE’, which encourages employees to share knowledge, collaborate and discuss current topics. In addition, we have established an ‘Ask the Management’ platform on our intranet, enabling employees to openly address questions to our senior leaders.
Via a-LIVE we also offer all employees access to the Learning Campus, a state-of-the-art learning platform launched in 2014 that provides opportunities for both e-learning and knowledge sharing. Employees are able to access content 24/7 in a virtual environment. Under the Learning Campus brand we also offer in-person learning activities. Through a global implementation of our Learning Management System that continued through 2017, we have increased accessibility of employee training and development activities across the globe with a future goal of the majority of in-person and digital learning activities contributing to an employee’s individual People OneView profile.
In 2017, 23,113 employees accessed our Learning Campus digitally, while 4,295 employees participated in in-person learning activities, ranging from two hours to two days in duration. In 2018, adidas core learning programs will be created to support strategic business initiatives, build capabilities connected to our 3Cs and support development of future cross-functional organizational capabilities. Input into the program offer is managed through a business needs assessment supported by our HR organization.
WORK-LIFE INTEGRATION We aim to harmonize the commercial interests of the
company with the professional, private and family needs of our employees. Our Work-Life Integration initiatives and programs include flexible work time and place, people development and leadership competence related to work-life integration, as well as family-oriented services. In addition to providing flexible working opportunities such as teleworking, sabbaticals and parent/child offices, we have a day-care center at our headquarters in Herzogenaurach, for example. Our office in Panama also offers financial support for day care, and our office in Amsterdam provides a contingent of day-care places.
In order to plan parental leave and re-entry in the best possible way, we have dedicated and tailored programs in place providing employees with advice at an early stage and options for their return to work, also taking into consideration flexible working hours and work locations. In Germany, for instance, we guarantee our employees on parental leave their positions, which are only filled temporarily. In the US, we give parents a special option: In addition to regular parental leave, which allows new parents to stay home for up to ten weeks with 70% of their salary, adidas offers an extra two weeks’ paid parental leave for parents. Furthermore, adidas’ special parental bonding leave provides parents with the possibility to stay home for up to six months within the first twelve months
ADID
AS
ANN
UAL
REPO
RT 2
017
0851 TO OUR SHAREHOLDERS 2 GROUP MANAGEMENT REPORT –
OUR COMPANY3 GROUP MANAGEMENT REPORT –
FINANCIAL REVIEW4 CONSOLIDATED FINANCIAL
STATEMENTS5 ADDITIONAL INFORMATION
PEOPLE AND CULTURE

after the child’s birth or placement. While unpaid, it offers parents the opportunity to stay home longer and take care of their new arrival and new life together.
Starting with our company’s headquarters in Germany, we introduced a new off-campus working approach in 2017. Every employee with an adidas AG contract whose working tasks can be carried out independently of campus facilities, campus equipment or personal interaction onsite is eligible to work 20% of their total working time off-campus. This new Works Council agreement is based on our belief that results can be achieved in the same quality and quantity, regardless of people’s location. With this regulation we are supporting our people in working more flexibly and choosing the best work environment for the task they have at hand.
DIVERSITY AND INCLUSION We believe it is crucial for the success of our company to
have a very diverse workforce and individuals with different ideas, strengths, interests and cultural backgrounds. We see a great benefit in the diversity of our employees as this helps us to better fulfil the wishes and multi-faceted demands of our consumers around the world. All our employees are appreciated – regardless of gender, nationality, ethnic origin, religion, world view, disability, age, sexual orientation or identity.
At our company’s headquarter, we have employees from more than 100 nations. As part of our global diversity approach we proactively pursue a portfolio of internal and external activities as well as memberships:
Internal activities — We have regular events highlighting diversity as a key
topic, such as our global Diversity Day. We support the 760-member strong global Women’s Networking group.
Additionally, we continue our support of the international LGBTQ community, which is also driven by our employees at our major locations. 2017 also saw the creation of a new Experienced Generation network which represents the interests and needs of our more experienced employees.
— We provide quarterly diversity reports to management to support decision making and target setting, and provide diversity training to our employees and gender intelligence training to our leaders.
External activities and memberships — Our active membership in ‘Charta der Vielfalt’ (‘Diversity
Charter’), Prout at Work and the Diversity and Inclusion in Asia Network (DIAN) allows us to promote communication and the sharing of best practices and insights.
— We have been participating in international diversity career fairs and events such as Women in Tech, Opportunities for Women Conference and the British LGBT awards.
— adidas is listed in the genderdax SEE GLOSSARY and regularly takes part in benchmark studies in order to review our activities in the fields of diversity and inclusion.
MIXED LEADERSHIP TEAMS At adidas, we believe in mixed leadership teams as a
competitive advantage and driver of success. A prerequisite for increasing the number of women at the highest levels of management is the general promotion of women within the company worldwide at all levels of management. We have various initiatives in place, e. g. with members of the Executive Board agreeing to mentor female talents as well as an equal gender split in our GHIPO program to guarantee that our succession pipeline is balanced. In addition, our women’s network is also working on mentoring circles to foster the professional development of junior colleagues. Already in 2011, adidas proactively set itself the goal of increasing the number of women in management positions in the coming years. ↗ ADIDAS-GROUP.COM/S/EMPLOYEES
Mixed leadership targets 26
adidas AG Target set in 2015 for 2017 Evaluation June 30, 2017 Target set in 2017 for 2019/2022
Supervisory Board to appoint one woman to the adidas AG Executive Board
Karen Parkin appointed as the first woman to the adidas AG Executive Board in May 2017
Percentage share of women on the Executive Board by 2022: 14.29% (1/7)
Percentage share of women in management positions (Board-1 level) to be increased from 11% (July 2015) to 18%
Percentage share of women in management positions (Board-1 level): 18%
Percentage share of women in management positions (Board-1 level) to be increased to 24% by 2019
Percentage share of women in management positions (Board-2 level) to be increased from 26% (July 2015) to 30%
Percentage share of women in management positions (Board-2 level): 29%
Percentage share of women in management positions (Board-2 level) to be increased to 30% by 2019
Global Target set in March 2011 for 2017 Evaluation 2017 Target set in 2017 for 2020
Percentage share of women in management positions to be increased from 30% (March 2011) to 32%
Percentage share of women in management positions: 31%
Percentage share of women in management positions to be increased to 32%
ADID
AS
ANN
UAL
REPO
RT 2
017
0861 TO OUR SHAREHOLDERS 2 GROUP MANAGEMENT REPORT –
OUR COMPANY3 GROUP MANAGEMENT REPORT –
FINANCIAL REVIEW4 CONSOLIDATED FINANCIAL
STATEMENTS5 ADDITIONAL INFORMATION
PEOPLE AND CULTURE
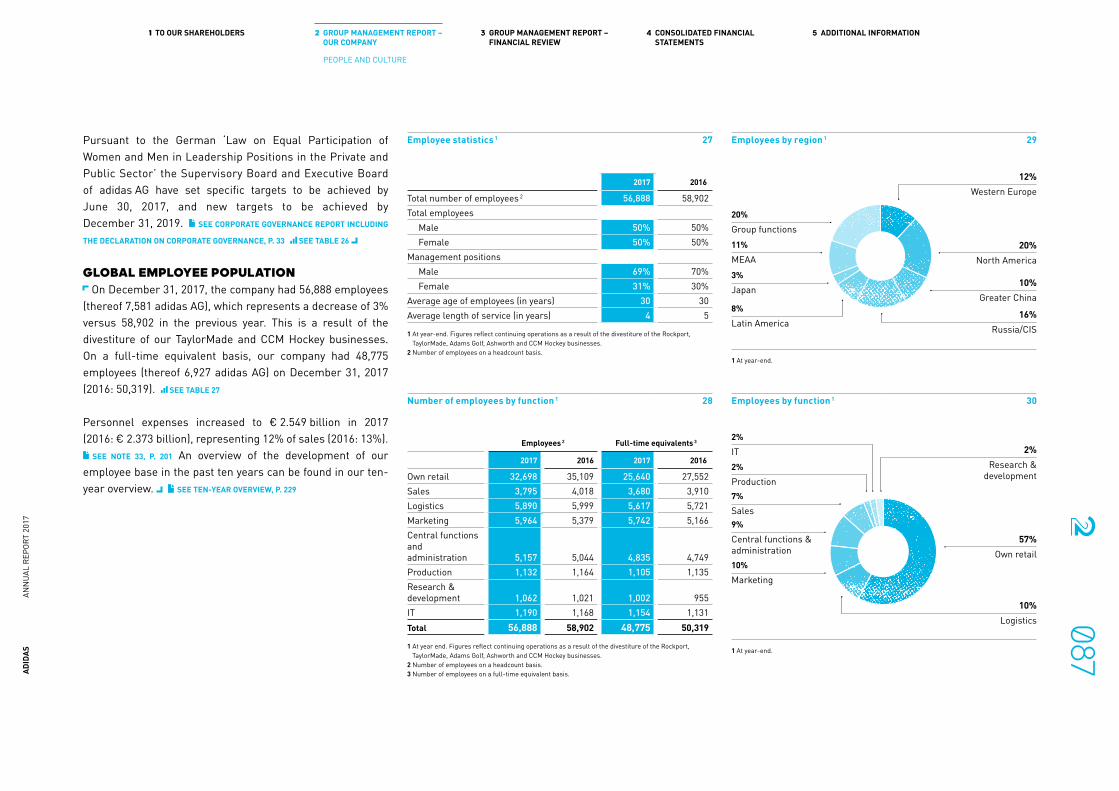
Pursuant to the German ‘Law on Equal Participation of Women and Men in Leadership Positions in the Private and Public Sector’ the Supervisory Board and Executive Board of adidas AG have set specific targets to be achieved by June 30, 2017, and new targets to be achieved by December 31, 2019. SEE CORPORATE GOVERNANCE REPORT INCLUDING
THE DECLARATION ON CORPORATE GOVERNANCE, P. 33 SEE TABLE 26
GLOBAL EMPLOYEE POPULATION On December 31, 2017, the company had 56,888 employees
(thereof 7,581 adidas AG), which represents a decrease of 3% versus 58,902 in the previous year. This is a result of the divestiture of our TaylorMade and CCM Hockey businesses. On a full-time equivalent basis, our company had 48,775 employees (thereof 6,927 adidas AG) on December 31, 2017 (2016: 50,319). SEE TABLE 27
Personnel expenses increased to € 2.549 billion in 2017 (2016: € 2.373 billion), representing 12% of sales (2016: 13%).
SEE NOTE 33, P. 201 An overview of the development of our employee base in the past ten years can be found in our ten-year overview. SEE TEN-YEAR OVERVIEW, P. 229
Employee statistics 1 27
2017 2016
Total number of employees 2 56,888 58,902Total employees
Male 50% 50%Female 50% 50%
Management positions Male 69% 70%Female 31% 30%
Average age of employees (in years) 30 30Average length of service (in years) 4 5
1 At year-end. Figures reflect continuing operations as a result of the divestiture of the Rockport, TaylorMade, Adams Golf, Ashworth and CCM Hockey businesses.
2 Number of employees on a headcount basis.
Number of employees by function 1 28
Employees 2 Full-time equivalents 3
2017 2016 2017 2016
Own retail 32,698 35,109 25,640 27,552Sales 3,795 4,018 3,680 3,910Logistics 5,890 5,999 5,617 5,721Marketing 5,964 5,379 5,742 5,166Central functions and administration 5,157 5,044 4,835 4,749Production 1,132 1,164 1,105 1,135Research & development 1,062 1,021 1,002 955IT 1,190 1,168 1,154 1,131Total 56,888 58,902 48,775 50,319
1 At year end. Figures reflect continuing operations as a result of the divestiture of the Rockport, TaylorMade, Adams Golf, Ashworth and CCM Hockey businesses.
2 Number of employees on a headcount basis.3 Number of employees on a full-time equivalent basis.
Employees by function 1 30
1 At year-end.
2%IT
7%Sales
10%Marketing
9%Central functions & administration
2%Production
57%Own retail
2%Research &
development
10%Logistics
Employees by region 1 29
1 At year-end.
20%Group functions
3%Japan
8%Latin America
11%MEAA
20%North America
12%Western Europe
16%Russia/CIS
10%Greater China
ADID
AS
ANN
UAL
REPO
RT 2
017
0871 TO OUR SHAREHOLDERS 2 GROUP MANAGEMENT REPORT –
OUR COMPANY3 GROUP MANAGEMENT REPORT –
FINANCIAL REVIEW4 CONSOLIDATED FINANCIAL
STATEMENTS5 ADDITIONAL INFORMATION
PEOPLE AND CULTURE
SUSTAINABILITYBeing a sustainable business is about striking the balance between shareholder expectations and the needs and concerns of our employees and consumers, the workers in our supply chain and the environment. We believe that acting as a responsible business will contribute to lasting economic success.
OUR APPROACH
Our commitment to sustainable practices rests on the company’s mission: To be the best sports company in the world. Best means that we design, build and sell the best sports products in the world, with the best service and experience and in a sustainable way. This mission is supported by the adidas sustainability roadmap toward 2020 and beyond, which is a direct outcome of our business strategy ‘Creating the New’. We believe that, through sport, we have the power to change lives. But sport needs a space to exist. These spaces are increasingly endangered due to man-made issues, including human rights violations, pollution, growing energy consumption and waste. Our holistic approach to sustainability responds to the challenges that endanger the spaces of sport and simultaneously our planet and people. Building on existing programs, it tackles these subjects that are most material to our business and our stakeholders, and translates our overall sustainability efforts into tangible goals for 2020 that have a direct impact on the world of sport we operate in. ↗ ADIDAS-GROUP.COM/SUSTAINABILITY
MATERIAL TOPICS We seek to ensure that we address the topics that are most
salient to our business, our key stakeholders as well as the challenges ahead. To identify these topics we openly engage with our stakeholders and involve their views and opinions in
decisions that shape our day-to-day-operations. 2017 saw a refreshment of this materiality exercise. Building on the insights gained from past assessments we categorized potential relevant topics in a first step. We then validated these topics through in-depth discussions with experts across all relevant functions. In doing so, our focus centered on the importance a topic has for our business performance and stakeholders but also considered the impact adidas has on these topics. As a result we were able to confirm our strategic ambitions and embedded goals that we aim to reach by 2020.
SEE NON-FINANCIAL STATEMENT, P. 100
STAKEHOLDER DIALOGUE AND TRANSPARENCY Engaging openly with stakeholders and establishing ways to
increase transparency and disclosure has long been central to our approach. Our stakeholders are those people or organizations who affect or are affected by our operations, including our employees, consumers, suppliers and their workers, customers, investors, media, governments and NGOs. The adidas ‘Stakeholder Relations Guideline’ specifies key principles for the development of stakeholder relations and details the different forms of stakeholder engagement. Through active participation in, for example, the Better Cotton Initiative (BCI), the Sustainable Apparel Coalition (SAC), the Leather Working Group (LWG) and the Apparel and Footwear International RSL Management (AFIRM) Working Group, we work closely with leading companies from a variety of sectors to develop sustainable business approaches and to debate social and environmental topics on a global level. This is also supported by our membership in organizations such as the World Federation of the Sporting Goods Industry (WFSGI), the Fair Factories Clearinghouse (FFC), the Fair Labor Association (FLA) and the German government-led Partnership on Sustainable Textiles (‘Textilbündnis’). In addition, we build awareness, capacity and knowledge of laws and rights among factory management and workers by partnering with leading
providers such as the EHS+ Centre in China and the International Labour Organi za tion’s (ILO) Better Work program. ↗ ADIDAS-GROUP.COM/S/PARTNERSHIPS
We believe transparent communication to our stakeholders is critical. For that reason we regularly disclose important sustainability updates from our work throughout the year on our corporate channels including our corporate website. A key element is the publication of our global supplier factory lists, showing factories we source from. The lists were first disclosed in 2007 and are updated twice a year. In addition, we publish lists of the factories that manufacture products for major sports events such as the FIFA World Cup or Olympic Games, and disclose the names of factories of suppliers who process materials for our primary suppliers or subcontractors, where the majority of wet processes SEE GLOSSARY are carried out. ↗ ADIDAS-GROUP.COM/S/SUPPLY-CHAIN-STRUCTURE
GOVERNANCE STRUCTURE A cross-functional governance structure ensures timely and
direct execution of these programs that drive achievement of our voluntarily set goals for 2020. A Sponsor Board composed of functional heads from Social and Environmental Affairs (SEA), Global Operations (GOPS), Global Brands, Human Resources, Global Workplaces, Retail Concept, Sales, Finance and Communication oversees the progress made toward our goals in bi-monthly meetings and gives direction for further development of the sustainability roadmap. The Sponsor Board works in close alignment with the strategic working group that is tasked with the monitoring of ongoing relevant developments within the company and the reporting of progress to the Sponsor Board. Ultimately, the program owners ensure operational execution of the programs. Important updates and requests for decision making are shared with the Executive Board and designated sustainability champions on a regular basis.
ADID
AS
ANN
UAL
REPO
RT 2
017
0881 TO OUR SHAREHOLDERS 2 GROUP MANAGEMENT REPORT –
OUR COMPANY3 GROUP MANAGEMENT REPORT –
FINANCIAL REVIEW4 CONSOLIDATED FINANCIAL
STATEMENTS5 ADDITIONAL INFORMATION
SUSTAINABILITY

EXTERNAL RECOGNITION We have continuously received positive recognition from
international institutions, rating agencies, NGOs and socially responsible investment analysts for our sustainability initiatives. In 2017, adidas AG was again represented in a variety of high-profile sustainability indices and subject to corporate sustainability assessments. SEE OUR SHARE, P. 57
For example, for the 18th consecutive time, adidas AG was selected to join the Dow Jones Sustainability Indices (DJSI), the world’s first global sustainability index family tracking the performance of the leading sustainability-driven companies worldwide. As one of the top-scoring companies in our industry ‘Textiles, Apparel & Luxury Goods’, we earned the Gold Class distinction for excellent corporate sustainability performance for the second year in a row and were rated industry best in the criteria Human Rights, Supply Chain Management, Impact Measurement and Valuation, Materiality, Environmental Policy and Management Systems, Risk and Crisis Management, Brand Management, Corporate Citizenship and Philanthropy, and Customer Relationship Management. As a result of our response to assessments conducted by the Carbon Disclosure Project (CDP), adidas was awarded with a B score in the Climate Change submission and with an A– score in the Water submission in 2017. Furthermore, adidas received recognition in the annual CITI (Corporate Information Transparency Index) 4.0 evaluation for the environmental performance of our supply chain in China for the fourth year in a row. In 2017, we ranked first in the leather industry, and fifth out of more than 200 global brands. adidas further ranked second in its industry in the Corporate Human Rights Benchmark evaluation and, for an unprecedented third time, received accreditation for its social supply chain program by the FLA. To provide information for the third accreditation, nine years of social compliance work was evaluated. Our program was first accredited by the FLA in 2005, then reaccredited in 2008. ↗ ADIDAS-GROUP.COM/S/RECOGNITION
OUR PROGRESS
For years, adidas has regularly reported about its sustain-ability performance by measuring and disclosing the progress made toward our targets.
PRODUCT SAFETY Product safety is an imperative. As a company we have to
manage the risk of selling defective products that may result in injury to consumers or impair our image. To mitigate this risk, we have company-wide product safety policies in place that ensure we consistently apply physical and chemical product safety and conformity standards. Since pioneering the Restricted Substances Policy (‘A-01’ Policy) in 1998, we continue to develop policies which ban or restrict chemicals in our products. ↗ ADIDAS-GROUP.COM/S/PRODUCT-SAFETY
The A-01 Policy for product materials covers the strictest applicable local requirements and includes best-practice standards as recommended by consumer organizations. It prohibits, for example, the use of chemicals considered harmful or toxic, the sourcing or processing of raw materials from any endangered or threatened species and the use of leathers, hides or skins from animals that have been inhumanely treated, whether these animals are wild or farmed. The policy is updated at least once a year based on findings in our ongoing dialogue with scientific organizations and is mandatory for all business partners who have to confirm receipt and acknowledgement of the latest policy update each year in a written format.
Both our own quality assurance laboratories and external testing institutes are used to constantly monitor material samples to ensure supplier compliance with these requirements. Materials that do not meet our standards and specifications are rejected. To ensure successful application of the policy, we promote internal business understanding,
offer global support by developing guidelines and systems, and monitor and influence standards and regulations through external observation and interaction. Senior Management from SEA and GOPS reviews and signs off policy updates and is informed about proper execution and monitoring.
We publish our A-01 Policy annually on our corporate website and communicate it to all relevant stakeholders internally and externally. The efficiency of our product safety approach is evaluated by the absence of any product recalls as well as by benchmarking standards and executional procedures against the guidance as developed by the AFIRM Group.
Progress toward targetsIn 2017, we published an updated version of our A-01 Policy on our corporate website. In addition, we created a dedicated ‘Product safety and compliance’ workspace on our global intranet a-LIVE that serves as a platform for all employees involved in product creation by providing them with the information required to ensure we conceptualize, develop, produce and distribute products that are in compliance with national and international regulations and best-practice standards as well as in accordance with the laws of intellectual property. The workspace offers policies, manuals and standards, as well as contact details for internal global support and best-practice sharing guidelines and training material.
We have further strengthened our collaborative approach with industry peers within the AFIRM Group. We continued to mature our programs on a global scale with enhanced supplier training tools and outreach, and contributed to a consolidated AFIRM Restricted Substances List that harmonizes a Restricted Substances Lists across the industry. We further participated in several public stakeholder consultation processes initiated by the European Commission (ECHA), and also several US state legislative initiatives to inform governmental entities on implications and opportunities of drafted legislation.
ADID
AS
ANN
UAL
REPO
RT 2
017
0891 TO OUR SHAREHOLDERS 2 GROUP MANAGEMENT REPORT –
OUR COMPANY3 GROUP MANAGEMENT REPORT –
FINANCIAL REVIEW4 CONSOLIDATED FINANCIAL
STATEMENTS5 ADDITIONAL INFORMATION
SUSTAINABILITY

In 2017, we recorded quality issues for one accessory product (model adidas Hockey Pro Glove) with around 3,000 produced items, out of 321 million units of hardware produced during the years of manufacture. One product item identified during a spot check by Dutch authorities at a point of sale was found to be not compliant with the REACH regulation of the European Union. This subsequently led to immediate action from our end. All products that were delivered to markets were recalled by asking consumers who purchased this article to return it to the store where it was bought. We have not been notified about any consumer complaints related to this product quality deficit.
ENVIRONMENTAL IMPACTS adidas is proactively addressing the impacts of climate
change through a number of initiatives in its own operations, its supply chain and through various partnerships. As an example, the company joined the ‘UN Climate Neutral Now’ initiative in 2015 to promote a wider understanding of the need and the opportunities for society to become climate neutral as well as to showcase that many organizations are already taking concrete action in this direction. As such, adidas is committed to action steps as a champion of the initiative such as the continued estimation and reduction of its emissions.
ORGANIZATIONAL FOOTPRINT In 2016, for the first time, we conducted a fact-based pilot
analysis to assess our organizational environmental footprint. The aim was to better understand where our main environmental impacts occur along our value chain, and to translate them into monetary terms. Using the baseline of 2015, we focused on five main environmental impacts: Greenhouse Gas (GHG) emissions, water consumption, land use as well as air and water pollution. Results show that only 4% of our impact relates to our core operations (operations related to all of our administration offices, distribution centers and own production sites globally, as well
as own retail stores globally). The biggest impact however occurs in the upstream supply chain in factories beyond the Tier 1 suppliers we have a direct relationship with. SEE DIAGRAM 31
OWN SITES Since 2008, our ‘Green Company’ program strives to achieve
ambitious savings in water, waste and energy at adidas own sites globally. Including administrative offices, production facilities and distribution centers, the program covers more than 85% of our global employee base (excluding own retail). In 2015, we presented a new set of targets to be achieved by 2020, including targets for carbon reduction that were calculated considering a science-based methodology and context-based targets for water reduction. ↗ADIDAS-GROUP.COM/S/ENVIRONMENTAL-APPROACH
Progress is tracked annually through an environmental data reporting system that allows for follow-up toward the set targets and is disclosed in detail in our annual Green Company Report that will be available as of April 2018 on our corporate website. ↗ ADIDAS-GROUP.COM/S/GREEN-COMPANY-REPORTS
In 2016, we established an Integrated Management System (IMS) which combines three existing management systems: ISO 50001 (Energy), ISO 14001 (Environment) and OHSAS 18001 (Health and Safety). IMS is helping us to drive further business integration and impact relevant decisions for our operations globally. A dedicated IMS policy helps to promote wider understanding and ensures application among all adidas entities affected. In addition, our global intranet a-LIVE supports best-practice sharing among all adidas employees globally.
Organizational footprint 1 31
1 Greenhouse gas: carbon dioxide, methane and nitrous oxide. Air pollution: sulphur oxides, nitrogen oxides, particulate matter, toxic organic substances. Water consumption: i.a. surface water, ground water. Water pollution: i.a. nitrogen and phosphorus, toxic organic substances, heavy metals. Land use: arable land, pastures and grassland, industrial land use, unsustainable forest area.
VALUE CHAIN
TO
TAL
IMPA
CT
ADM
INIS
TRAT
ION
& O
THER
OFFI
CES,
DIS
TRIB
UTIO
N C
ENTE
RS,
PROD
UCTI
ON S
ITES
1%
USE
PHAS
E AN
D EN
D-OF
-LIF
E10
%
INDI
RECT
SIN
DIRE
CT S
PEN
DS8%
TIER
2UP
STRE
AM S
UPPL
Y CH
AIN
18%
31%
6%
AIRPOLLUTION
WATERCONSUMPTION
WATERPOLLUTION
LAND USE
GREENHOUSEGAS
TIER
3RA
W M
ATER
IAL
PROD
UCTI
ON
50%
TIER
1DI
RECT
SUP
PLIE
RS6%
LOGI
STIC
SIN
BOUN
D AN
D OU
TBOU
ND
4%
RETA
ILOW
N R
ETAI
L GL
OBAL
LY3%
42%
15%
6%
ADID
AS
ANN
UAL
REPO
RT 2
017
0901 TO OUR SHAREHOLDERS 2 GROUP MANAGEMENT REPORT –
OUR COMPANY3 GROUP MANAGEMENT REPORT –
FINANCIAL REVIEW4 CONSOLIDATED FINANCIAL
STATEMENTS5 ADDITIONAL INFORMATION
SUSTAINABILITY

Progress toward targets By the end of 2017, our own sites globally managed a 29% reduction in carbon net emissions (baseline 2015) and a 27% reduction in water consumption per employee (baseline 2008).
Targets 2020 2017 2016
3% absolute annual reduction in CO2 Scope 1 and Scope 2 1 net emissions (baseline 2015) 29% 11%35% reduction in water consumption per employee(baseline 2008) 27% 23%
1 Scope 1: Emissions that arise directly from sources that are owned or controlled by adidas entities, such as fuels used in our boilers, Scope 2: emissions generated by purchased electricity consumed by adidas entities.
Three of our facilities received LEED SEE GLOSSARY Gold certification. After the office in Santiago, Chile, received certification in 2016, the new office in Buenos Aires, Argentina was the second office in South America to be awarded with this certification. The India headquarters in Gurugram became our first LEED Gold certification in Asia and the relocated headquarters in Dubai also became LEED Gold certified. In addition, adidas received its first-ever LEED certification for own retail. The store in Madrid was accredited for its interior design and construction.
In line with our ambition to reduce the environmental footprint of our consumer events by 2020, we developed our first ‘Sustainable Events’ guidelines which will serve as orientation for our markets globally to run events more sustainably and inspire best-practice sharing opportunities. The guidelines are available to our internal teams through a-LIVE and to external agencies, with the aim of, for example, increasing energy awareness and minimizing the use of single-use plastic at our own events.
2017 also experienced renewed and visible support for our ambition to further reduce our environmental footprint from the adidas Executive Board, who challenged all adidas facilities worldwide to remove single-use plastic items that are disposable and generally used only once before they are thrown away, such as plastic bags, water bottles and cutlery. The changes will avoid more than 40 tonnes of single-use plastic per year. The announcement that was made on a-LIVE was the most successful post to date, showing the high commitment and engagement of both our Senior Management and employees worldwide toward responsible business practices.
SUPPLY CHAIN As almost all of our production is outsourced, a significant
part of our environmental impact occurs, at different intensities, throughout the supply chain. Therefore, for us, sourcing is not only about ensuring high product quality and timely delivery, it also means working with our suppliers to ensure the highest environmental standards and supporting them to reduce their overall water consumption and waste volume as well as improve their carbon footprint. Using the environmental performance of our own sites as best-practice examples, we provide a set of specific policies and guidelines to our suppliers: Mandatory for all business partners, the ‘Workplace Standards’ (the supply chain code of conduct) as well as supportive guidelines such as our ‘Environmental Guidelines’ and ‘Guide to Best Environmental Practice’ are updated regularly and build the basis for our engagement with suppliers. In addition, we have initiated a system of multi-level and cross-functional training sessions with our global supplier network and provide regular training. Guidance and training materials are reviewed by SEA Senior Management prior to release. ↗ ADIDAS-GROUP.COM/S/SUPPLY-CHAIN-APPROACH
One of the ways we try to minimize our suppliers’ environmental impacts at their manufacturing plants is by helping them establish sound environmental management systems. The majority of our footwear sourcing volume, 95% (2016: 96%), is produced in factories which are certified in accordance with the International Environmental Standards ISO 14001 and/or the Workplace Health and Safety Management Standards OHSAS 18001. The remaining part of our footwear sourcing volume is produced in factories that have other management systems in place. All footwear factories in our monitoring scope are regularly assessed against our standards on environment and workplace health and safety, receiving evaluation by means of our environmental compliance E-KPI rating.
Environmental compliance (E-KPI)E-KPI is our tool designed to measure and improve environmental performance of our strategic Tier 1 suppliers by setting them 20% intensity reduction targets to be achieved by 2020 in the areas of energy, water and waste (baseline 2014). Using a benchmarking approach, E-KPI allows for a high level of transparency into suppliers’ actual consumption intensity, supporting us to define suppliers' specified areas for improve ment and training needs that match their respective situation. We follow a similar approach for our apparel material Tier 2 suppliers, with the aim of them achieving a 35% water reduction by the end of 2020 (baseline 2014) 1.
Progress toward targetsCompared to the 2016 results, our suppliers enrolled in our environmental program made good progress 2. 48% of strategic suppliers are on track to achieve their energy reduction target for 2020, which represents an increase of 11 percentage points compared to the results from the previous measure-ment. More than half of these suppliers (55%) are on track to
1 Apparel material suppliers are specialists in printing and dyeing operations. Based on results from previous years and a change in our tracking methodology, the target for our apparel material suppliers was adjusted to a 35% reduction by 2020. 2 E-KPI 2017 refers to environmental data covering full year 2016, using a baseline of 2014. Strategic suppliers enrolled in our environmental program cover more than 80% of our total sourcing volume.
ADID
AS
ANN
UAL
REPO
RT 2
017
0911 TO OUR SHAREHOLDERS 2 GROUP MANAGEMENT REPORT –
OUR COMPANY3 GROUP MANAGEMENT REPORT –
FINANCIAL REVIEW4 CONSOLIDATED FINANCIAL
STATEMENTS5 ADDITIONAL INFORMATION
SUSTAINABILITY

achieve their waste reduction target, also marking a significant improvement of 16 percentage points compared to the previous results. 54% of this group of suppliers are on their way to achieving the water reduction targets, showing a stable performance and no change in percentage points compared to the previous ratings. In addition, 46% of our apparel material suppliers made good progress and are well on their way to achieve the 2020 target.
If facilities’ performance achievement is at risk, we take several steps to support and ensure their performance gets back on track. For example, in 2017, we launched various energy efficiency projects targeting underperforming facilities in Vietnam, Cambodia and Indonesia with the help of external
expertise that identified and outlined short- and medium-term action for the facilities with a positive impact either immediately or within the next three years. Similarly with waste, we did a pilot assessment in Vietnam to identify waste reduction and recycling opportunities. The global guidelines developed will support all facilities to manage their waste and identify opportunities to recycle. Low-performing facilities are further asked to develop improvement plans and provide regular progress updates. adidas also hosts joint discussions with the factories.
In 2017, we tracked again the environmental impact related to the transport of our goods and recorded a small reduction in air freight and a slight increase in sea freight throughout all categories, while truck freight remained stable. All in all, the vast majority of our shipments take place via sea freight.
SEE DIAGRAM 32
SUSTAINABLE MATERIALS AND PROCESSES Following our ambition to create the best for the athlete
while optimizing our environmental impact, we innovate materials and processes. We are committed to steadily increasing the use of more sustainable materials in our production, products and stores and are driving toward closed-loop solutions. Our approach to sustainable materials is influenced by new technological trends and developments, engagement with stakeholders including scientific organizations as well as market availability. Any major changes in the material selection that impact product costs are subject to review and approval by Senior Management. Execution and progress is tracked and managed by the respective materials development and sourcing departments.
As a founding member of the Better Cotton Initiative (BCI), adidas is working on reducing the use of conventional cotton
and has committed to increasing the sourcing volumes of Better Cotton, with the aim of achieving 100% sustainable cotton SEE GLOSSARY by 2018. Not only does the BCI aim to reduce the use of pesticides, it also promotes efficient water use, crop rotation and fair working conditions.
In addition, we aim to reduce the use of virgin plastic and are increasing the use of recycled polyester in our products. As of 2015, adidas has partnered up with Parley for the Oceans SEE
GLOSSARY. As a founding member, adidas supports Parley for the Oceans in its education and communication efforts and commits to the Parley A.I.R. (Avoid, Intercept, Redesign) strategy. As part of this strategy we are working on turning what we believe is a problem (marine plastic pollution) into progress with an eco-innovative replacement for virgin plastic, Parley Ocean Plastic SEE GLOSSARY, and have committed to extend the supply chain for Parley Ocean Plastic. SEE
INNOVATION, P. 78 SEE CORPORATE STRATEGY, P. 62 ↗ ADIDAS-GROUP.COM/S/
SUSTAINABILITY-INNOVATION
We are further rolling out a global take-back program to all our key cities and markets, implementing 'Make every thread count', with the main objective to raise consumers’ awareness of what happens to products at the end of their life. It helps consumers to give their old clothes and footwear a second life. Consumers can drop off old shoes and apparel from any brand. The collected items are then sent to the adidas Distribution Center, where they are picked up by a service provider that sorts products according to different quality criteria. Products either go into a second-hand market or are further recycled into secondary raw material, to be used for new products in various industries. A small portion of products (less than 10%) cannot be recycled and thus is sent for disposal. ↗ ADIDAS-GROUP.COM/S/PRODUCT-END-OF-LIFE
Freight types used to ship adidas and Reebok products 1 in % of product shipped
32
Apparel 2017 2016
Truck 7 7Sea freight 89 87Air freight 4 6
Accessories and gear 2017 2016
Truck 17 17Sea freight 81 78Air freight 2 5
Footwear 2017 2016
Truck 1 1Sea freight 96 95Air freight 3 4
2017 2016
1 Figures are expressed as a percentage of the total number of products transported. Data covers products sourced through Global Operations, excluding local sourcing.
ADID
AS
ANN
UAL
REPO
RT 2
017
0921 TO OUR SHAREHOLDERS 2 GROUP MANAGEMENT REPORT –
OUR COMPANY3 GROUP MANAGEMENT REPORT –
FINANCIAL REVIEW4 CONSOLIDATED FINANCIAL
STATEMENTS5 ADDITIONAL INFORMATION
SUSTAINABILITY

Progress toward targetsIn 2017, 93% (2016: 68%) of the cotton we sourced globally was Better Cotton, exceeding our original target of 80%. This is a huge step toward our goal of sourcing 100% sustainable cotton by 2018. Our success is the result of clear target setting – both with suppliers and with internal teams who support the sourcing of Better Cotton for our products.
2015 2016 2017
Better Cotton sourced 43% 68% 93%
We already eliminated plastic bags in our own stores globally in 2016, and have started to integrate Parley Ocean Plastic into key products, including running, outdoor, Originals and Stella McCartney shoes, football jerseys and swimwear. ↗ ADIDAS.COM/PARLEY Overall, we managed to create more than one million pairs of shoes with Parley Ocean Plastic in 2017. Together with Parley for the Oceans, we have further driven the conceptualization of the required set-up for a global collection network at scale. As part of our overall effort to extend social and environmental monitoring to lower tiers, we expanded our scope for the Parley supply chain from apparel suppliers to also include suppliers for footwear, and accessories and gear, now covering almost 20 Tier 2 suppliers in total.
Our ambition to expand the use of waterless dyeing technologies for our products received renewed support in 2017 as it was chosen as a key accelerator project going forward. This means that we will look into different technologies, including DryDye, with the aim to develop a holistic approach on how to save water overall, including water reduction during pre-treatment or the creation of a closed-loop water treatment system in dyeing factories. Furthermore, we also built on and
advanced our existing take-back program in Canada and introduced 'Make every thread count' to four of our strategic key cities (Los Angeles, New York, London and Paris).
CHEMICAL MANAGEMENT For years, adidas has been running leadership programs in
Chemical Management within its area of direct influence. In a spirit of continuous improvement of our chemical footprint, these programs are regularly updated. Our approach has been developed in consultation with external stakeholders including chemical experts, environmental organizations and industry federations and was reviewed by the Sponsor Board and finally approved by SEA and GOPS Senior Management. Our targets for 2020 include achieving 100% sustainable input chemistry by adopting the Manufacturing Restricted Substances List (MRSL) of the Zero Discharge of Hazardous Chemistry (ZDHC) group, phasing out hazardous chemicals and providing our strategic suppliers with a list of positive chemistry (the bluesign bluefinder). ↗ ADIDAS-GROUP.COM/S/CHEMICAL-FOOTPRINT
Progress toward targets In 2017, we collected the ZDHC MRSL acknowledgement letters from our suppliers, with more than 99% signed letters received from our strategic suppliers. Carefully reviewing the feedback from our suppliers will support us to define proper tracking and monitoring of MRSL compliance in our supply chain. On our way to phasing out hazardous chemicals, we successfully delivered against our commitment to be 99% free of poly- and perfluorinated substances (PFCs) by no later than the end of 2017: More than 99% of the adidas products for the spring/summer 2018 season will be PFC-free. Lastly, our suppliers exceeded the 2017 targets of 50% of auxiliaries and 80% dyestuffs to be bluesign-approved: By 2020, our
strategic apparel material suppliers will have 80% of auxiliaries and 90% of dyestuffs bluesign-approved.
2014 2017
Products free of PFC 90% > 99%
Volatile Organic Compounds (VOCs), which are typically found in solvents used in our manufacturing process, can – in high concentration – cause breathing difficulties and other health problems for production workers. In 2017, we achieved an all-time low of 11.6 grams (2016: 14 grams) of VOCs per pair of shoes 3. By applying innovative as well as environmentally sound bonding and priming technologies while following the adidas guidelines on the use of chemicals, our athletic footwear suppliers have been able to reduce the use of VOCs from well above 100 grams per pair in 1999 to below 12 grams.
FAIR WORKING CONDITIONS IN OUR SUPPLY CHAIN
adidas recognizes its responsibility to respect human rights and the importance of showing that we are taking the necessary steps to fulfil this social obligation as a business. We do this by striving to operate responsibly along the entire value chain, by safeguarding the rights of our own employees and those of the workers who manufacture our products through our Workplace Standards, and by applying our influence to affect change wherever human rights issues are linked to our business activities. As part of its human rights efforts, adidas has developed a modern slavery outreach program that looks beyond strategic Tier 1 suppliers, aiming to drive greater transparency in its supply chain. ↗ ADIDAS-GROUP.COM/S/HUMAN-RIGHTS
3 Data covers production in our main sourcing region Asia.
ADID
AS
ANN
UAL
REPO
RT 2
017
0931 TO OUR SHAREHOLDERS 2 GROUP MANAGEMENT REPORT –
OUR COMPANY3 GROUP MANAGEMENT REPORT –
FINANCIAL REVIEW4 CONSOLIDATED FINANCIAL
STATEMENTS5 ADDITIONAL INFORMATION
SUSTAINABILITY

Ensuring compliance with standardsSince its inception in 1997, our human and labor rights program for our supply chain has been built on the back of intense stakeholder outreach and engagement, seeking to understand and define the most salient issues to address as a company. Our Workplace Standards, the supply chain code of conduct established in 1997, are a contractual obligation under the manufacturing agreements the company signs with its main business partners to ensure workers’ health and safety and provide provisions to ensure environmentally sound factory operations. These standards follow International Labour Organization (ILO) and United Nations (UN) conventions relating to human rights and employment practices, as well as the model code of conduct of the World Federation of the Sporting Goods Industry (WFSGI). Specific reference to the code provisions of the ILO conventions is provided in the adidas ‘Guidelines on Employment Standards’. The SEA Senior Management reviews and approves all policies and implementation processes of the labor rights program.
To enforce compliance with these standards and rate suppliers on their ability to deliver fair, healthy and environmentally sound workplace conditions, adidas regularly conducts announced and unannounced, internal and external audits using a rating system with C- (social compliance) and E- (environmental compliance) KPIs and attached scores between 1C/1E and 5C/5E (with 1 being the worst and 5 being the best). According to the results, our sourcing teams decide the course of action, ranging from training needs at the factories to reinforcement mechanisms such as sending warning letters or even termination of contracts. Potential new suppliers are assessed in a similar way and orders can only be placed if approval by the SEA team has been granted.
Worker empowermentWe offer any stakeholder the opportunity to anonymously raise complaints and have found efficient ways to specifically empower workers in our supply chain by providing them with innovative tools to raise their voice. ↗ ADIDAS-GROUP.COM/S/
SUSTAINABILITY-CONTACT Since 2012, in parallel to existing grievance systems, the ‘Worker Hotline’ enables factory workers to anonymously ask questions or raise concerns by writing a text message. Additional ways to measure worker satisfaction and get their view are worker satisfaction surveys that we started to conduct in Indonesia in 2016.
Our ambitions for 2020 include achieving 100% of strategic suppliers 4 covered by innovative grievance mechanisms and supporting our suppliers and licensees in further improving their social and environmental compliance performance as measured by our C- and E-KPI rating tools.
Progress toward targetsThroughout 2017, we deepened our stakeholder engagement on the topic of human rights, extending our outreach to representatives of special-interest groups, migrant workers, and other vulnerable communities. We continued our involvement with a UN-backed multi-stakeholder committee, examining the adverse human rights impacts of mega sporting events and supported the UN’s Standards of Conduct for Business on LGBTI rights. Our engagement with the newly formed Business Network for Civic Freedoms and Human Rights Defenders included, for example, responding to calls from labor rights advocates for direct engagement with the Cambodian government over freedom of expression and association. We further contributed to the UN Special Rapporteur’s fourth annual report on the situation of human rights defenders and spoke at the United Nations in Geneva on this very topic. In addition, together with other stakeholders,
we have maintained a seat on FIFA’s Independent Advisor Board on Human Rights.
Efforts within our modern slavery outreach program have ranged from providing targeted training to almost 100 Tier 2 suppliers across Asia to gaining deeper insights into prevailing labor conditions at the Tier 3 raw material source for leather and cotton. We were recognized as a leading brand in the KnowTheChain ranking that examined forced labor risks in the leather supply chain in 2016 and were awarded the Thomson Reuters Foundation Stop Slavery Award 2017, which celebrates businesses that excel in efforts to identify, investigate and root out forced labor from their supply chains.
We were able to expand the Worker Hotline service: 63% of our strategic suppliers with more than 250,000 factory workers across four of our major sourcing countries (Cambodia, China, Indonesia and Vietnam) were covered by the end of 2017. Our focus was to improve this service to develop into a digital worker grievance platform, including a new app-based version which was piloted in some factories. We also further rolled out the worker satisfaction survey to a total of 47 factories across nine countries with around 8,000 factory workers participating in the survey. The results will help our suppliers to identify areas for improvement that need to be addressed, with progress to be communicated back to the workers. Lastly, we saw more than two thirds of our strategic supply chain evaluated with a 3C rating and good performance. More details are provided below.
4 Strategic suppliers are responsible for around 80% of our global production volumes.
ADID
AS
ANN
UAL
REPO
RT 2
017
0941 TO OUR SHAREHOLDERS 2 GROUP MANAGEMENT REPORT –
OUR COMPANY3 GROUP MANAGEMENT REPORT –
FINANCIAL REVIEW4 CONSOLIDATED FINANCIAL
STATEMENTS5 ADDITIONAL INFORMATION
SUSTAINABILITY

OUR PERFORMANCE (SUPPLY CHAIN)
At the end of 2017, we worked with 782 (2016: 1,038) independent factories which manufacture products for our company in 56 countries (2016: 63). SEE DIAGRAM 33 The main reason for the decline in the number of suppliers is the divestiture of the TaylorMade and CCM Hockey businesses as well as further consolidation at factories producing for our Sports Licensed business in 2017. We worked with 62 licensees whose suppliers manufactured products in 360 factories across 44 countries (2016: 61 licensees in 377 factories across 48 countries). 68% of the factories are located in the Asia Pacific region, 20% in the Americas, and 12% in Europe, Middle East and Africa (EMEA) 5.
AUDITS In 2017, adidas conducted 1,015 social compliance and
environmental audits (2016: 989), using in-house technical staff as well as external third-party monitors commissioned by adidas business entities and licensees. SEE TABLE 34
SEE TABLE 35
In addition, 114 self-governance audits and collaboration audits were conducted. When a factory reaches a compliance maturity level of 4C and above, we empower the supplier to conduct their own audit and develop appropriate remediation plans (‘self-governance’ audit) while we carefully track this process. Collaboration audits are conducted in partnership with other brands, or as part of joint remediation exercises.
Initial assessments, performance audits and environmental auditsIn 2017, we conducted a total of 209 initial assessments (2016: 213), 81% of which were undertaken in Asia (2016: 84%), with China accounting for 42% of these assessments (2016: 46%). Overall, 29% (2016: 39%) of all candidate factories either were rejected outright or were rejected for failure to remediate threshold issues in a timely manner. The total number of initial assessments, the first approval stage for new entry factories, decreased marginally by 2% compared to 2016. Performance audits at our current suppliers showed a slight increase of 3%. As part of our divestiture strategy, we increased the number of audits carried out at the factories making for the brands that we divested in 2017. We did so to ensure workers received their full benefits and entitlements during the transition of the owner relationship. The total number of environmental audits increased by 8% compared to the previous year, mainly due to the increase in SAC HIGG environmental assessments. SEE TABLE 35
The number of audits in factories manufacturing goods for licensees remained the same, in line with the stable number of licensees. SEE TABLE 36 The number of self-governance and collaboration audits at licensee factories totaled 26 at the end of 2017.
AUDIT COVERAGE A total of 48% (2016: 40%) of all active suppliers were
audited in 2017. ‘High-risk’ locations in Asia 6, the major sourcing region of adidas, received extensive monitoring in 2017 with an audit coverage that was close to 70% (2016: 65%). As a general principle, factories located in low-risk countries (i.e. with strong government enforcement and inspectorate systems) are considered out of scope for our audit coverage.
5 Factories in scope: Individual facilities of direct supply chain including subcontractors and factories of agencies (indirect supply chain). Supplier factories: Excluding own factories and licensee factories. Licensee factories: This may include factories that produce both for adidas directly and for licensees/agents. 6 High-risk locations in Asia include China, Hong Kong, Macao, Vietnam, Bangladesh, Cambodia, India, Indonesia, Laos, Malaysia, Myanmar, Pakistan, Philippines, Singapore, Sri Lanka and Thailand.
Supplier factories by region 1 33
1,000800600400200
0Asia Americas EMEA Total
2016661 273 104 1,03864% 26% 10% 100%
2017532 160 90 78268% 20% 12% 100%
1 Excluding own factories and licensee factories.
Number of audits in supplier factories 2015 – 2017 34
2017 2016 2015
adidas 409 372 524External monitor 606 617 611Total 1,015 989 1,135
ADID
AS
ANN
UAL
REPO
RT 2
017
0951 TO OUR SHAREHOLDERS 2 GROUP MANAGEMENT REPORT –
OUR COMPANY3 GROUP MANAGEMENT REPORT –
FINANCIAL REVIEW4 CONSOLIDATED FINANCIAL
STATEMENTS5 ADDITIONAL INFORMATION
SUSTAINABILITY

AUDIT RESULTS We audit our suppliers regularly against our Workplace
Standards and rate them according to their social and environmental compliance performance with a C- and E-KPI rating tool. An evaluation of E-KPI is contained in the description of the environmental performance of our supply chain.
Social compliance (C-KPI)In 2017, more than two thirds (69%) of our direct suppliers completely fulfilled our basic expectations and received ratings of 3C or better. Out of these, 19% were given a rating of 4C or better, which reflects an increase of 3 percentage points compared to the previous year. Suppliers rated with a 4C are classified as ‘self-governance’, indicating that these factories have reached a high level of complaince maturity with the existence of effective social and health and safety management systems and the ability to conduct their own audits and develop remediation plans on their own.
SEE DIAGRAM 37
Since 2013, there has been a focused effort to improve the 2C factories and move them up a level, which has led to a 14% reduction of suppliers in this category. The number of 1C category suppliers, which represent the lowest-performing factories with serious issues and very weak commitment to compliance, decreased from seven to six factories in 2017. Such factories are given a one-year grace period to move up a grade or have their services terminated.
The number of factories that are subject to C-KPI ratings has remained relatively stable at around 47% of the global supply chain for the last three years (2016: 45%). These factories represent our long-term strategic partners.
Number of audits conducted in licensee factories 1 36
Region Initial assessment 2 Performance audit 3 Environmental audit Total
2017 2016 2017 2016 2017 2016 2017 2016
Asia 49 54 187 182 11 12 247 248Americas 1 6 18 20 1 0 20 26EMEA 3 2 16 12 1 2 20 16Total 53 62 221 214 13 14 287 290
1 This may include factories that produce both for adidas directly and for licensees/agents. 2 Every new factory has to pass an initial assessment to prove compliance with the Workplace Standards before an order is placed.3 Audits conducted in approved factories.
Number of audits by region and type 35
Region Initial assessment 1 Performance audit 2 Environmental audit 3 Total
2017 2016 2017 2016 2017 2016 2017 2016
Asia 170 178 544 524 138 137 852 839Americas 9 23 70 75 12 0 91 98EMEA 30 12 37 34 5 6 72 52Total4 209 213 651 633 155 143 1,015 989
1 Every new supplier factory has to pass an initial assessment to prove compliance with the Workplace Standards before an order is placed. The data includes both ‘initial assessments’ and ‘initial assessment follow-ups’.2 Audits conducted in approved supplier factories.3 Includes SAC HIGG as well as environmental and chemical management audits.4 Includes audits done in licensee factories.
Percentage of KPI assessed factories by C rating 37
1C 2C 3C 4C 5C
5040302010
0
2017 2016
1 The calculation method reflects actual supplier performance by calcuating numbers using the latest KPI assessment rating of each active supplier.
2
32
50
16
12
29
49
19
1ADID
AS
ANN
UAL
REPO
RT 2
017
0961 TO OUR SHAREHOLDERS 2 GROUP MANAGEMENT REPORT –
OUR COMPANY3 GROUP MANAGEMENT REPORT –
FINANCIAL REVIEW4 CONSOLIDATED FINANCIAL
STATEMENTS5 ADDITIONAL INFORMATION
SUSTAINABILITY

VISITS AND TRAINING During 2017, 1,241 factory visits (2016: 1,226) were
undertaken. These visits involved various types of audit, Strategic Compliance Plan discussions, project work and project meetings with factory management on high-priority issues at different levels in our supply chain. Additionally, we conducted 132 training sessions and workshops for suppliers, licensees, workers and adidas employees (2016: 169). SEE
TABLE 38 The 22% decrease in the number of training sessions is a result of our advisory staff spending more time on engagement processes, including the development of worker satisfaction surveys and digital grievance systems for workers. In total, 1,907 people (2016: 3,349) attended the training sessions, which covered basic as well as long-term strategic topics.
NON-COMPLIANCE IN ACTIVE FACTORIES Our suppliers are evaluated against a number of critical
compliance issues. While threshold issues are serious but correctable non-compliances that can be addressed in a specified timeframe through remedial action, zero tolerance issues – such as forced labor, child labor practices and critical life-threatening health, safety and environment conditions – immediately trigger a warning and potential disqualification of a supplier. The diagrams SEE DIAGRAM 39 SEE DIAGRAM 40
illustrate the non-compliance findings that were identified through performance audits, collaboration audits and self-governance assessments 7.
Labor non-compliance findingsDIAGRAM 39 presents the most frequent labor-related non-compliances identified during audits of our existing supplier factories. More than two thirds of these findings fall into the top three categories: ‘Basic wage’, ‘Management systems for working hours’ and ‘No standardized filing systems’. Besides identifying non-compliances with our Workplace Standards, adidas’ compliance team focuses on the use and effectiveness of the factories’ HR management systems, and identifies any gaps in policies and procedures related to specific risk areas, such as forced labor, child labor, freedom of association or discrimination. As a result, the percentages shown indicate the systemic shortcomings of active suppliers, rather than the confirmed presence of a specific case of non-compliance.
SEE DIAGRAM 39
7 Data refers to the period May to December 2017 and includes self-governance and collaboration audits.
Number of training sessions by region and type 1 38
Region Type and number of training sessions
Fundamental 2 Performance 3 Sustainability 4 Total
2017 2016 2017 2016 2017 2016 2017 2016
Asia 42 42 4 40 49 45 95 127Americas 24 24 0 0 1 0 25 24EMEA 7 11 2 5 3 2 12 18Total 73 77 6 45 53 47 132 169in % 55 45 5 27 40 28 100 100
1 Training sessions conducted for suppliers, workers, licensees, agents and adidas employees.2 Fundamental training covers Workplace Standards and SEA introduction, FFC training as well as SEA policies and standard operating procedures (SOPs).3 Performance training covers specific labor, health, safety and environmental issues.4 Sustainability training covers sustainable compliance guideline and KPI improvement as well as factory self-audits.
Top 10 labor non-compliance findings identified during audits in 2017
39
1 ‘Other’ includes freedom of association issues, discrimination, lack of training, etc.2 ‘No standardized filing system’ indicates a factory does not keep relevant information/documents and
records which demonstrate compliance with laws and regulations.
3%Management systems of disciplinary practices
3%Recruitment
5%Social and medical insurance
5%Excessive hours
5%Communication systems
14%Management systems
for working hours
8%No standardized filing
system 2
6%Company policy/staff handbook
5%Annual leave/public holidays
23%Basic wage
23%Other 1
ADID
AS
ANN
UAL
REPO
RT 2
017
0971 TO OUR SHAREHOLDERS 2 GROUP MANAGEMENT REPORT –
OUR COMPANY3 GROUP MANAGEMENT REPORT –
FINANCIAL REVIEW4 CONSOLIDATED FINANCIAL
STATEMENTS5 ADDITIONAL INFORMATION
SUSTAINABILITY

Health and safety non-compliance findingsDIAGRAM 40 shows the health and safety non-compliances identified during audits in supplier factories. Fire and electrical safety are critical areas for existing suppliers and together accounted for 26% of the non-compliances identified in 2017. The way chemicals were stored and used, including the presence of banned chemicals, accounted for 12% of non-compliance findings reported. A further 6% of the findings related to management systems, policies and procedures, and specifically a lack of compliance with our Workplace Standards and expectation for effective health and safety systems, including the recruitment and retention of qualified safety staff.
SEE DIAGRAM 40
ENFORCEMENT Warning letters are an essential part of our enforcement
efforts and are triggered when we find ongoing serious non-compliance issues that need to be addressed by our suppliers. We work closely with our suppliers to help them improve their performance. However, where we face situations of severe or repeated non-compliance, we do terminate business relationships with suppliers.
Warning lettersIn 2017, we issued a total of 42 (2016: 31) warning letters across 15 countries. The largest number of warning letters continues to be issued in Asia, where more than 60% of all supplier factories are located. Compared to the previous year, the overall number of first warning letters doubled, mainly due to the fact that factories were not able to fully remediate their threshold issues identified in 2016, or had new threshold issues in 2017.
The total number of second warnings decreased in 2017, with three letters being issued (2016: 7). Suppliers who receive second warning letters are only one step away from being notified of possible termination of the manufacturing agreement and receive focused moni toring by the SEA team. The number of third warning letters issued to business partners (which result in factory terminations) decreased to one in 2017 (2016: 5). SEE TABLE 41
It is difficult to generalize about the grounds for a warning letter as it may be issued for a single unresolved non-conformance or for multiple breaches of our standards. The range of issues that resulted in warning letters in 2017 included non-compliances in regard to fire safety practices, receipt of wages, social and medical insurance, hazardous chemicals management, overtime, deductions, transparency and safety controls in high-risk areas.
INDEPENDENT FLA AUDITS In 2017, the FLA conducted four factory assessments or
remediation verification exercises in Guatemala, Indonesia, Cambodia and Vietnam using the methodology from the Sustainable Compliance Initiative (SCI). The number of conventional independent monitoring visits conducted by FLA accredited monitors has declined over the years for companies’ programs accredited by the FLA. This shifts companies’ activities from conventional monitoring activities to engagement in value-added FLA projects that focus on reducing and eliminating chronic non-compliance issues or improving monitoring methodologies. During 2017, adidas’ so-called twelve redirect activities included project activities for migrant worker protection, compliance beyond Tier 1 suppliers, civil society engagement in the Americas region, and responsible sourcing practices. We continued active support of the implementation of the FLA Fair Compensation Strategy with wage data gathering exercises in Honduras, Ukraine and Cambodia.
In 2017, the FLA accredited the adidas program for the third time. To provide information for the accreditation, nine years of social compliance work was evaluated, reviewed and verified, including factory assessments, annual reports, third-party complaints, participation in strategic projects for forced labor, migrant workers’ protection, fair compensation, remediation, workplace standards alignment, responsible sourcing practices, and collaboration with civil society and brands. The accreditation recognized adidas’ leadership to coordinate brand efforts which address labor violations, and included commendation for the application of mobile technology to implement the text message- and application-based platform for workers to submit grievances, for the pioneering and piloting of various methods to address fair compensation for workers as well as for the programmatic implementation of social compliance standards, assessments and risk mapping beyond the Tier 1 supply chain. ↗ FAIRLABOR.ORG
Top 10 health and safety non-compliance findings identified during audits in 2017
40
1 ‘Other’ refers, for example, to occupational hazard risks, personal protective equipment, ergonomics and housekeeping.
6%Sanitation and hygiene
4%Personal protective equipment
3%First aid
5%Chemical storage
4%Electricity and electrical hazards
7%Hazardous chemicals
in production
9%Machine safety
6%Management systems
for health and safety
12%Architectural
considerations
22%Fire safety
22%Other 1
ADID
AS
ANN
UAL
REPO
RT 2
017
0981 TO OUR SHAREHOLDERS 2 GROUP MANAGEMENT REPORT –
OUR COMPANY3 GROUP MANAGEMENT REPORT –
FINANCIAL REVIEW4 CONSOLIDATED FINANCIAL
STATEMENTS5 ADDITIONAL INFORMATION
SUSTAINABILITY
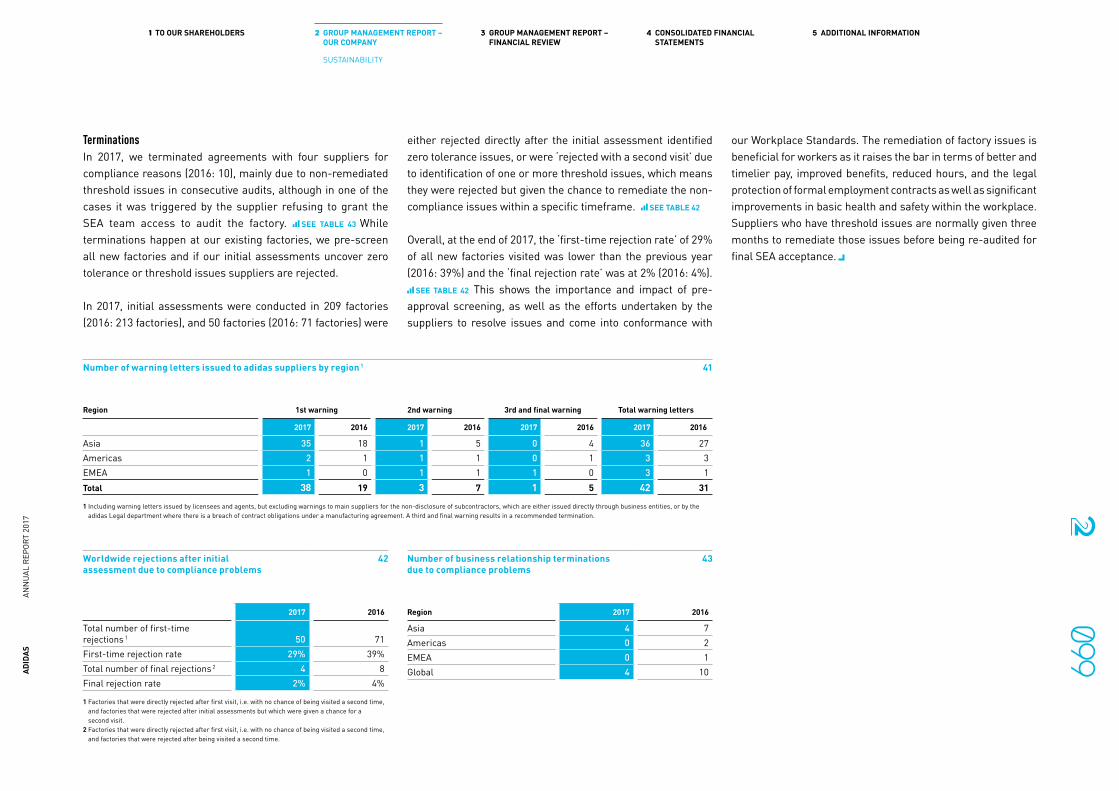
TerminationsIn 2017, we terminated agreements with four suppliers for compliance reasons (2016: 10), mainly due to non-remediated threshold issues in consecutive audits, although in one of the cases it was triggered by the supplier refusing to grant the SEA team access to audit the factory. SEE TABLE 43 While terminations happen at our existing factories, we pre-screen all new factories and if our initial assessments uncover zero tolerance or threshold issues suppliers are rejected.
In 2017, initial assessments were conducted in 209 factories (2016: 213 factories), and 50 factories (2016: 71 factories) were
either rejected directly after the initial assessment identified zero tolerance issues, or were ‘rejected with a second visit’ due to identification of one or more threshold issues, which means they were rejected but given the chance to remediate the non-compliance issues within a specific timeframe. SEE TABLE 42
Overall, at the end of 2017, the ‘first-time rejection rate’ of 29% of all new factories visited was lower than the previous year (2016: 39%) and the ‘final rejection rate’ was at 2% (2016: 4%).
SEE TABLE 42 This shows the importance and impact of pre-approval screening, as well as the efforts undertaken by the suppliers to resolve issues and come into conformance with
our Workplace Standards. The remediation of factory issues is beneficial for workers as it raises the bar in terms of better and timelier pay, improved benefits, reduced hours, and the legal protection of formal employment contracts as well as significant improvements in basic health and safety within the workplace. Suppliers who have threshold issues are normally given three months to remediate those issues before being re-audited for final SEA acceptance.
Number of warning letters issued to adidas suppliers by region 1 41
Region 1st warning 2nd warning 3rd and final warning Total warning letters
2017 2016 2017 2016 2017 2016 2017 2016
Asia 35 18 1 5 0 4 36 27Americas 2 1 1 1 0 1 3 3EMEA 1 0 1 1 1 0 3 1Total 38 19 3 7 1 5 42 31
1 Including warning letters issued by licensees and agents, but excluding warnings to main suppliers for the non-disclosure of subcontractors, which are either issued directly through business entities, or by the adidas Legal department where there is a breach of contract obligations under a manufacturing agreement. A third and final warning results in a recommended termination.
Worldwide rejections after initial assessment due to compliance problems
42
2017 2016
Total number of first-time rejections 1 50 71First-time rejection rate 29% 39%Total number of final rejections 2 4 8Final rejection rate 2% 4%
1 Factories that were directly rejected after first visit, i.e. with no chance of being visited a second time, and factories that were rejected after initial assessments but which were given a chance for a second visit.
2 Factories that were directly rejected after first visit, i.e. with no chance of being visited a second time, and factories that were rejected after being visited a second time.
Number of business relationship terminations due to compliance problems
43
Region 2017 2016
Asia 4 7Americas 0 2EMEA 0 1Global 4 10AD
IDAS
AN
NUA
L RE
PORT
201
7
0991 TO OUR SHAREHOLDERS 2 GROUP MANAGEMENT REPORT –
OUR COMPANY3 GROUP MANAGEMENT REPORT –
FINANCIAL REVIEW4 CONSOLIDATED FINANCIAL
STATEMENTS5 ADDITIONAL INFORMATION
SUSTAINABILITY

NON-FINANCIAL STATEMENTIn accordance with §§ 315b, 315c HGB in combination with §§ 289b to 289e HGB, adidas publishes a combined non-financial statement for adidas AG and the Group in this combined Management Report. The content of the non-financial state ment can be found throughout the entire combined Management Report, with relevant parts being indicated by this symbol . These parts are not covered by the Audit of the Consolidated Financial Statements and of the Group Management Report, as they were subject to a separate limited assurance engagement of KPMG AG Wirtschafts-prüfungs gesellschaft. SEE INDEPENDENT AUDITOR’S ASSURANCE REPORT, P. 226 Links and references are not part of the non-financial statement and have therefore not been assessed.
adidas applied the Global Reporting Initiative (GRI) guidelines as an external reporting framework. The content of the non-financial statement combined with further information in this report and on our corporate website fulfills the GRI G4 ‘Core’ option. The GRI content index can be found online. ↗ ADIDAS-GROUP.COM/S/REPORTING-APPROACH
Description of business model SEE SALES AND DISTRIBUTION STRATEGY, P. 72
SEE GLOBAL OPERATIONS, P. 74
Environmental approach — Sustainable materials and processes
SEE SUSTAINABILITY, P. 88
— Water consumption (supply chain) SEE SUSTAINABILITY, P. 88
— Carbon footprint (supply chain) SEE SUSTAINABILITY, P. 88
— Waste volume (supply chain) SEE SUSTAINABILITY, P. 88
Product responsibility — Product safety and transparency
SEE SUSTAINABILITY, P. 88
People and Culture — Wages and benefits
SEE PEOPLE AND CULTURE, P. 81
— Development and training SEE PEOPLE AND CULTURE, P. 81
— Employee engagement SEE PEOPLE AND CULTURE, P. 81
SEE INTERNAL MANAGEMENT SYSTEM, P. 102
Consumer matters — Consumer satisfaction
SEE INTERNAL MANAGEMENT SYSTEM, P. 102
SEE MANAGEMENT ASSESSMENT OF PERFORMANCE, RISKS AND
OPPORTUNITIES, AND OUTLOOK, P. 146
Human Rights — Fair labor conditions
SEE SUSTAINABILITY, P. 88
— Fair labor conditions (supply chain) SEE SUSTAINABILITY, P. 88
— Supplier relationships SEE GLOBAL OPERATIONS, P. 74
Anti-bribery and corruption — Ethical business practices
SEE RISK AND OPPORTUNITY REPORT, P. 131
ADID
AS
ANN
UAL
REPO
RT 2
017
1001 TO OUR SHAREHOLDERS 2 GROUP MANAGEMENT REPORT –
OUR COMPANY3 GROUP MANAGEMENT REPORT –
FINANCIAL REVIEW4 CONSOLIDATED FINANCIAL
STATEMENTS5 ADDITIONAL INFORMATION
NON-FINANCIAL STATEMENT

G R O U P M A N A G E M E N T
R E P O R TF I N A N C I A L R E V I E W
Internal Management System 102
Business Performance 105Economic and Sector Development 105Income Statement 107Statement of Financial Position and Statement of Cash Flows 111Treasury 115Financial Statements and Management Report of adidas AG 118Disclosures pursuant to § 315a Section 1 and § 289a Section 1 of the German Commercial Code 120
Business Performance by Segment 124Western Europe 124North America 124Greater China 125Russia/CIS 125Latin America 126Japan 126MEAA 126
Subsequent Events and Outlook 128Subsequent Events 128Outlook 128
Risk and Opportunity Report 131Illustration of Material Risks 136Illustration of Opportunities 144
Management Assessment of Performance, Risks and Opportunities, and Outlook 146
Group Management Report: This report contains the Group Management Report of the adidas Group, comprising adidas AG and its consolidated subsidiaries, and the Management Report of adidas AG.
101AD
IDAS
AN
NUA
L RE
PORT
201
7

INTERNAL MANAGEMENT SYSTEMWe are committed to increasing shareholder value. We strive to create value by converting sales and operating profit growth into strong operating cash flow, while at the same time managing our asset base proactively. Our company’s planning and controlling system is therefore designed to provide a variety of tools to assess our current performance and to align future strategic and investment decisions to best utilize commercial and organizational opportunities in the interest of our shareholders.
INTERNAL MANAGEMENT SYSTEM DESIGNED TO DRIVE SHAREHOLDER VALUEIn order to drive and steer creation of shareholder value, the company’s Management focuses on a set of major financial Key Performance Indicators (KPIs). SEE DIAGRAM 44 Sales and operating profit growth, paired with a focus on management of operating working capital, are the main contributors to operating cash flow SEE GLOSSARY improvements. At the same time, value-enhancing capital expenditure benefits future operating profit and cash flow development. In addition, the development of the company’s net income position, as well as earnings per share (EPS), is of high importance as it directly drives returns in the interest of our shareholders. SEE
DIAGRAM 44 Our strong focus on shareholder value creation is reflected in the fact that our Management’s variable com-pensation is closely linked to the company’s growth in sales, profitability and net income. SEE COMPENSATION REPORT, P. 39
OPERATING MARGIN AS MAJOR KPI FOR OPERATIONAL PROGRESSOperating margin (defined as operating profit as a percentage of net sales) is one of our company’s major KPIs to drive and improve our operational performance. It highlights the quality
of our top line and operational efficiency. The primary drivers to enhance operating margin are as follows:
— Sales and gross margin development: Management focuses on identifying and exploiting growth opportunities that not only provide for future top-line improvements, but also have potential to increase our gross margin. Major levers for enhancing our sales and gross margin include:
— Minimizing clearance activities, while at the same time increasing the full-price share of sales.
— Optimizing our product mix. — Improving the quality of distribution, with a particular
focus on e-commerce and controlled space SEE GLOSSARY. — Realizing supply chain efficiency initiatives.
— Operating expense control: Management puts high emphasis on tightly controlling operating expenses to leverage sales growth through to the bottom line. This requires a particular focus on ensuring flexibility in the company’s cost base. Marketing expenditure SEE GLOSSARY is one of our largest operating expenses and at the same time one of the most important mechanisms for driving brand desirability and top-line growth sustainably.
Therefore, we are committed to improving the efficiency of our marketing investments. This includes concentrating our communication efforts on key global brand initiatives and focusing our promotion spend on well-selected partnerships with top events, leagues, clubs, federations, athletes and artists. We also aim to increase operational efficiency by tightly managing operating overhead expenses
SEE GLOSSARY. In this respect, we regularly review our operational structure – harmonizing business processes, standardizing systems, eliminating redundancies and leveraging the scale of our organization.
TIGHT OPERATING WORKING CAPITAL MANAGEMENTDue to a comparatively low level of fixed assets required in our business, the efficiency of the balance sheet depends to a large degree on our operating working capital management. In this context, our key metric is average operating working capital as a percentage of net sales. Monitoring the development of this metric facilitates the measurement of our progress in improving the efficiency of our business cycle.
Major Key Performance Indicators (KPIs) 44
Net sales
Operating cash flowShareholder
value
Operating profit
Operating working capital
Capital expenditure
Net income / EPS Shareholder return
ADID
AS
ANN
UAL
REPO
RT 2
017
1021 TO OUR SHAREHOLDERS 2 GROUP MANAGEMENT REPORT –
OUR COMPANY3 GROUP MANAGEMENT REPORT –
FINANCIAL REVIEW4 CONSOLIDATED FINANCIAL
STATEMENTS5 ADDITIONAL INFORMATION
INTERNAL MANAGEMENT SYSTEM

We strive to proactively manage our inventory levels to meet market demand and ensure fast replenishment. Inventory aging is controlled carefully to reduce inventory obsolescence and to minimize clearance activities. As a result, Inventory Days Lasting (IDL) is monitored and assessed regularly as it measures the average number of days goods remain in inventory before being sold, highlighting the efficiency of capital locked up in products. To optimize capital tied up in accounts receivable, we strive to improve collection efforts in order to reduce the Days of Sales Outstanding (DSO) and improve the aging of accounts receivable. Likewise, we strive to optimize payment terms with our suppliers to best manage our accounts payable.
CAPITAL EXPENDITURE TARGETED TO MAXIMIZE FUTURE RETURNSImproving the effectiveness of capital expenditure SEE GLOSSARY
is another major lever to maximize our operating cash flow. We control capital expenditure with a top-down, bottom-up approach. SEE GLOSSARY In a first step, Management defines focus areas within the framework of our strategic business plan ‘Creating the New’ and an overall investment budget based on investment requests from various functions within the organization. Then, in a second step, our operating segments align their initiatives within the scope of assigned priorities and available budget. We evaluate potential return on planned investments utilizing the net present value method. Risk is accounted for, adding a risk premium to the cost of capital and thus reducing our estimated future earnings streams where appropriate. By means of scenario planning, the sensitivity of investment returns is tested against changes in initial assumptions. For large investment projects, timelines and deviations versus budget are monitored on a monthly basis throughout the course of the project.
In addition to optimizing return on investments, we evaluate larger projects upon completion and document learnings for future capital expenditure decisions.
NET INCOME AND EARNINGS PER SHARE TO FOCUS ON SHAREHOLDER INTERESTSBeyond our ambition to maximize operating cash flow, we are committed to a continuous improvement in the company’s bottom line. We are convinced that, by doing so, we place an even stronger focus on the interests of our shareholders. Consequently, Management closely monitors the develop-ment of both net income and earnings per share (EPS) and executes against these two major financial KPIs. SEE
DIAGRAM 44 Our strong focus on driving sustainable expansion to the company’s bottom line is also reflected in the fact that, as part of the new Long-Term Incentive Plan 2018/2020, the variable compensation for our Management is directly linked to the company’s net income growth.
SEE COMPENSATION REPORT, P. 39
NON-FINANCIAL KEY PERFORMANCE INDICATORSIn addition to the major financial KPIs to assess the performance and operational success of our company, as outlined above, we have identified a set of non-financial KPIs that help us track our progress in areas that are critical for our long-term success but are not directly reflected in the financial statements. These non-financial KPIs are assessed on a regular basis and managed by the respective busi ness functions. Non-financial KPIs which we are closely moni-toring include, amongst others, Net Promoter Score (NPS)
SEE GLOSSARY, market share, backlogs and sell-through data as well as our customer delivery performance (On-Time In-Full), employee engagement and a set of KPIs in the area of our sustainability performance.
Net Promoter Score (NPS): Maintaining and enhancing brand desirability through the creation of strong brand identities is crucial for sustaining and driving profitable growth. Therefore, mainly on a market and category level, we invest in primary qualitative and quantitative research such as trend scouting and consumer surveys to determine brand loyalty and brand strength. Measures that are tracked include brand awareness, likeability and purchase intent.
Furthermore, within the framework of Creating the New, we implemented an NPS system, which strengthens our capabilities to more carefully review brand advocacy as NPS tells us how likely it is that consumers will recommend our brands. NPS is a key pillar in transforming our company into a consumer-centric organization. It represents a holistic and transparent measure of brand performance and has been successfully applied in other industries and organizations. NPS comes from the following question asked to a surveyed group of people: ‘How likely is it that you would recommend this brand to a friend?’ The answer has a scale from 0 to 10 with 10 being the most likely. NPS is calculated using Promoters (consumers that answered 9 or 10) minus Detractors (consumers that answered 0 to 6). Consumers answering 7 or 8 are called Neutrals or Passives and are not taken into consideration for the calculation of the NPS.
Our efforts around NPS (both our own NPS as well as the NPS of our major competitors) are driven by an independent agency and monitored by our internal global consumer insight teams on a regular basis. In addition, NPS is measured across many of our own-retail stores as well as our own e-commerce platform. We firmly believe that advocacy will create sustained growth for our brands, underpinned by the fact that brand advocates on average buy more than non-advocates. In addition, a large part of our consumers rely on referrals by friends or family when making purchase decisions.
ADID
AS
ANN
UAL
REPO
RT 2
017
1031 TO OUR SHAREHOLDERS 2 GROUP MANAGEMENT REPORT –
OUR COMPANY3 GROUP MANAGEMENT REPORT –
FINANCIAL REVIEW4 CONSOLIDATED FINANCIAL
STATEMENTS5 ADDITIONAL INFORMATION
INTERNAL MANAGEMENT SYSTEM

Market share: To measure the operational performance of our brands relative to our major competitors, we continuously collect, on a market and category level, market share data.
SEE CORPORATE STRATEGY, P. 62 The findings provide detailed insights for our senior management team into which markets and categories we have been able to gain market share relative to our peers, enabling us to leverage those insights across the organization. SEE MANAGEMENT ASSESSMENT OF
PERFORMANCE, RISKS AND OPPORTUNITIES, AND OUTLOOK, P. 146 In addition, the results help us to define clear roles and responsibilities for each of our markets and categories within our long-term strategic aspirations, based on their overall positioning within the sporting goods industry.
Backlogs and sell-through data: To manage demand planning and better anticipate our future performance, backlogs
SEE GLOSSARY comprising orders received up to nine months in advance of the actual sale are monitored closely. However, due to the growing share of own retail (including our own e-commerce channel) in our business mix, fluctuating order patterns among our customers as well as an increasing part of our business being realized under significantly shortened lead times, orders received from our retail partners are less indicative of anticipated revenues for adidas compared to the past. Therefore, qualitative feedback from our retail partners on the sell-through success of our products at the point of sale as well as such data received from our own-retail activities is becoming increasingly important.
On-Time In-Full (OTIF): OTIF measures the company’s delivery performance towards customers and our own-retail stores. Managed by our Global Operations function, OTIF assesses to what degree customers received what they ordered and if they received it on time. SEE GLOBAL OPERATIONS, P.
74 It helps us to investigate improvement potential in the area of order book management and logistics processes. It
therefore also helps us to improve our delivery performance, which is a major aspect when it comes to customer satisfaction. The OTIF assessment covers both the adidas and Reebok brands in most of our key markets. SEE
MANAGEMENT ASSESSMENT OF PERFORMANCE, RISKS AND OPPORTUNITIES, AND
OUTLOOK, P. 146
Employee engagement: To measure the level of engagement and motivation of our employees, adidas carries out employee engagement surveys. These surveys aim to provide key insights into how well we, as an employer, are doing in engaging our employees. They thus enable us to develop the right focus and future people strategies across our organization, helping us to create a world-class employee experience and continue to attract and retain top talent. Against the background of organizational and management changes within the company, a new approach and system platform for measuring the level of employee engagement was implemented in 2017.
SEE PEOPLE AND CULTURE, P. 81
Sustainability performance: We have a strong commitment to enhance the social and environmental performance of our company. By doing so, we firmly believe we will not only improve the company’s overall reputation, but also increase its economic value. We therefore follow a comprehensive roadmap with clear targets and regularly track our progress toward these targets. SEE MANAGEMENT ASSESSMENT OF
PERFORMANCE, RISKS AND OPPORTUNITIES, AND OUTLOOK, P. 146 A major focus lies on measuring the environmental footprint of our own sites globally as well as monitoring and rating our supplier factories with regard to social and environmental compli-ance with our Workplace Standards. SEE SUSTAINABILITY, P. 88 We have a strong track record in sustainability disclosure, providing regular updates about our sustainability performance in the company’s Annual Report as well as on our corporate website. ↗ ADIDAS-GROUP.COM/S/SUSTAINABILITY-REPORTS
STRUCTURED PERFORMANCE MEASUREMENT SYSTEMWe have developed an extensive performance measurement system, which utilizes a variety of tools to measure the company’s performance. Key performance indicators as well as other important financial metrics are monitored and compared against initial targets as well as rolling forecasts
SEE GLOSSARY on a monthly basis. When negative deviations exist between actual and target numbers, we perform a detailed analysis to identify and address the cause. If necessary, action plans are implemented to optimize the development of our operating performance. To assess current sales and profitability development, Management continuously analyzes the performance of our operating segments. We also benchmark our financial results with those of our major competitors on a regular basis.
Taking into account year-to-date performance as well as opportunities and risks, the company’s full year financial performance is assessed on a monthly basis. In this respect, also backlogs, sell-through data, feedback from customers and own-retail stores are assessed as available. Finally, as a further early indicator for future performance, the results of any relevant recent market and consumer research are assessed as available.
ADID
AS
ANN
UAL
REPO
RT 2
017
1041 TO OUR SHAREHOLDERS 2 GROUP MANAGEMENT REPORT –
OUR COMPANY3 GROUP MANAGEMENT REPORT –
FINANCIAL REVIEW4 CONSOLIDATED FINANCIAL
STATEMENTS5 ADDITIONAL INFORMATION
INTERNAL MANAGEMENT SYSTEM

BUSINESS PERFORMANCEIn 2017, adidas recorded strong operational and financial improvements. Revenues increased 16% on a currency-neutral basis, driven by strong double-digit growth at the adidas brand and a mid-single-digit sales increase at Reebok. All market segments recorded double-digit currency- neutral sales increases, with the exception of Russia/CIS, where revenues declined. The gross margin increased 1.2 percentage points to 50.4%, mainly reflecting an improved pricing and product mix. Other operating expenses as a percentage of sales were down 0.8 percentage points to 41.9%. Despite the non-recurrence of a one-time gain related to the early termination of the Chelsea F.C. sponsorship that was included in the prior year, the company’s operating margin increased 1.2 percentage points to 9.8%. As a result of a revaluation of the company’s US deferred tax assets, which became necessary following the implementation of the US tax reform, the company recorded a negative one-time tax impact in the amount of € 76 million in 2017. Excluding this negative one-time tax impact, net income from continuing operations increased 32% to € 1.430 billion. This translates into basic EPS from continuing operations of € 7.05, representing an increase of 31% versus the prior year period.
ECONOMIC AND SECTOR DEVELOPMENT
GLOBAL ECONOMY ACCELERATES IN 2017 1
The global economy gained pace during 2017, with global gross domestic product (GDP) expanding 3.0%. The upswing was driven by a rise in consumer confidence, a pick-up in manufacturing activity, a stabilization of commodity prices
and benign financing conditions. Moreover, a simultaneous recovery in major developed economies as well as developing economies provided a major boost to global trade. Despite domestic policy uncertainty in major economies, developed
economies grew 2.3% in 2017, supported by improving labor market conditions as well as accommodative monetary policies. In particular, topics around international relations, such as the ongoing Brexit negotiations, remained a political
1 Source: World Bank Global Economic Prospects.
Regional GDP development 1 in % 45
Global 2 Euro area 2 Eastern Europe 2, 3 USA 2 Asia 2, 4 Latin America 2
76543210
– 1– 2
2015 2016 2017
1 Real change in percent versus prior year; 2015 and 2016 figures restated compared to prior year.2 Source: World Bank.3 Includes Emerging Europe and Central Asia.4 Includes East Asia and Pacific.
Quarterly unemployment rate by region 1 in % of total active population
46
Q4 2016 Q1 2017 Q2 2017 Q3 2017 Q4 2017
USA 2 4.7 4.5 4.3 4.2 4.1Euro area 3 9.6 9.4 9.1 8.9 8.7Japan 4 3.1 2.8 2.8 2.8 2.7China 5 4.0 4.0 4.0 4.0 4.0Russia 6 5.3 5.4 5.1 5.1 5.1Brazil 7 11.9 13.7 13.0 12.4 12.0
1 Quarter-end figures except for Q4 figures (refer to November data).2 Source: US Bureau of Labor Statistics.3 Source: Eurostat.4 Source: Japan Ministry of Internal Affairs and Communications.5 Source: China Ministry of Human Resources and Social Security.6 Source: Russia Federal Service of State Statistics.7 Source: Brazil Institute of Geography and Statistics.
Quarterly development of consumer price index 1 by region
47
Q4 2016 Q1 2017 Q2 2017 Q3 2017 Q4 2017
USA 2 2.1 2.4 1.6 2.2 2.2Euro area 3 1.1 1.5 1.3 1.5 1.4Japan 4 0.3 0.2 0.4 0.7 0.6China 5 2.1 0.9 1.5 1.6 1.8Russia 6 5.4 4.3 4.4 3.0 2.5Brazil 7 6.3 4.6 3.0 2.5 3.0
1 Quarter-end figures except for Q4 figures (refer to November data).2 Source: US Bureau of Labor Statistics.3 Source: Eurostat.4 Source: Japan Ministry of Internal Affairs and Communications.5 Source: China National Bureau of Statistics.6 Source: Russia Federal Service of State Statistics.7 Source: Brazil Institute of Geography and Statistics.
2.8
1.0
2.12.9
6.5
2.41.71.8 1.5
6.3
0.9
3.03.8
2.4 2.3
6.4
(1.5)(0.6)
ADID
AS
ANN
UAL
REPO
RT 2
017
1051 TO OUR SHAREHOLDERS 2 GROUP MANAGEMENT REPORT –
OUR COMPANY3 GROUP MANAGEMENT REPORT –
FINANCIAL REVIEW4 CONSOLIDATED FINANCIAL
STATEMENTS5 ADDITIONAL INFORMATION
BUSINESS PERFORMANCEEconomic and Sector Development

overhang but were less of a drag on economic activity than previously expected. At 4.3%, growth in developing economies accelerated, as obstacles to economic activity diminished in commodity-exporting countries and commodity prices experienced a further stabilization.
ROBUST GROWTH IN THE SPORTING GOODS INDUSTRY CONTINUES The global sporting goods industry continued to grow at robust rates in 2017, despite a moderate deceleration of momentum in individual regions. In particular, sector growth in North America was slower than in previous years as the marketplace was negatively impacted by a further consolidation in US retail and by supply-demand mismatches in certain categories. Most other markets expanded, driven by global trends such as increasing penetration of sportswear (‘athleisure’) SEE GLOSSARY, rising sports participation rates and increasing health awareness. Moreover, digital developments continued to reshape the sports industry around the world. Social fitness remained an overriding theme and the e-commerce channel continued to see rapid
expansion, as retailers are leveraging both mobile technologies and social media tools. From a category perspective, athletic footwear continued to drive the sector in 2017, supported by ongoing high demand for various casual and running styles. Basketball footwear, on the other hand, remained challenged throughout the year. Growth in the overall athletic apparel category was more muted in the absence of major global sports events during 2017. Nevertheless, underlying demand for activewear apparel remained robust, as consumers continued to reallocate wallet share away from traditional apparel. The equipment category recorded another mixed year in 2017, albeit with signs of stabilization in some areas.
Quarterly consumer confidence development 1 by region
48
Q4 2016 Q1 2017 Q2 2017 Q3 2017 Q4 2017
USA 2 113.3 124.9 117.3 120.6 123.1Euro area 3 (5.1) (5.1) (1.3) (1.2) 0.5Japan 4 42.3 43.9 43.3 43.9 44.7China 5 108.4 111.0 113.3 118.6 122.6Russia 6 (18.0) (15.0) (14.0) (11.0) (11.0)Brazil 7 100.3 102.0 100.5 98.5 100.5
1 Quarter-end figures.2 Source: Conference Board.3 Source: European Commission.4 Source: Economic and Social Research Institute, Government of Japan.5 Source: China National Bureau of Statistics.6 Source: Russia Federal Service of State Statistics.7 Source: Brazil National Confederation of Industry.
Exchange rate development 1 € 1 equals 49
Average rate
2016Q1
2017Q2
2017Q3
2017Q4
2017
Average rate
2017
USD 1.1069 1.0691 1.1412 1.1806 1.1993 1.1266GBP 0.8188 0.8555 0.8793 0.8818 0.8872 0.8754JPY 120.40 119.55 127.75 132.82 135.01 126.24RUB 74.278 60.274 67.428 68.495 69.080 65.560CNY 7.3515 7.3760 7.8664 7.8355 7.8365 7.6116
1 Spot rates at quarter-end.
ADID
AS
ANN
UAL
REPO
RT 2
017
1061 TO OUR SHAREHOLDERS 2 GROUP MANAGEMENT REPORT –
OUR COMPANY3 GROUP MANAGEMENT REPORT –
FINANCIAL REVIEW4 CONSOLIDATED FINANCIAL
STATEMENTS5 ADDITIONAL INFORMATION
BUSINESS PERFORMANCEEconomic and Sector Development

INCOME STATEMENT
ADIDAS DELIVERS STRONG FINANCIAL PERFORMANCE IN 2017In 2017, revenues increased 16% on a currency-neutral basis. In euro terms, revenues grew 15% to € 21.218 billion from € 18.483 billion in 2016. SEE DIAGRAM 50 From a market segment perspective, currency-neutral sales grew at double-digit rates in all regions in 2017, except for Russia/CIS, where revenues declined. SEE BUSINESS PERFORMANCE BY SEGMENT, P. 124
ADIDAS BRAND REVENUES GROW AT STRONG DOUBLE-DIGIT RATECurrency-neutral revenues for the adidas brand increased 18%, driven by double-digit sales increases in the running and outdoor categories as well as at adidas Originals and adidas neo. In addition, high-single-digit sales increases in the training category also contributed to this development. In euro terms, adidas brand revenues grew 16% to € 18.993 billion compared to € 16.334 billion in 2016. Currency-neutral Reebok brand sales were up 4% versus the prior year, driven by double-digit sales increases in Classics as well as low-single-digit growth in the running category. While Reebok’s international revenues grew at a double-digit rate in 2017, sales in the US declined, reflecting the significant amount of store closures in the market. In euro terms, Reebok sales increased 4% to € 1.843 billion (2016: € 1.770 billion).
SALES GROW IN FOOTWEAR AND APPARELCurrency-neutral footwear sales grew 24% in 2017, driven by double-digit growth in the running category as well as at adidas Originals and adidas neo. In addition, high-single-digit increases in the football and training categories also contributed to this development. Apparel revenues grew 7% on a currency-neutral basis, due to double-digit increases in the outdoor category as well as at adidas Originals. In addition, high-single-digit growth in the training category also contributed to this development. Currency-neutral accessory and hardware sales were up 6%, driven by double-digit growth at adidas Originals and adidas neo. SEE DIAGRAM 53
Net sales by product category 1 € in millions 53
2017 2016 Change
Change (currency-
neutral)
Footwear 12,427 10,132 23% 24%Apparel 7,747 7,352 5% 7%Hardware 1,044 999 5% 6%Total 21,218 18,483 15% 16%
1 Figures reflect continuing operations as a result of the divestiture of the Rockport, TaylorMade, Adams Golf, Ashworth and CCM Hockey businesses.
Net sales by region 1 in % of net sales 52
1 Figures reflect all operating activities of the operating segments, including Other Businesses.
3%Russia/CIS
9%Latin America
5%Japan
18%Greater China
14%MEAA
21%North America
29%Western Europe
Net sales 1, 2 € in millions 50
2017 21,218 2016 18,483 2015 16,9152014 14,5342013 14,203
1 2017 and 2016 figures reflect continuing operations as a result of the divestiture of the Rockport, TaylorMade, Adams Golf, Ashworth and CCM Hockey businesses.
2 2015, 2014 and 2013 figures reflect continuing operations as a result of the divestiture of the Rockport business.
Net sales by segment € in millions 51
2017 2016 Change
Change (currency-
neutral)
Western Europe 5,883 5,291 11% 13%North America 4,275 3,412 25% 27%Greater China 3,789 3,010 26% 29%Russia/CIS 660 679 (3%) (13%)Latin America 1,907 1,731 10% 12%Japan 1,056 1,007 5% 10%MEAA 2,907 2,685 8% 10%Other Businesses 1 739 667 11% 12%Total 21,218 18,483 15% 16%
1 Figures reflect continuing operations as a result of the divestiture of the Rockport, TaylorMade, Adams Golf, Ashworth and CCM Hockey businesses.
BUSINESS PERFORMANCE
Net sales by product category 1 in % of net sales 54
1 Figures reflect continuing operations as a result of the divestiture of the Rockport, TaylorMade, Adams Golf, Ashworth and CCM Hockey businesses.
37%Apparel
5%Hardware
59%FootwearAD
IDAS
AN
NUA
L RE
PORT
201
7
1071 TO OUR SHAREHOLDERS 2 GROUP MANAGEMENT REPORT –
OUR COMPANY3 GROUP MANAGEMENT REPORT –
FINANCIAL REVIEW4 CONSOLIDATED FINANCIAL
STATEMENTS5 ADDITIONAL INFORMATION
BUSINESS PERFORMANCEIncome Statement

COST OF SALES INCREASESCost of sales is defined as the amount we pay to third parties for expenses associated with producing and delivering our products. In addition, own-production expenses are also included in the cost of sales. However, these expenses represent only a very small portion of total cost of sales. In 2017, cost of sales was € 10.514 billion, representing an increase of 12% compared to the prior year level of € 9.383 billion. This development reflects the strong growth of our business as well as less favorable hedging rates and higher input costs mainly due to an increase in material and labor costs.
GROSS MARGIN IMPROVES 1.2 PERCENTAGE POINTS In 2017, the gross profit increased 18% to € 10.703 billion from € 9.100 billion in 2016, representing a gross margin increase of 1.2 percentage points to 50.4% (2016: 49.2%).
SEE DIAGRAM 55 This development was due to the positive effects from a better pricing and product mix, which more than offset negative currency effects as well as higher input costs.
ROYALTY AND COMMISSION INCOME INCREASESRoyalty and commission income increased 11% on a currency-neutral basis and 10% in euro terms to € 115 million (2016: € 105 million).
OTHER OPERATING INCOME DECLINESIn 2017, other operating income declined 49% to € 133 million from € 262 million in 2016. This development mainly reflects the non-recurrence of two one-time gains in 2016, which were related to the early termination of the Chelsea F.C. contract as well as the divestiture of the Mitchell & Ness business.
OTHER OPERATING EXPENSES AS A PERCENTAGE OF SALES DOWN 0.8 PERCENTAGE POINTSOther operating expenses, including depreciation and amortization, consist of marketing expenditure as well as operating overhead costs. In 2017, other operating expenses were up 13% to € 8.882 billion (2016: € 7.885 billion), reflecting an increase in marketing expenditure as well as higher operating overhead expenditure. SEE NOTE 32, P. 201 As a percentage of sales, other operating expenses decreased 0.8 percentage points to 41.9% from 42.7% in 2016. SEE DIAGRAM 56 Marketing expenditure amounted to € 2.732 billion in 2017 compared to € 2.410 billion in the prior year, representing an increase of 13% compared to the 2016 level. As a percentage of sales, marketing expenditure declined 0.2 percentage points to 12.9% (2016: 13.0%), reflecting the company’s strong top-line development. SEE DIAGRAM 57 Operating overhead expenses increased 12% to € 6.150 billion in 2017 from € 5.475 billion in the prior year. As a percentage of sales, operating overhead expenses declined 0.6 percentage points to 29.0% from 29.6% in the prior year, reflecting the company’s focus on executing the strategic business plan ‘Creating the New’ as well as the strong operational performance in 2017.
Gross margin 1, 2, 3 in % 55
2017 50.42016 49.22015 48.32014 47.62013 49.3
1 Gross margin = (gross profit / net sales) × 100.2 2017 and 2016 figures reflect continuing operations as a result of the divestiture of the Rockport,
TaylorMade, Adams Golf, Ashworth and CCM Hockey businesses.3 2015, 2014 and 2013 figures reflect continuing operations as a result of the divestiture of the
Rockport business.
Other operating expenses 1, 2 in % of net sales 56
2017 41.92016 42.72015 43.12014 42.72013 42.3
1 2017 and 2016 figures reflect continuing operations as a result of the divestiture of the Rockport, TaylorMade, Adams Golf, Ashworth and CCM Hockey businesses.
2 2015, 2014 and 2013 figures reflect continuing operations as a result of the divestiture of the Rockport business.
Marketing expenses 1, 2 in % of net sales 57
2017 12.92016 13.02015 13.92014 13.22013 12.6
1 2017 and 2016 figures reflect continuing operations as a result of the divestiture of the Rockport, TaylorMade, Adams Golf, Ashworth and CCM Hockey businesses.
2 2015, 2014 and 2013 figures reflect continuing operations as a result of the divestiture of the Rockport business.
ADID
AS
ANN
UAL
REPO
RT 2
017
1081 TO OUR SHAREHOLDERS 2 GROUP MANAGEMENT REPORT –
OUR COMPANY3 GROUP MANAGEMENT REPORT –
FINANCIAL REVIEW4 CONSOLIDATED FINANCIAL
STATEMENTS5 ADDITIONAL INFORMATION
BUSINESS PERFORMANCEIncome Statement
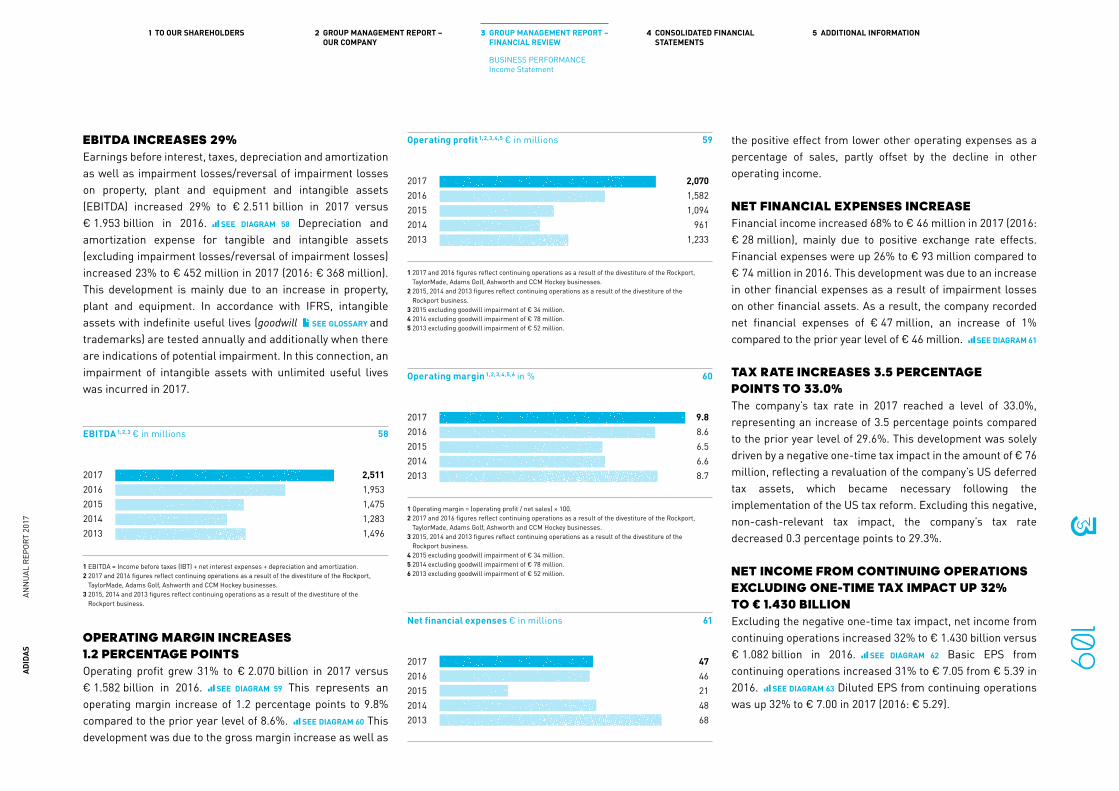
EBITDA INCREASES 29%Earnings before interest, taxes, depreciation and amortization as well as impairment losses/reversal of impairment losses on property, plant and equipment and intangible assets (EBITDA) increased 29% to € 2.511 billion in 2017 versus € 1.953 billion in 2016. SEE DIAGRAM 58 Depreciation and amortization expense for tangible and intangible assets (excluding impairment losses/reversal of impairment losses) increased 23% to € 452 million in 2017 (2016: € 368 million). This development is mainly due to an increase in property, plant and equipment. In accordance with IFRS, intangible assets with indefinite useful lives (goodwill SEE GLOSSARY and trademarks) are tested annually and additionally when there are indications of potential impairment. In this connection, an impairment of intangible assets with unlimited useful lives was incurred in 2017.
OPERATING MARGIN INCREASES 1.2 PERCENTAGE POINTSOperating profit grew 31% to € 2.070 billion in 2017 versus € 1.582 billion in 2016. SEE DIAGRAM 59 This represents an operating margin increase of 1.2 percentage points to 9.8% compared to the prior year level of 8.6%. SEE DIAGRAM 60 This development was due to the gross margin increase as well as
the positive effect from lower other operating expenses as a percentage of sales, partly offset by the decline in other operating income.
NET FINANCIAL EXPENSES INCREASE Financial income increased 68% to € 46 million in 2017 (2016: € 28 million), mainly due to positive exchange rate effects. Financial expenses were up 26% to € 93 million compared to € 74 million in 2016. This development was due to an increase in other financial expenses as a result of impairment losses on other financial assets. As a result, the company recorded net financial expenses of € 47 million, an increase of 1% compared to the prior year level of € 46 million. SEE DIAGRAM 61
TAX RATE INCREASES 3.5 PERCENTAGE POINTS TO 33.0%The company’s tax rate in 2017 reached a level of 33.0%, representing an increase of 3.5 percentage points compared to the prior year level of 29.6%. This development was solely driven by a negative one-time tax impact in the amount of € 76 million, reflecting a revaluation of the company’s US deferred tax assets, which became necessary following the implementation of the US tax reform. Excluding this negative, non-cash-relevant tax impact, the company’s tax rate decreased 0.3 percentage points to 29.3%.
NET INCOME FROM CONTINUING OPERATIONS EXCLUDING ONE-TIME TAX IMPACT UP 32% TO € 1.430 BILLIONExcluding the negative one-time tax impact, net income from continuing operations increased 32% to € 1.430 billion versus € 1.082 billion in 2016. SEE DIAGRAM 62 Basic EPS from continuing operations increased 31% to € 7.05 from € 5.39 in 2016. SEE DIAGRAM 63 Diluted EPS from continuing operations was up 32% to € 7.00 in 2017 (2016: € 5.29).
Operating profit 1, 2, 3, 4, 5 € in millions 59
2017 2,0702016 1,5822015 1,0942014 9612013 1,233
1 2017 and 2016 figures reflect continuing operations as a result of the divestiture of the Rockport, TaylorMade, Adams Golf, Ashworth and CCM Hockey businesses.
2 2015, 2014 and 2013 figures reflect continuing operations as a result of the divestiture of the Rockport business.
3 2015 excluding goodwill impairment of € 34 million. 4 2014 excluding goodwill impairment of € 78 million. 5 2013 excluding goodwill impairment of € 52 million.
Operating margin 1, 2, 3, 4, 5, 6 in % 60
2017 9.82016 8.62015 6.52014 6.62013 8.7
1 Operating margin = (operating profit / net sales) × 100.2 2017 and 2016 figures reflect continuing operations as a result of the divestiture of the Rockport,
TaylorMade, Adams Golf, Ashworth and CCM Hockey businesses.3 2015, 2014 and 2013 figures reflect continuing operations as a result of the divestiture of the
Rockport business.4 2015 excluding goodwill impairment of € 34 million. 5 2014 excluding goodwill impairment of € 78 million. 6 2013 excluding goodwill impairment of € 52 million.
EBITDA 1, 2, 3 € in millions 58
2017 2,5112016 1,9532015 1,4752014 1,2832013 1,496
1 EBITDA = Income before taxes (IBT) + net interest expenses + depreciation and amortization.2 2017 and 2016 figures reflect continuing operations as a result of the divestiture of the Rockport,
TaylorMade, Adams Golf, Ashworth and CCM Hockey businesses.3 2015, 2014 and 2013 figures reflect continuing operations as a result of the divestiture of the
Rockport business.
Net financial expenses € in millions 61
2017 472016 462015 212014 482013 68
ADID
AS
ANN
UAL
REPO
RT 2
017
1091 TO OUR SHAREHOLDERS 2 GROUP MANAGEMENT REPORT –
OUR COMPANY3 GROUP MANAGEMENT REPORT –
FINANCIAL REVIEW4 CONSOLIDATED FINANCIAL
STATEMENTS5 ADDITIONAL INFORMATION
BUSINESS PERFORMANCEIncome Statement

Including the one-time tax impact, net income from continuing operations rose 25% to € 1.354 billion (2016: € 1.082 billion). Basic EPS from continuing operations increased 24% from € 5.39 in 2016 to € 6.68 in 2017. Diluted EPS from continuing operations was up 25% to € 6.63 in 2017 (2016: € 5.29).
The total number of shares outstanding increased by 2,371,924 shares in 2017 to 203,861,234 as a result of share conversions in relation to the company’s outstanding convertible bond which were partly offset by shares repurchased as part of the company’s share buyback program. SEE FINANCIAL HIGHLIGHTS, P. 4 Consequently, the average number of shares used in the calculation of basic earnings per share (EPS) was 202,391,673 (2016: 200,188,276).
LOSSES FROM DISCONTINUED OPERATIONS AMOUNT TO € 254 MILLIONIn 2017, adidas incurred losses from discontinued operations of € 254 million, net of tax, mainly related to the TaylorMade and CCM Hockey businesses (2016: losses of € 62 million). These losses from discontinued operations were due to a loss recognized on the measurement to fair value less costs to sell, net of tax, in the amount of € 256 million, partly offset by income from discontinued operating activities of € 1 million.
NET INCOME ATTRIBUTABLE TO SHAREHOLDERS EXCLUDING ONE-TIME TAX IMPACT INCREASES 15% TO € 1.173 BILLIONThe company’s net income attributable to shareholders, which in addition to net income from continuing operations includes the losses from discontinued operations, grew 15% to € 1.173 billion (2016: € 1.017 billion) excluding the negative one-time tax impact. As a result, basic EPS from continuing and discontinued operations increased 14% to € 5.79 versus € 5.08 in 2016, while diluted EPS from continuing and discontinued operations grew 15% to € 5.75 (2016: € 4.99).
Including the negative one-time tax impact, the company’s net income attributable to shareholders increased 8% to € 1.097 billion (2016: € 1.017 billion). Basic EPS from continuing and discontinued operations increased 7% to € 5.42 (2016: € 5.08) and diluted EPS from continuing and discontinued operations grew 8% to € 5.38 (2016: € 4.99).
Net income from continuing operations 1, 2, 3, 4
€ in millions62
2017 1,4302016 1,0822015 7202014 6422013 825
1 2017 excluding negative one-time tax impact of € 76 million. 2 2015 excluding goodwill impairment of € 34 million. 3 2014 excluding goodwill impairment of € 78 million. 4 2013 excluding goodwill impairment of € 52 million.
Basic earnings per share 1, 2, 3, 4, 5 in € 63
2017 7.052016 5.392015 3.542014 3.052013 3.93
1 Figures reflect continuing operations.2 2017 excluding negative one-time tax impact of € 76 million. 3 2015 excluding goodwill impairment of € 34 million. 4 2014 excluding goodwill impairment of € 78 million. 5 2013 excluding goodwill impairment of € 52 million.
ADID
AS
ANN
UAL
REPO
RT 2
017
1101 TO OUR SHAREHOLDERS 2 GROUP MANAGEMENT REPORT –
OUR COMPANY3 GROUP MANAGEMENT REPORT –
FINANCIAL REVIEW4 CONSOLIDATED FINANCIAL
STATEMENTS5 ADDITIONAL INFORMATION
BUSINESS PERFORMANCEIncome Statement
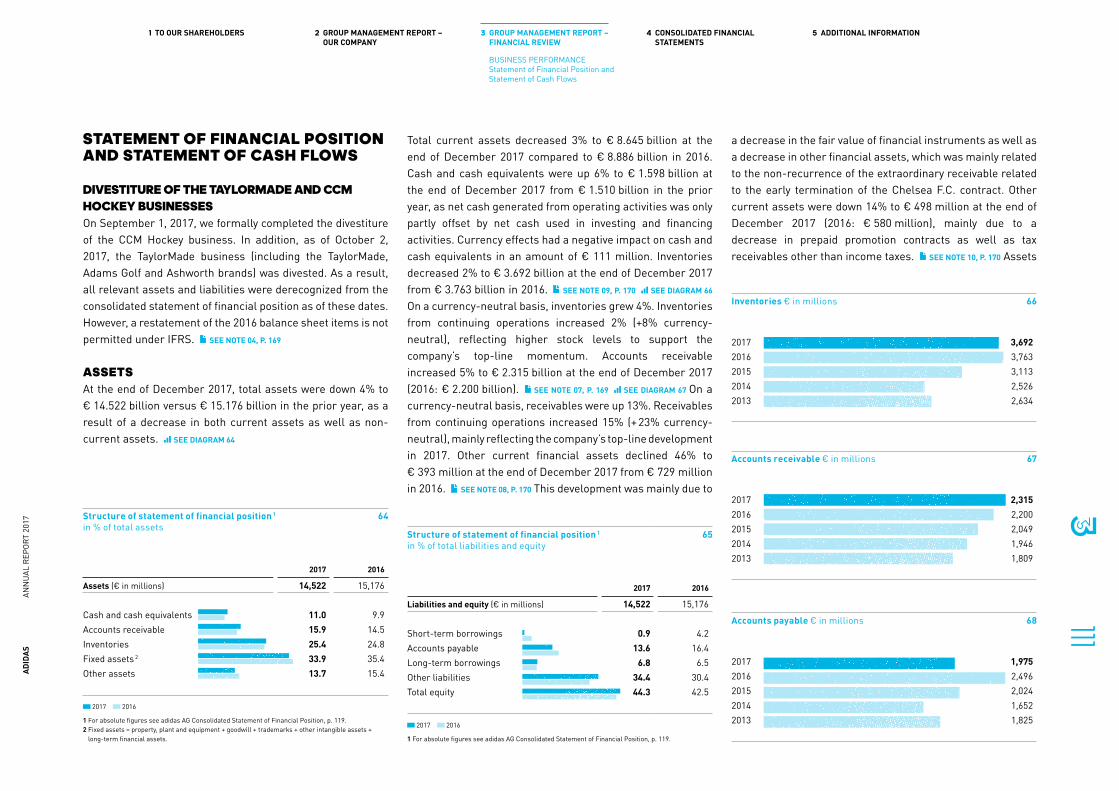
STATEMENT OF FINANCIAL POSITION AND STATEMENT OF CASH FLOWS
DIVESTITURE OF THE TAYLORMADE AND CCM HOCKEY BUSINESSESOn September 1, 2017, we formally completed the divestiture of the CCM Hockey business. In addition, as of October 2, 2017, the TaylorMade business (including the TaylorMade, Adams Golf and Ashworth brands) was divested. As a result, all relevant assets and liabilities were derecognized from the consolidated statement of financial position as of these dates. However, a restatement of the 2016 balance sheet items is not permitted under IFRS. SEE NOTE 04, P. 169
ASSETSAt the end of December 2017, total assets were down 4% to € 14.522 billion versus € 15.176 billion in the prior year, as a result of a decrease in both current assets as well as non-current assets. SEE DIAGRAM 64
Total current assets decreased 3% to € 8.645 billion at the end of December 2017 compared to € 8.886 billion in 2016. Cash and cash equivalents were up 6% to € 1.598 billion at the end of December 2017 from € 1.510 billion in the prior year, as net cash generated from operating activities was only partly offset by net cash used in investing and financing activities. Currency effects had a negative impact on cash and cash equivalents in an amount of € 111 million. Inventories decreased 2% to € 3.692 billion at the end of December 2017 from € 3.763 billion in 2016. SEE NOTE 09, P. 170 SEE DIAGRAM 66 On a currency-neutral basis, inventories grew 4%. Inventories from continuing operations increased 2% (+8% currency-neutral), reflecting higher stock levels to support the company’s top-line momentum. Accounts receivable increased 5% to € 2.315 billion at the end of December 2017 (2016: € 2.200 billion). SEE NOTE 07, P. 169 SEE DIAGRAM 67 On a currency-neutral basis, receivables were up 13%. Receivables from continuing operations increased 15% (+ 23% currency-neutral), mainly reflecting the company’s top-line development in 2017. Other current financial assets declined 46% to € 393 million at the end of December 2017 from € 729 million in 2016. SEE NOTE 08, P. 170 This development was mainly due to
a decrease in the fair value of financial instruments as well as a decrease in other financial assets, which was mainly related to the non-recurrence of the extraordinary receivable related to the early termination of the Chelsea F.C. contract. Other current assets were down 14% to € 498 million at the end of December 2017 (2016: € 580 million), mainly due to a decrease in prepaid promotion contracts as well as tax receivables other than income taxes. SEE NOTE 10, P. 170 Assets
Structure of statement of financial position 1 in % of total liabilities and equity
65
2017 2016
Liabilities and equity (€ in millions) 14,522 15,176
Short-term borrowings 0.9 4.2Accounts payable 13.6 16.4Long-term borrowings 6.8 6.5Other liabilities 34.4 30.4Total equity 44.3 42.5
2017 2016
1 For absolute figures see adidas AG Consolidated Statement of Financial Position, p. 119.
Structure of statement of financial position 1 in % of total assets
64
2017 2016
Assets (€ in millions) 14,522 15,176
Cash and cash equivalents 11.0 9.9Accounts receivable 15.9 14.5Inventories 25.4 24.8Fixed assets 2 33.9 35.4Other assets 13.7 15.4
2017 2016
1 For absolute figures see adidas AG Consolidated Statement of Financial Position, p. 119.2 Fixed assets = property, plant and equipment + goodwill + trademarks + other intangible assets +
long-term financial assets.
Inventories € in millions 66
2017 3,6922016 3,7632015 3,1132014 2,5262013 2,634
Accounts receivable € in millions 67
2017 2,3152016 2,2002015 2,0492014 1,9462013 1,809
Accounts payable € in millions 68
2017 1,9752016 2,4962015 2,0242014 1,6522013 1,825
ADID
AS
ANN
UAL
REPO
RT 2
017
1111 TO OUR SHAREHOLDERS 2 GROUP MANAGEMENT REPORT –
OUR COMPANY3 GROUP MANAGEMENT REPORT –
FINANCIAL REVIEW4 CONSOLIDATED FINANCIAL
STATEMENTS5 ADDITIONAL INFORMATION
BUSINESS PERFORMANCEStatement of Financial Position and Statement of Cash Flows

classified as held for sale amounted to € 72 million in 2017 due to the concrete plan to sell the Reebok headquarters in Canton. SEE NOTE 11, P. 170
Total non-current assets declined 7% to € 5.877 billion at the end of December 2017 from € 6.290 billion in 2016. Fixed assets decreased 8% to € 4.920 billion at the end of December 2017 versus € 5.367 billion in 2016. Additions of € 861 million, primarily related to own-retail activities, investments into the company’s logistics and IT infrastructure as well as the further development of the company’s headquarters in Herzogenaurach, were more than offset by the pre-divestiture reclassification of the net book value of fixed assets of the TaylorMade and CCM Hockey businesses to assets held for sale in an amount of € 392 million. In addition, negative currency effects of € 380 million as well as depreciation and amortization of € 498 million contributed to this develop-ment. Other non-current financial assets more than doubled to € 219 million from € 96 million at the end of 2016.
SEE NOTE 16, P. 174 This development was mainly due to the recognition of seller and contingent notes related to the divestiture of the TaylorMade and CCM Hockey businesses. Deferred tax assets decreased 14% to € 630 million from € 732 million in 2016 as a result of a revaluation of the company’s US deferred tax assets, which became necessary following the implementation of the US tax reform.
LIABILITIES AND EQUITYTotal current liabilities decreased 7% to € 6.291 billion at the end of December 2017 from € 6.765 billion in 2016. Short-term borrowings declined 79% to € 137 million at the end of December 2017 (2016: € 636 million), reflecting conversions of the company’s convertible bond into adidas AG shares as well as a decrease in bank loans. Accounts payable were down 21% to € 1.975 billion at the end of December 2017 versus € 2.496 billion in 2016. SEE DIAGRAM 68 On a currency-neutral basis, accounts payable declined 19%. Accounts payable from
continuing operations decreased 17% (–15% currency-neutral), reflecting the company´s focus on inventory management as well as improved terms with our suppliers and phasing of sourcing activities. Other current financial liabilities were up 81% to € 362 million from € 201 million in 2016, mainly as a result of an increase in the negative fair value of financial instruments. SEE NOTE 19, P. 176 Other current provisions increased 29% to € 741 million at the end of December 2017 versus € 573 million in 2016, driven by an increase in operational provisions. Current accrued liabilities grew 8% to € 2.180 billion at the end of December 2017 from € 2.023 billion in 2016, mainly as a result of an increase in invoices not yet received as well as higher accruals for customer discounts. Other current liabilities were up 9% to € 473 million at the end of December 2017 from € 434 million in 2016, primarily due to an increase in miscellaneous taxes payable. SEE NOTE 22, P. 177
Total non-current liabilities decreased 8% to € 1.796 billion at the end of December 2017 from € 1.957 billion in the prior year. Long-term borrowings remained relatively unchanged at € 983 million at the end of December 2017 from € 982 million in the prior year. SEE NOTE 18, P. 175 Deferred tax liabilities decreased 29% to € 275 million from € 387 million in 2016, partly due to the pre-divestiture reclassification of the TaylorMade and CCM Hockey businesses to liabilities held for sale. Other non-current provisions increased 82% to
€ 80 million at the end of December 2017 from € 44 million in the prior year, mainly as a result of an increase in provisions for personnel. Non-current accrued liabilities decreased 29% to € 85 million from € 120 million in 2016 due to a decrease in accruals for personnel as well as invoices not yet received.
SEE NOTE 21, P. 177
Shareholders’ equity decreased to € 6.450 billion at the end of December 2017 versus € 6.472 billion in 2016, driven by negative currency effects of € 525 million as well as the dividend of € 405 million paid to shareholders for the 2016 financial year. In addition, a decrease of hedging reserves of € 375 million as well as the repurchase of treasury shares in an amount of € 89 million, including incidental purchasing costs, also contributed to the decline. These developments more than offset the net income generated during the last twelve months and the reissuance of treasury shares in an amount of € 248 million. The company’s equity ratio increased to 44.4% compared to 42.6% in the prior year. SEE NOTE 26, P. 182
SEE DIAGRAM 69
OPERATING WORKING CAPITALOperating working capital SEE GLOSSARY increased 16% to € 4.033 billion at the end of December 2017 compared to
Equity ratio in % 69
2017 44.42016 42.62015 42.52014 45.32013 47.3
Average operating working capital 1, 2, 3 in % of net sales 70
2017 20.42016 21.12015 20.52014 22.42013 21.3
1 Average operating working capital = sum of operating working capital at quarter-end / 4. Operating working capital = accounts receivable + inventories – accounts payable.
2 2017 and 2016 figures reflect continuing operations as a result of the divestiture of the Rockport, TaylorMade, Adams Golf, Ashworth and CCM Hockey businesses.
3 2015, 2014 and 2013 figures reflect continuing operations as a result of the divestiture of the Rockport business.
ADID
AS
ANN
UAL
REPO
RT 2
017
1121 TO OUR SHAREHOLDERS 2 GROUP MANAGEMENT REPORT –
OUR COMPANY3 GROUP MANAGEMENT REPORT –
FINANCIAL REVIEW4 CONSOLIDATED FINANCIAL
STATEMENTS5 ADDITIONAL INFORMATION
BUSINESS PERFORMANCEStatement of Financial Position and Statement of Cash Flows

€ 3.468 billion in 2016. On a currency-neutral basis, operating working capital grew 27%. Operating working capital from continuing operations rose 25% (+36% currency-neutral). Average operating working capital as a percentage of sales from continuing operations decreased 0.7 percentage points to 20.4% (2016: 21.1%), reflecting the strong top-line development during the last twelve months as well as the company’s continued focus on tight working capital management. SEE DIAGRAM 70
INVESTMENT ANALYSISCapital expenditure is defined as the total cash expenditure for the purchase of tangible and intangible assets (excluding acquisitions). Capital expenditure increased 16% to € 755 million in 2017 (2016: € 651 million). Capital expenditure from continuing operations increased 17% to € 752 million from € 642 million in 2016. Capital expenditure for property, plant and equipment was up 16% to € 681 million compared to € 586 million in the prior year. The company invested € 74 million in intangible assets, representing a 14% increase compared to the prior year (2016: € 65 million). Depreciation and amortization excluding impairment losses/reversal of impairment losses of tangible and intangible assets increased 13% to € 421 million in 2017 (2016: € 373 million).
The majority of the company’s capital expenditure was related to our controlled space initiatives. Investments in new or remodeled own-retail and franchise stores as well as in shop-in-shop presentations of our brands and products in our customers’ stores accounted for 48% of total capital expenditure (2016: 55%). Expenditure for IT and logistics represented 13% and 9%, respectively (2016: 10% and 8%, respectively). In addition, expenditure for administration represented 7% (2016: 9%), while 22% of total capital expenditure was recorded for other initiatives (2016: 18%).
SEE DIAGRAM 71 From a regional perspective, the majority of the capital expenditure was recorded at the company’s headquarters in Herzogenaurach, Germany, accounting for 47% (2016: 32%). In addition, capital expenditure in Greater China accounted for 16% (2016: 15%) of the total capital expenditure, followed by Western Europe with 10% (2016: 12%), North America with 8% (2016: 13%), MEAA and Russia/CIS with 5% each (2016: 9% and 7%, respectively), Latin America with 4% (2016: 7%) as well as Japan with 3% (2016: 2%). SEE DIAGRAM 72
LIQUIDITY ANALYSISIn 2017, net cash generated from operating activities increased to € 1.648 billion (2016: € 1.348 billion). SEE
FINANCIAL HIGHLIGHTS, P. 4 Net cash generated from continuing operating activities rose to € 1.641 billion (2016: € 1.309 billion), driven by an increase in income before taxes which was partly offset by higher operating working capital requirements as well as an increase in income taxes paid. Net cash used in investing activities rose to € 680 million (2016: € 614 million). Net cash used in continuing investing activities increased to € 676 million (2016: € 605 million). The majority of continuing investing activities in 2017 related to spending for property, plant and equipment, such as investments in the furnishing and fitting of our own-retail stores and investments in IT systems as well as the purchase of investments and other long-term assets. Net cash used in financing activities and net cash used in continuing financing activities grew to € 769 million each (2016: € 553 million and € 545 million, respectively), mainly due to the dividend paid to shareholders, the repayment of short-term borrowings as well as the repurchase of treasury shares. Exchange rate effects negatively impacted the company’s cash position by € 111 million. As a result of all these developments, cash and cash equivalents increased € 88 million to € 1.598 billion at the end of December 2017 compared to € 1.510 billion at the end of December 2016. SEE DIAGRAM 74
Capital expenditure by type in % of total CAPEX 71
22%Other
13%IT
9%Logistics
7%Administration
48%Controlled space
Net borrowings/EBITDA 1, 2 € in millions 73
2017 (0.2)2016 0.12015 0.32014 0.12013 (0.2)
1 2017 and 2016 figures reflect continuing operations as a result of the divestiture of the Rockport, TaylorMade, Adams Golf, Ashworth and CCM Hockey businesses.
2 2015, 2014 and 2013 figures reflect continuing operations as a result of the divestiture of the Rockport business.
Capital expenditure by region in % of total CAPEX 72
47%HQ/Consolidation
2%Other Businesses
5%MEAA
5%Russia/CIS
4%Latin America
3%Japan
16%Greater China
8%North America
10%Western Europe
ADID
AS
ANN
UAL
REPO
RT 2
017
1131 TO OUR SHAREHOLDERS 2 GROUP MANAGEMENT REPORT –
OUR COMPANY3 GROUP MANAGEMENT REPORT –
FINANCIAL REVIEW4 CONSOLIDATED FINANCIAL
STATEMENTS5 ADDITIONAL INFORMATION
BUSINESS PERFORMANCEStatement of Financial Position and Statement of Cash Flows

Net cash at December 31, 2017 amounted to € 484 million, compared to net borrowings of € 103 million in 2016, representing an improvement of € 587 million compared to the prior year. This development was driven by the increase in cash generated from operating activities as well as proceeds arising from the disposal of the TaylorMade and CCM Hockey businesses, partly offset by the utilization of cash for the purchase of fixed assets as well as the dividend paid to shareholders and the repurchase of adidas AG shares. In addition, the conversion of convertible bonds into adidas AG shares also contributed to this improvement. SEE TREASURY, P. 115 The company’s ratio of net borrowings over EBITDA amounted to –0.2 at the end of December 2017 (2016: 0.1), which is within the company’s mid-term target corridor of below two times.
SEE DIAGRAM 73
Operating cash flow, as described in the Internal Management System, increased 24% to € 1.202 billion in 2017 from € 969 million in 2016, mainly due to the higher operating profit.
SEE INTERNAL MANAGEMENT SYSTEM, P. 102
OFF-BALANCE SHEET ITEMSThe company’s most significant off-balance sheet items are commitments for promotion and advertising as well as operating leases, which are related to own-retail stores, offices, warehouses and equipment. The company has entered into various operating leases as opposed to property acquisitions in order to reduce exposure to property value fluctuations. Minimum future lease payments for operating leases were € 2.649 billion at December 31, 2017, compared to € 2.501 billion at the end of December 2016, representing an increase of 6%. SEE NOTE 29, P. 189 At the end of December 2017, financial commitments for promotion and advertising decreased 7% to € 5.255 billion in 2017 (2016: € 5.643 billion).
SEE NOTE 39, P. 210
Change in cash and cash equivalents € in millions 74
Cash and cash equivalentsat the end of
2016
Net cash generatedfrom operating
activitiesNet cash used in
investing activitiesNet cash used in
financing activitiesEffect of exchange
rates
Cash and cash equivalentsat the end of
2017
1,510
1,648
(680)
(769) (111)
1,598
ADID
AS
ANN
UAL
REPO
RT 2
017
1141 TO OUR SHAREHOLDERS 2 GROUP MANAGEMENT REPORT –
OUR COMPANY3 GROUP MANAGEMENT REPORT –
FINANCIAL REVIEW4 CONSOLIDATED FINANCIAL
STATEMENTS5 ADDITIONAL INFORMATION
BUSINESS PERFORMANCEStatement of Financial Position and Statement of Cash Flows

TREASURY
CORPORATE FINANCING POLICYIn order to be able to meet the company’s payment commitments at all times, the major goal of our financing policy is to ensure sufficient liquidity reserves, while at the same time minimizing our financial expenses. The operating activities of our segments and the resulting cash inflows represent the company’s main source of liquidity. Liquidity is planned on a rolling monthly basis under a multi-year financial and liquidity plan. This comprises all consolidated companies. Our in-house bank concept takes advantage of any surplus funds of individual companies to cover the financial requirements of others, thus reducing external financing needs and optimizing our net interest expenses. Furthermore, by settling intercompany transactions via intercompany financial accounts, we are able to reduce external bank account transactions and thus bank charges. Effective management of our currency exposure and interest rate risks are additional goals and responsibilities of our centrally managed Treasury department.
TREASURY POLICY AND RESPONSIBILITIESOur Treasury Policy governs all treasury-related issues, including banking policy and approval of bank relationships, financing arrangements and liquidity/asset management, currency and interest risk management as well as the management of intercompany cash flows. Responsibilities are arranged in a three-tiered approach:
— The Treasury Committee consists of members of the Executive Board and other senior executives who decide on the Treasury Policy and provide strategic guidance for managing treasury-related topics. Major changes to our Treasury Policy are subject to the prior approval of the Treasury Committee.
— The Treasury department is responsible for specific centralized treasury transactions and for the global implementation of our Treasury Policy.
— On a subsidiary level, where applicable and economically reasonable, local managing directors and finance directors are responsible for managing treasury matters in their respective subsidiaries. Controlling functions on a corporate level ensure that the transactions of the individual business units are in compliance with our Treasury Policy.
CENTRALIZED TREASURY FUNCTIONIn accordance with our Treasury Policy, all worldwide credit lines are directly or indirectly managed by the Treasury department. Portions of those lines are allocated to our subsidiaries and backed by adidas AG guarantees. As a result of this centralized liquidity management, the company is well positioned to allocate resources efficiently throughout the organization. The company’s debt is generally unsecured and may include standard covenants, which are reviewed on a quarterly basis. We maintain good relations with numerous partner banks, thereby avoiding a high dependency on any single financial institution. Banking partners of the company and our subsidiaries are required to have at least a BBB+ long-term investment grade rating by Standard & Poor’s or an equivalent rating by another leading rating agency. SEE RISK
AND OPPORTUNITY REPORT, P. 131 Only in exceptional cases are our companies authorized to work with banks with a lower rating. To ensure optimal allocation of the company’s liquid financial resources, subsidiaries transfer excess cash to our headquarters in all instances where it is legally and economically feasible. In this regard, the standardization and consolidation of our global cash management and payment processes, including automated domestic and cross-border cash pools
SEE GLOSSARY, is a key priority for our Treasury department.
STANDARD COVENANTSIn the case of our committed credit facilities, we have entered into various legal covenants. These legal covenants may include limits on the disposal of fixed assets, the amount of debt secured by liens, cross default provisions and change of control. However, our financial arrangements do not contain any financial covenants. If we failed to meet any covenant and were unable to obtain a waiver from a majority of partner banks, borrowings would become due and payable immediately. As at December 31, 2017, we were in full compliance with all of our covenants. We are fully confident we will continue to be compliant with these covenants going forward. We believe that cash generated from operating activities, together with access to internal and external sources of funds, will be sufficient to meet our future operating and capital needs.
FINANCIAL FLEXIBILITYThe company’s financial flexibility is ensured by the availability of credit facilities, consisting of committed and uncommitted bilateral credit lines at different banks with a remaining time to maturity of up to five years. In addition, we have an unused multi-currency commercial paper program in the amount of € 2.0 billion available (2016: € 2.0 billion). At the end of 2017, committed and uncommitted bilateral credit lines amounted to € 2.251 billion (2016: € 2.403 billion), of which € 2.145 billion was unutilized (2016: € 2.024 billion). Committed and uncom-mitted credit lines represent approximately 47% and 53% of total short-term bilateral credit lines, respectively (2016: 43% and 57%, respectively). SEE DIAGRAM 77 We monitor the ongoing need for available credit lines based on the current level of debt as well as future financing requirements.
ADID
AS
ANN
UAL
REPO
RT 2
017
1151 TO OUR SHAREHOLDERS 2 GROUP MANAGEMENT REPORT –
OUR COMPANY3 GROUP MANAGEMENT REPORT –
FINANCIAL REVIEW4 CONSOLIDATED FINANCIAL
STATEMENTS5 ADDITIONAL INFORMATION
BUSINESS PERFORMANCETreasury

OUTSTANDING BONDSIn 2014, we issued two eurobonds with an overall volume of € 1.0 billion, thereby taking the opportunity of a low interest rate environment in the eurobond market to further strengthen the company’s financing mix while increasing the overall duration. The seven-year eurobond of € 600 million matures on October 8, 2021 and has a coupon of 1.25%. The twelve-year eurobond of € 400 million matures on October 8, 2026 and has a coupon of 2.25%. SEE NOTE 18, P. 175 In addition, adidas AG successfully issued a convertible bond in March 2012, for an aggregate nominal amount of € 500 million, due on June 14, 2019. The bonds were priced with a 0.25% annual coupon and a conversion premium of 40% above the reference price of € 59.61. As at December 31, 2017, 94% of the con-vertible bond was converted (2016: 48%). SEE OUR SHARE, P. 57
SEE TABLE 78
GROSS BORROWINGS DECREASEThe company’s gross borrowings are composed of bank borrowings as well as the outstanding eurobonds and the convertible bond. Gross borrowings decreased 31% to € 1.120 billion at the end of 2017 from € 1.618 billion in the prior year. This development was mainly due to the conversion of convertible bonds and a decrease in short-term bank borrowings. Bank borrowings amounted to € 106 million compared to € 379 million in the prior year. Convertible bonds outstanding decreased 88% to € 31 million from € 257 million in the prior year. This was a result of further conversions into adidas AG shares that occurred in the course of 2017, partly offset by an increase in the convertible bond’s debt component.
SEE OUR SHARE, P. 57 The conversions were done on a non-cash basis using treasury shares. The debt component was fully accrued to its nominal value by the end of 2017. Including the company’s eurobonds, the total amount of bonds outstanding at the end of 2017 was € 1.014 billion (2016: € 1.239 billion).
SEE TABLE 79
Issued bonds at a glance € in millions 78
Volume Coupon Maturity
Convertible bond € 500 fixed 2019Eurobond € 600 fixed 2021Eurobond € 400 fixed 2026
Bilateral credit lines € in millions 77
2017 2016
Committed 1,055 1,041Uncommitted 1,196 1,362
Total 2,251 2,403
2017 2016
Remaining time to maturity of available facilities € in millions 76
2017 2016
< 1 year 1,601 2,1601 to 3 years 381 1503 to 5 years 746 945> 5 years 537 387
Total 3,265 3,642
2017 2016Financing structure € in millions 79
2017 2016
Cash and short-term financial assets 1,604 1,515Bank borrowings 106 379Eurobonds 983 982Convertible bond 31 257Gross total borrowings 1,120 1,618Net cash/(net borrowings) 484 (103)
BUSINESS PERFORMANCE Total credit facilities € in millions 75
2017 2016
Bilateral credit lines 2,251 2,403Eurobonds 983 982Convertible bond 31 257
Total 3,265 3,642
2017 2016
ADID
AS
ANN
UAL
REPO
RT 2
017
1161 TO OUR SHAREHOLDERS 2 GROUP MANAGEMENT REPORT –
OUR COMPANY3 GROUP MANAGEMENT REPORT –
FINANCIAL REVIEW4 CONSOLIDATED FINANCIAL
STATEMENTS5 ADDITIONAL INFORMATION
BUSINESS PERFORMANCETreasury

EURO DOMINATES CURRENCY MIXThe vast majority of our gross borrowings are denominated in euros. At the end of 2017, gross borrowings denominated in euros accounted for 91% of total gross borrowings (2016: 77%). SEE DIAGRAM 80
STABLE DEBT MATURITY PROFILEOver the course of 2017, the company’s financing maturity profile remained stable. In 2018, assuming unchanged maturities, debt instruments of € 137 million will mature, of which € 31 million consists of the anticipated conversions. This compares to € 606 million which matured during the course of 2017. SEE DIAGRAM 81
NET CASH POSITION OF € 484 MILLIONNet cash at December 31, 2017 amounted to € 484 million, compared to net borrowings of € 103 million in 2016, representing an improvement of € 587 million versus the prior year. SEE DIAGRAM 82 This development was driven by the increase in cash generated from operating activities as well as proceeds arising from the disposal of the TaylorMade and CCM Hockey businesses, partly offset by the utilization of cash for the purchase of fixed assets as well as the dividend paid to shareholders and the repurchase of adidas AG shares. In addition, the conversion of convertible bonds into adidas AG shares also contributed to this improvement.
INTEREST RATE INCREASESThe weighted average interest rate on the company’s gross borrowings increased to 2.7% in 2017 (2016: 2.3%). SEE
DIAGRAM 83 This development was mainly due to conversions of the convertible bond into adidas AG shares and a reduction in short-term borrowings. Fixed-rate financing represented 91% of total gross borrowings at the end of 2017 (2016: 77%). Variable-rate financing accounted for 9% of total gross borrowings at the end of the year (2016: 23%).
EFFECTIVE FOREIGN EXCHANGE MANAGEMENT A KEY PRIORITYAs a globally operating company, adidas is exposed to currency risks. Therefore, effective currency management is a key focus of our Treasury department, with the aim of reducing the impact of currency fluctuations on non-euro-denominated net future cash flows. In this regard, hedging US dollars is a central part of our program. This is a direct result of our Asian-dominated sourcing, which is largely denominated in US dollars. SEE GLOBAL OPERATIONS, P. 74 In 2017, our Treasury department managed a net deficit of around US $ 6.6 billion related to operational activities (2016: US $ 6.5 billion). Thereof, around US $ 3.8 billion was against the euro (2016: US $ 3.5 billion). As governed by our Treasury Policy, we have established a hedging system on a rolling basis up to 24 months in advance, under which the vast majority of the anticipated seasonal hedging volume is secured approximately six months prior to the start of a season. In rare instances, hedges are contracted beyond the 24-month horizon. We had largely covered our anticipated hedging needs for 2018 as of year-end 2017. At the same time, we have already started hedging our exposure for 2019. The use or combination of different hedging instruments, such as forward exchange contracts, currency options and swaps, protects us against unfavorable currency movements.
SEE RISK AND OPPORTUNITY REPORT, P. 131
Currency split of gross borrowings € in millions 80
2017 2016
EUR 1,016 1,242USD 2 157All others 102 219
Total 1,120 1,618
2017 2016
Net cash/(net borrowings) 1 € in millions 82
2017 4842016 (103)2015 (460)2014 (185)2013 295
1 Net cash/Net borrowings = cash and cash equivalents + short-term financial assets – short-term borrowings – long-term borrowings.
Interest rate development 1 in % 83
2017 2.72016 2.32015 2.42014 3.12013 3.8
1 Weighted average interest rate of gross borrowings.
Remaining time to maturity of gross borrowings € in millions 81
2017 2016
< 1 year 137 6361 to 3 years – –3 to 5 years 596 595> 5 years 387 387
Total 1,120 1,618
2017 2016
ADID
AS
ANN
UAL
REPO
RT 2
017
1171 TO OUR SHAREHOLDERS 2 GROUP MANAGEMENT REPORT –
OUR COMPANY3 GROUP MANAGEMENT REPORT –
FINANCIAL REVIEW4 CONSOLIDATED FINANCIAL
STATEMENTS5 ADDITIONAL INFORMATION
BUSINESS PERFORMANCETreasury

FINANCIAL STATEMENTS AND MANAGEMENT REPORT OF ADIDAS AG
adidas AG is the parent company of the adidas Group. It includes operating business functions, primarily for the German market, as well as corporate headquarter functions such as Marketing, Treasury, Taxes, Legal and Finance. adidas AG also administers the company’s shareholdings.
OPERATING ACTIVITIES AND CAPITAL STRUCTURE OF ADIDAS AGThe majority of the operating business of adidas AG consists of the sale of merchandise to wholesale partners and own-retail activities.
In addition to its own trading activities, the results of adidas AG are significantly influenced by its holding function for the company as a whole. This is reflected primarily in currency effects, transfer of costs for services provided, interest result and income from investments in related companies.
The opportunities and risks as well as the future development of adidas AG largely reflect those of the company as a whole.
SEE SUBSEQUENT EVENTS AND OUTLOOK, P. 128
SEE RISK AND OPPORTUNITY REPORT, P. 131
The asset and capital structure of adidas AG is significantly impacted by its holding and financing function for the company. For example, 49% of total assets as at December 31, 2017 related to financial assets (2016: 53%), which primarily consist of shares in affiliated companies. Inter company accounts, through which transactions between affiliated companies are settled, represent another 35% of total assets (2016: 35%) and 48% of total equity and liabilities as at December 31, 2017 (2016: 45%).
PREPARATION OF ACCOUNTSUnlike the consolidated financial statements, which are in conformity with the International Financial Reporting Standards (IFRS), as adopted by the European Union as at December 31, 2017, the following financial statements of adidas AG have been prepared in accordance with the rules set out in the German Commercial Code (Handelsgesetzbuch – HGB).
INCOME STATEMENT
NET SALES INCREASE 13%Sales of adidas AG comprise external revenues generated by adidas Germany with products of the adidas and Reebok brands, external revenues from Y-3 products as well as revenues from foreign subsidiaries. Revenues of adidas AG also include royalty and commission income, mainly from affiliated companies, and other revenues. In 2017, adidas AG net sales grew 13% to € 3.732 billion (2016: € 3.289 billion). This growth was mainly due to an increase in royalty income from affiliated companies as well as higher sales at adidas Germany. SEE TABLE 85
OTHER OPERATING INCOME UP 15%In 2017, other operating income of adidas AG increased 15% to € 503 million (2016: € 439 million). This development was primarily due to positive currency effects.
OTHER OPERATING EXPENSES INCREASE 20%In 2017, other operating expenses for adidas AG rose 20% to € 2.170 billion (2016: € 1.803 billion). SEE TABLE 84 This was largely attributable to an increase in expenses for advertising and promotion, allowances for doubtful accounts, negative currency effects and higher legal and consultancy expenses.
Statement of income in accordance with HGB (Condensed) € in millions
84
2017 2016
Net sales 3,732 3,289Total output 3,732 3,289Other operating income 503 439Cost of materials (1,292) (1,127)Personnel expenses (692) (588)Depreciation and amortization (91) (100)Other operating expenses (2,170) (1,803)Operating profit (10) 110Financial result 655 600Taxes (96) (93)Net income 549 617Retained earnings brought forward 24 322Allocation to other revenue reserves 0 (300)Utilization for the repurchase of treasury shares 0 (11)Retained earnings 573 629
adidas AG net sales € in millions 85
2017 2016
Royalty and commission income 1,809 1,580adidas Germany 1,027 939Foreign subsidiaries 175 137Y-3 98 89Other revenues 623 544Total 3,732 3,289
ADID
AS
ANN
UAL
REPO
RT 2
017
1181 TO OUR SHAREHOLDERS 2 GROUP MANAGEMENT REPORT –
OUR COMPANY3 GROUP MANAGEMENT REPORT –
FINANCIAL REVIEW4 CONSOLIDATED FINANCIAL
STATEMENTS5 ADDITIONAL INFORMATION
BUSINESS PERFORMANCEFinancial Statements and Management Report of adidas AG

BALANCE SHEET TOTAL ASSETS ABOVE PRIOR YEARAt the end of December 2017, total assets grew 11% to € 8.863 billion compared to € 8.003 billion in the prior year. This development was mainly a result of increases in cash and cash equivalents, receivables and other assets as well as fixed assets.
SEE TABLE 86
SHAREHOLDERS’ EQUITY UP 13%Shareholders’ equity increased 13% to € 2.704 billion at the end of December 2017 (2016: € 2.395 billion). SEE TABLE 86
The equity ratio rose slightly to 30.5% (2016: 29.9%).
PROVISIONS INCREASE 19%Provisions were up 19% to € 624 million at the end of 2017 (2016: € 525 million). SEE TABLE 86 The increase primarily resulted from higher provisions for personnel as well as higher marketing provisions.
LIABILITIES AND OTHER ITEMS UP 9%At the end of December 2017, liabilities and other items increased 9% to € 5.535 billion (2016: € 5.083 billion).
SEE TABLE 86 The increase was mainly a result of higher payables to affiliated companies, partly offset by the decline in liabilities related to the convertible bond.
DEPRECIATION AND AMORTIZATION DECLINES 9%Depreciation and amortization for adidas AG decreased 9% to € 91 million in 2017 (2016: € 100 million), mainly as a result of a decline in depreciation and amortization of software.
OPERATING RESULT DECREASES SIGNIFICANTLYIn 2017, adidas AG generated an operating loss of € 10 million, (2016: operating profit of € 110 million). SEE TABLE 84 This development was primarily due to an increase in other operating expenses as well as increases in cost of materials and personnel expenses, which more than offset higher sales.
FINANCIAL RESULT IMPROVESThe financial result of adidas AG improved 9% to € 655 million in 2017 (2016: € 600 million). The increase was attributable to higher profit transfers from affiliated companies under profit and loss transfer agreements.
NET INCOME DECLINESNet income, after taxes of € 96 million (2016: € 93 million), amounted to € 549 million in 2017 and was thus 11% below the prior year level (2016: € 617 million). SEE TABLE 84
Balance sheet in accordance with HGB (Condensed) € in millions
86
Dec. 31, 2017
Dec. 31, 2016
AssetsIntangible assets 124 112Property, plant and equipment 610 493Financial assets 4,308 4,205Fixed assets 5,042 4,810Inventories 49 50Receivables and other assets 3,262 2,968Cash and cash equivalents, securities 337 28Current assets 3,648 3,046Prepaid expenses 168 143Active difference from asset allocation 5 4Total assets 8,863 8,003
Equity and liabilitiesShareholders’ equity 2,704 2,395Provisions 624 525Liabilities and other items 5,535 5,083Total equity and liabilities 8,863 8,003
ADID
AS
ANN
UAL
REPO
RT 2
017
1191 TO OUR SHAREHOLDERS 2 GROUP MANAGEMENT REPORT –
OUR COMPANY3 GROUP MANAGEMENT REPORT –
FINANCIAL REVIEW4 CONSOLIDATED FINANCIAL
STATEMENTS5 ADDITIONAL INFORMATION
BUSINESS PERFORMANCEFinancial Statements and Management Report of adidas AG
CASH INFLOW FROM OPERATING ACTIVITIES REFLECTS CHANGE IN CASH AND CASH EQUIVALENTSadidas AG generated a positive cash flow from operating activities of € 1.109 billion (2016: € 263 million). The change versus the prior year was mainly a result of higher payables to affiliated companies, partly offset by an increase in receivables from affiliated companies. Net cash outflow from investment activities was € 330 million (2016: € 133 million). This was primarily attributable to capital expenditure for tangible fixed assets of € 227 million and capital expenditure for financial assets in an amount of € 115 million, partly offset by disposals from financial assets of € 12 million. Financing activities resulted in a net cash outflow of € 469 million (2016: € 549 million). The net cash outflow from financing activities mainly relates to the dividend payment in an amount of € 405 million. As a result of all these developments, cash and cash equivalents of adidas AG increased to € 337 million at the end of December 2017 compared to € 28 million at the end of the prior year.
adidas AG has bilateral credit lines of € 1.7 billion. In addition, the company has a multi-currency commercial paper program in an amount of € 2.0 billion. SEE TREASURY, P. 115
adidas AG is able to meet its financial commitments at all times.
DISCLOSURES PURSUANT TO § 315A SECTION 1 AND § 289A SECTION 1 OF THE GERMAN COMMERCIAL CODE
COMPOSITION OF SUBSCRIBED CAPITALThe nominal capital of adidas AG amounts to € 209,216,186 (as at December 31, 2017) and is divided into the same number of registered no-par-value shares with a pro rata amount in the nominal capital of € 1 each (‘shares’). Pursuant to § 4 section 10 of the Articles of Association, shareholders’ claims to the issuance of individual share certificates are, in principle, excluded. Each share grants one vote at the Annual General Meeting. All shares carry the same rights and obligations. As at December 31, 2017, adidas AG held 5,354,952 treasury shares, which however do not confer any rights to the company in accordance with § 71b German Stock Corporation Act (Aktiengesetz – AktG). SEE NOTE 26, P. 182
In the USA, we have issued American Depositary Receipts (ADRs). ADRs are deposit certificates of non-US shares that are traded instead of the original shares on US stock exchanges. Two ADRs equal one share. SEE OUR SHARE, P. 57
RESTRICTIONS ON VOTING RIGHTS OR TRANSFER OF SHARESWe are not aware of any contractual agreements with adidas AG or other agreements restricting voting rights or the transfer of shares. Based on the Code of Conduct in conjunction with an internal guideline of adidas AG and based on Article 19 section 11 of the Market Abuse Regulation, however, particular lock-up periods do exist for members of the Executive Board with regard to the purchase and sale of adidas AG shares. These lock-up periods are connected, in particular, with the (time of) publication of quarterly and full year results. Lock-up periods stipulated in the Code of Conduct and the internal guideline also exist for employees who have access to yet unpublished financial results.
In addition, restrictions of voting rights may exist pursuant, inter alia, to § 136 AktG or for treasury shares pursuant to § 71b AktG as well as due to capital market regulations, in particular pursuant to §§ 21 et seq. German Securities Trading Act (Wertpapierhandelsgesetz – WpHG).
The shares that were issued in the context of the Stock Purchase Plan to employees of adidas AG and employees of subsidiaries participating in the Stock Purchase Plan are not subject to any lock-up periods, unless such a waiting period is stipulated in locally applicable regulations. Employees who hold the shares which they purchased themselves (investment shares) for at least one year will subsequently receive one share for every six investment shares without having to pay for such share (so-called matching share) if they are still adidas employees at that point in time. If employees transfer, pledge or hypothecate investment shares in any way during the one-year vesting period, the right to receive matching shares shall cease.
SHAREHOLDINGS IN SHARE CAPITAL EXCEEDING 10% OF VOTING RIGHTSWe have not been notified of, and are not aware of, any direct or indirect shareholdings in the share capital of adidas AG exceeding 10% of the voting rights.
SHARES WITH SPECIAL RIGHTSThere are no shares bearing special rights. In particular, there are no shares with rights conferring powers of control.
VOTING RIGHT CONTROL IF EMPLOYEES HAVE A SHARE IN THE CAPITALLike all other shareholders, employees who hold adidas AG shares exercise their control rights directly in accordance with statutory provisions and the Articles of Association. The shares which employees acquire in the context of the Stock Purchase Plan are held in trust centrally by a service provider
ADID
AS
ANN
UAL
REPO
RT 2
017
1201 TO OUR SHAREHOLDERS 2 GROUP MANAGEMENT REPORT –
OUR COMPANY3 GROUP MANAGEMENT REPORT –
FINANCIAL REVIEW4 CONSOLIDATED FINANCIAL
STATEMENTS5 ADDITIONAL INFORMATION
BUSINESS PERFORMANCEDisclosures pursuant to § 315a Section 1 and § 289a Section 1 of the German Commercial Code
on behalf of the participating employees. As long as the shares are held in trust, the trustee shall take reasonable measures to allow participating employees to directly or indirectly exercise their voting rights in respect of the shares held in trust.
EXECUTIVE BOARD APPOINTMENT AND DISMISSALPursuant to § 6 of the Articles of Association and § 84 AktG, the Supervisory Board is responsible for determining the exact number of members of the Executive Board, for their appointment and dismissal as well as for the appointment of the Chief Executive Officer (CEO). The adidas AG Executive Board, which, as a basic principle, comprises at least two members, currently consists of the CEO as well as five further members. Executive Board members may be appointed for a maximum period of five years. Such appointments may be renewed and the terms of office may be extended, provided that no term exceeds five years. SEE EXECUTIVE BOARD, P. 20
The Supervisory Board may revoke the appointment of an individual as member of the Executive Board or CEO for good cause, such as gross negligence of duties or a vote of no confidence by the Annual General Meeting.
As adidas AG is subject to the regulations of the German Co-Determination Act (Mitbestimmungsgesetz – MitbestG), the appointment of Executive Board members and also their dismissal requires a majority of at least two thirds of the Supervisory Board members (§ 31 MitbestG). If such a majority is not established in the first vote by the Supervisory Board, the Mediation Committee has to present a proposal which, however, does not exclude other proposals. The appointment or dismissal is then made in a second vote with a simple majority of the votes cast by the Supervisory Board members. Should the required majority not be established in this case either, a third vote, again requiring a simple majority, must be
held in which, however, the Chairman of the Supervisory Board has two votes.
If the Executive Board does not have the required number of members, the competent court shall, in urgent cases, make the necessary appointment upon application by any party involved (§ 85 section 1 AktG).
AMENDMENTS TO THE ARTICLES OF ASSOCIATIONPursuant to § 179 section 1 sentence 1 AktG, the Articles of Association of adidas AG can, in principle, only be amended by a resolution passed by the Annual General Meeting. Pursuant to § 21 section 3 of the Articles of Association in conjunction with § 179 section 2 sentence 2 AktG, the Annual General Meeting of adidas AG principally resolves upon amendments to the Articles of Association with a simple majority of the votes cast and with a simple majority of the nominal capital represented when passing the resolution. However, if mandatory legal provisions stipulate a larger majority of voting rights or capital, this is applicable. When it comes to amendments solely relating to the wording, the Supervisory Board is authorized to make these modifications in accordance with § 179 section 1 sentence 2 AktG in conjunction with § 10 section 1 sentence 2 of the Articles of Association.
AUTHORIZATIONS OF THE EXECUTIVE BOARDThe authorizations of the Executive Board are regulated by §§ 76 et seq. AktG in conjunction with §§ 7 and 8 of the Articles of Association. The Executive Board is responsible, in particular, for managing the company and represents the company judicially and extra-judicially.
AUTHORIZATION OF THE EXECUTIVE BOARD TO ISSUE SHARESThe authorization of the Executive Board to issue shares is regulated by § 4 of the Articles of Association and by statutory provisions:
Authorized Capital — Until June 7, 2020, the Executive Board is authorized to
increase the nominal capital, subject to Supervisory Board approval, by issuing new shares against contributions in kind once or several times by no more than € 16,000,000 altogether (Authorized Capital 2017/II).
— Until June 14, 2021, the Executive Board is authorized to increase the nominal capital, subject to Supervisory Board approval, by issuing new shares against contributions in cash once or several times by no more than € 4,000,000 altogether (Authorized Capital 2016).
— Until June 7, 2022, the Executive Board is authorized to increase the nominal capital, subject to Supervisory Board approval, by issuing new shares against contributions in cash once or several times by no more than € 50,000,000 altogether (Authorized Capital 2017/I).
— Until June 7, 2022, the Executive Board is authorized to increase the nominal capital, subject to Supervisory Board approval, by issuing new shares against contributions in cash once or several times by no more than € 20,000,000 altogether (Authorized Capital 2017/III).
Subject to Supervisory Board approval, shareholders’ subscription rights are partially excluded or may be excluded in certain cases for the above-mentioned, in principle cumulative authorizations. SEE NOTE 26, P. 182
Contingent Capital — The nominal capital of the company is conditionally
increased by up to € 36,000,000 (Contingent Capital 2010). The Contingent Capital serves the purpose of granting
ADID
AS
ANN
UAL
REPO
RT 2
017
1211 TO OUR SHAREHOLDERS 2 GROUP MANAGEMENT REPORT –
OUR COMPANY3 GROUP MANAGEMENT REPORT –
FINANCIAL REVIEW4 CONSOLIDATED FINANCIAL
STATEMENTS5 ADDITIONAL INFORMATION
BUSINESS PERFORMANCEDisclosures pursuant to § 315a Section 1 and § 289a Section 1 of the German Commercial Code

holders or creditors of bonds that were issued up to May 5, 2015 based on the resolution of the Annual General Meeting on May 6, 2010 subscription or conversion rights relating to no more than a total of 36,000,000 shares in compliance with the corresponding conditions of the bonds.
On March 14, 2012, following the approval of the Supervisory Board, the Executive Board resolved to make partial use of the authorization granted by the Annual General Meeting on May 6, 2010 and issued a convertible bond, excluding shareholders’ subscription rights, on March 21, 2012. However, the shares will only be issued insofar as bondholders make use of their conversion rights. The total number of shares to be issued to bondholders in case of full conversion amounted to up to 3,182,525 shares as at December 31, 2016. Due to the fact that conversion rights were exercised, which were all serviced with treasury shares of the company, the remaining number of shares to be issued to bondholders in case of full conversion amounted to up to 377,190 shares as at December 31, 2017.
Moreover, the authorization to issue bonds with warrants and/or convertible bonds granted on May 6, 2010 was canceled by resolution of the Annual General Meeting on May 8, 2014.
— Furthermore, the nominal capital of the company is conditionally increased by up to € 12,500,000 (Contingent Capital 2014). The Contingent Capital serves the purpose of granting holders or creditors of bonds that were issued based on the resolution of the Annual General Meeting on May 8, 2014 subscription or conversion rights relating to no more than a total of 12,500,000 shares in compliance with the corresponding conditions of the bonds. Based on the authorization granted by the Annual General Meeting on May 8, 2014, the Executive Board is authorized, subject to Supervisory Board approval, to issue bonds with warrants and/or convertible bonds in an aggregate
nominal value of up to € 1,000,000,000 with or without a limited term, against contributions in cash once or several times until May 7, 2019, and to guarantee bonds issued by subordinated Group companies. The Executive Board is also authorized, subject to Supervisory Board approval, to exclude shareholders’ subscription rights for fractional amounts and to exclude shareholders’ subscription rights insofar as this is necessary for granting subscription rights to which holders or creditors of previously issued bonds are entitled. Furthermore, the Executive Board is authorized, subject to Supervisory Board approval, to also exclude shareholders’ subscription rights if the issue price of the bonds is not significantly below the hypothetical market value of these bonds and the number of shares to be issued does not exceed 10% of the nominal capital. The issuance of new shares or the use of treasury shares must be taken into account when calculating the limit of 10% in certain specific cases.
The Executive Board has so far not utilized the authorization to issue bonds with warrants and/or convertible bonds granted by the Annual General Meeting on May 8, 2014.
AUTHORIZATION OF THE EXECUTIVE BOARD TO REPURCHASE SHARESThe authorizations of the Executive Board to repurchase adidas AG shares arise from §§ 71 et seq. AktG and, as at the balance sheet date, from the authorization granted by the Annual General Meeting on May 12, 2016.
— Until May 11, 2021, the Executive Board is authorized to repurchase adidas AG shares in an amount totaling up to 10% of the nominal capital at the date of the resolution (or, as the case may be, a lower amount of nominal capital at the date of utilization of the authorization) for any lawful purpose and within the legal framework. The authorization may be used by the company but also by its subordinated
Group companies or by third parties on account of the company or its subordinated Group companies or third parties assigned by the company or one of its subordinated Group companies.
The repurchase can be carried out via the stock exchange, through a public invitation to submit sale offers, through a public repurchase offer, or through granting tender rights to shareholders. Furthermore, the authorization sets out the lowest and highest nominal value that may be granted in each case.
The purposes for which adidas AG shares repurchased based on this authorization may be used are set out in the resolution on Item 9 of the Agenda for the Annual General Meeting held on May 12, 2016. The shares may in particular be used as follows:
— They may be sold via the stock exchange, through a public share purchase offer made to all shareholders or sold otherwise against cash (limited to 10% of the nominal capital taking into account certain offsets) at a price not significantly below the stock market price of shares with the same features.
— They may be offered and assigned as consideration for the direct or indirect acquisition of companies, parts of companies, participations in companies or other economic assets or within the scope of company mergers.
— They may be offered and sold as consideration for the acquisition of industrial property rights or intangible property rights or for the acquisition of licenses relating to such rights, also through subordinated Group companies.
— They may be used for purposes of meeting the subscription or conversion rights or obligations or the company’s right to delivery of shares arising from
ADID
AS
ANN
UAL
REPO
RT 2
017
1221 TO OUR SHAREHOLDERS 2 GROUP MANAGEMENT REPORT –
OUR COMPANY3 GROUP MANAGEMENT REPORT –
FINANCIAL REVIEW4 CONSOLIDATED FINANCIAL
STATEMENTS5 ADDITIONAL INFORMATION
BUSINESS PERFORMANCEDisclosures pursuant to § 315a Section 1 and § 289a Section 1 of the German Commercial Code

bonds with warrants and/or convertible bonds issued by the company or its subordinated Group companies.
— In connection with employee stock purchase plans, up to 4,000,000 shares may be issued in favor of (current or former) employees of the company and its affiliated companies as well as in favor of (current and former) management bodies of the company’s affiliated companies.
— They may be canceled without requiring an additional resolution of the Annual General Meeting.
Furthermore, the shares may be assigned to members of the Executive Board as compensation by way of a stock bonus subject to the provision that resale by the Executive Board members shall only be permitted following a retention period of at least three years from the date of assignment. Responsibility in this case lies with the Supervisory Board.
In case of utilization of shares for the above-mentioned purposes, except for the cancelation of shares, shareholders’ subscription rights are excluded.
The Supervisory Board may provide that transactions based on this authorization may only be carried out subject to the approval of the Supervisory Board or one of its committees.
In the year under review, the Executive Board partly utilized the authorization to repurchase treasury shares. In a third tranche (total period from November 8, 2016 up to and including January 31, 2017) of the share buyback program, adidas AG bought back 472,966 treasury shares via the stock exchange in the period from January 1, 2017 up to and including January 31, 2017. SEE NOTE 26, P. 182
— In the scope of the authorization resolved by the Annual General Meeting on May 12, 2016, the Executive Board is furthermore authorized to conduct the share buyback
also by using equity derivatives which are arranged with a credit institution or financial services institution in close conformity with market conditions. adidas AG may acquire call options issued for physical delivery and/or sell put options or use a combination of call and put options or other equity derivatives if the option conditions ensure that these shares are only delivered if they were purchased in compliance with the equality principle. All share purchases using the aforementioned equity derivatives are limited to a maximum value of 5% of the nominal capital existing at the date on which the resolution was adopted by the Annual General Meeting (or, as the case may be, a lower amount of nominal capital at the date of utilization of the authorization). The term of the options may not exceed 18 months and must furthermore be chosen in such a way that the shares are acquired upon the exercise of the options no later than May 11, 2021. The authorization furthermore sets out the lowest and highest nominal value that may be granted in each case.
For excluding subscription rights, the use and cancelation of shares purchased using equity derivatives, the general provisions adopted by the Annual General Meeting (set out above) are applicable accordingly.
CHANGE OF CONTROL/COMPENSATION AGREEMENTSMaterial agreements entered into by adidas AG containing a change-of-control clause relate to financing agreements. In the case of a change of control, these agreements, in accordance with common practice, entitle the creditor to termination and early calling-in of any outstanding amounts.
No compensation agreements exist between adidas AG and members of the Executive Board or employees relating to the event of a takeover bid.
ADID
AS
ANN
UAL
REPO
RT 2
017
1231 TO OUR SHAREHOLDERS 2 GROUP MANAGEMENT REPORT –
OUR COMPANY3 GROUP MANAGEMENT REPORT –
FINANCIAL REVIEW4 CONSOLIDATED FINANCIAL
STATEMENTS5 ADDITIONAL INFORMATION
BUSINESS PERFORMANCEDisclosures pursuant to § 315a Section 1 and § 289a Section 1 of the German Commercial Code

BUSINESS PERFORMANCE BY SEGMENTadidas has divided its operating activities into the following operating segments: Western Europe, North America (excluding USA Reebok), USA Reebok, Greater China, Russia/CIS, Latin America, Japan, Middle East, South Korea and Southeast Asia/Pacific. While the business segments Western Europe, Greater China, Russia/CIS, Latin America and Japan are reported separately, North America (excluding USA Reebok) and USA Reebok are combined to the reportable segment North America. Similarly, the markets Middle East, South Korea and Southeast Asia/Pacific are aggregated to the reportable segment MEAA (‘Middle East, Africa and other Asian markets’). Each market comprises all business activities in the wholesale and retail distribution channels of the adidas and Reebok brands. Segmental operating expenses primarily relate to marketing expenditure as well as oper-ating overhead costs.
WESTERN EUROPEIn 2017, sales in Western Europe increased 13% on a currency-neutral basis. In euro terms, sales in Western Europe grew 11% to € 5.883 billion from € 5.291 billion in 2016. Despite difficult prior year comparisons mainly resulting from revenues generated with UEFA EURO 2016 related products as well as the termination of the Chelsea F.C. sponsorship as of June 30, 2016, adidas brand revenues grew 12% on a currency-neutral basis. This development was driven by double- digit sales growth in the running and outdoor categories as well as at adidas Originals and adidas neo. In addition, mid-single-digit increases in the training category also supported this development. Reebok brand revenues in Western Europe increased 24% on a currency-neutral basis, as a result of double- digit sales growth in Classics as well as high-single-digit growth in the training and running categories. SEE TABLE 87
Gross margin in Western Europe increased 1.1 percentage points to 45.5% from 44.4% in 2016 as positive effects from a more favorable pricing and channel mix more than offset the significant negative impact from unfavorable currency developments as well as higher input costs. Operating expenses were up 7% to € 1.501 billion versus € 1.398 billion in 2016. This development reflects an increase in marketing expenditure as well as higher operating overhead costs. Operating expenses as a percentage of sales were down 0.9 per centage points to 25.5% (2016: 26.4%). The operating margin increased 2.1 percentage points to 20.0% (2016: 18.0%), as a result of the gross margin improvement as well as the positive effect of lower operating expenses as a percentage of sales. Operating profit in Western Europe increased 24% to € 1.178 billion versus € 951 million in the prior year. SEE TABLE 87
NORTH AMERICARevenues in North America grew 27% on a currency-neutral basis and 25% in euro terms to € 4.275 billion from € 3.412 billion in 2016. adidas brand sales increased 35% on a currency-neutral basis, driven by double-digit sales growth in the running and training categories as well as at adidas Originals and adidas neo. Revenues of the Reebok brand in North America decreased 15% on a currency-neutral basis, reflecting the closure of own-retail stores in the US.
SEE REEBOK BRAND STRATEGY, P. 70 From a category perspective, double-digit growth in Classics was more than offset by sales declines in the training and running categories. SEE TABLE 88
Gross margin in North America increased 1.8 percentage points to 39.5% (2016: 37.7%) driven by an improved product mix, partly offset by a less favorable channel and pricing mix as well as higher input costs. Operating expenses were up 14% to € 1.280 billion versus € 1.124 billion in 2016, reflecting an increase in marketing expenditure as well as higher operating overhead costs. Operating expenses as a percentage of sales decreased 3.0 percentage points to 29.9% (2016: 32.9%). As a result of the strong top-line development, the
Western Europe at a glance € in millions 87
2017 2016 Change
Change (currency-
neutral)
Net sales 5,883 5,291 11% 13%adidas brand 5,388 4,889 10% 12%Reebok brand 496 402 23% 24%
Gross profit 2,679 2,350 14% –Gross margin 45.5% 44.4% 1.1pp –Segmental operating profit 1,178 951 24% –Segmental operating margin 20.0% 18.0% 2.1pp –
North America at a glance € in millions 88
2017 2016 Change
Change (currency-
neutral)
Net sales 4,275 3,412 25% 27%adidas brand 3,843 2,897 33% 35%Reebok brand 432 514 (16%) (15%)
Gross profit 1,689 1,286 31% –Gross margin 39.5% 37.7% 1.8pp –Segmental operating profit 468 214 119% –Segmental operating margin 10.9% 6.3% 4.7pp –
ADID
AS
ANN
UAL
REPO
RT 2
017
1241 TO OUR SHAREHOLDERS 2 GROUP MANAGEMENT REPORT –
OUR COMPANY3 GROUP MANAGEMENT REPORT –
FINANCIAL REVIEW4 CONSOLIDATED FINANCIAL
STATEMENTS5 ADDITIONAL INFORMATION
BUSINESS PERFORMANCE BY SEGMENT
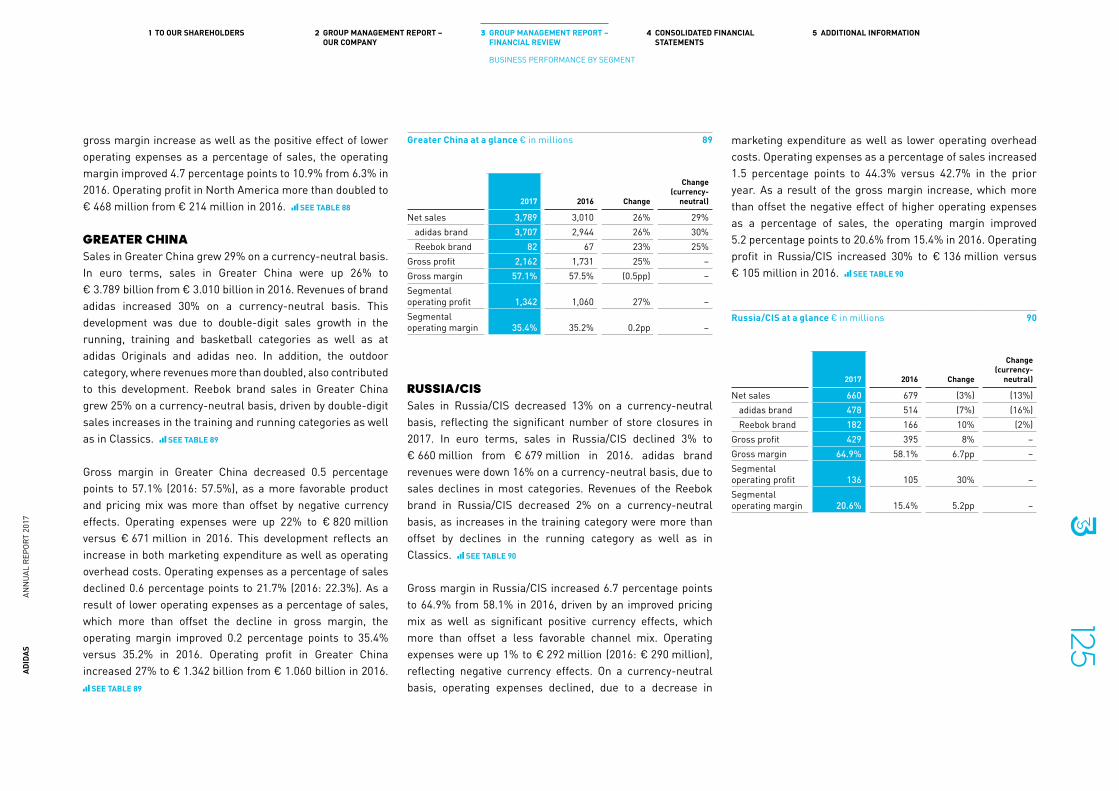
gross margin increase as well as the positive effect of lower operating expenses as a percentage of sales, the operating margin improved 4.7 percentage points to 10.9% from 6.3% in 2016. Operating profit in North America more than doubled to € 468 million from € 214 million in 2016. SEE TABLE 88
GREATER CHINASales in Greater China grew 29% on a currency-neutral basis. In euro terms, sales in Greater China were up 26% to € 3.789 billion from € 3.010 billion in 2016. Revenues of brand adidas increased 30% on a currency-neutral basis. This development was due to double-digit sales growth in the running, training and basketball categories as well as at adidas Originals and adidas neo. In addition, the outdoor category, where revenues more than doubled, also contributed to this development. Reebok brand sales in Greater China grew 25% on a currency-neutral basis, driven by double-digit sales increases in the training and running categories as well as in Classics. SEE TABLE 89
Gross margin in Greater China decreased 0.5 percentage points to 57.1% (2016: 57.5%), as a more favorable product and pricing mix was more than offset by negative currency effects. Operating expenses were up 22% to € 820 million versus € 671 million in 2016. This development reflects an increase in both marketing expenditure as well as operating overhead costs. Operating expenses as a percentage of sales declined 0.6 percentage points to 21.7% (2016: 22.3%). As a result of lower operating expenses as a percentage of sales, which more than offset the decline in gross margin, the operating margin improved 0.2 percentage points to 35.4% versus 35.2% in 2016. Operating profit in Greater China increased 27% to € 1.342 billion from € 1.060 billion in 2016.
SEE TABLE 89
RUSSIA/CISSales in Russia/CIS decreased 13% on a currency-neutral basis, reflecting the significant number of store closures in 2017. In euro terms, sales in Russia/CIS declined 3% to € 660 million from € 679 million in 2016. adidas brand revenues were down 16% on a currency-neutral basis, due to sales declines in most categories. Revenues of the Reebok brand in Russia/CIS decreased 2% on a currency-neutral basis, as increases in the training category were more than offset by declines in the running category as well as in Classics. SEE TABLE 90
Gross margin in Russia/CIS increased 6.7 percentage points to 64.9% from 58.1% in 2016, driven by an improved pricing mix as well as significant positive currency effects, which more than offset a less favorable channel mix. Operating expenses were up 1% to € 292 million (2016: € 290 million), reflecting negative currency effects. On a currency-neutral basis, operating expenses declined, due to a decrease in
marketing expenditure as well as lower operating overhead costs. Operating expenses as a percentage of sales increased 1.5 percentage points to 44.3% versus 42.7% in the prior year. As a result of the gross margin increase, which more than offset the negative effect of higher operating expenses as a percentage of sales, the operating margin improved 5.2 per centage points to 20.6% from 15.4% in 2016. Operating profit in Russia/CIS increased 30% to € 136 million versus € 105 million in 2016. SEE TABLE 90
Greater China at a glance € in millions 89
2017 2016 Change
Change (currency-
neutral)
Net sales 3,789 3,010 26% 29%adidas brand 3,707 2,944 26% 30%Reebok brand 82 67 23% 25%
Gross profit 2,162 1,731 25% –Gross margin 57.1% 57.5% (0.5pp) –Segmental operating profit 1,342 1,060 27% –Segmental operating margin 35.4% 35.2% 0.2pp –
Russia/CIS at a glance € in millions 90
2017 2016 Change
Change (currency-
neutral)
Net sales 660 679 (3%) (13%)adidas brand 478 514 (7%) (16%)Reebok brand 182 166 10% (2%)
Gross profit 429 395 8% –Gross margin 64.9% 58.1% 6.7pp –Segmental operating profit 136 105 30% –Segmental operating margin 20.6% 15.4% 5.2pp –
ADID
AS
ANN
UAL
REPO
RT 2
017
1251 TO OUR SHAREHOLDERS 2 GROUP MANAGEMENT REPORT –
OUR COMPANY3 GROUP MANAGEMENT REPORT –
FINANCIAL REVIEW4 CONSOLIDATED FINANCIAL
STATEMENTS5 ADDITIONAL INFORMATION
BUSINESS PERFORMANCE BY SEGMENT
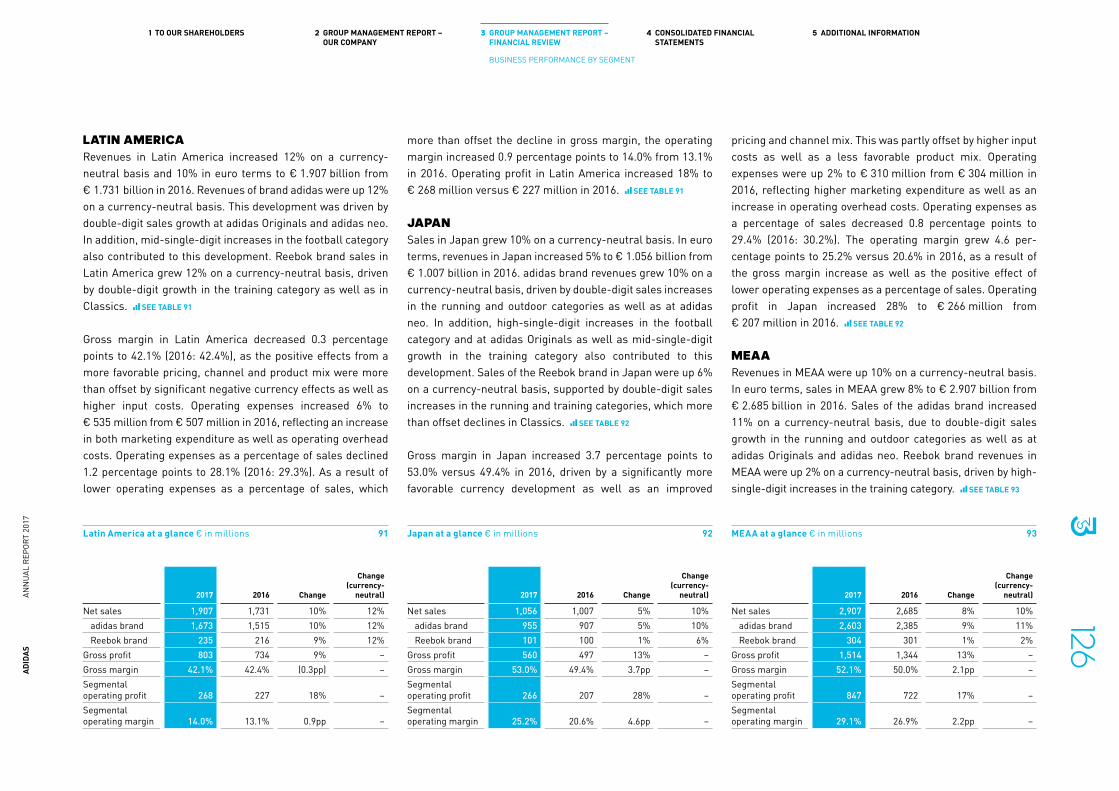
LATIN AMERICARevenues in Latin America increased 12% on a currency-neutral basis and 10% in euro terms to € 1.907 billion from € 1.731 billion in 2016. Revenues of brand adidas were up 12% on a currency-neutral basis. This development was driven by double-digit sales growth at adidas Originals and adidas neo. In addition, mid-single-digit increases in the football category also contributed to this development. Reebok brand sales in Latin America grew 12% on a currency-neutral basis, driven by double-digit growth in the training category as well as in Classics. SEE TABLE 91
Gross margin in Latin America decreased 0.3 percentage points to 42.1% (2016: 42.4%), as the positive effects from a more favorable pricing, channel and product mix were more than offset by significant negative currency effects as well as higher input costs. Operating expenses increased 6% to € 535 million from € 507 million in 2016, reflecting an increase in both marketing expenditure as well as operating overhead costs. Operating expenses as a percentage of sales declined 1.2 percentage points to 28.1% (2016: 29.3%). As a result of lower operating expenses as a percentage of sales, which
more than offset the decline in gross margin, the operating margin increased 0.9 percentage points to 14.0% from 13.1% in 2016. Operating profit in Latin America increased 18% to € 268 million versus € 227 million in 2016. SEE TABLE 91
JAPANSales in Japan grew 10% on a currency-neutral basis. In euro terms, revenues in Japan increased 5% to € 1.056 billion from € 1.007 billion in 2016. adidas brand revenues grew 10% on a currency-neutral basis, driven by double-digit sales increases in the running and outdoor categories as well as at adidas neo. In addition, high-single-digit increases in the football category and at adidas Originals as well as mid-single-digit growth in the training category also contributed to this development. Sales of the Reebok brand in Japan were up 6% on a currency-neutral basis, supported by double-digit sales increases in the running and training categories, which more than offset declines in Classics. SEE TABLE 92
Gross margin in Japan increased 3.7 percentage points to 53.0% versus 49.4% in 2016, driven by a significantly more favorable currency development as well as an improved
pricing and channel mix. This was partly offset by higher input costs as well as a less favorable product mix. Operating expenses were up 2% to € 310 million from € 304 million in 2016, reflecting higher marketing expenditure as well as an increase in operating overhead costs. Operating expenses as a percentage of sales decreased 0.8 percentage points to 29.4% (2016: 30.2%). The operating margin grew 4.6 per-centage points to 25.2% versus 20.6% in 2016, as a result of the gross margin increase as well as the positive effect of lower operating expenses as a percentage of sales. Operating profit in Japan increased 28% to € 266 million from € 207 million in 2016. SEE TABLE 92
MEAARevenues in MEAA were up 10% on a currency-neutral basis. In euro terms, sales in MEAA grew 8% to € 2.907 billion from € 2.685 billion in 2016. Sales of the adidas brand increased 11% on a currency-neutral basis, due to double-digit sales growth in the running and outdoor categories as well as at adidas Originals and adidas neo. Reebok brand revenues in MEAA were up 2% on a currency-neutral basis, driven by high-single-digit increases in the training category. SEE TABLE 93
Latin America at a glance € in millions 91
2017 2016 Change
Change (currency-
neutral)
Net sales 1,907 1,731 10% 12%adidas brand 1,673 1,515 10% 12%Reebok brand 235 216 9% 12%
Gross profit 803 734 9% –Gross margin 42.1% 42.4% (0.3pp) –Segmental operating profit 268 227 18% –Segmental operating margin 14.0% 13.1% 0.9pp –
Japan at a glance € in millions 92
2017 2016 Change
Change (currency-
neutral)
Net sales 1,056 1,007 5% 10%adidas brand 955 907 5% 10%Reebok brand 101 100 1% 6%
Gross profit 560 497 13% –Gross margin 53.0% 49.4% 3.7pp –Segmental operating profit 266 207 28% –Segmental operating margin 25.2% 20.6% 4.6pp –
MEAA at a glance € in millions 93
2017 2016 Change
Change (currency-
neutral)
Net sales 2,907 2,685 8% 10%adidas brand 2,603 2,385 9% 11%Reebok brand 304 301 1% 2%
Gross profit 1,514 1,344 13% –Gross margin 52.1% 50.0% 2.1pp –Segmental operating profit 847 722 17% –Segmental operating margin 29.1% 26.9% 2.2pp –
ADID
AS
ANN
UAL
REPO
RT 2
017
1261 TO OUR SHAREHOLDERS 2 GROUP MANAGEMENT REPORT –
OUR COMPANY3 GROUP MANAGEMENT REPORT –
FINANCIAL REVIEW4 CONSOLIDATED FINANCIAL
STATEMENTS5 ADDITIONAL INFORMATION
BUSINESS PERFORMANCE BY SEGMENT

Gross margin in MEAA increased 2.1 percentage points to 52.1% (2016: 50.0%), driven by an improved pricing, product and channel mix, partly offset by negative currency effects and higher input costs. Operating expenses were up 7% to € 669 million versus € 624 million in 2016, mainly as a result of higher operating overhead costs. As a percentage of sales, operating expenses declined 0.2 percentage points to 23.0% from 23.2% in 2016. The operating margin was up 2.2 per-centage points to 29.1% (2016: 26.9%), as a result of the higher gross margin as well as the positive effect of lower operating expenses as a percentage of sales. Operating profit in MEAA increased 17% to € 847 million versus € 722 million in 2016. SEE TABLE 93
ADID
AS
ANN
UAL
REPO
RT 2
017
1271 TO OUR SHAREHOLDERS 2 GROUP MANAGEMENT REPORT –
OUR COMPANY3 GROUP MANAGEMENT REPORT –
FINANCIAL REVIEW4 CONSOLIDATED FINANCIAL
STATEMENTS5 ADDITIONAL INFORMATION
BUSINESS PERFORMANCE BY SEGMENT

SUBSEQUENT EVENTS AND OUTLOOKIn 2018, we expect the global economy and consumer spending to grow, providing a positive backdrop for robust growth and expansion of the sporting goods industry. Through our extensive pipeline of innovative products, powerful brand-building activities and tight control of both our inventory levels and our cost base, we project strong top- and bottom-line improvements in 2018. We forecast sales to increase at a rate of around 10% on a currency-neutral basis. Gross margin is projected to grow up to 0.3 percentage points to a level of up to 50.7%. Operating margin is expected to increase between 0.5 and 0.7 percentage points to a level between 10.3% and 10.5%, driven by the increase in gross margin as well as the positive effect of lower other operating expenses as a percentage of sales. Paired with lower financial expenses and a reduced tax rate, we project net income from continuing operations to increase to a level between € 1.615 billion and € 1.675 billion.
SUBSEQUENT EVENTS
NO SUBSEQUENT EVENTSSince the end of 2017, there have been no significant organizational, management, economic, sociopolitical, legal or financial changes which we expect to influence our business materially going forward.
OUTLOOK
FORWARD-LOOKING STATEMENTSThis Management Report contains forward-looking statements that reflect Management’s current view with respect to the future development of our company. The outlook is based on estimates that we have made on the basis of all the information available to us at the time of completion of this Annual Report. In addition, such forward-looking statements are subject to uncertainties which are beyond the control of the company.
SEE RISK AND OPPORTUNITY REPORT, P. 131 In case the underlying assumptions turn out to be incorrect or described risks or opportunities materialize, actual results and developments may materially deviate (negatively or positively) from those expressed by such statements. adidas does not assume any obligation to update any forward-looking statements made in this Management Report beyond statutory disclosure obligations.
CHANGES TO SEGMENTAL REPORTINGTo win the consumer in the dynamic Asian business environment and to provide consumers with a consistent best-in-class brand experience across all channels and markets, we aim at further driving simplicity and consistency across Asia. In this context, effective January 1, 2018, we have consolidated our former four Asia/Pacific markets Greater China, Japan, South Korea and Southeast Asia/Pacific to one operating segment Asia/Pacific. By doing so, we will create a more sustainable business model across Asia, in which we will be able to share and implement best practices in a more efficient manner.
Therefore, effective January 1, 2018, adidas has divided its operating activities into the following operating segments:
Western Europe, North America (excluding USA Reebok), USA Reebok, Russia/CIS, Latin America, Asia/Pacific and Emerging Markets. While the business segments Western Europe, Russia/CIS, Latin America, Asia/Pacific and Emerging Markets are reported separately, North America (excluding USA Reebok) and USA Reebok are combined to the reportable segment North America. Each market comprises all business activities in the wholesale and retail distribution channels of the adidas and Reebok brands.
GLOBAL ECONOMY TO GROW STEADILY IN 2018 1
Global GDP is projected to remain on a steady growth trajectory, expanding 3.1% in 2018. The ongoing cyclical recovery is expected to continue, driven by a further acceleration in global trade, on the back of benign global financing conditions, accommodative monetary policies, rising consumer confidence and firming commodity prices. However, the headline growth forecast conceals differences between the pace of growth in developed and developing economies. Developing economies are forecast to see an acceleration of growth to 4.5% as commodity-exporting economies benefit from a stabilization of oil and other commodity prices. In contrast, growth in developed economies is projected to slow to 2.2%, as gradual monetary tightening appears likely and aging populations as well as weak productivity trends impose a constraint on growth. With macroeconomic indicators generally at elevated levels already and potential economic growth set to decrease due to a slowdown in productivity growth as well as less favorable demographic trends, risks to the global outlook are tilted to the downside. A rise in borrowing costs or disorderly movements in financial markets might cause turbulence and potentially derail the expansion. In addition, instances of trade protectionism or geopolitical conflicts could dampen consumer confidence, trade and growth.
1 Source: World Bank Global Economic Prospects.
ADID
AS
ANN
UAL
REPO
RT 2
017
1281 TO OUR SHAREHOLDERS 2 GROUP MANAGEMENT REPORT –
OUR COMPANY3 GROUP MANAGEMENT REPORT –
FINANCIAL REVIEW4 CONSOLIDATED FINANCIAL
STATEMENTS5 ADDITIONAL INFORMATION
SUBSEQUENT EVENTS AND OUTLOOK

SPORTING GOODS INDUSTRY EXPANSION TO CONTINUE IN 2018In the absence of any major macroeconomic shocks, we expect the global sporting goods industry to grow at a mid-single-digit rate in 2018. Sector growth in North America, the biggest market by size globally, is yet to return to the pace seen in the past. At the same time, most markets globally look set to continue expanding at robust rates. The occurrence of major sports events such as the 2018 FIFA World Cup will provide a modest tailwind to the overall sector. Consumer spending on sporting goods in the developing economies is expected to grow faster than in the more developed markets. Progressing urbanization and a growing middle-class in many developing economies are predicted to further propel industry growth throughout the year. In developed economies, the sporting goods industry is forecast to expand, as wage increases on the back of generally strong labor market conditions will
support consumer spending on sporting goods. Around the world, rising sports participation and health awareness is projected to continue to boost demand for athletic performance products. In addition, sportswear penetration rates are forecast to edge up further as sports-inspired apparel and footwear (‘athleisure’) has become a structural component of the broader fashion landscape, fueling the demand for athletic casual and activewear products. Within the supply chain, innovation such as the application of new manu fac-turing techniques is projected to enhance speed-to-market capabilities of sports brands, which will favorably impact sales growth as consumers’ demands can be met faster and more precisely. On the distribution side, the e-commerce channel, which is already a significant growth driver for the industry, is anticipated to broaden out further as investments into the digital transformation continue across the sporting goods industry.
CURRENCY-NEUTRAL SALES TO INCREASE AT A RATE OF AROUND 10% IN 2018We expect sales to increase at a rate of around 10% on a currency-neutral basis in 2018. SEE TABLE 94 Despite continued uncertainties regarding the global economic outlook, the company’s sales development will be favorably impacted by rising consumer spending, increasing penetration of sportswear (‘athleisure’) and growing health awareness in most geographical areas, as well as major events such as the 2018 FIFA World Cup. In addition, the further expansion and improvement of our controlled space initiatives, in particular through our own e-commerce channel, is expected to contribute to sales growth.
NORTH AMERICA AND ASIA/PACIFIC TO GROW AT A DOUBLE-DIGIT CURRENCY-NEUTRAL RATEIn 2018, we expect currency-neutral revenues to increase in most market segments. While currency-neutral sales are projected to grow at double-digit rates in North America and Asia/Pacific, currency-neutral sales in Western Europe and Latin America are forecast to improve at a mid-single-digit rate each. In addition, currency-neutral revenues in Emerging Markets are expected to grow at a low-single-digit rate. Currency-neutral sales in Russia/CIS are expected to be around the prior year level. SEE TABLE 94
GROSS MARGIN EXPECTED TO INCREASE TO A LEVEL OF UP TO 50.7%In 2018, the gross margin is forecast to increase up to 0.3 percentage points to a level of up to 50.7% (2017: 50.4%).
SEE TABLE 94 Gross margin will benefit from the positive effects of a more favorable pricing, channel and regional mix. These improvements will be partly offset by the negative impact from unfavorable currency movements as well as higher labor expenditures in our sourcing countries and higher commodity prices.
2018 Outlook 94
Currency-neutral sales development (in %):adidas to increase at a rate of around 10%
Western Europe 1 mid-single-digit increaseNorth America 1 double-digit increaseAsia/Pacific 1 double-digit increaseRussia/CIS 1 around prior year levelLatin America 1 mid-single-digit increaseEmerging Markets 1 low-single-digit increase
Gross margin to increase up to 0.3pp to a level of up to 50.7%Other operating expenses in % of sales below prior year levelOperating profit to increase at a rate between 9% and 13%Operating margin to increase between 0.5 and 0.7pp to a level between 10.3% and 10.5%Net income from continuing operations 2 to increase at a rate between 13% and 17% to a level between € 1.615 billion and € 1.675 billion Basic earnings per share from continuing operations 2 to increase at a rate between 12% and 16%Average operating working capital in % of sales around prior year levelCapital expenditure to increase to a level of around € 900 million
1 Combined sales of the adidas and Reebok brands.2 2017 excluding negative one-time tax impact of € 76 million.
ADID
AS
ANN
UAL
REPO
RT 2
017
1291 TO OUR SHAREHOLDERS 2 GROUP MANAGEMENT REPORT –
OUR COMPANY3 GROUP MANAGEMENT REPORT –
FINANCIAL REVIEW4 CONSOLIDATED FINANCIAL
STATEMENTS5 ADDITIONAL INFORMATION
SUBSEQUENT EVENTS AND OUTLOOK

OPERATING MARGIN TO EXPAND TO A LEVEL BETWEEN 10.3% AND 10.5%In 2018, other operating expenses as a percentage of sales are expected to be below the prior year level of 41.9%. This, together with continued top-line growth and the projected gross margin improvement, is expected to drive an increase in operating profit of between 9% and 13%. Consequently, we expect the operating margin to increase between 0.5 and 0.7 percentage points to a level between 10.3% and 10.5% compared to the prior year level of 9.8%. SEE TABLE 94
NET INCOME FROM CONTINUING OPERATIONS TO INCREASE BETWEEN 13% AND 17%Net income from continuing operations is projected to increase to a level between € 1.615 billion and € 1.675 billion. This development reflects an increase of between 13% and 17% compared to the prior year level of € 1.430 billion, excluding the negative one-time tax impact recorded in 2017. Basic earnings per share from continuing operations are expected to increase at a rate between 12% and 16% compared to the prior year level of € 7.05, excluding the negative one-time tax impact in 2017. SEE TABLE 94 Net financial expenses are forecast to decrease in 2018. The tax rate is projected to be below the prior year level of 29.3%, excluding the negative one-time tax impact recorded in 2017.
AVERAGE OPERATING WORKING CAPITAL AS A PERCENTAGE OF SALES TO BE AROUND PRIOR YEAR LEVELIn 2018, average operating working capital as a percentage of sales is projected to be around the prior year level of 20.4%.
CAPITAL EXPENDITURE TO INCREASE TO A LEVEL OF AROUND € 900 MILLIONIn 2018, capital expenditure is expected to be around € 900 million and thus above the prior year level (2017: € 752 million). Investments will mainly focus on controlled space initiatives of the adidas and Reebok brands, the company’s IT and logistics infrastructure as well as the further development of the corporate headquarters in Herzogenaurach, Germany.
MANAGEMENT TO PROPOSE DIVIDEND OF € 2.60As a result of the strong operational and financial performance in 2017, our strong financial position as well as Management’s confidence in our short- and long-term growth aspirations, the adidas AG Executive and Supervisory Boards will recommend paying a dividend of € 2.60 per dividend-entitled share for 2017 (2016: € 2.00) to shareholders at the Annual General Meeting (AGM) on May 9, 2018. This represents a payout ratio of 37.1% (2016: 37.4%) based on the company's net income from continuing operations excluding the negative one-time tax impact in 2017. This is consistent with the prior year's payout ratio and in line with our long-term policy to distribute between 30% and 50% of net income from continuing operations to shareholders. SEE OUR SHARE. P, 57
ADID
AS
ANN
UAL
REPO
RT 2
017
1301 TO OUR SHAREHOLDERS 2 GROUP MANAGEMENT REPORT –
OUR COMPANY3 GROUP MANAGEMENT REPORT –
FINANCIAL REVIEW4 CONSOLIDATED FINANCIAL
STATEMENTS5 ADDITIONAL INFORMATION
SUBSEQUENT EVENTS AND OUTLOOK
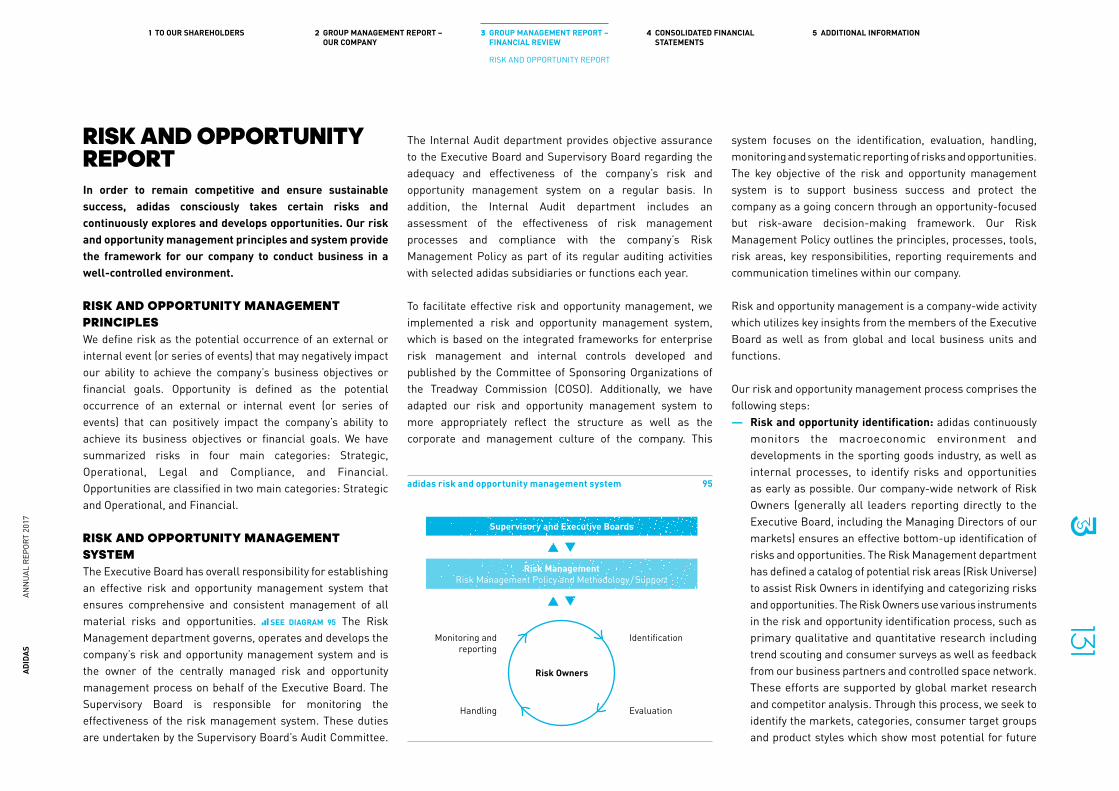
RISK AND OPPORTUNITY REPORTIn order to remain competitive and ensure sustainable success, adidas consciously takes certain risks and continuously explores and develops opportunities. Our risk and opportunity management principles and system provide the framework for our company to conduct business in a well-controlled environment.
RISK AND OPPORTUNITY MANAGEMENT PRINCIPLESWe define risk as the potential occurrence of an external or internal event (or series of events) that may negatively impact our ability to achieve the company’s business objectives or financial goals. Opportunity is defined as the potential occurrence of an external or internal event (or series of events) that can positively impact the company’s ability to achieve its business objectives or financial goals. We have summarized risks in four main categories: Strategic, Operational, Legal and Compliance, and Financial. Opportunities are classified in two main categories: Strategic and Operational, and Financial.
RISK AND OPPORTUNITY MANAGEMENT SYSTEMThe Executive Board has overall responsibility for establishing an effective risk and opportunity management system that ensures comprehensive and consistent management of all material risks and opportunities. SEE DIAGRAM 95 The Risk Management department governs, operates and develops the company’s risk and opportunity management system and is the owner of the centrally managed risk and opportunity management process on behalf of the Executive Board. The Supervisory Board is responsible for monitoring the effectiveness of the risk management system. These duties are undertaken by the Supervisory Board’s Audit Committee.
The Internal Audit department provides objective assurance to the Executive Board and Supervisory Board regarding the adequacy and effectiveness of the company’s risk and opportunity management system on a regular basis. In addition, the Internal Audit department includes an assessment of the effectiveness of risk management processes and compliance with the company’s Risk Management Policy as part of its regular auditing activities with selected adidas subsidiaries or functions each year.
To facilitate effective risk and opportunity management, we implemented a risk and opportunity management system, which is based on the integrated frameworks for enterprise risk management and internal controls developed and published by the Committee of Sponsoring Organizations of the Treadway Commission (COSO). Additionally, we have adapted our risk and opportunity management system to more appropriately reflect the structure as well as the corporate and management culture of the company. This
system focuses on the identification, evaluation, handling, monitoring and systematic reporting of risks and opportunities. The key objective of the risk and opportunity management system is to support business success and protect the company as a going concern through an opportunity-focused but risk-aware decision-making framework. Our Risk Management Policy outlines the principles, processes, tools, risk areas, key responsibilities, reporting requirements and communication timelines within our company.
Risk and opportunity management is a company-wide activity which utilizes key insights from the members of the Executive Board as well as from global and local business units and functions.
Our risk and opportunity management process comprises the following steps:
— Risk and opportunity identification: adidas continuously monitors the macroeconomic environment and developments in the sporting goods industry, as well as internal processes, to identify risks and opportunities as early as possible. Our company-wide network of Risk Owners (generally all leaders reporting directly to the Executive Board, including the Managing Directors of our markets) ensures an effective bottom-up identification of risks and opportunities. The Risk Management department has defined a catalog of potential risk areas (Risk Universe) to assist Risk Owners in identifying and categorizing risks and opportunities. The Risk Owners use various instruments in the risk and opportunity identification process, such as primary qualitative and quantitative research including trend scouting and consumer surveys as well as feedback from our business partners and controlled space network. These efforts are supported by global market research and competitor analysis. Through this process, we seek to identify the markets, categories, consumer target groups and product styles which show most potential for future
adidas risk and opportunity management system 95
Supervisory and Executive Boards
Risk ManagementRisk Management Policy and Methodology / Support
Monitoring andreporting
Handling
Identification
Risk Owners
Evaluation
ADID
AS
ANN
UAL
REPO
RT 2
017
1311 TO OUR SHAREHOLDERS 2 GROUP MANAGEMENT REPORT –
OUR COMPANY3 GROUP MANAGEMENT REPORT –
FINANCIAL REVIEW4 CONSOLIDATED FINANCIAL
STATEMENTS5 ADDITIONAL INFORMATION
RISK AND OPPORTUNITY REPORT

growth at a local and global level. Equally, our analysis focuses on those areas that are at risk of saturation or exposed to increased competition or changing consumer tastes. However, our risk and opportunity identification process is not only limited to external risk factors or opportunities; it also includes an internal perspective that considers processes, projects, human resources and compliance aspects.
— Risk and opportunity evaluation: We evaluate identified risks and opportunities individually according to a systematic evaluation methodology, which allows adequate prioritization as well as allocation of resources. Risk and opportunity evaluation is also part of the Risk Owners’ responsibility. The Risk Management department supports and guides the Risk Owners in the evaluation process.
According to our methodology, risks and opportunities are evaluated by looking at two dimensions: the potential impact and the likelihood that this impact materializes. Based on this evaluation, we classify risks and opportunities into five categories: marginal, minor, moderate, significant and major.
The potential impact is evaluated using five categories: very low, low, medium, high and very high. These categories represent quantitative or equivalent qualitative measurements. The quantitative measure ments are based on the potential financial effect on the relevant income statement metrics (operating profit, financial result or tax expenses). Qualitative measure ments used are, for example, the degree of media exposure or damage to people’s health and safety. Likelihood represents the possibility that a given risk or opportunity may materialize with the specific impact. The likelihood of individual risks and opportunities is evaluated on a percentage scale divided into five categories: unlikely, possible, likely, very likely and almost certain. SEE DIAGRAM 96
When evaluating risks and opportunities, we also consider the earliest time period when the company’s target achievement may be impacted, in order to provide a broad perspective and ensure early identification and mitigation. Short-term risks and opportunities may affect the achievement of the company’s objectives already in the current financial year, mid-term risks and opportunities would impact the company’s target achievement in the next financial year, while long-term risks and opportunities
might only have an effect on the achievement of the company’s objectives after the next financial year.
We consider both gross and net risks in our risk assessments. While the gross risk reflects the inherent (‘worst-case’) risk before any mitigating action, the net risk reflects the residual (‘expected’) risk after all mitigating action. On the one hand, this approach allows for a good understanding of the impact of mitigating
Risk evaluation categories 96
Like
lihoo
d
Almost certain >85%
Very likely 50% – 85%
Likely 30% – 50%
Possible 15% – 30%
Unlikely <15%
Very low Low Medium High Very high
Financial equivalent 1
≤ € 5 million € 5 million – € 20 million
€ 20 million – € 50 million
€ 50 million – € 100 million
≥ € 100 million
Qualitative equivalent
Almost no media coverage
Minor injuries to employees or third parties such as consumers, customers, vendors, athletes that do not require medical treatment.
Limited local media coverage
Minor injuries to employees or third parties such as consumers, customers, vendors, athletes that require medical treatment.
Local and limited national media coverage
Injuries to employees or third parties such as consumers, customers, vendors, athletes that lead to hospitalization.
National and limited international media coverage
Serious, life- changing injuries to employees or third parties such as consumers, customers, vendors, athletes.
Extensive inter-national media coverage
Fatalities of employees or third parties such as consumers, customers, vendors, athletes.
Potential impact
Risk classification: Marginal Minor Moderate Significant Major
1 Based on operating profit, financial result or tax expenses.
Material Risks
ADID
AS
ANN
UAL
REPO
RT 2
017
1321 TO OUR SHAREHOLDERS 2 GROUP MANAGEMENT REPORT –
OUR COMPANY3 GROUP MANAGEMENT REPORT –
FINANCIAL REVIEW4 CONSOLIDATED FINANCIAL
STATEMENTS5 ADDITIONAL INFORMATION
RISK AND OPPORTUNITY REPORT
action taken; on the other hand, it provides the basis for scenario analysis. Our assessment of risks presented in this report only reflects the net risk perspective. We measure the actual financial impact of the most relevant risks that materialized against the original assessment on a yearly basis. In this way, we ensure continuous monitoring of the accuracy of risk evaluations across the company, which enables us to continuously improve evaluation methodology based on our findings.
In assessing the potential effect from opportunities, each opportunity is appraised with respect to viability, commerciality and potential risks. This approach is applied to longer-term strategic prospects but also to shorter-term tactical and opportunistic initiatives at the corporate level as well as at the market and brand level. In contrast to the risk evaluation, only the net perspective exists for assessing opportunities.
— Risk and opportunity handling: Risks and opportunities are treated in accordance with the company’s risk and opportunity management principles as described in the Risk Management Policy. Risk Owners are in charge of developing and implementing appropriate risk-mitigating action and exploiting opportunities within their area of responsibility. In addition, the Risk Owners need to determine a general risk-handling strategy for the identified risks, which is either risk avoidance, risk reduction with the objective to minimize impact and/or likelihood, risk transfer to a third party or risk acceptance. The decision on the implementation of the respective risk-handling strategy also takes into account the costs in relation to the effectiveness of any planned mitigating action if applicable. The Risk Management department works closely with the Risk Owners to monitor the continuous progress of planned mitigating action and assess the viability of already implemented mitigating action.
— Risk and opportunity monitoring and reporting: Our risk and opportunity management system aims to increase the transparency of risks and opportunities. As both risks and opportunities are subject to constant change, Risk Owners not only monitor developments but also the adequacy and effectiveness of the current risk-handling strategy on an ongoing basis.
Regular risk reporting takes place half-yearly and consists of a five-step reporting stream that is supported and facilitated by a globally used company-wide IT solution:
1. Risk Owners are required to report to Risk Management risks that have a possible gross impact of € 10 million and above or a net impact of € 1 million and above, both regardless of the likelihood of materializing. Risk Owners are also required to report all opportunities that have an impact of € 1 million and above.
2. Risk Management consolidates and aggregates the reported risks and opportunities and provides a consolidated report based on the Risk Owners’ input to each member of the Executive Board concerning his or her individual area of responsibility. Each report specifically highlights substantial individual risks and opportunities. Each member of the Executive Board reviews the reported risks and opportunities of his or her individual area of responsibility, adding his or her own assessment of risks and opportunities if necessary.
3. Risk Management provides a consolidated report to all members of the Executive Board that includes both the assessment of each member of the Executive Board and the material risks and opportunities reported by Risk Owners. The Executive Board reviews the report, jointly agrees on a final company assessment of risks
and opportunities and decides if Risk Owners are required to take further action.
4. Based on the Executive Board’s decision, Risk Management creates the final risk and opportunity report that is also shared with a selected group of leaders across the company.
5. The Executive Board in collaboration with Risk Management presents the final risk and opportunity assessment results to the Audit Committee of the Supervisory Board.
Material changes in previously reported risks and opportunities and/or newly identified risks and opportunities that are classified as moderate, significant or major as well as any issues identified which, due to their material nature, require immediate reporting, are also reported outside the regular half-yearly reporting stream on an ad hoc basis to the Risk Management department and the Executive Board.
COMPLIANCE MANAGEMENT SYSTEM (ADIDAS FAIR PLAY COMPLIANCE FRAMEWORK)
We consider compliance with the law as well as with external and internal regulations to be imperative. Every employee is required to act ethically and in compliance with the law as well as with external and internal regulations while executing the company’s business. Violations must be avoided under all circumstances. As a company with worldwide operations and more than 56,000 employees, however, we realize that it will never be possible to exclude compliance violations with absolute certainty.
The adidas Fair Play Compliance Framework and our risk and opportunity management system are closely aligned and both
ADID
AS
ANN
UAL
REPO
RT 2
017
1331 TO OUR SHAREHOLDERS 2 GROUP MANAGEMENT REPORT –
OUR COMPANY3 GROUP MANAGEMENT REPORT –
FINANCIAL REVIEW4 CONSOLIDATED FINANCIAL
STATEMENTS5 ADDITIONAL INFORMATION
RISK AND OPPORTUNITY REPORT
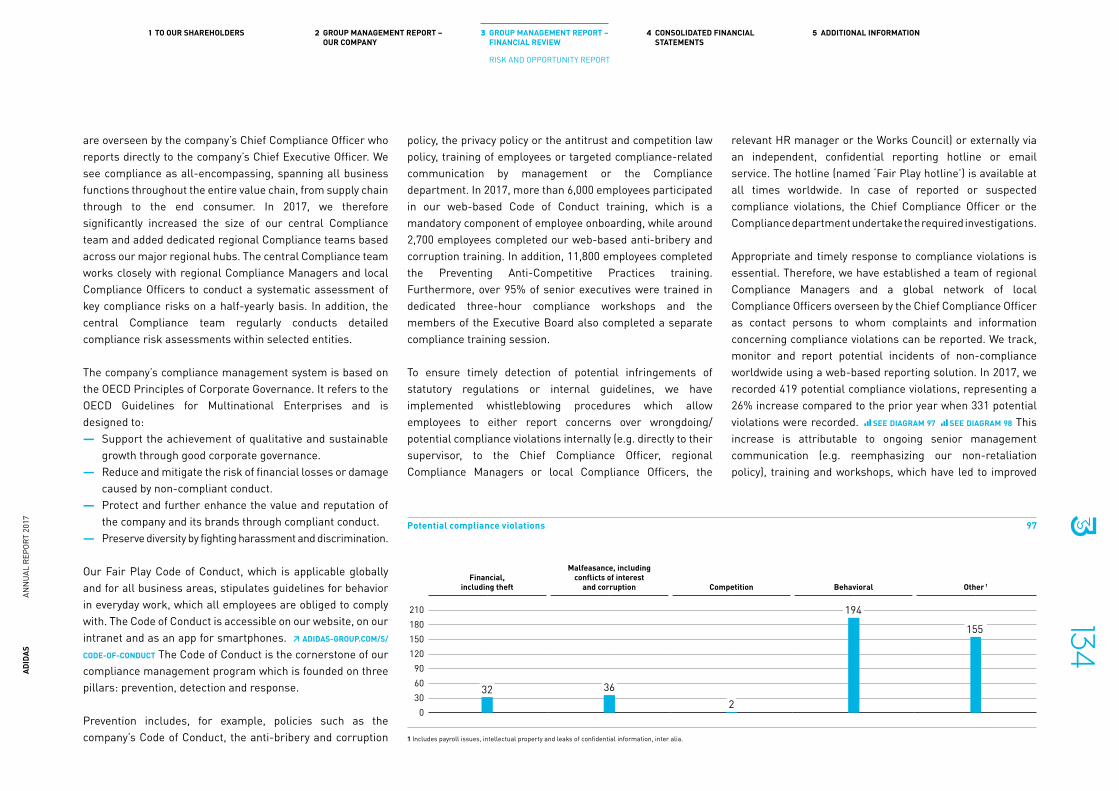
are overseen by the company’s Chief Compliance Officer who reports directly to the company’s Chief Executive Officer. We see compliance as all-encompassing, spanning all business functions throughout the entire value chain, from supply chain through to the end consumer. In 2017, we therefore significantly increased the size of our central Compliance team and added dedicated regional Compliance teams based across our major regional hubs. The central Compliance team works closely with regional Compliance Managers and local Compliance Officers to conduct a systematic assessment of key compliance risks on a half-yearly basis. In addition, the central Compliance team regularly conducts detailed compliance risk assessments within selected entities.
The company’s compliance management system is based on the OECD Principles of Corporate Governance. It refers to the OECD Guidelines for Multinational Enterprises and is designed to:
— Support the achievement of qualitative and sustainable growth through good corporate governance.
— Reduce and mitigate the risk of financial losses or damage caused by non-compliant conduct.
— Protect and further enhance the value and reputation of the company and its brands through compliant conduct.
— Preserve diversity by fighting harassment and discrimination.
Our Fair Play Code of Conduct, which is applicable globally and for all business areas, stipulates guidelines for behavior in everyday work, which all employees are obliged to comply with. The Code of Conduct is accessible on our website, on our intranet and as an app for smartphones. ↗ ADIDAS-GROUP.COM/S/
CODE-OF-CONDUCT The Code of Conduct is the cornerstone of our compliance management program which is founded on three pillars: prevention, detection and response.
Prevention includes, for example, policies such as the company’s Code of Conduct, the anti-bribery and corruption
policy, the privacy policy or the antitrust and competition law policy, training of employees or targeted compliance-related communication by management or the Compliance department. In 2017, more than 6,000 employees participated in our web-based Code of Conduct training, which is a mandatory component of employee onboarding, while around 2,700 employees completed our web-based anti-bribery and corruption training. In addition, 11,800 employees completed the Preventing Anti-Competitive Practices training. Furthermore, over 95% of senior executives were trained in dedicated three-hour compliance workshops and the members of the Executive Board also completed a separate compliance training session.
To ensure timely detection of potential infringements of statutory regulations or internal guidelines, we have implemented whistleblowing procedures which allow employees to either report concerns over wrongdoing/potential compliance violations internally (e.g. directly to their supervisor, to the Chief Compliance Officer, regional Compliance Managers or local Compliance Officers, the
relevant HR manager or the Works Council) or externally via an independent, confidential reporting hotline or email service. The hotline (named ‘Fair Play hotline’) is available at all times worldwide. In case of reported or suspected compliance violations, the Chief Compliance Officer or the Compliance department undertake the required investigations.
Appropriate and timely response to compliance violations is essential. Therefore, we have established a team of regional Compliance Managers and a global network of local Compliance Officers overseen by the Chief Compliance Officer as contact persons to whom complaints and information concerning compliance violations can be reported. We track, monitor and report potential incidents of non-compliance worldwide using a web-based reporting solution. In 2017, we recorded 419 potential compliance violations, representing a 26% increase compared to the prior year when 331 potential violations were recorded. SEE DIAGRAM 97 SEE DIAGRAM 98 This increase is attributable to ongoing senior management communication (e.g. reemphasizing our non-retaliation policy), training and workshops, which have led to improved
Potential compliance violations 97
Financial,including theft
Malfeasance, includingconflicts of interest
and corruption Competition Behavioral Other 1
210180150120
906030
0
1 Includes payroll issues, intellectual property and leaks of confidential information, inter alia.
32 36
155
194
2
ADID
AS
ANN
UAL
REPO
RT 2
017
1341 TO OUR SHAREHOLDERS 2 GROUP MANAGEMENT REPORT –
OUR COMPANY3 GROUP MANAGEMENT REPORT –
FINANCIAL REVIEW4 CONSOLIDATED FINANCIAL
STATEMENTS5 ADDITIONAL INFORMATION
RISK AND OPPORTUNITY REPORT

employee awareness with respect to ethical conduct and our continuously improving compliance activities.
Appropriate sanction mechanisms, ranging from warnings through to termination of employment, are used to react promptly to confirmed compliance violations. Insights gained from the investigation of past violations are used to continuously improve the compliance management system.
Monthly key performance indicators, including those for participation in training and for compliance violations, are reported to the Executive Board by the Compliance department. The Chief Compliance Officer regularly reports to the Chief Executive Officer on the further development of the compliance program and on major compliance cases, which are also reported to the Audit Committee. Further, he reports to the Audit Committee at one of its meetings at least once a year concerning the contents and the further development of the compliance program.
DESCRIPTION OF THE MAIN FEATURES OF THE INTERNAL CONTROL AND RISK MANAGEMENT SYSTEM RELATING TO THE CONSOLIDATED FINANCIAL REPORTING PROCESS PURSUANT TO § 315 SECTION 4 GERMAN COMMERCIAL CODE (HANDELSGESETZBUCH – HGB)The internal control and risk management system relating to the consolidated financial reporting process of the company represents a process embedded within the company-wide corporate governance system. It aims to provide reasonable assurance regarding the reliability of the company’s external financial reporting by ensuring company-wide compliance with statutory accounting regulations, in particular the International Financial Reporting Standards (IFRS) and internal consolidated financial reporting policies (Finance Manual). We regard the internal control and risk management system as a process based on the principle of segregation of duties, encompassing various sub-processes in the areas of Accounting, Controlling, Taxes, Treasury, Planning, Reporting and Legal, focusing on the identification, assessment, treatment, monitoring and reporting of financial reporting risks. Clearly defined responsibilities are assigned to each distinct sub-process. In a first step, the internal control and risk management system serves to identify and assess as well as to limit and control risks identified in the consolidated financial reporting process which might result in our consolidated financial statements not being compliant with internal and external regulations.
Internal Control over Financial Reporting (ICoFR) serves to provide reasonable assurance regarding the reliability of financial reporting and compliance with applicable laws and regulations despite identified financial reporting risks. To monitor the effectiveness of ICoFR, the Policies and Internal Controls department and the Internal Audit department regularly review accounting-related processes. Additionally, as part of the year-end audit, the external auditor selects and
examines internal controls, including IT controls, to assess their effectiveness. The Audit Committee of the Supervisory Board also monitors the effectiveness of ICoFR. However, due to the limitations of ICoFR, even with appropriate and functional systems absolute certainty about the effectiveness of ICoFR cannot be guaranteed.
All adidas companies are required to comply with the consolidated financial reporting policies (Finance Manual), which are available to all employees involved in the financial reporting process through the company-wide intranet. We update the Finance Manual on a regular basis, dependent on regulatory changes and internal developments. Changes to the Finance Manual are promptly communicated to all adidas companies. Clear policies serve to limit employees’ scope of discretion with regard to recognition and valuation of assets and liabilities, thus reducing the risk of inconsistent accounting practices within the company. We aim to ensure compliance with the Finance Manual through continuous adherence to the four-eyes principle in accounting-related processes. In addition, each quarter, the local manager responsible for the accounting process within the respective company and the respective local Managing Director confirm adherence to the Finance Manual and to IFRS in a signed representation letter to the Accounting department.
The accounting for adidas companies is conducted either locally or by an adidas Shared Service Center. The majority of the IT Enterprise Resource Planning (ERP) systems used are based on a company-wide standardized SAP system. Some adidas companies use Navision-based ERP software. As part of an initiative aimed at harmonizing our system infrastructure (One ERP), we will also introduce an SAP-based ERP system within these adidas companies in the medium term. Following approval by the Finance Director of the respective adidas company, the local financial statements are transferred to a central consolidation system based on SAP SEM-BCS. At the
Reporting of potential compliance violations in % 98
38%Anonymous call to hotline
20%Compliance Officer
42%Named call
to hotline
ADID
AS
ANN
UAL
REPO
RT 2
017
1351 TO OUR SHAREHOLDERS 2 GROUP MANAGEMENT REPORT –
OUR COMPANY3 GROUP MANAGEMENT REPORT –
FINANCIAL REVIEW4 CONSOLIDATED FINANCIAL
STATEMENTS5 ADDITIONAL INFORMATION
RISK AND OPPORTUNITY REPORT
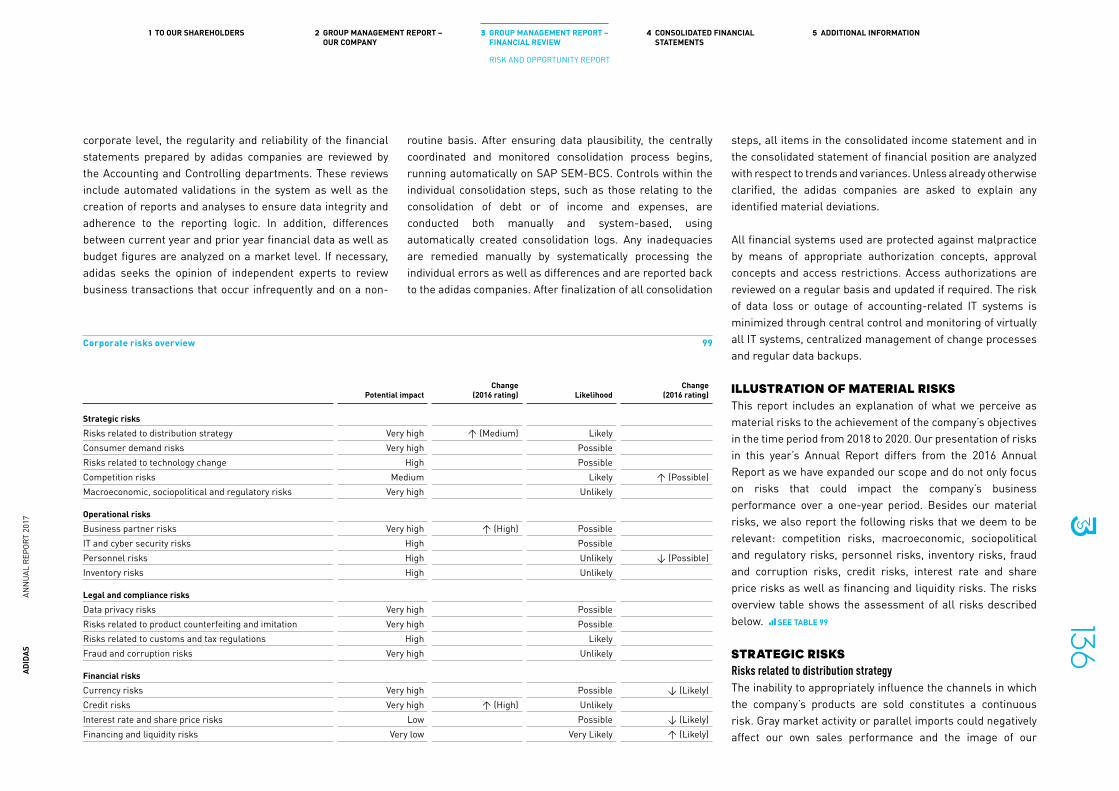
corporate level, the regularity and reliability of the financial statements prepared by adidas companies are reviewed by the Accounting and Controlling departments. These reviews include automated validations in the system as well as the creation of reports and analyses to ensure data integrity and adherence to the reporting logic. In addition, differences between current year and prior year financial data as well as budget figures are analyzed on a market level. If necessary, adidas seeks the opinion of independent experts to review business transactions that occur infrequently and on a non-
routine basis. After ensuring data plausibility, the centrally coordinated and monitored consolidation process begins, running automatically on SAP SEM-BCS. Controls within the individual consolidation steps, such as those relating to the consolidation of debt or of income and expenses, are conducted both manually and system-based, using automatically created consolidation logs. Any inadequacies are remedied manually by systematically processing the individual errors as well as differences and are reported back to the adidas companies. After finalization of all consolidation
steps, all items in the consolidated income statement and in the consolidated statement of financial position are analyzed with respect to trends and variances. Unless already otherwise clarified, the adidas companies are asked to explain any identified material deviations.
All financial systems used are protected against malpractice by means of appropriate authorization concepts, approval concepts and access restrictions. Access authorizations are reviewed on a regular basis and updated if required. The risk of data loss or outage of accounting-related IT systems is minimized through central control and monitoring of virtually all IT systems, centralized management of change processes and regular data backups.
ILLUSTRATION OF MATERIAL RISKSThis report includes an explanation of what we perceive as material risks to the achievement of the company’s objectives in the time period from 2018 to 2020. Our presentation of risks in this year’s Annual Report differs from the 2016 Annual Report as we have expanded our scope and do not only focus on risks that could impact the company’s business performance over a one-year period. Besides our material risks, we also report the following risks that we deem to be relevant: competition risks, macroeconomic, sociopolitical and regulatory risks, personnel risks, inventory risks, fraud and corruption risks, credit risks, interest rate and share price risks as well as financing and liquidity risks. The risks overview table shows the assessment of all risks described below. SEE TABLE 99
STRATEGIC RISKSRisks related to distribution strategyThe inability to appropriately influence the channels in which the company’s products are sold constitutes a continuous risk. Gray market activity or parallel imports could negatively affect our own sales performance and the image of our
Corporate risks overview 99
Potential impactChange
(2016 rating) LikelihoodChange
(2016 rating)
Strategic risksRisks related to distribution strategy Very high ↑ (Medium) LikelyConsumer demand risks Very high PossibleRisks related to technology change High PossibleCompetition risks Medium Likely ↑ (Possible)Macroeconomic, sociopolitical and regulatory risks Very high Unlikely
Operational risksBusiness partner risks Very high ↑ (High) PossibleIT and cyber security risks High PossiblePersonnel risks High Unlikely ↓ (Possible)Inventory risks High Unlikely
Legal and compliance risksData privacy risks Very high PossibleRisks related to product counterfeiting and imitation Very high PossibleRisks related to customs and tax regulations High LikelyFraud and corruption risks Very high Unlikely
Financial risksCurrency risks Very high Possible ↓ (Likely)Credit risks Very high ↑ (High) UnlikelyInterest rate and share price risks Low Possible ↓ (Likely)Financing and liquidity risks Very low Very Likely ↑ (Likely)
ADID
AS
ANN
UAL
REPO
RT 2
017
1361 TO OUR SHAREHOLDERS 2 GROUP MANAGEMENT REPORT –
OUR COMPANY3 GROUP MANAGEMENT REPORT –
FINANCIAL REVIEW4 CONSOLIDATED FINANCIAL
STATEMENTS5 ADDITIONAL INFORMATION
RISK AND OPPORTUNITY REPORT

brands. Furthermore, changes to segmentation, store formats and channel strategies could lead to inadequate utilization of our multiple distribution channels as well as strong retaliation from our customers and franchise partners. An unbalanced portfolio of own-retail stores (e.g. overexposure to certain markets or store formats) or inappropriate store locations may result in worse-than-expected sales development and lower profitability. Failure to recognize and respond to consolidation in the retail industry could lead to increased dependency on particular retail partners, reduced bargaining power and, consequently, margin erosion. The inability to properly adjust our distribution strategy to the continuously changing retail industry, which is experiencing increasing substitution of physical retail stores by digital commerce platforms, could result in sales and profit shortfalls.
To mitigate these risks, adidas has developed and implemented clearly defined distribution policies and procedures to avoid overdistribution of products in a particular channel and limit the exposure to gray markets. We continuously monitor our own-retail store portfolio, which helps us identify imbalances and quickly take appropriate action such as store closure or remodeling. New store openings are managed according to a standardized company-wide business plan model, taking into account our many years of own-retail experience and best practices from around the world. In addition, we conduct specific training for our sales force to appropriately manage product distribution and ensure that the right product is sold at the right point of sale to the right consumer at an appropriate price. We invest significant resources in the further expansion of our own e-commerce activities and work closely with retail partners with strong expertise in digital commerce.
Consumer demand risksSuccess in the sporting goods industry largely depends on the ability to anticipate and quickly respond to changes in
consumer demand or consumer trends. Consumer demand changes can be sudden and unexpected, particularly when it comes to fashion-related businesses. Therefore, failure to anticipate consumer demand, as well as creating and offering products that do not resonate with consumers, is a critical risk to the success of our brands. Because of average lead times of 12 to 18 months, we face a risk of short-term revenue loss in cases where we are unable to respond quickly to changes in consumer demand. Even more critical, however, is the risk of continuously overlooking new consumer trends or failing to acknowledge their potential magnitude over a sustained period of time.
To mitigate these risks, identifying and responding to shifts in consumer demand as early as possible is a key responsibility of our brand organizations and, in particular, of the respective Risk Owners. Therefore, we utilize extensive primary and secondary research tools as outlined in our risk and opportunity identification process. We continuously expand our consumer analytics efforts to read and quickly react to changes in demand or trend shifts. In addition, direct communication with consumers on social media platforms or direct touchpoints with consumers via our own e-commerce channel help us strengthen our understanding of consumer preferences and behavior and, as a result, help us to reduce our vulnerability to changes in demand. Through continuous monitoring of sell-through data and disciplined product lifecycle management, in particular for our major product franchises, we are able to better detect demand patterns and prevent overexposure.
Risks related to technology changeTechnological advancement is happening at an unprecedented pace and has profound implications for our company’s operations. Technologies such as 3D printing, augmented reality, blockchain and artificial intelligence are changing the way products and services are made, offered, experienced
and exchanged. Failure to anticipate, recognize and respond to changes in technology in a timely manner could disrupt the company’s business model, lead to a deterioration of our competitive position in the marketplace and substantially affect our ability to achieve our strategic and financial goals.
In order to mitigate this risk, we established a cross-functional digital leadership group that identifies and assesses technology trends and coordinates adoption of new technologies. Furthermore, we build partnerships with technology and business leaders around the world to stay connected to the latest advancements. For example, we have entered into a partnership with Carbon, a Silicon Valley-based digital 3D manufacturing company. SEE INNOVATION, P. 78
Competition risksStrategic alliances amongst competitors and/or retailers, the increase of retailers’ own private label businesses and intense competition for consumers and promotion partnerships between well-established industry peers and new market entrants (e.g. new brands, vertical retailers SEE GLOSSARY) pose a substantial risk to adidas. This could lead to harmful competitive behavior, such as price wars in the marketplace or bidding wars for promotion partnerships. Sustained pricing pressure in key markets could threaten the company’s financial performance and the competitiveness of our brands. Aggressive competitive practices could also drive increases in marketing costs and market share losses, thus hurting the company’s profitability and market position. World leaders in digital technologies could threaten adidas’ success in markets for sport, health and fitness apps.
To mitigate competition risks, we continuously monitor and analyze information on our competitors and markets in order to be able to anticipate unfavorable changes in the competitive environment rather than reacting to such changes. This enables us to proactively adjust our marketing and sales
ADID
AS
ANN
UAL
REPO
RT 2
017
1371 TO OUR SHAREHOLDERS 2 GROUP MANAGEMENT REPORT –
OUR COMPANY3 GROUP MANAGEMENT REPORT –
FINANCIAL REVIEW4 CONSOLIDATED FINANCIAL
STATEMENTS5 ADDITIONAL INFORMATION
RISK AND OPPORTUNITY REPORT

activities when needed. Continuous investment in research and development ensures that we remain innovative and distinct from competitors. SEE INNOVATION, P. 78 We also pursue a strategy of entering into long-term agreements with key promotion partners such as FC Bayern Munich or Lionel Messi, as well as adding new partners to refresh and diversify our portfolio, e.g. Gabriel Jesus or Victoria Beckham. In addition, our product and communication initiatives are designed to increase brand desire, drive market share growth and strengthen our brands’ market position.
Macroeconomic, sociopolitical and regulatory risksGrowth in the sporting goods industry is highly dependent on consumer spending and consumer confidence. Economic downturns and sociopolitical factors such as military conflicts, changes of government, civil unrest, nationalization or expropriation, in particular in regions where adidas is strongly represented, therefore could negatively impact the company’s business activities and top- and bottom-line performance. In addition, substantial changes in the regulatory environment (e.g. trade restrictions, economic and political sanctions) could lead to potential sales shortfalls or cost increases. For example, the ongoing negotiations between the UK and the European Union regarding the UK’s withdrawal from the European Union (‘Brexit’) could cause business and consumer uncertainty, create an additional administrative burden to adhere to changes in regulatory frameworks and also increase uncertainty concerning the future of the European Union.
To mitigate these macroeconomic, sociopolitical and regulatory risks, adidas strives to balance sales across key regions and also between developed and emerging markets. We also continuously monitor the macroeconomic, political and regulatory landscape in all our key markets to anticipate potential problem areas, so that we are able to quickly adjust our business activities accordingly upon any change in conditions. Potential adjustments may be a reallocation of
investments to alternative, more attractive markets, changes in product prices, closure of own-retail stores, more conservative product purchasing, tight working capital management and an increased focus on cost control. In addition, by building on our leading position within the sporting goods industry, we actively engage in supporting policymakers and regulators in their efforts to liberalize global trade and curtail trade barriers and also in order to proactively adapt to significant changes in the regulatory environment.
OPERATIONAL RISKSBusiness partner risksadidas interacts and enters into partnerships with various third parties, such as promotion partners, retail partners or suppliers. As a result, the company is exposed to a multitude of business partner risks.
Injuries to individual athletes or poor on-field performance on the part of sponsored teams or athletes could reduce their consumer appeal and eventually result in lower sales and diminished attractiveness of our brands. Failure to cement and maintain strong relationships with retailers could have substantial negative effects on our wholesale activities and thus the company’s business performance. Losing important customers in key markets due to sub-par relationship management would result in significant sales shortfalls. We work with strategic partners in various areas of our business (e.g. product creation, manufacturing, research and development) or distributors in a few selected markets whose approach might differ from our own business practices and standards, which could also negatively impact the company’s business performance and reputation. Similarly, failure to maintain strong relationships with suppliers or service providers could negatively impact the company’s sales and profitability. Risks may also arise from a dependence on particular suppliers, customers or service providers.
Overreliance on a supplier for a substantial portion of the company’s product volume, or overdependence on a particular customer, increases the company’s vulnerability to delivery and sales shortfalls and could lead to significant margin pressure. Business partner default (including insolvency) or other disruptive events such as strikes may negatively affect the company’s business activities and result in additional costs and liabilities as well as lower sales for the company. Unethical business practices or improper behavior on the part of business partners could have a negative spill-over effect on the company’s reputation, lead to higher costs or liabilities and disrupt business activities.
To mitigate business partner risks, adidas has implemented various measures. For example, we generally include clauses in contractual agreements with athletes, clubs and federations or other promotion partners that allow us to suspend or even terminate our partnership in case of improper or unethical conduct. In addition, we work with a broad portfolio of promotion partners, including individual athletes, club teams and federations or associations in numerous sports in order to reduce the dependence on the success and popularity of a few individual partners. To ensure strong relationships with retailers, adidas is committed to delivering outstanding customer service and providing our retail partners with the support and tools required to establish and maintain a mutually successful business relationship. Customer relationship management is not only a key activity for our sales force but also of utmost importance to our company’s top executives and second-line management. We also utilize a broad distribution strategy which includes further expansion of our direct-to-consumer business to reduce the risk of overreliance on particular key customers. Specifically, no single customer accounted for more than 5% of the company’s sales in 2017. To reduce the risk of business interruption in the supply chain, we work with suppliers who demonstrate reliability, quality and innovation. Furthermore, in order to
ADID
AS
ANN
UAL
REPO
RT 2
017
1381 TO OUR SHAREHOLDERS 2 GROUP MANAGEMENT REPORT –
OUR COMPANY3 GROUP MANAGEMENT REPORT –
FINANCIAL REVIEW4 CONSOLIDATED FINANCIAL
STATEMENTS5 ADDITIONAL INFORMATION
RISK AND OPPORTUNITY REPORT

minimize any potential negative consequences such as a violation of our Workplace Standards by our suppliers, we enforce strict control and inspection procedures at our suppliers and also demand adherence to social and environmental standards throughout our supply chain. SEE
SUSTAINABILITY, P. 88 In addition, we have selectively bought insurance coverage for the risk of business interruptions caused by physical damage to suppliers’ premises. To reduce dependency on any particular supplier, the company follows a strategy of diversification. In this context, adidas works with a broad network of suppliers and, for the vast majority of its products, does not have a single-sourcing model SEE GLOSSARY.
IT and cyber security risksTheft or leakage of confidential and sensitive information or data (e.g. product data, employee data, consumer data) could lead to reputational damage, penalties and higher costs. Data leakage could trigger in-depth forensic investigation resulting in temporary unavailability of key systems and business interruption. Key business processes, including product marketing, order management, warehouse management, invoice processing, customer support and financial reporting, are all dependent on IT systems. A significant systems outage or application failure in our infrastructure or that of our business partners could therefore result in considerable disruptions to our business. Virus or malware attacks could also lead to systems disruption, result in the loss of business-critical and/or confidential information or harm data integrity.
To mitigate these risks, our IT organization proactively engages in system preventive maintenance, service continuity planning and adherence to applicable IT policies. Data security is managed by restricting user access based on job description and adhering to data protection regulations. We conduct security reviews of key systems and applications on a regular basis and have established monitoring and alert systems to detect and properly tackle IT security incidents. Additional
security measures such as anti-virus software and firewalls are designed to further protect our systems and critical information. We perform multiple backups at alternating data center locations for the company’s core ERP system on a daily basis. In addition, for the ERP system, our contingency solution allows us to quickly switch to a remote site if necessary – without any loss of data. System security, controls and reliability are regularly reviewed and tested by the Internal Audit department. To increase awareness amongst employees with regard to information security and data privacy, we conduct various training programs and regular information campaigns.
Personnel risksAchieving the company’s strategic and financial objectives is highly dependent on our employees and their talents. In this respect, strong leadership and a performance-enhancing culture are critical to the company’s success. Therefore, inconsistent or ineffective leadership as well as the failure to install and maintain a performance-oriented culture and ensure strong employee engagement amongst our workforce could also substantially impede our ability to achieve our goals. An ineffective, unbalanced allocation of resources to business activities could cause operational inefficiencies and result in lower employee engagement. In addition, global competition for highly qualified personnel remains fierce. As a result, the loss of key personnel in strategic positions and the inability to identify, recruit and retain sufficient numbers of highly qualified and skilled people who best meet the specific needs of our company pose substantial risks to our business performance. Unattractive or non-competitive management and employee remuneration may exacerbate these risks. In addition, a lack of sufficient training measures and inadequate documentation of critical know-how might dilute or lead to a loss of key capabilities.
Our People Strategy, aimed at fostering a corporate culture of confidence, creativity and collaboration that is needed to be
successful, is an essential part of our strategic business plan ‘Creating the New’ and is designed to reduce these risks.
SEE PEOPLE AND CULTURE, P. 81 To optimize staffing levels and resource allocation (i.e. having the right people with the right skillsets in the right roles), we have launched a strategic workforce management initiative. We continuously invest in improving employer branding activities to be the ‘employer of choice’ in our industry and as a result attract and retain the right talent. We have also established a global recruiting organization to enhance our internal and external recruiting services and capabilities. In addition, we strengthen employee retention by providing employees with development and career opportunities (e.g. via our Talent Carousel program) and we focus on promoting from within the organization rather than recruiting externally. We also have attractive reward and incentive schemes in place, designed to further support long-term employee commitment.
Inventory risksAs we place initial production orders up to nine months in advance of delivery, adidas is exposed to inventory risks relating to misjudging consumer demand at the time of production planning. Overestimating demand could result in inappropriate capacity utilization at our suppliers’ factories, lead to overproduction and cause excess inventory for the company as well as in the marketplace. This can have negative implications for our financial performance, including product returns, inventory obsolescence and higher levels of clearance activity as well as reduced liquidity due to higher operating working capital requirements. Similarly, underestimating demand can lead to product shortfalls at the point of sale. In this situation, adidas faces the risk of missed sales opportunities and/or customer and consumer disappointment, which could lead to a reduction in brand loyalty and hurt our reputation. In addition, the company faces potential profitability impacts from additional costs such as airfreight in efforts to speed up replenishment.
ADID
AS
ANN
UAL
REPO
RT 2
017
1391 TO OUR SHAREHOLDERS 2 GROUP MANAGEMENT REPORT –
OUR COMPANY3 GROUP MANAGEMENT REPORT –
FINANCIAL REVIEW4 CONSOLIDATED FINANCIAL
STATEMENTS5 ADDITIONAL INFORMATION
RISK AND OPPORTUNITY REPORT

In order to mitigate these risks, we actively manage inventory levels, for example by continuous monitoring of stock levels as well as centralizing stock holding and clearance activities. We also continuously strive to improve our forecasting and material planning processes. SEE INTERNAL MANAGEMENT SYSTEM, P. 102 In addition, our Global Operations function is continuously improving the agility and flexibility of our planning environment in order to shorten lead times and ensure availability of products while trying to avoid excess inventories. SEE GLOBAL
OPERATIONS, P. 74 In this context, the company’s strategic priority ‘Speed’ is an important driver, leveraging market and sell-through data in new ways. This, in turn, enables us to respond quickly to consumer demand and to deliver concepts that are fresh and desirable and made available when and where they are wanted by the consumer. SEE CORPORATE STRATEGY, P. 62
LEGAL AND COMPLIANCE RISKSData privacy risksAs a globally operating company, adidas is subject to various laws and regulations concerning data protection and privacy. Non-compliance with such laws and regulations could lead to substantial penalties and fines. For example, non-compliance with the EU General Data Protection Regulation, which will be in force as of May 2018, may result in fines of up to 4% of annual net sales. In addition, publication of failure to comply with data protection and privacy regulations could cause significant reputational damage and result in a loss of consumer trust in our brands. As it is critical for the company’s future success to constantly analyze and effectively utilize data, these risks have become increasingly important for the company.
To mitigate these risks, we have established a global data privacy policy that applies to all adidas businesses worldwide. In addition, our data protection officer and the data protection department are continuously monitoring the adherence to data privacy standards and provide training and guidance. We are also working with external partners and law firms to
ensure we understand legal requirements across the globe and take appropriate action to remain compliant.
Risks related to product counterfeiting and imitationAs popular consumer brands which largely rely on technological and design innovation, our brands are frequent targets for counterfeiting and imitation.
To reduce the loss of sales and the potential damage to brand reputation resulting from counterfeit products, the company makes use of extensive legal protection (generally through registration of trademarks) and works closely with law enforcement authorities, investigators and external legal counsel. Although we have stepped up measures such as product security labeling with our authorized suppliers, the development of these measures remains a key priority going forward.
Risks related to customs and tax regulationsNumerous laws and regulations regarding customs and taxes as well as changes in such laws and regulations affect the company’s business practices worldwide. Non-compliance with regulations concerning product imports (including calculation of customs values), intercompany transactions or income taxes could lead to substantial financial penalties and additional costs as well as negative media coverage and therefore reputational damage, for example in case of understatements or underpayments of corporate income taxes or customs duties. Changes in regulations regarding customs and taxes may also have a substantial impact on the company’s sourcing costs or income taxes. Therefore, we also create provisions in accordance with the relevant accounting regulations to account for potential disputes with customs or tax authorities.
To proactively manage such risks, we constantly seek expert advice from specialized law and tax advisory firms. We closely
monitor changes in legislation in order to properly adopt regulatory requirements regarding customs and taxes. In addition, our internal legal, customs or tax departments advise our operational management teams to ensure appropriate and compliant business practices. Furthermore, we work closely with customs authorities and governments worldwide to make sure we adhere to customs and import regulations and obtain the required clearance of products to fulfill sales demand.
Fraud and corruption risksWe face the risk that members of the Executive Board as well as our employees breach rules and standards that guide appropriate and responsible business behavior. This includes the risks of fraud, financial misstatements or manipulation, bribery and corruption.
Our Fair Play Compliance Framework helps us manage these risks in a proactive way and enables us to prevent, detect and adequately respond in case of fraudulent or corrupt behavior. Our Global Policy Manual provides a framework for basic work procedures and processes and our Fair Play Code of Conduct stipulates that every employee and our business partners shall act ethically in compliance with the laws and regulations of the legal systems where they conduct company business. In addition, our regional compliance managers and local compliance officers guide and advise our operating managers regarding fraud and corruption topics. Furthermore, we utilize controls such as segregation of duties in IT systems and data analytics technology to prevent or detect fraudulent activities.
FINANCIAL RISKSCurrency risksCurrency risks for adidas are a direct result of multi-currency cash flows within the company. Furthermore, translation impacts from the conversion of non-euro-denominated
ADID
AS
ANN
UAL
REPO
RT 2
017
1401 TO OUR SHAREHOLDERS 2 GROUP MANAGEMENT REPORT –
OUR COMPANY3 GROUP MANAGEMENT REPORT –
FINANCIAL REVIEW4 CONSOLIDATED FINANCIAL
STATEMENTS5 ADDITIONAL INFORMATION
RISK AND OPPORTUNITY REPORT

results into the company’s functional currency, the euro, might lead to a material negative impact on our company’s financial performance. The biggest single driver behind this risk results from the mismatch of the currencies required for sourcing our products versus the denominations of our sales. The vast majority of our sourcing expenses are in US dollars, while sales are denominated in other currencies to a large extent – most notably the euro. Exposures are presented in the respective table. SEE TABLE 100 The exposure from firm commitments and forecast transactions was calculated on a one-year basis.
In line with IFRS 7 requirements, we have calculated the impact on net income and shareholders’ equity based on changes in our most important currency exchange rates. The calculated impacts mainly result from changes in the fair value of our hedging instruments. The analysis does not include effects that arise from the translation of our foreign entities’ financial statements into the company’s reporting currency, the euro. The sensitivity analysis is based on the net balance sheet exposure, including intercompany balances from monetary assets and liabilities denominated in foreign currencies. Moreover, all outstanding currency derivatives were re-evaluated using hypothetical foreign exchange rates to determine the effects on net income and equity. The analysis was performed on the same basis for both 2016 and 2017.
Based on this analysis, a 10% increase in the euro versus the US dollar at December 31, 2017 would have led to a € 7 million increase in net income. SEE TABLE 101 The more negative market values of the US dollar hedges would have decreased shareholders’ equity by € 255 million. A 10% weaker euro at December 31, 2017 would have led to a € 14 million decrease in net income. Shareholders’ equity would have increased by € 334 million. The impacts of fluctuations of the US dollar against the Chinese renminbi and of the euro against the British pound and the Japanese yen on net income and
shareholders’ equity are also included in accordance with IFRS requirements.
However, many other financial and operational variables that could potentially reduce the effect of currency fluctuations are excluded from the analysis. For instance:
— Interest rates, commodity prices and all other exchange rates are assumed constant.
— Exchange rates are assumed at a year-end value instead of the more relevant sales-weighted average figure, which we utilize internally to better reflect both the seasonality of our business and intra-year currency fluctuations.
— The underlying forecast cash flow exposure (which the hedge instrument mainly relates to) is not required to be revalued in this analysis.
— Operational issues, such as potential discounts for key accounts, which have high transparency regarding the
impacts of currency on our sourcing activities (due to their own private label sourcing efforts), are also excluded from this analysis.
Utilizing a centralized currency risk management system, we hedge currency needs for projected sourcing requirements on a rolling basis up to 24 months in advance. In rare instances, hedges are contracted beyond the 24-month horizon. SEE
TREASURY, P. 115 Our goal is to have the vast majority of our hedging volume secured six months prior to the start of a given season. The company also largely hedges balance sheet risks. Due to our strong global position, we are able to partly minimize currency risk by utilizing natural hedges. Our gross US dollar cash flow exposure calculated for 2018 was around € 6.0 billion at year-end 2017, which we hedged using forward exchange contracts, currency options and currency swaps.
SEE TABLE 100 Our Treasury Policy allows us to utilize hedging
Exposure to foreign exchange risk based on notional amounts € in millions 100
USD GBP JPY CNY
As at December 31, 2017Exposure from firm commitments and forecast transactions (5,824) 1,206 659 845Balance sheet exposure including intercompany exposure (154) (17) (6) (43)Total gross exposure (5,978) 1,189 653 802Hedged with other cash flowsHedged with currency options 453 (68) (44)Hedged with forward contracts 4,465 (919) (431) (997)Net exposure (1,060) 202 178 (195)
As at December 31, 2016Exposure from firm commitments and forecasted transactions (6,763) 985 615 252Balance sheet exposure including intercompany exposure (478) (11) (6) 28Total gross exposure (7,241) 974 609 280Hedged with other cash flows 114Hedged with currency options 405 (54)Hedged with forward contracts 5,253 (985) (578) (53)Net exposure (1,469) (11) (23) 227
ADID
AS
ANN
UAL
REPO
RT 2
017
1411 TO OUR SHAREHOLDERS 2 GROUP MANAGEMENT REPORT –
OUR COMPANY3 GROUP MANAGEMENT REPORT –
FINANCIAL REVIEW4 CONSOLIDATED FINANCIAL
STATEMENTS5 ADDITIONAL INFORMATION
RISK AND OPPORTUNITY REPORT

instruments, such as currency options or option combinations, which provide protection from negative exchange rate fluctuations while – at the same time – retaining the potential to benefit from future favorable exchange rate developments in the financial markets.
Credit risksA credit risk arises if a customer or other counterparty to a financial instrument fails to meet its contractual obligations.
SEE NOTE 30, P. 190 adidas is exposed to credit risks from its operating activities and from certain financing activities. Credit risks arise principally from accounts receivable and, to a lesser extent, from other third-party contractual financial obligations such as other financial assets, short-term bank deposits and derivative financial instruments. Without taking into account any collateral, the carrying amount of financial assets and accounts receivable represents the maximum exposure to credit risk.
At the end of 2017, there was no relevant concentration of credit risk by type of customer or geography. Our credit risk exposure is mainly influenced by individual customer characteristics. Under the company’s credit policy, new customers are analyzed for creditworthiness before standard payment and delivery terms and conditions are offered. Tolerance limits for accounts receivable are also established for each customer. Both creditworthiness and accounts receivable limits are monitored on an ongoing basis. Customers that fail to meet the company’s minimum creditworthiness are, in general, allowed to purchase products only on a prepayment basis.
Other activities to mitigate credit risks include retention of title clauses as well as, on a selective basis, credit insurance, the sale of accounts receivable without recourse, and bank guarantees.
Objective evidence that financial assets are impaired includes, for instance, significant financial difficulty of the issuer or debtor, indications of the potential bankruptcy of the borrower and the disappearance of an active market for a financial asset because of financial difficulties. The company utilizes allowance accounts for impairments that represent our estimate of incurred credit losses with respect to accounts receivable.
Allowance accounts are used as long as the company is satisfied that recovery of the amount due is possible. Once this is no longer the case, the amounts are considered irrecoverable and are directly written off against the financial asset. The allowance consists of two components:
— firstly, an allowance established for all receivables dependent on the aging structure of receivables past due date and
— secondly, a specific allowance that relates to individually assessed risks for each specific customer – irrespective of aging.
At the end of 2017, no customer accounted for more than 10% of accounts receivable.
The Treasury department arranges currency, commodity and interest rate hedges, and invests cash, with major banks of a high credit standing throughout the world. adidas subsidiaries are authorized to work with banks rated BBB+ or higher. Only in exceptional cases are subsidiaries authorized to work with banks rated lower than BBB+. SEE TREASURY, P. 115 To limit risk in these cases, restrictions are clearly stipulated, such as maximum cash deposit levels. In addition, the credit default swap premiums of our partner banks are monitored on a monthly basis. In the event that the defined threshold is exceeded, credit balances are shifted to banks compliant with the limit.
Sensitivity analysis of foreign exchange rate changes € in millions 101
USD GBP JPY CNY
As at December 31, 2017EUR +10% EUR +10% EUR +10% USD +10%
Equity (255) 88 43 76Net income 7 1 1 12
EUR –10% EUR –10% EUR –10% USD –10%Equity 334 (101) (52) (76)Net income (14) (3) (1) (11)
As at December 31, 2016EUR +10% EUR +10% EUR +10% USD +10%
Equity (277) 85 53 48Net income 7 1 1 7
EUR –10% EUR –10% EUR –10% USD –10%Equity 355 (104) (66) (48)Net income (8) (1) (1) (6)
ADID
AS
ANN
UAL
REPO
RT 2
017
1421 TO OUR SHAREHOLDERS 2 GROUP MANAGEMENT REPORT –
OUR COMPANY3 GROUP MANAGEMENT REPORT –
FINANCIAL REVIEW4 CONSOLIDATED FINANCIAL
STATEMENTS5 ADDITIONAL INFORMATION
RISK AND OPPORTUNITY REPORT

We believe our risk concentration is limited due to the broad distribution of our investment business with more than 20 globally operating banks. At December 31, 2017, no bank accounted for more than 10% of our investments. Including subsidiaries’ short-term deposits in local banks, the average concentration was 1%. This leads to a maximum exposure of € 98 million in the event of default of any single bank. We have further diversified our investment exposure by investing into AAA-rated money market funds.
In addition, in 2017, we held derivatives with a positive fair market value in the amount of € 101 million. The maximum exposure to any single bank resulting from these assets amounted to € 27 million and the average concentration was 4%.
In accordance with IFRS 7, the following table includes further information about set-off possibilities of derivative financial assets and liabilities. SEE TABLE 102 The majority of agreements between financial institutions and adidas include a mutual right to set off. However, these agreements do not meet the criteria for offsetting in the statement of financial position, because the right to set off is enforceable only in the event of counterparty defaults.
The carrying amounts of recognized derivative financial instruments, which are subject to the mentioned agreements, are also presented in the following table. SEE TABLE 102
Interest rate and share price risksChanges in global market interest rates affect future interest payments for variable-interest liabilities. As the company does not have material variable-interest liabilities, even a significant increase in interest rates should have only slight adverse effects on the company’s profitability, liquidity and financial position. In addition, share price fluctuations may affect our Long-Term Incentive Plan (LTIP), which is a share-based remuneration scheme with cash settlement. In line with IFRS 7 requirements, we have calculated the impact on net income based on changes in the company’s share price. A 10% increase in the adidas AG share price versus the closing share price at December 31, 2017 would have led to a € 5.8 million increase in net income whereas a 10% decrease in the adidas AG share price versus the closing share price at
December 31, 2017 would have led to a € 5.8 million decrease in net income.
To reduce interest rate risks and maintain financial flexibility, a core tenet of our company’s financial strategy is to continue to use surplus cash flow from operations to reduce gross borrowings. Beyond that, we may consider adequate hedging strategies through interest rate derivatives in order to mitigate interest rate risks. SEE TREASURY, P. 115 To reduce share price risks, the company uses derivative instruments to hedge against share price fluctuations.
Financing and liquidity risksLiquidity risks arise from not having the necessary resources available to meet maturing liabilities with regard to timing, volume and currency structure. In addition, the company faces the risk of having to accept unfavorable financing terms due to liquidity restraints. Our Treasury department uses an efficient cash management system to manage liquidity risk. At December 31, 2017, cash and cash equivalents together with marketable securities amounted to € 1.604 billion (2016: € 1.515 billion). Moreover, our company maintains € 2.251 billion (2016: € 2.403 billion) in bilateral credit lines, which are designed to ensure sufficient liquidity at all times. Of these, € 600 million consist of core committed lines.
SEE TREASURY, P. 115
Future cash outflows arising from financial liabilities that are recognized in the consolidated statement of financial position are presented in the following table. SEE TABLE 103 This includes payments to settle obligations from borrowings as well as cash outflows from cash-settled derivatives with negative market values. Financial liabilities that may be settled in advance without penalty are included on the basis of the earliest date of potential repayment. Cash flows for variable-interest liabilities are determined with reference to the conditions at the balance sheet date.
Set-off possibilities of derivative financial assets and liabilities € in millions
102
2017 2016
AssetsGross amounts of recognized financial assets 115 383Financial instruments which qualify for set-off in the statement of financial position 0 0Net amounts of financial assets presented in the statement of financial position 115 383Set-off possible due to master agreements (100) (96)Total net amount of financial assets 15 287
LiabilitiesGross amounts of recognized financial liabilities (280) (112)Financial instruments which qualify for set-off in the statement of financial position 0 0Net amounts of financial liabilities presented in the statement of financial position (280) (112)Set-off possible due to master agreements 100 96Total net amount of financial liabilities (180) (16)
ADID
AS
ANN
UAL
REPO
RT 2
017
1431 TO OUR SHAREHOLDERS 2 GROUP MANAGEMENT REPORT –
OUR COMPANY3 GROUP MANAGEMENT REPORT –
FINANCIAL REVIEW4 CONSOLIDATED FINANCIAL
STATEMENTS5 ADDITIONAL INFORMATION
RISK AND OPPORTUNITY REPORT

We ended the year 2017 with net cash of € 484 million (2016: net borrowings of € 103 million).
ILLUSTRATION OF OPPORTUNITIES
In this report, we focus on opportunities we deem to be material for adidas in the period from 2018 to 2020. Our presentation of opportunities in this year’s Annual Report differs from the 2016 Annual Report as we have expanded our scope and do not only focus on opportunities that could impact the company’s business performance over a one-year period. The assessment is shown in the opportunities overview table.
SEE TABLE 104
STRATEGIC AND OPERATIONAL OPPORTUNITIESOrganic growth opportunitiesDistribution strategy: The sporting goods retail environment is changing constantly. We therefore continue to adapt our distribution strategy to this constantly changing environment and have made controlled space initiatives a strategic priority.
SEE CORPORATE STRATEGY, P. 62 This includes the further expansion of our own e-commerce activities, a clear focus on retail partners that provide consumers with the best shopping experience and customer service, retail space management with key retail partners, as well as the introduction and roll-out of new own-retail store formats. Successful results from
these initiatives could enable us to accelerate top- and bottom-line growth. SEE SALES AND DISTRIBUTION STRATEGY, P. 72
Partnerships: adidas is constantly evolving its partnership network within sport and culture, such as with academic organizations and companies from other industries in research and development. SEE INNOVATION, P. 78 These partnerships have generated multiple new growth opportunities for adidas, as we have acquired product or process know-how and gained access to new distribution channels or markets. Partnerships, strategic alliances and collaborations may enable us to pursue further growth and efficiency opportunities.
Product portfolio: Over the last years, we have benefited from strong consumer demand for selected product franchises such as UltraBOOST, Stan Smith or NMD. We believe that a continued focus on product franchises combined with disciplined product lifecycle management and well-executed distribution offers further upside potential both in terms of sales and profit. In addition, further optimizing pricing and range architecture could result in better-than-expected top-line growth and bottom-line improvements. We continue to see untapped sales potential at more commercial price points. Consequently, the further expansion in categories such as basketball and running, where we feel currently underrepresented, could result in additional market share and net sales growth and lead to further profitability improvements.
Opportunities related to organizational and process improvementsData analytics: Data and analytics play a crucial role in enabling fact-based decision making. Therefore, we have established a dedicated Advanced Analytics team to drive business decision making by leveraging the power of data. Throughout 2018, we will continue to enhance our existing capabilities to build and scale insights-driven use cases, using latest technology that will bring value to our business
Future cash outflows € in millions 103
Up to 1 year
Up to 2 years
Up to 3 years
Up to 4 years
Up to 5 years
More than 5 years Total
As at December 31, 2017Bank borrowings 106 106Eurobond1 16 16 17 616 9 425 1,099Accounts payable 1,975 1,975Other financial liabilities 88 5 93Accrued liabilities2 837 1 838Derivative financial liabilities 275 9 284Total 3,297 31 17 616 9 426 4,395
As at December 31, 2016Bank borrowings 379 379Eurobond1 16 16 16 17 616 435 1,116Accounts payable 2,496 2,496Other financial liabilities 90 16 107Accrued liabilities2 704 9 713Derivative financial liabilities 110 3 113Total 3,795 44 16 17 616 435 4,924
1 Including interest payments.2 Accrued interest excluded.
ADID
AS
ANN
UAL
REPO
RT 2
017
1441 TO OUR SHAREHOLDERS 2 GROUP MANAGEMENT REPORT –
OUR COMPANY3 GROUP MANAGEMENT REPORT –
FINANCIAL REVIEW4 CONSOLIDATED FINANCIAL
STATEMENTS5 ADDITIONAL INFORMATION
RISK AND OPPORTUNITY REPORT

operations across the entire company. As a result, we could become faster and more efficient in our operations. We may increase visibility and understanding of consumer preferences, increase full-price sales, reduce discounts and optimize order book management, inventory management and purchasing. This could result in improved top- and bottom-line performance.
Process optimization: Continued optimization of key business processes and strict cost control are vital to achieving high profitability and return on invested capital. We are confident that there is still significant opportunity to improve process efficiency and effectiveness and further streamline cost structures throughout our company. Consequently, we will continue to focus on driving the standardization and harmonization of processes, as reflected by the company’s ‘ONE adidas’ initiative. SEE CORPORATE STRATEGY, P. 62 For example, further centralizing and bundling our global non-trade procurement activities SEE GLOSSARY could help realize additional cost savings. Our strategic workforce management initiative also not only mitigates the risk of unbalanced allocation of personnel across the company but could also
help us increase efficiency and productivity beyond our current expectations by optimizing organizational structures and capability management.
FINANCIAL OPPORTUNITIESFavorable financial market changesFavorable exchange and interest rate developments can potentially have a positive impact on the company’s financial results. Our Treasury department closely monitors the financial markets to identify and exploit opportunities. Translation effects from the conversion of non-euro-denominated results into our company’s functional currency, the euro, might positively impact our company’s financial performance. SEE TREASURY, P. 115
Corporate opportunities overview 104
Potential impactChange (2016 rating) Likelihood
Change (2016 rating)
Strategic and operational opportunitiesOrganic growth opportunities Very high ↑ (High) PossibleOpportunities related to organizational and process improvements High ↑ (Medium) Likely ↑ (Possible)
Financial opportunitiesFavorable financial market changes Very high Possible
ADID
AS
ANN
UAL
REPO
RT 2
017
1451 TO OUR SHAREHOLDERS 2 GROUP MANAGEMENT REPORT –
OUR COMPANY3 GROUP MANAGEMENT REPORT –
FINANCIAL REVIEW4 CONSOLIDATED FINANCIAL
STATEMENTS5 ADDITIONAL INFORMATION
RISK AND OPPORTUNITY REPORT

MANAGEMENT ASSESSMENT OF PERFORMANCE, RISKS AND OPPORTUNITIES, AND OUTLOOK
ASSESSMENT OF PERFORMANCE VERSUS TARGETSWe communicate our financial targets on an annual basis. We also provide updates throughout the year as appropriate. In 2017, the company delivered a strong operational and financial performance. Sales development was favorably impacted by rising consumer spending on sporting goods, supported by global trends such as increasing penetration of sportswear (‘athleisure’), increasing health awareness and rising sports participation rates. SEE ECONOMIC AND SECTOR DEVELOPMENT, P. 105 The strong brand momentum, supported by innovative product launches and inspiring marketing campaigns, as well as the successful execution of the company’s strategic business plan ‘Creating the New’ drove strong sales and earnings growth throughout the year. As a result, we increased our full-year top- and bottom-line guidance in July 2017. SEE TABLE 105
In 2017, revenues increased 16% on a currency-neutral basis, driven by double-digit growth at the adidas brand. Currency-neutral sales grew at double-digit rates in nearly all market segments. As a result, revenues increased above our initial guidance of 12% to 14% currency-neutral sales growth. Gross margin increased 1.2 percentage points to 50.4%, exceeding our initial forecast of an increase of up to 0.3 percentage points. This development was due to the larger-than-expected positive effects from a better pricing and product mix, which more than offset headwinds from unfavorable currency movements. The operating margin increased 1.2 percentage points to a level of 9.8%, which was above our initial guidance of an increase of between 0.2 and 0.4 percentage points. This development was
due to the gross margin increase as well as the positive effect from lower other operating expenses as a percentage of sales, which more than offset the decline in other operating income. As a result, net income from continuing operations, excluding the negative one-time tax impact in 2017, was up 32% to € 1.430 billion, and thus exceeded our initial guidance of an improvement at a rate between 13% and 15%. SEE INCOME
STATEMENT, P. 107
In 2017, average operating working capital as a percentage of sales ended the year at a level of 20.4%. This development represents a decrease compared to the prior year level of 21.1%, while our initial guidance was for a modest increase. Capital expenditure (excluding acquisitions) amounted to € 752 million in 2017, below our initial guidance of around € 1.1 billion, mainly reflecting fewer-than-expected store openings throughout the year. Investments were mainly focused on controlled space initiatives of the adidas and Reebok brands, aimed at further strengthening our own-retail activities, franchise store presence and shop-in-shop presentations. Other areas of investment included logistics infrastructure and IT systems as well as the further development of our corporate headquarters in Herzogenaurach, Germany. SEE STATEMENT OF
FINANCIAL POSITION AND STATEMENT OF CASH FLOWS, P. 111
Beyond our financial performance, we also actively monitor non-financial KPIs. SEE INTERNAL MANAGEMENT SYSTEM, P. 102 In 2017, our Net Promoter Score (NPS) saw further improvements, reflecting the strong momentum of our brands and products throughout the year. Also from a market share perspective, we continue to be very encouraged by our strong performance in key categories and key markets, as defined in the company’s strategic business plan. North America and Greater China, two of our focus markets, were once again notable standouts, as we were able to further improve our market share in these regions. Our diligence and discipline in sustainability matters continues to yield strong recognition
for our company. In 2017, adidas AG was again represented in a variety of high-profile sustainability indices. For the 18th consecutive time, adidas AG was selected to join the Dow Jones Sustainability Indices (DJSI), the world’s first global sustainability index family tracking the performance of the leading sustainability-driven companies worldwide. In the sector ‘Textiles, Apparel & Luxury Goods’, we were rated industry best in the criteria Human Rights, Supply Chain Management, Impact Measurement and Valuation, Materiality, Environmental Policy and Management Systems, Risk and Crisis Management, Brand Management, Corporate Citizenship and Philanthropy, and Customer Relationship Management.
SEE SUSTAINABILITY, P. 88 As we are convinced that our employees’ feedback plays a crucial role in our pursuit of creating a world-class work environment, during the course of 2017, we kicked off a new approach and system platform (‘People Pulse’) for a monthly measurement of the level of employee satisfaction. Following the implementation of this approach in June 2017, our monthly participation rates toward year-end exceeded our minimum participation rate target. In 2018, we aim to further expand People Pulse across the organization and build on the key learnings from the surveys. SEE PEOPLE
AND CULTURE, P. 81 Finally, we continue to enjoy a strong level of on-time in-full (OTIF) deliveries to our customers and own-retail stores. In 2017, OTIF saw a slight improvement compared to the prior year level and we are well on track to achieve our mid-term target. SEE GLOBAL OPERATIONS, P. 74
ADID
AS
ANN
UAL
REPO
RT 2
017
1461 TO OUR SHAREHOLDERS 2 GROUP MANAGEMENT REPORT –
OUR COMPANY3 GROUP MANAGEMENT REPORT –
FINANCIAL REVIEW4 CONSOLIDATED FINANCIAL
STATEMENTS5 ADDITIONAL INFORMATION
MANAGEMENT ASSESSMENT OF PERFORMANCE, RISKS AND OPPORTUNITIES, AND OUTLOOK

forms a solid basis for our future business development and provides the resources necessary to pursue the opportunities available to the company. Compared to the prior year, our assessment of certain risks has changed in terms of likelihood of occurrence and/or potential financial impact. The partial changes in risk evaluation have no substantial impact on the overall adidas risk profile, which we believe remains unchanged compared to the prior year.
ASSESSMENT OF FINANCIAL OUTLOOKIn March 2015, adidas unveiled ,Creating the New’, its 2020 strategic business plan, which defines strategic priorities and objectives for the period up to 2020. The strategy is designed to drive brand desirability which, in turn, is expected to spur top- and bottom-line growth for the company in the years to come. Our successes since 2016, as measured by financial as well as non-financial KPIs, are a direct consequence of relentlessly executing Creating the New. Therefore, we will continue to focus on further executing against our strategic business plan, while at the same time fine-tuning it wherever needed and whenever necessary.
In March 2017, Creating the New was updated with complementary initiatives in order to grow the top and bottom line even faster than initially projected. This will ensure we continue our momentum in the years to come, resulting in strong sales and profitability improvements until 2020. Consequently, we increased our financial targets for 2020. We project currency-neutral revenues to increase at a rate of 10% to 12% on average per year until 2020 compared to the 2015 results. By outperforming the sporting goods industry, our brands will increase market share over the period. This, in combination with the expected gross margin improvement and our ability to generate operating leverage, will significantly increase our profitability. As a result, net income from continuing operations is expected to grow at a higher rate than the top line. While in March 2017, we projected net
ASSESSMENT OF OVERALL RISKS AND OPPORTUNITIESOur Risk Management team aggregates all risks and opportunities reported by Risk Owners and Executive Board members through the half-yearly risk and opportunity assessment process. Results from this process are analyzed and reported to the Executive Board accordingly. In addition, the Executive Board discusses and assesses risks and opportu-nities on a regular basis. SEE RISK AND OPPORTUNITY REPORT, P. 131
Taking into account the potential financial impact as well as the likelihood of materializing of the risks explained within this report, and considering the strong balance sheet as well as the current business outlook, we do not foresee any material jeopardy to the viability of the company as a going concern. This assessment is also supported by the historical response to our financing demands. adidas therefore has not sought an official rating by any of the leading rating agencies. We remain confident that our earnings strength
Company targets versus actual key metrics 105
2016 Results 1
2017 Initial targets 1, 2
2017 Updated targets 1, 3
2017 Results 1
2018 Outlook
Sales (year-over-year change, currency-neutral)
20% to increase at a rate between 12% and 14%
to increase at a rate between 17% and 19%
16% to increase at a rate around 10%
Gross margin 49.2% to increase up to 0.3pp to increase up to 0.8pp 50.4% to increase up to 0.3pp to a level of up to 50.7%1.2pp
Other operating expenses (in % of net sales)
42.7% below prior year level below prior year level 41.9% below prior year level(0.8pp)
Operating profit (€ in millions) 1,582 to increase at a rate between 13% and 15%
to increase at a rate between 24% and 26%
2,070 to increase at a rate between 9% and 13%31%
Operating margin 8.6% to increase between 0.2pp and 0.4pp
to increase up to 0.6pp 9.8% to increase between 0.5pp and 0.7pp to a level between
10.3% and 10.5%1.2pp
Net income from continuing operations 4 (€ in millions)
1,082 to increase at a rate between 13% and 15%
to increase at a rate between 26% and 28%
1,430 to increase at a rate between 13% and 17% to a level
between € 1.615 billion and € 1.675 billion
32%
Basic earnings per share from continuing operations 4 (in €)
5.39 to increase at a rate between 13% and 15%
to increase at a rate between 25% and 27%
7.05 to increase at a rate between 12% and 16%31%
Average operating working capital (in % of net sales)
21.1% modest increase modest increase 20.4% around prior year level(0.7pp)
Capital expenditure 5 (€ in millions) 642 around € 1.1 billion up to € 1.0 billion 752 to increase to a level of around € 900 million17%
1 Figures reflect continuing operations as a result of the divestiture of the Rockport, TaylorMade, Adams Golf, Ashworth and CCM Hockey businesses.2 As published on March 8, 2017. 3 As published on July 27, 2017. 4 2017 excluding negative one-time tax impact of € 76 million.5 Excluding acquisitions and finance leases.
ADID
AS
ANN
UAL
REPO
RT 2
017
1471 TO OUR SHAREHOLDERS 2 GROUP MANAGEMENT REPORT –
OUR COMPANY3 GROUP MANAGEMENT REPORT –
FINANCIAL REVIEW4 CONSOLIDATED FINANCIAL
STATEMENTS5 ADDITIONAL INFORMATION
MANAGEMENT ASSESSMENT OF PERFORMANCE, RISKS AND OPPORTUNITIES, AND OUTLOOK
income from continuing operations to expand by 20% to 22% on average per year during the five-year period, we now expect net income from continuing operations to grow by 22% to 24% on average per year, following the strong operational and financial performance in 2017. SEE CORPORATE STRATEGY, P. 62
Through our extensive pipeline of new product launches paired with brand-building activities, the positive effects from major sporting events, including the 2018 FIFA World Cup, as well as through tight control of inventory levels and stringent cost management, we project strong revenue and profitability improvements in 2018. Our net income is expected to benefit from a further expansion in gross margin and the positive effect of lower other operating expenses as a percentage of sales. SEE SUBSEQUENT EVENTS AND OUTLOOK, P. 128 We believe that our outlook for 2018 is realistic within the scope of the current trading and economic environment.
Assuming no significant deterioration in the global economy, we are confident that we will achieve strong top- and bottom line improvements in 2018. However, ongoing uncertainties regarding the economic outlook and consumer sentiment in both developed and emerging economies as well as persisting high levels of currency volatility represent risks to the achievement of our stated financial goals and aspirations.
SEE ECONOMIC AND SECTOR DEVELOPMENT, P. 105 No other material event between the end of 2017 and the publication of this report has altered our view.
ADID
AS
ANN
UAL
REPO
RT 2
017
1481 TO OUR SHAREHOLDERS 2 GROUP MANAGEMENT REPORT –
OUR COMPANY3 GROUP MANAGEMENT REPORT –
FINANCIAL REVIEW4 CONSOLIDATED FINANCIAL
STATEMENTS5 ADDITIONAL INFORMATION
MANAGEMENT ASSESSMENT OF PERFORMANCE, RISKS AND OPPORTUNITIES, AND OUTLOOK

ADID
AS
ANN
UAL
REPO
RT 2
017
C O N S O L I D A T E D F I N A N C I A L
S T A T E M E N T S
Consolidated Statement of Financial Position 150
Consolidated Income Statement 152
Consolidated Statement of Comprehensive Income 153
Consolidated Statement of Changes in Equity 154
Consolidated Statement of Cash Flows 155
Notes 157Notes to the Consolidated Statement of Financial Position 169Notes to the Consolidated Income Statement 201Additional Information 205
Statement of Movements of Intangible and Tangible Assets 213
Shareholdings 215
Responsibility Statement 220
Independent Auditor’s Report 221
Independent Auditor’s Assurance Report 226
149
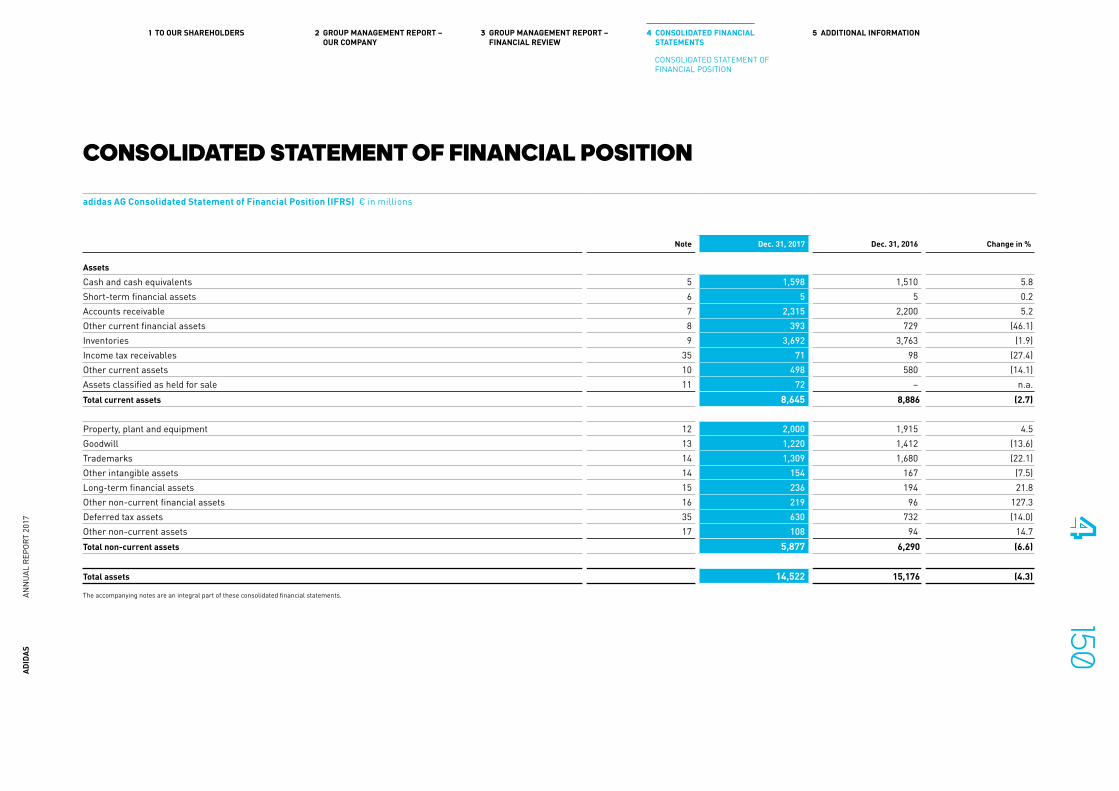
CONSOLIDATED STATEMENT OF FINANCIAL POSITION
adidas AG Consolidated Statement of Financial Position (IFRS) € in millions
Note Dec. 31, 2017 Dec. 31, 2016 Change in %
AssetsCash and cash equivalents 5 1,598 1,510 5.8Short-term financial assets 6 5 5 0.2Accounts receivable 7 2,315 2,200 5.2Other current financial assets 8 393 729 (46.1)Inventories 9 3,692 3,763 (1.9)Income tax receivables 35 71 98 (27.4)Other current assets 10 498 580 (14.1)Assets classified as held for sale 11 72 – n.a.Total current assets 8,645 8,886 (2.7)
Property, plant and equipment 12 2,000 1,915 4.5Goodwill 13 1,220 1,412 (13.6)Trademarks 14 1,309 1,680 (22.1)Other intangible assets 14 154 167 (7.5)Long-term financial assets 15 236 194 21.8Other non-current financial assets 16 219 96 127.3Deferred tax assets 35 630 732 (14.0)Other non-current assets 17 108 94 14.7Total non-current assets 5,877 6,290 (6.6)
Total assets 14,522 15,176 (4.3)
The accompanying notes are an integral part of these consolidated financial statements.
ADID
AS
ANN
UAL
REPO
RT 2
017
1501 TO OUR SHAREHOLDERS 2 GROUP MANAGEMENT REPORT –
OUR COMPANY3 GROUP MANAGEMENT REPORT –
FINANCIAL REVIEW4 CONSOLIDATED FINANCIAL
STATEMENTS5 ADDITIONAL INFORMATION
CONSOLIDATED STATEMENT OF FINANCIAL POSITION

adidas AG Consolidated Statement of Financial Position (IFRS) € in millions
Note Dec. 31, 2017 Dec. 31, 2016 Change in %
Liabilities and equityShort-term borrowings 18 137 636 (78.5)Accounts payable 1,975 2,496 (20.9)Other current financial liabilities 19 362 201 80.5Income taxes 35 424 402 5.3Other current provisions 20 741 573 29.3Current accrued liabilities 21 2,180 2,023 7.8Other current liabilities 22 473 434 8.9Liabilities classified as held for sale 11 – – n.a.Total current liabilities 6,291 6,765 (7.0)
Long-term borrowings 18 983 982 0.1Other non-current financial liabilities 23 22 22 1.1Pensions and similar obligations 24 298 355 (16.3)Deferred tax liabilities 35 275 387 (28.8)Other non-current provisions 20 80 44 81.7Non-current accrued liabilities 21 85 120 (29.4)Other non-current liabilities 25 53 46 14.6Total non-current liabilities 1,796 1,957 (8.2)
Share capital 204 201 1.2Reserves (81) 749 n.a.Retained earnings 6,327 5,521 14.6Shareholders’ equity 26 6,450 6,472 (0.3)
Non-controlling interests 28 (15) (17) 13.6
Total equity 6,435 6,455 (0.3)
Total liabilities and equity 14,522 15,176 (4.3)
The accompanying notes are an integral part of these consolidated financial statements.
ADID
AS
ANN
UAL
REPO
RT 2
017
1511 TO OUR SHAREHOLDERS 2 GROUP MANAGEMENT REPORT –
OUR COMPANY3 GROUP MANAGEMENT REPORT –
FINANCIAL REVIEW4 CONSOLIDATED FINANCIAL
STATEMENTS5 ADDITIONAL INFORMATION
CONSOLIDATED STATEMENT OF FINANCIAL POSITION

CONSOLIDATED INCOME STATEMENT
adidas AG Consolidated Income Statement (IFRS) € in millions
NoteYear ending
Dec. 31, 2017Year ending
Dec. 31, 2016 Change
Net sales 37 21,218 18,483 14.8%Cost of sales 10,514 9,383 12.1%Gross profit 10,703 9,100 17.6%
(% of net sales) 50.4% 49.2% 1.2ppRoyalty and commission income 115 105 9.6%Other operating income 31 133 262 (49.3%)Other operating expenses 12, 14, 32 8,882 7,885 12.6%
(% of net sales) 41.9% 42.7% (0.8pp)Operating profit 2,070 1,582 30.8%
(% of net sales) 9.8% 8.6% 1.2ppFinancial income 34 46 28 67.6%Financial expenses 34 93 74 25.7%Income before taxes 2,023 1,536 31.7%
(% of net sales) 9.5% 8.3% 1.2ppIncome taxes 35 668 454 47.2%
(% of income before taxes) 33.0% 29.6% 3.5ppNet income from continuing operations 1,354 1,082 25.2% (% of net sales) 6.4% 5.9% 0.5ppLosses from discontinued operations, net of tax 3 254 62 310.0%Net income 1,100 1,020 7.9%
(% of net sales) 5.2% 5.5% (0.3pp)Net income attributable to shareholders 1,097 1,017 7.8%
(% of net sales) 5.2% 5.5% (0.3pp)Net income attributable to non-controlling interests 3 2 21.4%
Basic earnings per share from continuing operations (in €) 36 6.68 5.39 23.9%Diluted earnings per share from continuing operations (in €) 36 6.63 5.29 25.2%
Basic earnings per share from continuing and discontinued operations (in €) 36 5.42 5.08 6.7%Diluted earnings per share from continuing and discontinued operations (in €) 36 5.38 4.99 7.8%
The accompanying notes are an integral part of these consolidated financial statements.
ADID
AS
ANN
UAL
REPO
RT 2
017
1521 TO OUR SHAREHOLDERS 2 GROUP MANAGEMENT REPORT –
OUR COMPANY3 GROUP MANAGEMENT REPORT –
FINANCIAL REVIEW4 CONSOLIDATED FINANCIAL
STATEMENTS5 ADDITIONAL INFORMATION
CONSOLIDATED INCOME STATEMENT

CONSOLIDATED STATEMENT OF COMPREHENSIVE INCOME
adidas AG Consolidated Statement of Comprehensive Income (IFRS) € in millions
NoteYear ending
Dec. 31, 2017Year ending
Dec. 31, 2016
Net income after taxes 1,100 1,020Items of other comprehensive income that will not be reclassified subsequently to profit or lossRemeasurements of defined benefit plans (IAS 19), net of tax1 24 23 (60)Subtotal of items of other comprehensive income that will not be reclassified subsequently to profit or loss 23 (60)Items of other comprehensive income that are or will be reclassified to profit or loss when specific conditions are metNet (loss)/gain on cash flow hedges, net of tax 30 (375) 87Reclassification of foreign currency differences on loss of significant influence 15 (0)Currency translation differences (539) 71Subtotal of items of other comprehensive income that are or will be reclassified to profit or loss when specific conditions are met (899) 158
Other comprehensive income (876) 97
Total comprehensive income 224 1,117
Attributable to shareholders of adidas AG 220 1,115Attributable to non-controlling interests 4 2
1 Includes actuarial gains or losses relating to defined benefit obligations, return on plan assets (excluding interest income) and the asset ceiling effect.The accompanying notes are an integral part of these consolidated financial statements.
ADID
AS
ANN
UAL
REPO
RT 2
017
1531 TO OUR SHAREHOLDERS 2 GROUP MANAGEMENT REPORT –
OUR COMPANY3 GROUP MANAGEMENT REPORT –
FINANCIAL REVIEW4 CONSOLIDATED FINANCIAL
STATEMENTS5 ADDITIONAL INFORMATION
CONSOLIDATED STATEMENT OF COMPREHENSIVE INCOME
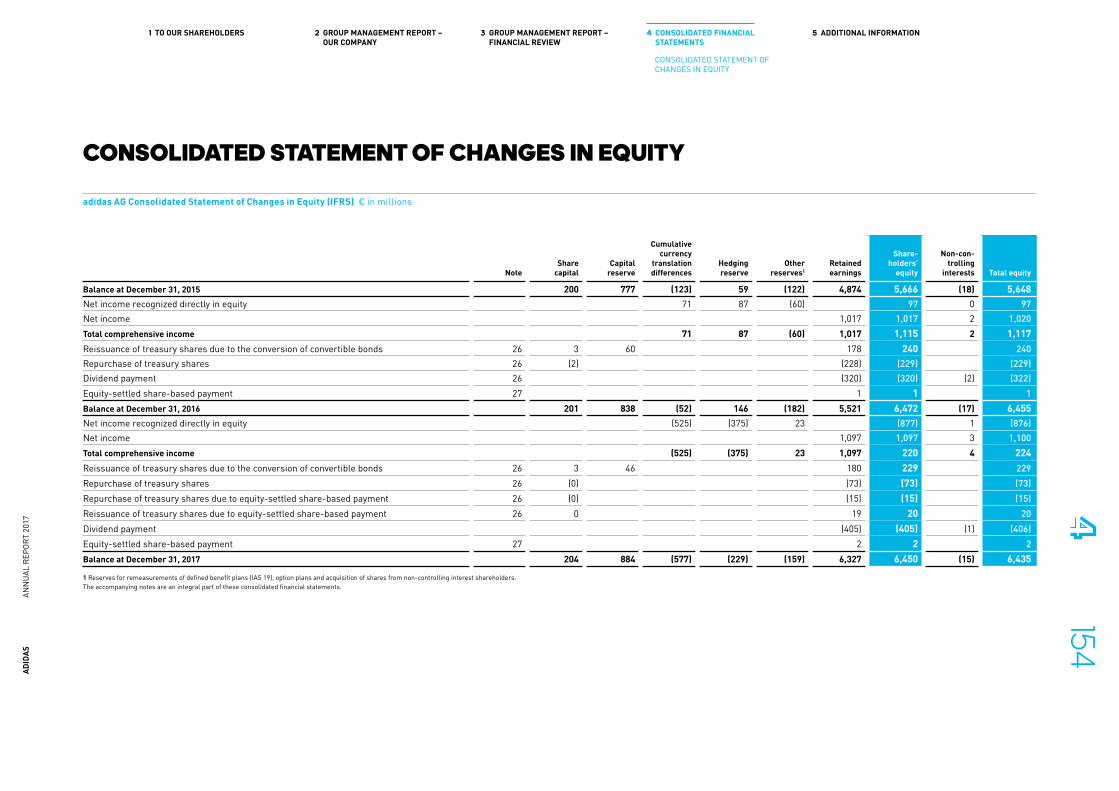
CONSOLIDATED STATEMENT OF CHANGES IN EQUITY
adidas AG Consolidated Statement of Changes in Equity (IFRS) € in millions
NoteShare
capitalCapital
reserve
Cumulative currency
translation differences
Hedging reserve
Other reserves1
Retained earnings
Share-holders’
equity
Non-con-trolling
interests Total equity
Balance at December 31, 2015 200 777 (123) 59 (122) 4,874 5,666 (18) 5,648Net income recognized directly in equity 71 87 (60) 97 0 97Net income 1,017 1,017 2 1,020Total comprehensive income 71 87 (60) 1,017 1,115 2 1,117Reissuance of treasury shares due to the conversion of convertible bonds 26 3 60 178 240 240Repurchase of treasury shares 26 (2) (228) (229) (229)Dividend payment 26 (320) (320) (2) (322)Equity-settled share-based payment 27 1 1 1Balance at December 31, 2016 201 838 (52) 146 (182) 5,521 6,472 (17) 6,455Net income recognized directly in equity (525) (375) 23 (877) 1 (876)Net income 1,097 1,097 3 1,100Total comprehensive income (525) (375) 23 1,097 220 4 224Reissuance of treasury shares due to the conversion of convertible bonds 26 3 46 180 229 229Repurchase of treasury shares 26 (0) (73) (73) (73)Repurchase of treasury shares due to equity-settled share-based payment 26 (0) (15) (15) (15)Reissuance of treasury shares due to equity-settled share-based payment 26 0 19 20 20Dividend payment (405) (405) (1) (406)Equity-settled share-based payment 27 2 2 2Balance at December 31, 2017 204 884 (577) (229) (159) 6,327 6,450 (15) 6,435
1 Reserves for remeasurements of defined benefit plans (IAS 19), option plans and acquisition of shares from non-controlling interest shareholders.The accompanying notes are an integral part of these consolidated financial statements.
ADID
AS
ANN
UAL
REPO
RT 2
017
1541 TO OUR SHAREHOLDERS 2 GROUP MANAGEMENT REPORT –
OUR COMPANY3 GROUP MANAGEMENT REPORT –
FINANCIAL REVIEW4 CONSOLIDATED FINANCIAL
STATEMENTS5 ADDITIONAL INFORMATION
CONSOLIDATED STATEMENT OF CHANGES IN EQUITY

CONSOLIDATED STATEMENT OF CASH FLOWS
adidas AG Consolidated Statement of Cash Flows (IFRS) € in millions
NoteYear ending
Dec. 31, 2017Year ending
Dec. 31, 2016
Operating activities:Income before taxes 2,023 1,536
Adjustments for:Depreciation, amortization and impairment losses 12, 13, 14, 32, 34 484 376Reversals of impairment losses 31 (1) (2)Unrealized foreign exchange gains, net (75) (7)Interest income 34 (25) (21)Interest expense 34 62 70Losses/(gains) on sale of property, plant and equipment and intangible assets, net 17 (24)Other non-cash expense/(income) 31, 32 3 (0)Payment for external funding of pension obligations (CTA) (30) –Proceeds from early termination of promotion and advertising contracts 4, 31 76 –Operating profit before working capital changes 2,534 1,927Increase in receivables and other assets (477) (462)Increase in inventories (216) (656)Increase in accounts payable and other liabilities 422 973Cash generated from operations before interest and taxes 2,263 1,782Interest paid (65) (46)Income taxes paid (556) (427)Net cash generated from operating activities – continuing operations 1,641 1,309Net cash generated from operating activities – discontinued operations 6 39Net cash generated from operating activities 1,648 1,348
The accompanying notes are an integral part of these consolidated financial statements.
ADID
AS
ANN
UAL
REPO
RT 2
017
1551 TO OUR SHAREHOLDERS 2 GROUP MANAGEMENT REPORT –
OUR COMPANY3 GROUP MANAGEMENT REPORT –
FINANCIAL REVIEW4 CONSOLIDATED FINANCIAL
STATEMENTS5 ADDITIONAL INFORMATION
CONSOLIDATED STATEMENT OF CASH FLOWS

adidas AG Consolidated Statement of Cash Flows (IFRS) € in millions
NoteYear ending
Dec. 31, 2017Year ending
Dec. 31, 2016
Investing activities:Purchase of trademarks and other intangible assets (74) (64)Proceeds from sale of trademarks and other intangible assets 0 0Purchase of property, plant and equipment (678) (578)Proceeds from sale of property, plant and equipment 2 5Proceeds from sale of assets held for sale 11 – 14Proceeds from sale of a disposal group 11 6 29Proceeds from disposal of discontinued operations net of cash disposed 174 –Purchase of short-term financial assets (0) (0)Purchase of investments and other long-term assets (132) (33)Interest received 25 21Net cash used in investing activities – continuing operations (676) (605)Net cash used in investing activities – discontinued operations (4) (9)Net cash used in investing activities (680) (614)
Financing activities:Repayments of finance lease obligations (2) (3)Dividend paid to shareholders of adidas AG 26 (405) (320)Dividend paid to non-controlling interest shareholders (1) (2)Acquisition of non-controlling interests 28 – (24)Repurchase of treasury shares 26 (85) (218)Repurchase of treasury shares due to share-based payments (15) –Proceeds from reissuance of treasury shares due to share-based payments 13 –Proceeds from short-term borrowings – 159Repayments of short-term borrowings 18 (273) (138)Net cash used in financing activities – continuing operations (769) (545)Net cash used in financing activities – discontinued operations (0) (9)Net cash used in financing activities (769) (553)
Effect of exchange rates on cash (111) (35)Increase of cash and cash equivalents 88 145Cash and cash equivalents at beginning of year 5 1,510 1,365Cash and cash equivalents at end of period 5 1,598 1,510
The accompanying notes are an integral part of these consolidated financial statements.
ADID
AS
ANN
UAL
REPO
RT 2
017
1561 TO OUR SHAREHOLDERS 2 GROUP MANAGEMENT REPORT –
OUR COMPANY3 GROUP MANAGEMENT REPORT –
FINANCIAL REVIEW4 CONSOLIDATED FINANCIAL
STATEMENTS5 ADDITIONAL INFORMATION
CONSOLIDATED STATEMENT OF CASH FLOWS
NOTES adidas AG is a listed German stock corporation and parent of the adidas Group located at Adi-Dassler-Str. 1, 91074 Her zogen aurach, Germany, and is entered into the commercial register at the Local Court of Fürth (HRB 3868). adidas AG and its subsidiaries (collectively ‘ adidas’, ‘the Group’ or ‘the company’) design, develop, produce and market a broad range of athletic and sports lifestyle products. As at December 31, 2017, the operating activities of adidas are divided into 13 operating segments: Western Europe, North America (excluding USA Reebok), USA Reebok, Greater China, Russia/CIS, Latin America, Japan, Middle East, South Korea, Southeast Asia/Pacific, adidas Golf, Runtastic and Other centrally managed businesses. Due to the completed divestitures of the former TaylorMade and CCM Hockey operating segments on October 2, 2017, and September 1, 2017, respectively, income and expenses of the former TaylorMade and CCM Hockey operating segments were reported as dis continued operations as at December 31, 2017. SEE NOTE 03
Each market comprises all wholesale, retail and e-commerce business activities relating to the distribution and sale of products of the adidas and Reebok brands to retail customers and end consumers. adidas and Reebok branded products include footwear, apparel and hardware, such as bags and balls.
Runtastic operates in the digital health and fitness space. The company provides a comprehensive ecosystem for tracking and managing health and fitness data.
The operating segment Other centrally managed businesses primarily includes the business activities of the Y-3 label.
01 » GENERAL The consolidated financial statements of adidas AG as at December 31, 2017 comprise adidas AG and its subsidiaries and are prepared in compliance with International Financial Reporting Standards (IFRS), as to be applied in the European Union (EU) as at December 31, 2017, and the additional requirements pursuant to § 315e section 1 German Commercial Code (Handelsgesetzbuch – HGB).
The following new standards and interpretations and amendments to existing standards and interpretations are effective for financial years beginning on January 1, 2017 and have been applied for the first time to the consolidated financial statements:
— IAS 7 Amendment – Disclosure Initiative (EU effective date: January 1, 2017): This amendment introduces a new disclosure relating to changes in liabilities arising from financing activities. The amendment requires enhanced disclosures in the consolidated financial statements.
SEE NOTE 38
— IAS 12 Amendment – Recognition of Deferred Tax Assets for Unrealised Losses (EU effective date: January 1, 2017): This amendment clarifies existing guidance for recognizing deferred tax assets. The amendment did not have any material impact on the consolidated financial statements.
— Improvements to IFRSs (2014–2016) – Amendments to IFRS 12 (EU effective date: January 1, 2017): These improvements include amendments to IFRS 12 which clarify the scope of the standard with regard to disclosure requirements. The improvement clarifies that the scope of the standard applies to an entity’s interests regardless of whether they are classified as held for sale, held for distribution or discontinued operations in accordance with IFRS 5. These amendments did not have a material impact on the consolidated financial statements.
New standards and interpretations as well as amendments to existing standards and interpretations are usually not applied by adidas before the EU effective date.
New standards and interpretations and amendments to existing standards and interpretations issued by the International Accounting Standards Board (IASB) and endorsed by the EU which are effective for financial years beginning after January 1, 2017, and which have not been applied in preparing these consolidated financial statements are:
— IFRS 4 Amendment – Applying IFRS 9 Financial Instruments with IFRS 4 Insurance Contracts (EU effective date: January 1, 2018): The amendment addresses the temporary accounting consequences of the different effective dates of IFRS 9 Financial Instruments and IFRS 4 Insurance Contracts. adidas does not have any insurance contracts accounted for under IFRS 4. Therefore, the amendment is not expected to have any impact on the company’s consolidated financial statements.
— IFRS 9 Financial Instruments (EU effective date: January 1, 2018): The new standard prescribes rules for the accounting of financial instruments, replacing the current guidelines in IAS 39 Financial Instruments: Recognition and Measurement. In particular, IFRS 9 prescribes new classification methods for financial assets, which has an effect on the company’s classification and subsequent presentation of certain financial assets. adidas has identified all financial instruments that require classification according to IFRS 9, defined the respective business models for managing the financial assets and analyzed contractual cash flow characteristics of financial assets by performing a test based on the single contracts. The business model and fulfilling the so-called ‘SPPI test’ are the basis for the respective classification and measurement of financial assets according to IFRS 9. As a result of the changes in IFRS 9 classification, the company has determined that most financial assets previously
ADID
AS
ANN
UAL
REPO
RT 2
017
1571 TO OUR SHAREHOLDERS 2 GROUP MANAGEMENT REPORT –
OUR COMPANY3 GROUP MANAGEMENT REPORT –
FINANCIAL REVIEW4 CONSOLIDATED FINANCIAL
STATEMENTS5 ADDITIONAL INFORMATION
NOTES
classified as available-for-sale will be classified as at fair value through profit or loss. The classification as at fair value through profit or loss is caused by the fact that the respective financial instruments do not achieve the contractual cash flow characteristic. Furthermore, equity investments which are currently classified as available-for-sale and measured at cost because they do not have a quoted market price in an active market will be measured as fair value through profit or loss. Furthermore, investment securities which are currently measured at fair value in other comprehensive income based on IAS 39 will be measured as fair value through profit or loss since the respective contracts do not satisfy the contractual cash flow characteristics test. Due to the classification changes, as of January 1, 2018, adidas expects a positive fair value change in the mid-single-digit million range in euros.The new standard also introduces the ‘expected credit loss model’ for financial assets, which will require company-wide policy adjustments to the allowance for doubtful accounts relating to accounts receivable. adidas has analyzed and determined the future calculation model for this allowance, which will calculate the allowance for doubtful accounts on all accounts receivable using lifetime expected credit losses. This calculation model also uses portfolios consisting of accounts receivable bearing similar features, such as the Credit Default Spread (CDS) and Days Sales Outstanding (DSO). The calculation model is based on historic information about default rates which, at the respective balance sheet date, are adjusted for current information and forecasts. At the first-time application of IFRS 9 as of January 1, 2018, the adjusted calculation of the allowances for doubtful accounts relating to accounts receivable is expected to result in a low double-digit million decrease in euros with a corresponding increase in retained earnings.According to the new standard, an entity can choose to either account for hedge instruments according to IFRS 9
or continue accounting for hedge instruments according to IAS 39. The company has decided to adopt IFRS 9 for hedge accounting at the EU effective date. As a result of the evaluation, the company has decided to designate forward exchange contracts – with the exception of hedges of a net investment in foreign operations – solely by the spot value, with the forward element posted under the costs of hedging in Other Comprehensive Income (OCI). This change is expected to result in less hedge ineffectiveness for forward exchange contracts. Hedges of net investment in a foreign operation will retain a forward designation, resulting in the expected future ineffectiveness from the cross-currency basis under IFRS 9 accounted for in profit or loss. In this respect, at the first-time application of IFRS 9 as of January 1, 2018, the company expects an immaterial effect. In addition, the company will continue to designate foreign currency options solely with their intrinsic value as the hedged instrument, with resulting changes in time value recognized as costs of hedging in OCI. adidas decided to designate solely the spot value components of forward exchange contracts as hedge instruments for the cash flow hedges under the application of IFRS 9. adidas has elected to utilize the option to account for forward elements for a period of time as costs of hedging in OCI.Additionally, the new standard adds new disclosures going beyond the current disclosure requirements in accordance with IFRS 7 Financial Instruments: Disclosures. adidas has identified the disclosures relevant to the company which are either new or have to be changed due to the implementation of IFRS 9. Retrospective restatement in the consolidated financial statements is either not permitted or not required for most disclosures, with the exception of certain disclosures related to hedge accounting. The company does not plan to retrospectively restate information except where required by the standard. adidas will take advantage of the option allowing it not to
restate comparative information for prior periods with respect to classification and measurement (including impairment) changes. Differences in the carrying amounts of financial assets and financial liabilities due to the first-time adoption of IFRS 9 will be recognized in retained earnings and other reserves as at January 1, 2018.IFRS 9 is neither expected to have a significant effect on the company’s accounting for financial liabilities nor on the derecognition of financial assets as the new guidelines are – to a large extent – adopted from IAS 39. As a result of the IFRS 9 evaluation, adidas identified the need for changes of accounting-related IT systems including: adding new accounts, e.g. for separating hedge components, as well as adding aging buckets for impairment purposes. The estimated effects of the IFRS 9 implementation on the above- mentioned balance sheet line items as at January 1, 2018, are based on current estimations. The actual effects of the IFRS 9 implementation as at January 1, 2018, may deviate because the new accounting methods may be subject to changes until the publication of the first consolidated financial statements after the effective date.
— IFRS 15 Revenue from Contracts with Customers including Amendments to IFRS 15: Effective Date of IFRS 15 (EU effective date: January 1, 2018): This new standard replaces the current guidance on recognizing revenue in accordance with IFRS, in particular IAS 18 Revenue, IAS 11 Construction contracts and IFRIC 13 Customer Loyalty Programmes and provides a holistic framework for all aspects of revenue recognition. IFRS 15 creates a centralized, single five-step model for recognizing revenue arising from contracts with customers. adidas has determined that the accounting for revenue recognition at the transfer of control is comparable to current practice in accordance with IAS 18. It has also been determined that customer incentives and options such as volume rebates, cooperative advertising
ADID
AS
ANN
UAL
REPO
RT 2
017
1581 TO OUR SHAREHOLDERS 2 GROUP MANAGEMENT REPORT –
OUR COMPANY3 GROUP MANAGEMENT REPORT –
FINANCIAL REVIEW4 CONSOLIDATED FINANCIAL
STATEMENTS5 ADDITIONAL INFORMATION
NOTES

allowances and slotting fees as well as any obligation of adidas to pay for the delivery of goods to the customer do not create performance obligations under IFRS 15. Currently, customer incentives which are contractually agreed upon are accounted for as sales discounts and are accrued over the financial year. Customer incentives which are not contractually agreed upon as well as promises that are implied by adidas’ customary business practice and do not bear the characteristics of a discount are accounted for as expenditure for marketing investments. According to IFRS 15, customer incentives are principally treated as a reduction of sales, except in cases where adidas receives from its customer a distinct service as consideration for the payment to the customer.In accordance with IAS 18, adidas accrues revenue related to estimated returns based on past experience by means of a return provision which is recorded in the statement of financial position with a corresponding debit entry in the income statement in the form of a reduction of gross sales. The current adidas policy requires that the provision is calculated on a net basis in the amount of the standard margin (i.e. the difference between gross sales and cost of sales) for the products sold which are expected to be returned. IFRS 15 requires a gross presentation of the return provision. In addition, an asset for the right to recover products from customers upon settling the refund liability has to be recognized. The company currently performs a fine adjustment of the calculation logic of the return rate. The first-time application of IFRS 15 as at January 1, 2018, is expected to lead to a balance sheet prolongation in the low three-digit million range in euros due to the increase in the return provision, the initially recognized return asset and a potential adjustment of retained earnings.No significant changes in the timing or amount of revenue recognized are expected with regard to revenue from own-retail transactions and licensing. The timing and
measurement of sales-based licensing-out of trademarks and royalties is similar to the previous practice in accordance with IAS 18. Contract assets and liabilities will arise in relation to licensing-out contracts with fixed consideration, with the following expected effects to be recognized in the consolidated statement of financial position on January 1, 2018: approximately € 3 million in contract assets, less than € 1 million in contract liabilities, and an adjustment to retained earnings in an amount of approximately € 2 million. The change will have an immaterial effect on revenues in the 2018 financial year.The estimated effects of the IFRS 15 implementation on the above-mentioned balance sheet line items as at January 1, 2018, are based on current estimations. The actual effects of the IFRS 15 implementation as at January 1, 2018, may deviate because the new accounting methods may be subject to changes until the publication of the first consolidated financial statements after the effective date.After further analysis, adidas has chosen the modified retrospective method (also called ‘cumulative effect method’) for the first-time application of IFRS 15. According to this transition method, the cumulative effect of applying IFRS 15 will be shown in the opening balance as at January 1, 2018. adidas will use a practical expedient offered in the IFRS 15 Amendment Clarifications to IFRS 15 which is applicable for the modified retrospective method. This allows the company to reflect the aggregate effect of all contract modifications that occur before the beginning of the earliest period presented or before the date of initial application. Except for the separate presentation of contract assets and contract liabilities in the consolidated statement of financial position, IFRS 15 does not change the presentation in the consolidated statement of financial position or in the consolidated income statement.
The company has updated internal policies and IT systems according to IFRS 15 in order to collect the necessary information for new IFRS 15 disclosures. It is not expected that IFRS 15 will significantly increase the amount of disclosures in the consolidated financial statements of adidas AG.
— IFRS 15 Amendment – Clarifications to IFRS 15 (EU effective date: January 1, 2018): The amendment provides some transition relief for modified and completed contracts and adds guidance for identifying performance obligations, principal vs. agent considerations, and licensing. The company will use the transition relief available for the modified retrospective method related to modified and completed contracts. The transition relief reduces the workload necessary to analyze contracts with customers.
— Improvements to IFRSs (2014–2016) – Amendments to IFRS 1 and IAS 28 (EU effective date: January 1, 2018): These improvements include amendments to IFRS 1 and IAS 28. The amendments to IFRS 1 eliminated the short-term transition exemptions and the amendments to IAS 28 made a clarification about the option for qualifying entities (such as venture capital organizations) to apply either the equity method or fair value through profit or loss to the measurement of associates or joint ventures at initial recognition. These improvements are not expected to have a material impact on the consolidated financial statements.
— IFRS 16 Leases (EU effective date: January 1, 2019): The new standard replaces the guidance in IAS 17 Leases and the respective interpretations IFRIC 4 Determining Whether an Arrangement Contains a Lease, SIC-15 Operating Leases – Incentives and SIC-27 Evaluating the Substance of Transactions Involving the Legal Form of a Lease. IFRS 16 eliminates the required classification of leases into operating and finance leases in accordance with IAS 17, replacing it with a single accounting model requiring lessees to recognize a right-of-use asset and a corresponding lease liability for leases with a lease
ADID
AS
ANN
UAL
REPO
RT 2
017
1591 TO OUR SHAREHOLDERS 2 GROUP MANAGEMENT REPORT –
OUR COMPANY3 GROUP MANAGEMENT REPORT –
FINANCIAL REVIEW4 CONSOLIDATED FINANCIAL
STATEMENTS5 ADDITIONAL INFORMATION
NOTES

term of more than twelve months. The new standard is expected to have a significant impact on the company’s consolidated statement of financial position and the consolidated income statement, in particular upon initial application. adidas has a significant number of operating leases worldwide – mainly pertaining to more than 2,500 rented own-retail stores and rented warehouses.
SEE NOTE 29 Under IFRS 16, these have to be accounted for as right-of-use assets with corresponding lease liabilities in the consolidated statement of financial position. In addition, the nature of the expenses relating to lease obligations is going to change: Depreciation expenses for the right-of-use assets and interest expenses for the lease obligations are to be reported in the consolidated income statement instead of rent expenses, which under IAS 17 were expensed to the consolidated income statement on a straight-line basis over the lease term.The company has continued to collect real estate lease contracts in the global lease management system, which captures relevant information from lease contracts and uses this information to create accounting reports. adidas intends to use this system also for IFRS 16 accounting purposes and is in the process of working with the supplier to ensure system functionality and compliance according to IFRS 16 logic. Based on a completeness survey, the company is internally evaluating which other leased assets fall under the scope of IFRS 16. adidas has decided to apply the modified retrospective method with optional practical expedients as the transition method. The company expects changes to Key Performance Indicators (KPIs), in particular: an extension of the statement of financial position, a decrease in the equity ratio as well as an increase in EBITDA, EBIT, cash used in financing activities and cash generated from operating activities. Further analysis of the expected impact on the company’s consolidated financial statements is still in progress.
The following new standards and interpretations as well as amendments to existing standards and interpretations were
issued by the IASB. These are not yet effective in the EU and hence have not been applied in preparing these consolidated financial statements:
— IFRS 2 Amendment – Classification and Measurement of Share-Based Payment Transactions (IASB effective date: January 1, 2018): The amendment clarifies the accounting treatment for cash-settled share-based payment transactions that include a performance condition, the classification of share-based payment transactions with net settlement features, and the treatment of share-based payment classification due to modifications of the terms and conditions. The company currently accounts for cash-settled share-based payment transactions with performance conditions in line with the upcoming clarified guidance. Additionally, adidas does not currently have share-based payment transactions with net settlement features or regularly modify terms and conditions of share-based payment transactions. This amendment is not expected to have any impact on the company’s consolidated financial statements.
— IFRS 9 Amendment – Prepayment Features with Negative Compensation (IASB effective date: January 1, 2019): The amendment offers additional guidance on how to classify prepayable financial assets according to IFRS 9 and it clarifies the accounting for financial liabilities following a modification. According to the IFRS 9 evaluation, adidas does not have any financial assets with prepayment features. Additionally, the company does not currently expect modifications to financial liabilities. Therefore, this amendment is not expected to have any material impact on the company’s consolidated financial statements.
— IFRS 10 and IAS 28 Amendment – Sale or Contribution of Assets between an Investor and its Associate or Joint Venture (IASB effective date: indefinitely postponed): The amendment addresses an inconsistency between IFRS 10 and IAS 28 regarding the sale or contribution of assets between an investor and its associate or joint venture. This
amendment is not expected to have any material impact on the consolidated financial statements.
— IFRS 17 – Insurance Contracts (IASB effective date: January 1, 2021): The new standard regulates the recognition, measurement, presentation, and disclosure of certain insurance contracts that influence the entity’s financial position, financial performance and cash flows. Insurance contracts which the entity issues, reinsurance contracts the entity holds, and investment contracts with discretionary participation features issued by the entity are all within the scope of the standard. IFRS 17 replaces IFRS 4 Insurance contracts, which is currently not applied by the company. Therefore, the standard is not expected to have any impact on the consolidated financial statements.
— IAS 28 Amendment – Long-term Interests in Associates and Joint Ventures (IASB effective date: January 1, 2019): The amendment clarifies that IFRS 9 Financial Instruments – including the impairment requirements – should be applied to long-term interests in an associate or joint venture forming part of a net investment but for which the equity method is not applied. adidas does not have long-term interests in an associate or joint venture forming part of a net investment but for which the equity method is not applied and which will not be accounted for according to IFRS 9 starting January 1, 2018. Therefore, the amendment is not expected to have any impact on the consolidated financial statements.
— IAS 40 Amendment – Transfers of Investment Property (IASB effective date: January 1, 2018): This amendment clarifies guidance for transfers of property to – or from – investment property. adidas does not have investment property and therefore this amendment will not have an effect on the company’s financial statements.
— IFRIC 22 – Foreign Currency Transactions and Advance Consideration (IASB effective date: January 1, 2018): This new interpretation clarifies the accounting for transactions that include the receipt or payment of advance
ADID
AS
ANN
UAL
REPO
RT 2
017
1601 TO OUR SHAREHOLDERS 2 GROUP MANAGEMENT REPORT –
OUR COMPANY3 GROUP MANAGEMENT REPORT –
FINANCIAL REVIEW4 CONSOLIDATED FINANCIAL
STATEMENTS5 ADDITIONAL INFORMATION
NOTES

consideration in a foreign currency. The interpretation states that the transaction date, for the purpose of determining the exchange rate for received or performed prepayments, is the date of the initial recognition of the non-monetary prepayment asset or deferred income liability. adidas already translates non-monetary items, such as prepayments, at the exchange rate as of the initial recognition date. Therefore, this interpretation is not expected to have an impact on the consolidated financial statements.
— IFRIC 23 – Uncertainty over Income Tax Treatments (IASB effective date: January 1, 2019): This new interpretation applies to income taxes within the scope of IAS 12 Income Taxes and clarifies the accounting for uncertainties in income taxes. In the case of uncertainty regarding the determination of taxable profit/tax loss, tax bases, unused tax losses, unused tax credits and tax rates under IAS 12, this interpretation should be applied. This interpretation is not expected to have an impact on the consolidated financial statements.
— Improvements to IFRSs (2015–2017) – Amendments to IFRS 3, IFRS 11, IAS 12 and IAS 23 (IASB effective date: January 1, 2019): These improvements include amendments to IFRS 3 which clarify that when an entity obtains control of a business that was previously a joint operation, the entity must remeasure its previously held interests in that business. The amendments to IFRS 11 clarify that an entity does not remeasure previously held interests in a business when it assumes joint control of a joint operation. The amendments to IFRS 3 and IFRS 11 would only have a potential impact in the case that the aforementioned transactions take place in the year of initial application. The amendments to IAS 12 clarify that the income tax effects resulting from dividend payments should be presented in the same manner as the income from which the dividends are derived. In other words, the income tax consequences from dividends should
be shown in profit or loss unless the dividend relates to income which is recorded in equity or other comprehensive income. adidas does not expect any effects from this amendment. The amendments to IAS 23 specify that when a qualifying asset has become ready for its intended sale or use, any outstanding borrowed amount is no longer used in the calculation of the capitalization rate for the specific qualifying asset, but instead used in the general capitalization rate for borrowings. adidas currently capitalizes the borrowing costs for one qualifying asset. The amendments to IAS 23 are not expected to have a material impact on the consolidated financial statements.
The consolidated financial statements have in principle been prepared on the historical cost basis with the exception of certain items in the statement of financial position such as: financial instruments valued at fair value through profit or loss, available-for-sale financial assets, derivative financial instruments and plan assets which are measured at fair value.
The consolidated financial statements are presented in euros (€) and, unless otherwise stated, all values are presented in millions of euros (€ in millions). Due to rounding principles, numbers presented may not exactly sum up to totals provided.
02 » SUMMARY OF SIGNIFICANT ACCOUNTING POLICIES
The consolidated financial statements are prepared in accordance with the consolidation, accounting and valuation principles described below.
Principles of consolidationThe consolidated financial statements include the financial statements of adidas AG and all its direct and indirect subsidiaries, which are prepared in accordance with uniform accounting principles. An entity is considered a subsidiary if it is controlled by adidas AG. Control exists when adidas is exposed to, or has rights to, variable returns from its involvement with the investee and has the ability to affect those returns through its power over the investee.
The number of consolidated subsidiaries developed as follows for the years ending December 31, 2017 and December 31, 2016, respectively:
Number of consolidated subsidiaries
2017 2016
January 1 143 145First-time consolidated subsidiaries 3 2
Thereof: newly founded 3 2Thereof: purchased – –
Deconsolidated/divested subsidiaries (17) (3)Intercompany mergers – (1) December 31 129 143
ADID
AS
ANN
UAL
REPO
RT 2
017
1611 TO OUR SHAREHOLDERS 2 GROUP MANAGEMENT REPORT –
OUR COMPANY3 GROUP MANAGEMENT REPORT –
FINANCIAL REVIEW4 CONSOLIDATED FINANCIAL
STATEMENTS5 ADDITIONAL INFORMATION
NOTES

The subsidiaries are held either directly by adidas AG or indirectly via the two holding companies adidas Beteiligungs-gesellschaft mbH in Germany or adidas International B.V. in the Netherlands.
A schedule of the shareholdings of adidas AG is shown in Attachment II to the consolidated financial statements.
SEE SHAREHOLDINGS OF ADIDAS AG, HERZOGENAURACH, P. 215 This schedule comprises information about the name, domicile, currency and equity of all consolidated subsidiaries as well as the respective share held in the capital of these subsidiaries. Furthermore, the schedule of the shareholdings of adidas AG will be published on the electronic platform of the German Federal Gazette.
Within the scope of the first-time consolidation, all acquired assets and liabilities are recognized in the statement of financial position at fair value at the acquisition date. A debit difference between the acquisition cost and the proportionate fair value of assets, liabilities and contingent liabilities is shown as goodwill. A credit difference is recorded in the income statement.
Acquisitions of additional investments in subsidiaries which are already controlled are recorded as equity transactions. Therefore, neither fair value adjustments of assets and liabilities nor gains or losses are recognized. Any difference between the cost for such an additional investment and the carrying amount of the net assets at the acquisition date is recorded directly in shareholders’ equity.
The financial effects of intercompany transactions as well as any unrealized gains and losses arising from intercompany business relations are eliminated in preparing the consolidated financial statements.
Principles of measurementThe following table includes an overview of selected subsequent measurement principles used in the preparation of the consolidated financial statements.
Overview of selected subsequent measurement principles
Item Subsequent measurement principle
AssetsCash and cash equivalents Nominal amountShort-term financial assets At fair value through profit or lossAccounts receivable Amortized costInventories Lower of cost and net realizable valueAssets classified as held for sale Lower of carrying amount and fair value less costs to sellProperty, plant and equipment Amortized costGoodwill Impairment-only approachIntangible assets (except goodwill):
With definite useful life Amortized costWith indefinite useful life Impairment-only approach
Other financial assets (categories according to IAS 39):At fair value through profit or loss At fair value through profit or lossHeld to maturity Amortized costLoans and receivables Amortized costAvailable-for-sale At fair value in other comprehensive income or at amortized cost
LiabilitiesBorrowings Amortized costAccounts payable Amortized costLiabilities/provisions for cash-settled share-basedpayment arrangements Fair valueOther financial liabilities Amortized costProvisions:
Pensions Projected unit credit methodOther provisions Expected settlement amount
Accrued liabilities Amortized cost
ADID
AS
ANN
UAL
REPO
RT 2
017
1621 TO OUR SHAREHOLDERS 2 GROUP MANAGEMENT REPORT –
OUR COMPANY3 GROUP MANAGEMENT REPORT –
FINANCIAL REVIEW4 CONSOLIDATED FINANCIAL
STATEMENTS5 ADDITIONAL INFORMATION
NOTES

Currency translationTransactions in foreign currencies are initially recorded in the respective functional currency by applying the spot exchange rate valid at the transaction date to the foreign currency amount.
In the individual financial statements of subsidiaries, monetary items denominated in non-functional currencies of the subsidiaries are generally translated into the functional currency at closing exchange rates at the balance sheet date. The resulting currency gains and losses are recorded directly in the income statement.
Assets and liabilities of the company’s non-euro functional currency subsidiaries are translated into the presentation currency, the euro, which is also the functional currency of adidas AG, using closing exchange rates at the balance sheet date. For practical reasons, revenues and expenses are translated at average rates for the period which approximate the exchange rates on the transaction dates. All cumulative differences from the translation of equity of foreign subsidiaries resulting from changes in exchange rates are included in a separate item within shareholders’ equity without affecting the income statement.
A summary of exchange rates to the euro for major currencies in which the Group operates is as follows:
Discontinued operationsA component of the company’s business is classified as a discontinued operation if the operations and cash flows of the component can be clearly distinguished, operationally and for financial reporting purposes, from the rest of the company and if the component either has been disposed of or is classified as held for sale, and:
— represents a separate major line of business or geographic area of operations,
— is part of a single coordinated plan to dispose of a separate major line of business or geographic area of operations or
— is a subsidiary acquired exclusively with a view to resale.
When an operation is classified as a discontinued operation, the comparative consolidated income statement and consolidated statement of cash flows are restated and presented as if the operation had been classified as such from the start of the comparative year.
Derivative financial instruments adidas uses derivative financial instruments, such as currency options, forward exchange contracts, commodity futures as well as interest rate swaps and cross-currency interest rate swaps, to hedge its exposure to foreign exchange, commodity price and interest rate risks. In accordance with its Treasury Policy, adidas does not enter into transactions with derivative financial instruments for trading purposes.
Derivative financial instruments are initially recognized in the statement of financial position at fair value, and subsequently also measured at their fair value. The method of recognizing the resulting gains or losses is dependent on the nature of the hedge. On the date a derivative contract is entered into, adidas designates derivatives as either a hedge of a forecast transaction (cash flow hedge) or a hedge of a net investment in a foreign operation.
Changes in the fair value of derivatives that are designated and qualify as cash flow hedges, and that are effective, as defined in IAS 39 ‘Financial instruments: recognition and measurement’, are recognized in equity. When the effectiveness is not 100%, the ineffective portion of the change in the fair value is recognized in the income statement. Accumulated gains and losses in equity are transferred to the income statement in the same periods during which the hedged forecast transaction affects the income statement.
Certain derivative transactions, while providing effective economic hedges under the company’s risk management policies, may not qualify for hedge accounting under the specific rules of IAS 39. Changes in the fair value of any derivative instruments that do not meet these rules are recognized immediately in the income statement.
Hedges of net investments in foreign entities are accounted for in a similar way to cash flow hedges. If the hedging instrument is a derivative (e.g. a forward exchange contract) or a foreign currency borrowing, effective currency gains and losses in the derivative and all gains and losses arising on the translation of the borrowing, respectively, are recognized in equity.
adidas documents the relationship between hedging instruments and hedge objects at transaction inception, as well as the risk management objectives and strategies for undertaking various hedge transactions. This process includes linking all derivatives designated as hedges to specific firm commitments and forecast transactions. adidas also documents its assessment of whether the derivatives that are used in hedging transactions are highly effective by using different methods of effectiveness testing, such as the ‘dollar offset method’ or the ‘hypothetical derivative method’.
Exchange rates
€ 1 equalsAverage rates for the year
ending Dec. 31, Spot rates at Dec. 31,
2017 2016 2017 2016
USD 1.1266 1.1069 1.1993 1.0541GBP 0.8754 0.8188 0.8872 0.8562JPY 126.2381 120.4031 135.0100 123.4000CNY 7.6116 7.3515 7.8365 7.3123RUB 65.5601 74.2778 69.0799 63.9384
ADID
AS
ANN
UAL
REPO
RT 2
017
1631 TO OUR SHAREHOLDERS 2 GROUP MANAGEMENT REPORT –
OUR COMPANY3 GROUP MANAGEMENT REPORT –
FINANCIAL REVIEW4 CONSOLIDATED FINANCIAL
STATEMENTS5 ADDITIONAL INFORMATION
NOTES

The fair values of currency options, forward exchange contracts and commodity futures are determined on the basis of market conditions on the reporting dates. The fair value of a currency option is determined using generally accepted models to calculate option prices. The fair value of an option is influenced not only by the remaining term of the option but also by additional factors, such as the actual foreign exchange rate and the volatility of the underlying foreign currency base. Fair values are determined taking into consideration the counterparty risk. adidas has exercised the option to calculate the amounts on counterparty level according to IFRS 13 ‘Fair Value Measurement’, paragraph 48.
Cash and cash equivalentsCash and cash equivalents represent cash at banks, cash on hand and short-term deposits with maturities of three months or less from the date of acquisition.
Cash equivalents are short-term, highly liquid investments that are readily convertible to known amounts of cash and which are subject to an insignificant risk of changes in value.
Receivables and other financial assets Receivables and other financial assets are recognized at fair value, which corresponds to the nominal value for current receivables and other financial assets. For non-current receivables and other financial assets, the fair value is estimated as the present value of future cash flows discounted at the market rate of interest at the balance sheet date. Subsequently, these are measured at amortized cost using the ‘effective interest method’. Required allowances, if necessary, are determined on the basis of individual risk assessments, and on the aging structure of receivables past due.
InventoriesMerchandise and finished goods are valued at the lower of cost or net realizable value, which is the estimated selling
price in the ordinary course of business less the estimated costs of completion and the estimated costs necessary to make the sale. Costs are determined using a standard valuation method: the ‘average cost method’. Costs of finished goods include cost of raw materials, direct labor and the components of the manufacturing overheads which can be reasonably attributed to finished goods. The allocation of overheads is based on the planned average utilization. The net realizable value allowances are computed consistently throughout the company based on the age and expected future sales of the items on hand.
Assets/liabilities and disposal groups classified as held for sale Assets/liabilities and disposal groups classified as held for sale are primarily non-current assets and liabilities expected to be recovered principally through sale rather than through continuing use. These are measured at the lower of their carrying amount and fair value less costs to sell. Assets classified as held for sale are not depreciated on a straight-line basis.
Property, plant and equipmentProperty, plant and equipment are measured at amortized cost. This comprises any costs directly attributable to bringing the asset to the condition necessary for it to be capable of operating in the manner intended by Management less any accumulated depreciation and accumulated impairment losses. Depreciation is recognized for those assets, with the exception of land and construction in progress, over the estimated useful life utilizing the ‘straight-line method’ and taking into account any potential residual value, except where the ‘declining-balance method’ is more appropriate in light of the actual utilization pattern. Parts of an item of property, plant and equipment with a cost that is significant in relation to the total cost of the item are depreciated separately.
Land leases are measured at the lower of the fair value or the present value of minimum lease payments and are depreciated on a straight-line basis over the contractually agreed lease term.
Estimated useful lives are as follows:
Expenditures for repairs and maintenance are expensed as incurred. Renewals and improvements are capitalized and depreciated separately, if the recognition criteria are met.
Impairment losses If facts and circumstances indicate that non-current assets (e.g. property, plant and equipment and intangible assets including goodwill) might be impaired, the recoverable amount is determined. It is measured at the higher of its fair value less costs of disposal and value in use. Non-financial items measured at the recoverable amount primarily relate to impaired property, plant and equipment being measured based on value in use or on fair value taking unobservable inputs (e.g. profit or cash flow planning) into account. The fair value is measured at Level 3 according to IFRS 13 ‘Fair Value Measurement’.
Estimated useful lives of property, plant and equipment
Years
Land indefiniteLand leases 50 – 99Buildings and leasehold improvements 20 – 50 1
Furniture and fixtures 3 – 5Technical equipment and machinery as well as other equipment 2 – 10 1
1 Or, if shorter, the lease term/useful life. SEE NOTE 29
ADID
AS
ANN
UAL
REPO
RT 2
017
1641 TO OUR SHAREHOLDERS 2 GROUP MANAGEMENT REPORT –
OUR COMPANY3 GROUP MANAGEMENT REPORT –
FINANCIAL REVIEW4 CONSOLIDATED FINANCIAL
STATEMENTS5 ADDITIONAL INFORMATION
NOTES
An impairment loss is recognized in other operating expenses or reported in goodwill impairment losses if the carrying amount exceeds the recoverable amount.
The impairment test for goodwill is performed based on groups of cash-generating units which represent the lowest level within the company at which goodwill is monitored for internal management purposes. If there is an impairment loss for a group of cash-generating units, first the carrying amount of any goodwill allocated to the group of cash-generating units is reduced. Subsequently, provided that the recoverable amount is lower than the carrying amount, the other non-current assets of the group of cash-generating units are reduced pro rata on the basis of the carrying amount of each asset in the group of cash-generating units.
Irrespective of whether there is an impairment indication, intangible assets with an indefinite useful life (in particular trademarks) and goodwill acquired in business combinations are tested annually on September 30 for impairment.
An impairment loss recognized in goodwill is not reversible. With respect to all other impaired assets, an impairment loss recognized in prior periods is reversed affecting the income statement if there has been a change in the estimates used to determine the recoverable amount. An impairment loss is reversed only to the extent that the asset’s carrying amount does not exceed the carrying amount that would have been determined (net of depreciation or amortization) if no impairment loss had been recognized.
Impairment losses for financial assets are recognized when, as a result of one or more events that occurred after the initial recognition of the financial asset, there is objective evidence that a financial asset is impaired. The amount of the impairment loss is measured as the difference between the asset’s carrying amount and the present value of estimated
future cash flows discounted at the financial asset’s original effective interest rate, or as the difference between amortized cost and the fair value considering previous impairment losses.
LeasesUnder finance lease arrangements, the substantial risks and rewards associated with an asset are transferred to the lessee. At the beginning of the lease arrangement, the respective asset and a corresponding liability are recognized at the fair value of the asset or, if lower, the net present value of the minimum lease payments. For subsequent measurement, minimum lease payments are apportioned between the finance expense and the reduction of the outstanding liability. The finance expense is allocated to each period during the lease term so as to produce a constant periodic interest rate on the remaining balance of the liability. In addition, depreciation and any impairment losses for the associated assets are recognized. Depreciation is performed over the lease term or, if shorter, over the useful life of the asset.
Under operating lease agreements, rent expenses are recognized on a straight-line basis over the term of the lease.
Goodwill Goodwill is an asset representing the future economic benefits arising from assets acquired in a business combination that are not individually identified and separately recognized. This results when the purchase cost exceeds the fair value of acquired identifiable assets, liabilities and contingent liabilities. Goodwill arising from the acquisition of a foreign entity and any fair value adjustments to the carrying amounts of assets, liabilities and contingent liabilities of that foreign entity are treated as assets, liabilities and contingent liabilities of the respective reporting entity, and are translated at exchange rates prevailing at the date of the initial consolidation.
Goodwill is carried in the functional currency of the acquired foreign entity.
Intangible assets (except goodwill)Intangible assets are valued at amortized cost. Amortization is calculated on a straight-line basis taking into account any potential residual value.
Expenditures during the development phase of internally generated intangible assets are capitalized as incurred if they qualify for recognition under IAS 38 ‘Intangible Assets’.
Estimated useful lives are as follows:
Research and developmentResearch costs are expensed in full as incurred. Development costs for internally generated intangible assets are also expensed as incurred if they do not meet the recognition criteria of IAS 38 ‘Intangible Assets’, paragraph 57.
Financial assetsAll purchases and sales of financial assets are recognized on the trade date and initially measured at fair value. Available-for-sale financial assets include non-derivative financial assets which are not allocable under another category of IAS 39. If their respective fair value can be measured reliably, they are subsequently carried at fair value. If this is not the case, these are measured at cost. Realized and unrealized
Estimated useful lives of intangible assets
Years
Trademarks indefinite 1
Software 5 – 7Patents and licenses 5 – 15Websites 2
1 For exceptions SEE NOTE 14
ADID
AS
ANN
UAL
REPO
RT 2
017
1651 TO OUR SHAREHOLDERS 2 GROUP MANAGEMENT REPORT –
OUR COMPANY3 GROUP MANAGEMENT REPORT –
FINANCIAL REVIEW4 CONSOLIDATED FINANCIAL
STATEMENTS5 ADDITIONAL INFORMATION
NOTES
gains and losses arising from changes in the fair value of financial assets are included in the income statement for the period in which they arise, except for available-for-sale financial assets where unrealized gains and losses are recognized in equity unless they are impaired.
Borrowings and other liabilities Borrowings (e.g. Eurobonds) and other liabilities are recognized at fair value using the ‘effective interest method’, net of transaction costs incurred. In subsequent periods, long-term borrowings are stated at amortized cost using the ‘effective interest method’. Any difference between proceeds (net of transaction costs) and the redemption value is recognized in the income statement over the term of the borrowing.
Compound financial instruments (e.g. convertible bonds) are divided into a liability component shown under borrowings and into an equity component resulting from conversion rights. The equity component is included in the capital reserve. The fair value of the liability component is determined by discounting the interest and principal payments of a comparable liability without conversion rights, applying risk-adjusted interest rates. The liability component is subsequently measured at amortized cost using the ‘effective interest method’. The equity component is determined as the difference between the fair value of the total compound financial instrument and the fair value of the liability component and is reported within equity. There is no subsequent measurement of the equity component. At initial recognition, directly attributable transaction costs are assigned to the equity and liability component pro rata on the basis of the respective carrying amounts.
Provisions and accrued liabilitiesOther provisions are recognized where a present obligation (legal or constructive) to third parties has been incurred as a
result of a past event which can be estimated reliably and is likely to lead to an outflow of resources, and where the timing or amount is uncertain. Other non-current provisions are discounted if the effect of discounting is material.
Accrued liabilities are liabilities to pay for goods or services that have been received or supplied but have not been paid, invoiced or formally agreed with the supplier, including amounts due to employees. Here, however, the timing and amount of an outflow of resources is not uncertain.
Pensions and similar obligations Provisions and expenses for pensions and similar obligations relate to the company’s obligations for defined benefit and defined contribution plans. The obligations under defined benefit plans are determined separately for each plan by valuing the employee benefits accrued in return for their service during the current and prior periods. These benefit accruals are discounted to calculate their present value, and the fair value of any plan assets is deducted in order to determine the net liability. The discount rate is set on the basis of yields of high-quality corporate bonds at the balance sheet date provided there is a deep market for high-quality corporate bonds in a given currency. Otherwise, government bond yields are used as a reference. Calculations are performed by qualified actuaries using the ‘projected unit credit method’ in accordance with IAS 19 ‘Employee Benefits’. Obligations for contributions to defined contribution plans are recognized as an expense in the income statement as incurred.
Contingent liabilitiesContingent liabilities are possible obligations that arise from past events and whose existence will be confirmed only by the occurrence of one or more uncertain future events not wholly within the control of adidas. Additionally, contingent liabilities may be present obligations that arise from past events but
which are not recognized because it is not probable that an outflow of resources will be required to settle the obligation or the amount of the obligation cannot be measured with sufficient reliability. Contingent liabilities are not recognized in the consolidated statement of financial position but are disclosed and explained in the Notes. SEE NOTE 39
Treasury sharesWhen treasury shares recognized as equity are repurchased, the amount of the consideration paid, which includes directly attributable costs, net of any tax effects, is recognized as a deduction from equity. The nominal value of € 1 per treasury share is debited to share capital. Any premium or discount to the nominal value is shown as an adjustment to the capital reserve. If treasury shares are sold or re-issued, the nominal value of the shares will be credited to share capital and the amount exceeding the nominal value will be added to the capital reserve.
RevenueRevenue in terms of income derived from the sale of goods is recognized when the significant risks and rewards of ownership of the goods are transferred to the buyer and when adidas does not retain any continuing managerial involvement with the goods. The timing of the transfer of significant risks and rewards depends on the individual terms of the sales agreement (terms of delivery). In addition, revenue from the sale of goods is only recognized when the amount of revenue as well as associated costs can be measured reliably and when it is probable that the economic benefits associated with the transaction will flow to the company.
Revenue is measured at the fair value of the consideration received or receivable, net of returns, early payment discounts and rebates.
ADID
AS
ANN
UAL
REPO
RT 2
017
1661 TO OUR SHAREHOLDERS 2 GROUP MANAGEMENT REPORT –
OUR COMPANY3 GROUP MANAGEMENT REPORT –
FINANCIAL REVIEW4 CONSOLIDATED FINANCIAL
STATEMENTS5 ADDITIONAL INFORMATION
NOTES

Under certain conditions and in accordance with contractual agreements, customers of adidas have the right to return products and to either exchange them for similar or other products or to return the products against the issuance of a credit note. Revenue related to estimated returns is accrued based on past experience by means of a provision for returns, allowances and warranty. SEE NOTE 20
Provided that the customers meet certain pre-defined conditions, adidas grants its customers different types of globally aligned performance-based rebates. Examples are sales growth and loyalty as well as sell-out support, e.g. through retail space management/franchise stores. When it is assumed that the customer fulfills the requirements for being granted the rebate, this amount is accrued by means of an accrued liability for marketing and sales. SEE NOTE 21
In addition, adidas generates revenue from the licensing-out of the right to use the adidas and Reebok brands as well as various other trademarks to third parties. The related royalty and commission income is recognized based on the contract terms on an accrual basis.
Advertising and promotional expendituresAdvance payments for media campaigns are included in prepaid expenses (other current and non-current assets) until the services are received, and upon receipt expensed in full. Significant costs for media campaigns are expensed over the duration of the media campaign.
Promotional expenses including one-time up-front payments for promotion contracts are principally expensed on a straight-line basis over the term of the agreement.
Interest Interest is recognized as income or expense as incurred using the ‘effective interest method’ with the exception of interest
that is directly attributable to the acquisition, construction or production of a qualifying asset. This interest is capitalized as part of the cost of the qualifying asset.
Government grants adidas receives government grants related to income in the form of subsidies, subventions or premiums from local, national or international government authorities such as those of the Federal Republic of Germany, the European Union and the Free State of Bavaria.
Government grants related to income are recognized if there is reasonable assurance that the grants will be received and that adidas will comply with the conditions attached.
Grants related to income are reported in the consolidated income statement as a deduction from the related expenses.
Income taxes Current income taxes are computed in accordance with the applicable taxation rules established in the countries in which adidas operates.
adidas computes deferred taxes for all temporary differences between the carrying amount and the tax base of its assets and liabilities and tax loss carry-forwards. As it is not permitted to recognize a deferred tax liability for the initial recognition of goodwill, adidas does not compute any deferred taxes thereon.
Deferred tax assets arising from deductible temporary differences and tax loss carry-forwards which exceed taxable temporary differences are only recognized to the extent that it is probable that the entity concerned will generate sufficient taxable income to realize the associated benefit.
Income tax is recognized in the income statement except to the extent that it relates to items recognized directly in equity, in which case it is recognized in equity.
Share-based paymentThe cost of equity-settled share-based payment transactions with employees is determined by the fair value at the grant date using an appropriate valuation model. SEE NOTE 27 That cost is recognized in personnel expenses, together with a corresponding increase in equity (retained earnings), over the period in which the service and, where applicable, the performance conditions are fulfilled (the vesting period). The cumulative expense recognized for equity-settled transactions at each reporting date until the vesting date reflects the extent to which the vesting period has expired and the company’s best estimate of the number of equity instruments that will ultimately vest.
Service and non-market performance conditions are not taken into account when determining the fair value of awards at the grant date, but the likelihood of the conditions being met is assessed as part of the company’s best estimate of the number of equity instruments that will ultimately vest. If the estimate is changed, even a credit in the income statement for the period can be possible as it reflects the movement in cumulative expenses from the beginning to the end of that period.
No expense is recognized for awards that do not ultimately vest because non-market performance and/or service conditions have not been met.
Equity-settled share-based payment transactions with parties other than employees are generally measured at the fair value of the goods or services received, except where the fair value cannot be estimated reliably, in which case they are measured at the fair value of the equity instruments granted,
ADID
AS
ANN
UAL
REPO
RT 2
017
1671 TO OUR SHAREHOLDERS 2 GROUP MANAGEMENT REPORT –
OUR COMPANY3 GROUP MANAGEMENT REPORT –
FINANCIAL REVIEW4 CONSOLIDATED FINANCIAL
STATEMENTS5 ADDITIONAL INFORMATION
NOTES

measured at the date the entity obtains the goods or the counterparty renders the service.
For cash-settled share-based payment transactions, the goods or services acquired and the liability incurred are measured at the fair value of the liability. Until the liability is settled, the fair value of the liability is remeasured at each end of the reporting period and at the date of settlement, with any changes in fair value recognized in profit or loss for the period.
Estimation uncertainties and judgmentsThe preparation of financial statements in conformity with IFRS requires the use of assumptions and estimates that affect reported amounts and related disclosures. Although such estimates are based on the best knowledge of current events and actions, actual results may ultimately differ from these estimates.
The key assumptions concerning the future and other key sources of estimation uncertainty at the balance sheet date which have a significant risk of causing a material adjustment to the carrying amounts of assets and liabilities within the next financial year are outlined in the respective Notes, in particular goodwill SEE NOTE 13, trademarks SEE NOTE 14,
other provisions SEE NOTE 20, pensions SEE NOTE 24, derivatives SEE NOTE 30, deferred taxes SEE NOTE 35, as well as litigation
and other legal risks SEE NOTE 39.
Judgments have also been used in classifying leasing arrangements as well as in determining valuation methods for intangible assets.
03 » DISCONTINUED OPERATIONSOn May 10, 2017, adidas signed a definitive agreement to sell its TaylorMade business including the brands TaylorMade, Adams Golf and Ashworth (together TaylorMade). The transaction was completed on October 2, 2017. The TaylorMade business is reported as discontinued operations. The consideration was paid in cash and via a combination of a secured note and contingent considerations of which the fair values were estimated by applying the discounted cash flow model and Monte Carlo method, respectively. SEE NOTE 04
On July 26, 2017, adidas signed an agreement to sell the CCM Hockey business. The transaction was completed on September 1, 2017. The CCM Hockey business is reported as discontinued operations. The consideration was paid in cash and in the form of a secured note. The fair value of the secured note was estimated by applying the discounted cash flow method. SEE NOTE 04
The net result of discontinued operations presented in the consolidated income statement as at December 31, 2017 also contains the fair value adjustment of the contingent considerations as well as allowances for outstanding receivables in connection with the sale of the Rockport operating segment in July 2015.
TaylorMade and CCM Hockey were classified as assets held for sale and discontinued operations for the first time as of May 10, 2017 and June 30, 2017, respectively. The prior year figures of the consolidated statement of cash flows have been restated to show the discontinued operations separately from continuing operations.
The results of the Rockport, TaylorMade and CCM operations are shown as discontinued operations in the consolidated income statement:
The loss from discontinued operations in an amount of € 254 million (2016: € 62 million) was entirely attributable to the shareholders of adidas AG.
Discontinued operations € in millions
Year ending Dec. 31,
2017
Year ending Dec. 31,
2016
Net sales 667 808Expenses (666) (895)Gain/(loss) from operating activities 1 (87)Income taxes 0 27Gain/(loss) from operating activities, net of tax 1 (60)(Loss) from the sale of discontinued operations (304) (3)Income taxes 48 1(Loss) from the sale of discontinued operations, net of tax (256) (2)(Loss) from discontinued operations, net of tax (254) (62)Basic earnings per share from discontinued operations (€) (1.26) (0.31)Diluted earnings per share from discontinued operations (€) (1.26) (0.31)
ADID
AS
ANN
UAL
REPO
RT 2
017
1681 TO OUR SHAREHOLDERS 2 GROUP MANAGEMENT REPORT –
OUR COMPANY3 GROUP MANAGEMENT REPORT –
FINANCIAL REVIEW4 CONSOLIDATED FINANCIAL
STATEMENTS5 ADDITIONAL INFORMATION
NOTES

04 » DISPOSAL OF SUBSIDIARIES AS WELL AS ASSETS AND LIABILITIES
The divestiture of the TaylorMade business was completed on October 2, 2017. The total purchase price amounted to US $ 425 million consisting of US $ 200 million in cash, a promissory note in an amount of US $ 100 million and earn-out components in an amount of US $ 125 million. In 2017, a preliminary cash consideration of US $ 155 million was received for which the cash component of US $ 200 million was adjusted mainly due to lower estimated net working capital compared to target net working capital and the net cash transferred. The assets and liabilities, which were reported as assets/liabilities held for sale since May 10, 2017 due to the concrete plans to sell the business, were consequently derecognized from the consolidated statement of financial position as of October 2, 2017. For the impact of the divestiture on the items in the consolidated statement of financial position SEE NOTE 38 The TaylorMade business is part of Other Businesses (discontinued operations).
The divestiture of the CCM Hockey business was completed on September 1, 2017 for a preliminary cash consideration of US $ 76 million plus a promissory note amounting to US $ 40 million. The assets and liabilities which were reported as assets/liabilities held for sale since June 30, 2017 due to the concrete plans to sell the business were consequently derecognized from the consolidated statement of financial position as of September 1, 2017. For the impact of the divestiture on the items in the consolidated statement of financial position SEE NOTE 38 The CCM Hockey business is part of Other Businesses (discontinued operations).
As of June 30, 2016 (closing date), the company formally completed the divestiture of the Mitchell & Ness business. The preliminary purchase price amounted to US $ 75 million in total. According to the purchase agreement, the first half of the total purchase price was received in cash and for the other
half a promissory note was issued by the buyer. All contractually agreed closing assets were transferred by adidas at the closing date. This was followed by a transition service period which ended on June 30, 2017. The final purchase price will be determined in early 2018. In 2016, a resulting gain from this transaction in an amount of € 39 million was accounted for as other operating income.
SEE NOTE 31
NOTES TO THE CONSOLIDATED STATEMENT OF FINANCIAL POSITION
05 » CASH AND CASH EQUIVALENTSCash and cash equivalents consist of cash at banks, cash on hand and short-term deposits.
Short-term deposits are only shown as cash and cash equivalents if they are readily convertible to a known amount of cash and are subject to an insignificant risk of changes in value.
06 » SHORT-TERM FINANCIAL ASSETSShort-term financial assets are classified ‘at fair value through profit or loss’. Changes in the fair value are recognized in the consolidated income statement as they occur.
The majority of short-term financial assets are marketable securities.
07 » ACCOUNTS RECEIVABLEAccounts receivable consist mainly of the currencies US dollar, euro, Chinese renminbi as well as Japanese yen and are as follows:
With respect to accounts receivable as at the balance sheet date past due but not impaired, based on credit history and current credit ratings, there are no indications that customers will not be able to meet their obligations.
Accounts receivable € in millions
Dec. 31, 2017
Dec. 31, 2016
Accounts receivable, gross 2,484 2,377 Less: accumulated allowances for doubtful accounts (169) (177) Accounts receivable, net 2,315 2,200
Movement in allowances for doubtful accounts € in millions
2017 2016
Allowances at January 1 177 149Additions 46 76 Reversals (39) (41) Write-offs charged against the allowance accounts (9) (8) Currency translation differences (7) 0Other changes 0 0 Allowances at December 31 169 177
Accounts receivable past due but not impaired € in millions
Past due 1 – 30 days
Past due 31 – 60
days
Past due 61 – 90
days
Past due 91 – 180
days
Past due > 180 days
Dec. 31, 2017 153 61 6 4 2 Dec. 31, 2016 164 63 11 5 6
ADID
AS
ANN
UAL
REPO
RT 2
017
1691 TO OUR SHAREHOLDERS 2 GROUP MANAGEMENT REPORT –
OUR COMPANY3 GROUP MANAGEMENT REPORT –
FINANCIAL REVIEW4 CONSOLIDATED FINANCIAL
STATEMENTS5 ADDITIONAL INFORMATION
NOTES

Further, no indications of default are recognizable for accounts receivable that are neither past due nor impaired.
For further information about credit risks SEE RISK AND
OPPORTUNITY REPORT, P. 131
08 » OTHER CURRENT FINANCIAL ASSETSOther current financial assets consist of the following:
Goods in transit mainly relate to shipments of finished goods and merchandise from suppliers in Asia to subsidiaries in Europe, Asia, North America and Latin America.
10 » OTHER CURRENT ASSETS Other current assets consist of the following:The line item ‘Sundry’ mainly relates to a secured promissory
note in the amount of € 31 million which is part of the divestiture of the Mitchell & Ness business as well as to credit cards and similar receivables. The secured promissory note will be due upon finalization of the sale of Mitchell & Ness in 2018.
Other current financial assets include accumulated allowances in the amount of € 51 million.
For further information about currency options and forward exchange contracts SEE NOTE 30
Prepaid expenses mainly relate to promotion and service contracts as well as rents.
11 » ASSETS/LIABILITIES AND DISPOSAL GROUPS CLASSIFIED AS HELD FOR SALE
At December 31, 2017, assets/liabilities held for sale comprise a building of Reebok International Ltd. in an amount of € 72 million. The Reebok headquarters was moved from Canton to Boston in September 2017. From this moment on, the land and building were readily sellable and therefore reported as ‘Assets classified as held for sale’.
At December 31, 2017, impairment loses (before transaction costs) of € 1 million were included in operating profit.
09 » INVENTORIES Inventories by major classification are as follows:
Other current financial assets € in millions
Dec. 31, 2017
Dec. 31, 2016
Currency options 12 20Forward exchange contracts 98 348Security deposits 44 81Financial assets related to the early termination of promotion contracts – 77Promissory notes – 15Sundry 239 187Other current financial assets 393 729
Inventories € in millions
Dec. 31, 2017 Dec. 31, 2016
Grossvalue
Allowance for
obsoles-cence
Netvalue
Grossvalue
Allowance for
obsoles-cence
Netvalue
Merchandise and finished goods on hand 2,716 (132) 2,584 2,748 (170) 2,578Goods in transit 1,103 – 1,103 1,151 – 1,151Raw materials 5 – 5 35 (2) 34Work in progress 0 – 0 1 – 1Inventories 3,824 (132) 3,692 3,935 (172) 3,763
Other current assets € in millions
Dec. 31, 2017
Dec. 31, 2016
Prepaid expenses 261 311Tax receivables other than income taxes 146 180Sundry 99 97Other current assets, gross 506 588Less: accumulated allowances (8) (8)Other current assets, net 498 580
ADID
AS
ANN
UAL
REPO
RT 2
017
1701 TO OUR SHAREHOLDERS 2 GROUP MANAGEMENT REPORT –
OUR COMPANY3 GROUP MANAGEMENT REPORT –
FINANCIAL REVIEW4 CONSOLIDATED FINANCIAL
STATEMENTS5 ADDITIONAL INFORMATION
NOTES

12 » PROPERTY, PLANT AND EQUIPMENTProperty, plant and equipment consist of the following:
Depreciation expenses were € 358 million and € 303 million for the years ending December 31, 2017 and 2016, respectively.
SEE NOTE 32
As a general principle, it is regularly assessed whether there are any indications that furniture and fixtures might be impaired. Irrespective of the existence of such indications, furniture and fixtures in own-retail stores are tested annually for impairment whereby the recoverable amount is calculated using the discounted cash flow method as part of determining the profitability of the respective own-retail stores. Impairment losses amounted to € 13 million and € 10 million for the years ending December 31, 2017 and 2016, respectively. SEE NOTE 32 These are related to other equipment, furniture and fixtures as well as buildings and leasehold improvements, mainly in the company’s own-retail activities, for which contrary to expectations there will be an insufficient flow of future economic benefits. In 2017, reversals of impairment losses were recorded in an amount of € 1 million (2016: € 2 million).
The increase in the line item ‘Construction in progress, net’ mainly relates to investments in the company’s headquarters in Herzogenaurach and to the expansion of the warehouse in Rieste, Germany.
Additionally, borrowing costs in an amount of € 1 million (2016: € 1 million) related to the construction of qualifying assets at adidas AG were capitalized using a capitalization rate of 1.3% (2016: 1.3%).
For details see Attachment I to the consolidated financial statements SEE STATEMENT OF MOVEMENTS OF INTANGIBLE AND TANGIBLE
ASSETS, P. 213
13 » GOODWILL Goodwill primarily relates to the acquisitions of the Reebok, TaylorMade and Runtastic businesses as well as acquisitions of subsidiaries, primarily in the USA, Australia, New Zealand, the Netherlands, Denmark and Italy.
The majority of goodwill, which primarily relates to the acquisition of the Reebok business in 2006, is denominated in US dollars. A currency translation effect of negative € 78 million and positive € 20 million was recorded for the years ending December 31, 2017 and 2016, respectively.
adidas determines whether goodwill impairment is necessary at least on an annual basis. The impairment test for goodwill is performed based on groups of cash-generating units which
represent the lowest level within the company at which goodwill is monitored for internal management purposes. This requires an estimation of the recoverable amount of the groups of cash-generating units to which the goodwill is allocated. The recoverable amount of a group of cash-generating units is determined on the basis of value in use. Estimating the value in use requires adidas to make an estimate of the expected future cash flows from the groups of cash-generating units and also to choose a suitable discount rate in order to calculate the present value of those cash flows.
This calculation uses cash flow projections based on the financial planning covering a three-year period in total. The planning is based on long-term expectations of the company and reflects in total for the groups of cash-generating units an average annual mid-single- to low-double-digit sales increase with varying forecast growth prospects for the different groups of cash-generating units. Furthermore, adidas expects the operating margin to expand, primarily driven by an improvement in the gross margin as well as lower operating expenses as a percentage of sales. The planning for capital expenditure and working capital is primarily based on past experience. The planning for future tax payments is based on current statutory corporate tax rates of the individual groups of cash-generating units. Cash flows beyond this three-year period are extrapolated using steady growth rates of 1.7% (2016: 1.7%). According to the company’s expectations, these growth rates do not exceed the long-term average growth rate of the business sector in which the respective group of cash-generating units operates.
Discount rates are based on a weighted average cost of capital calculation considering a five-year average market-weighted debt/equity structure and financing costs referencing major competitors for the respective group of cash-generating units. The discount rates used are after-tax rates and reflect
Property, plant and equipment € in millions
Dec. 31, 2017
Dec. 31, 2016
Land, land leases, buildings and leasehold improvements 1,242 1,395Technical equipment and machinery 288 325Other equipment as well as furniture and fixtures 1,721 1,710 3,251 3,430Less: accumulated depreciation and impairment losses (1,629) (1,733) 1,622 1,697Construction in progress, net 378 218Property, plant and equipment, net 2,000 1,915
Goodwill € in millions
Dec. 31, 2017
Dec. 31, 2016
Goodwill, gross 1,675 1,908Less: accumulated impairment losses (454) (496)Goodwill, net 1,220 1,412
ADID
AS
ANN
UAL
REPO
RT 2
017
1711 TO OUR SHAREHOLDERS 2 GROUP MANAGEMENT REPORT –
OUR COMPANY3 GROUP MANAGEMENT REPORT –
FINANCIAL REVIEW4 CONSOLIDATED FINANCIAL
STATEMENTS5 ADDITIONAL INFORMATION
NOTES
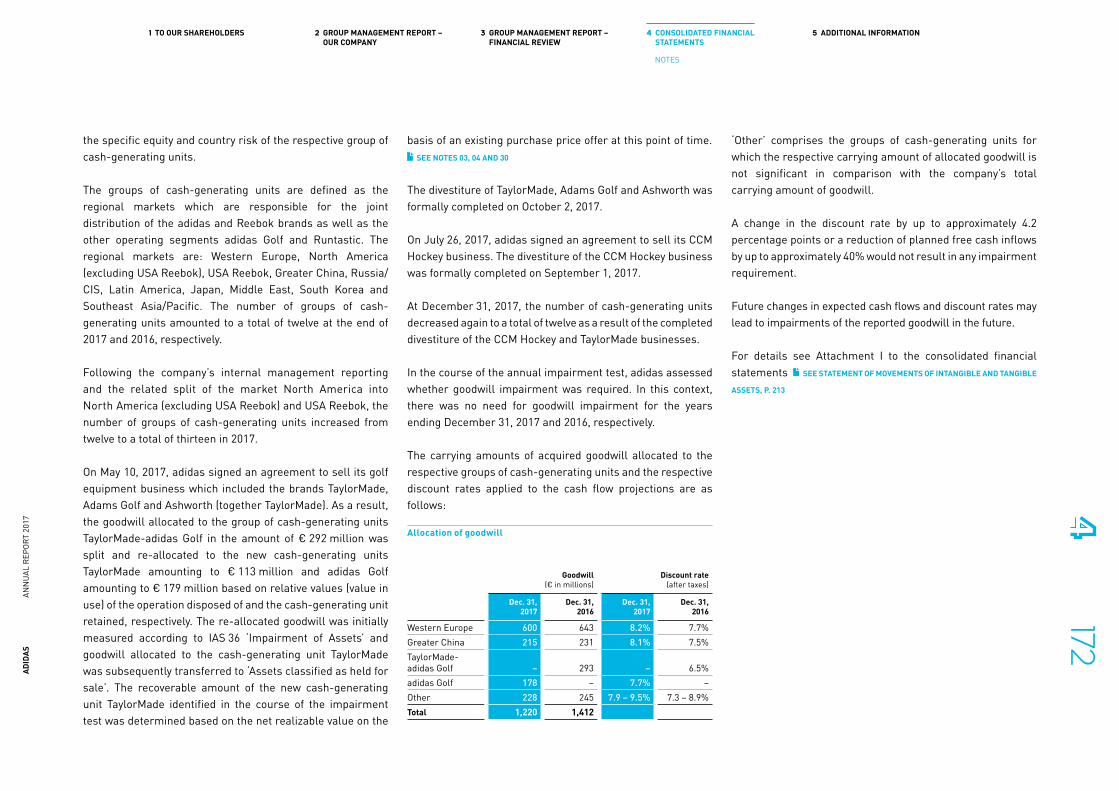
the specific equity and country risk of the respective group of cash-generating units.
The groups of cash-generating units are defined as the regional markets which are responsible for the joint distribution of the adidas and Reebok brands as well as the other operating segments adidas Golf and Runtastic. The regional markets are: Western Europe, North America (excluding USA Reebok), USA Reebok, Greater China, Russia/CIS, Latin America, Japan, Middle East, South Korea and Southeast Asia/Pacific. The number of groups of cash-generating units amounted to a total of twelve at the end of 2017 and 2016, respectively.
Following the company’s internal management reporting and the related split of the market North America into North America (excluding USA Reebok) and USA Reebok, the number of groups of cash-generating units increased from twelve to a total of thirteen in 2017.
On May 10, 2017, adidas signed an agreement to sell its golf equipment business which included the brands TaylorMade, Adams Golf and Ashworth (together TaylorMade). As a result, the goodwill allocated to the group of cash-generating units TaylorMade- adidas Golf in the amount of € 292 million was split and re-allocated to the new cash-generating units TaylorMade amounting to € 113 million and adidas Golf amounting to € 179 million based on relative values (value in use) of the operation disposed of and the cash-generating unit retained, respectively. The re-allocated goodwill was initially measured according to IAS 36 ‘Impairment of Assets’ and goodwill allocated to the cash-generating unit TaylorMade was subsequently transferred to ‘Assets classified as held for sale’. The recoverable amount of the new cash-generating unit TaylorMade identified in the course of the impairment test was determined based on the net realizable value on the
basis of an existing purchase price offer at this point of time. SEE NOTES 03, 04 AND 30
The divestiture of TaylorMade, Adams Golf and Ashworth was formally completed on October 2, 2017.
On July 26, 2017, adidas signed an agreement to sell its CCM Hockey business. The divestiture of the CCM Hockey business was formally completed on September 1, 2017.
At December 31, 2017, the number of cash-generating units decreased again to a total of twelve as a result of the completed divestiture of the CCM Hockey and TaylorMade businesses.
In the course of the annual impairment test, adidas assessed whether goodwill impairment was required. In this context, there was no need for goodwill impairment for the years ending December 31, 2017 and 2016, respectively.
The carrying amounts of acquired goodwill allocated to the respective groups of cash-generating units and the respective discount rates applied to the cash flow projections are as follows:
‘Other’ comprises the groups of cash-generating units for which the respective carrying amount of allocated goodwill is not significant in comparison with the company’s total carrying amount of goodwill.
A change in the discount rate by up to approximately 4.2 percentage points or a reduction of planned free cash inflows by up to approximately 40% would not result in any impairment requirement.
Future changes in expected cash flows and discount rates may lead to impairments of the reported goodwill in the future.
For details see Attachment I to the consolidated financial statements SEE STATEMENT OF MOVEMENTS OF INTANGIBLE AND TANGIBLE
ASSETS, P. 213
Allocation of goodwill
Goodwill (€ in millions)
Discount rate (after taxes)
Dec. 31, 2017
Dec. 31, 2016
Dec. 31, 2017
Dec. 31, 2016
Western Europe 600 643 8.2% 7.7%Greater China 215 231 8.1% 7.5%TaylorMade-adidas Golf – 293 – 6.5%adidas Golf 178 – 7.7% –Other 228 245 7.9 – 9.5% 7.3 – 8.9%Total 1,220 1,412
ADID
AS
ANN
UAL
REPO
RT 2
017
1721 TO OUR SHAREHOLDERS 2 GROUP MANAGEMENT REPORT –
OUR COMPANY3 GROUP MANAGEMENT REPORT –
FINANCIAL REVIEW4 CONSOLIDATED FINANCIAL
STATEMENTS5 ADDITIONAL INFORMATION
NOTES
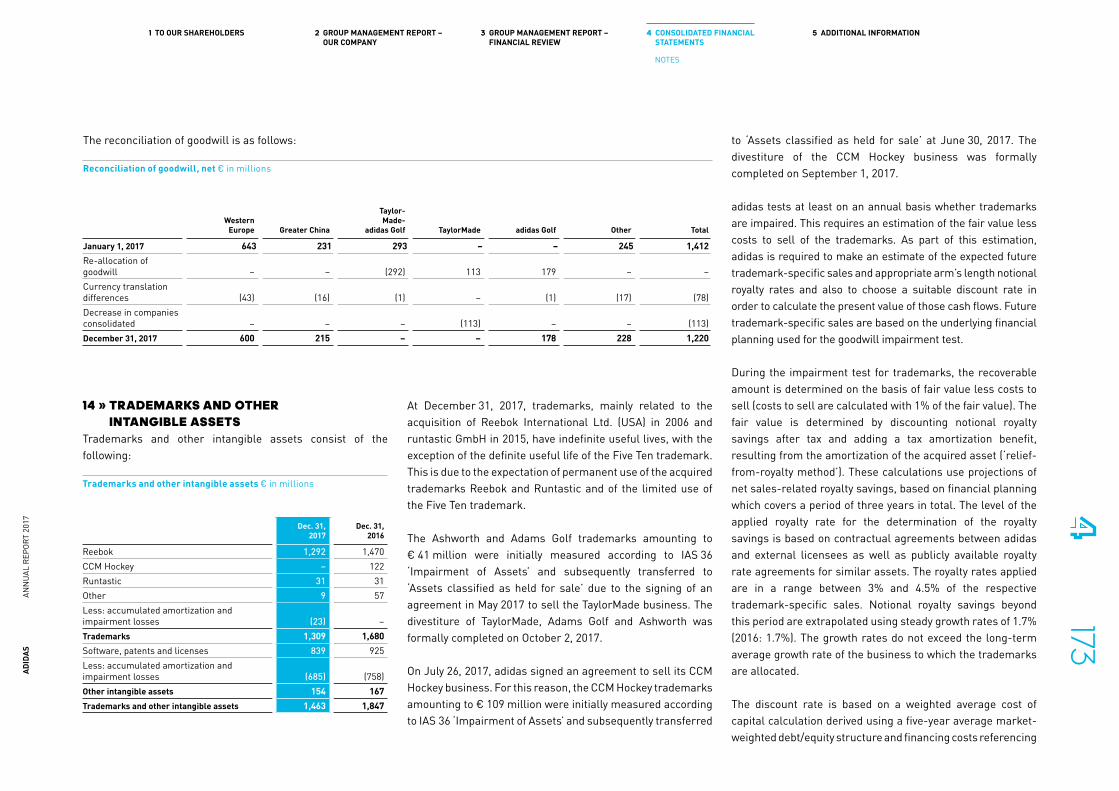
to ‘Assets classified as held for sale’ at June 30, 2017. The divestiture of the CCM Hockey business was formally completed on September 1, 2017.
adidas tests at least on an annual basis whether trademarks are impaired. This requires an estimation of the fair value less costs to sell of the trademarks. As part of this estimation, adidas is required to make an estimate of the expected future trademark-specific sales and appropriate arm’s length notional royalty rates and also to choose a suitable discount rate in order to calculate the present value of those cash flows. Future trademark-specific sales are based on the underlying financial planning used for the goodwill impairment test.
During the impairment test for trademarks, the recoverable amount is determined on the basis of fair value less costs to sell (costs to sell are calculated with 1% of the fair value). The fair value is determined by discounting notional royalty savings after tax and adding a tax amortization benefit, resulting from the amortization of the acquired asset (‘relief-from-royalty method’). These calculations use projections of net sales-related royalty savings, based on financial planning which covers a period of three years in total. The level of the applied royalty rate for the determination of the royalty savings is based on contractual agreements between adidas and external licensees as well as publicly available royalty rate agreements for similar assets. The royalty rates applied are in a range between 3% and 4.5% of the respective trademark-specific sales. Notional royalty savings beyond this period are extrapolated using steady growth rates of 1.7% (2016: 1.7%). The growth rates do not exceed the long-term average growth rate of the business to which the trademarks are allocated.
The discount rate is based on a weighted average cost of capital calculation derived using a five-year average market-weighted debt/equity structure and financing costs referencing
14 » TRADEMARKS AND OTHER INTANGIBLE ASSETS
Trademarks and other intangible assets consist of the following:
At December 31, 2017, trademarks, mainly related to the acquisition of Reebok International Ltd. (USA) in 2006 and runtastic GmbH in 2015, have indefinite useful lives, with the exception of the definite useful life of the Five Ten trademark. This is due to the expectation of permanent use of the acquired trademarks Reebok and Runtastic and of the limited use of the Five Ten trademark.
The Ashworth and Adams Golf trademarks amounting to € 41 million were initially measured according to IAS 36 ‘Impairment of Assets’ and subsequently transferred to ‘Assets classified as held for sale’ due to the signing of an agreement in May 2017 to sell the TaylorMade business. The divestiture of TaylorMade, Adams Golf and Ashworth was formally completed on October 2, 2017.
On July 26, 2017, adidas signed an agreement to sell its CCM Hockey business. For this reason, the CCM Hockey trademarks amounting to € 109 million were initially measured according to IAS 36 ‘Impairment of Assets’ and subsequently transferred
The reconciliation of goodwill is as follows:
Reconciliation of goodwill, net € in millions
WesternEurope Greater China
Taylor- Made-
adidas Golf TaylorMade adidas Golf Other Total
January 1, 2017 643 231 293 – – 245 1,412Re-allocation of goodwill – – (292) 113 179 – –Currency translation differences (43) (16) (1) – (1) (17) (78)Decrease in companies consolidated – – – (113) – – (113)December 31, 2017 600 215 – – 178 228 1,220
Trademarks and other intangible assets € in millions
Dec. 31, 2017
Dec. 31, 2016
Reebok 1,292 1,470CCM Hockey – 122Runtastic 31 31Other 9 57Less: accumulated amortization and impairment losses (23) –Trademarks 1,309 1,680Software, patents and licenses 839 925Less: accumulated amortization and impairment losses (685) (758)Other intangible assets 154 167Trademarks and other intangible assets 1,463 1,847
ADID
AS
ANN
UAL
REPO
RT 2
017
1731 TO OUR SHAREHOLDERS 2 GROUP MANAGEMENT REPORT –
OUR COMPANY3 GROUP MANAGEMENT REPORT –
FINANCIAL REVIEW4 CONSOLIDATED FINANCIAL
STATEMENTS5 ADDITIONAL INFORMATION
NOTES

the company’s major competitors. The discount rate used is an after-tax rate and reflects the specific equity and country risk. The applied discount rate depends on the respective intangible asset being valued and ranges between 8.5% and 9.6% (2016: between 6.5% and 9.0%).
In total, trademark impairment losses of € 23 million were recognized in 2017 (2016: € 0 million).
On the basis of the value in use determination of Runtastic on the cash-generating unit level and due to adjusted growth assumptions, an indication of a potential impairment was identified. In the course of the trademark impairment test, the recoverable amount of the Runtastic trademark in the amount of € 16 million was determined to be lower than its carrying amount and an impairment loss of € 15 million was recognized. Regarding the determination of the fair value less costs to sell, a royalty rate of 3.5% and a discount rate of 9.6% was applied.
In the course of the trademark impairment test, the recoverable amount of the Five Ten trademark in the amount of € 1 million was also determined to be lower than its carrying amount. The impairment loss of € 8 million was mainly due to the planned integration of the Five Ten trademark into adidas by the end of 2020 and the resulting limitation of its remaining useful life to three years.
For the Reebok trademark, there was no indication of a potential impairment. Neither an increase in the discount rate of up to approximately 2.0 percentage points nor a reduction of trademark-specific sales of up to approximately 28.4% or of the applied royalty rate of approximately 1.3 percentage points would result in any impairment requirement. However, future changes in expected cash flows and discount rates may lead to impairments of the accounted trademarks in the future.
As part of the goodwill impairment test, the Reebok and the Five Ten trademarks are allocated on a pro rata basis to the groups of cash-generating units. Thereof, the major shares relate to Western Europe (€ 353 million), USA Reebok (€ 224 million), Russia/CIS (€ 203 million) and Latin America (€ 118 million). All other trademarks are part of the respective groups of cash-generating units.
Amortization expenses for intangible assets with definite useful lives were € 63 million and € 70 million for the years ending December 31, 2017 and 2016, respectively. In 2017, impairment losses on other intangible assets amounted to € 10 million (2016: € 10 million). SEE NOTE 32
For details see Attachment I to the consolidated financial statements SEE STATEMENT OF MOVEMENTS OF INTANGIBLE AND TANGIBLE
ASSETS, P. 213
15 » LONG-TERM FINANCIAL ASSETSLong-term financial assets primarily include an 8.33% invest-ment in FC Bayern München AG (2016: 8.33%) of € 82 million (2016: € 81 million). This investment is classified as ‘fair value through profit or loss’ and recorded at fair value. This equity security does not have a quoted market price in an active market. Therefore, existing contractual arrangements were used in order to calculate the fair value as at December 31, 2017.
The line item ‘Investments and loans’ comprises investments which are mainly invested in insurance products, which are measured at fair value, securities for long-term variable compensation components as well as other loans. Investments include impairment losses in an amount of € 11 million in 2017 (2016: € 0 million).
The line item ‘Other financial assets’ includes the shares in Immobilieninvest und Betriebsgesellschaft Herzo-Base GmbH & Co. KG as well as other minority shareholdings
amounting to € 56 million (2016: € 50 million) which are classified as ‘available-for-sale’ and measured at cost as a reliable determination of the fair value is impossible without having concrete negotiations regarding a sale. Other minority shareholdings include impairment losses in an amount of € 20 million in 2017 (2016: € 5 million). These shares are unlisted and do not have an active market. There is currently no intention to sell these shares.
Other financial assets mainly include unquoted equity instruments.
16 » OTHER NON-CURRENT FINANCIAL ASSETSOther non-current financial assets consist of the following:
For further information about currency options and forward exchange contracts SEE NOTE 30
Long-term financial assets € in millions
Dec. 31, 2017
Dec. 31, 2016
Investment in FC Bayern München AG 82 81Investments and loans 98 49Other financial assets 56 64Long-term financial assets 236 194
Other non-current financial assets € in millions
Dec. 31, 2017
Dec. 31, 2016
Currency options 14 18Forward exchange contracts 1 13Security deposits 67 34Earn-out components 19 –Promissory notes 118 30Sundry 0 0Other non-current financial assets 219 96
ADID
AS
ANN
UAL
REPO
RT 2
017
1741 TO OUR SHAREHOLDERS 2 GROUP MANAGEMENT REPORT –
OUR COMPANY3 GROUP MANAGEMENT REPORT –
FINANCIAL REVIEW4 CONSOLIDATED FINANCIAL
STATEMENTS5 ADDITIONAL INFORMATION
NOTES

For information about promissory notes and earn-out components SEE NOTE 03
17 » OTHER NON-CURRENT ASSETS Other non-current assets consist of the following:
Prepaid expenses mainly include prepayments for long-term promotion contracts and rents. SEE NOTES 39 AND 29
18 » BORROWINGS AND CREDIT LINESBorrowings are denominated in a variety of currencies in which adidas conducts its business. The largest portions of effective gross borrowings (before liquidity swaps for cash management purposes) as at December 31, 2017 are denominated in euros (2017: 91%; 2016: 77%).
The weighted average interest rate on the Group’s gross borrowings increased to 2.7% in 2017 (2016: 2.3%).
As at December 31, 2017, adidas had cash credit lines and other long-term financing arrangements totaling € 3.3 billion (2016: € 3.6 billion); thereof unused credit lines accounted for € 2.1 billion (2016: € 2.0 billion). In addition, as at December 31, 2017, adidas had separate lines for the issuance of letters of credit and guarantees in an amount of approximately € 0.2 billion (2016: € 0.2 billion).
The amounts disclosed as gross borrowings represent outstanding borrowings under the following arrangements with aggregated expiration dates as follows:
The above table includes two Eurobonds amounting to € 1 billion in total issued on October 1, 2014. The seven-year Eurobond of € 600 million matures on October 8, 2021 and has a coupon of 1.25%. The twelve-year Eurobond of € 400 million matures on October 8, 2026 and has a coupon of 2.25%. The Eurobonds have denominations of € 1,000 each and were priced with a spread of 68 basis points and 100 basis points, respectively, above the corresponding euro mid-swap rate. The issue price was fixed at 99.145% and 99.357%, respectively.
In addition, gross borrowings include the outstanding portion of the convertible bond for an aggregate nominal amount of € 31 million (2016: € 260 million) divided into denominations of € 200,000 which was issued on March 21, 2012. The bond has a maximum maturity (including prolongation options) until June 14, 2019. The coupon of the bond amounts to 0.25% and is payable annually, commencing on June 14, 2013. The bond is, at the option of the respective holder, convertible at any time from and including May 21, 2012, up to and including June 5, 2019, into up to 0.4 million new or existing adidas AG shares (as at December 31, 2017). In 2017, the bondholders converted an aggregate nominal amount of € 229 million of the convertible bond into 2,814,470 adidas AG shares. SEE NOTE 26
The convertible bond initially had a conversion premium of 40% above the reference price of € 59.61, which resulted in an initial conversion price of € 83.46 per share. As a consequence of contractual provisions relating to dividend protection, the conversion price was adjusted from € 81.57 to € 81.13 (2016: € 82.00 to € 81.57) per share. This adjustment became effective on May 12, 2017. On June 14, 2017, the bondholders had the right to call the bond from adidas AG at nominal value plus interest accrued on the nominal amount. This option was not utilized. adidas AG is entitled to redeem all remaining bonds as a whole if, at any time, the aggregate principal amount of bonds outstanding falls below 15% of the aggregate principal amount of the bonds that were initially issued. Furthermore, as of July 14, 2017, adidas AG is entitled to redeem all remaining bonds as a whole if, on 20 of 30 consecutive trading days, the adidas AG share price exceeds the current conversion price of € 81.13 by at least 30%.
According to IAS 32 ‘Financial Instruments: Presentation’, the conversion right represented in the convertible bond constitutes a financial instrument which at issuance is covered in the capital reserve in an amount of € 55 million after deduction of the issuance cost. The initial difference of € 59 million compared to
Other non-current assets € in millions
Dec. 31, 2017
Dec. 31, 2016
Prepaid expenses 108 94Sundry 0 0Other non-current assets 108 94
Gross borrowings as at December 31, 2017 € in millions
Up to1 year
Between1 and 3 years
Between 3 and 5 years
More than 5 years Total
Bank borrowings incl. commercial paper 106 – – – 106Eurobond – – 596 387 983Convertible bond 31 – – – 31Total 137 – 596 387 1,120
ADID
AS
ANN
UAL
REPO
RT 2
017
1751 TO OUR SHAREHOLDERS 2 GROUP MANAGEMENT REPORT –
OUR COMPANY3 GROUP MANAGEMENT REPORT –
FINANCIAL REVIEW4 CONSOLIDATED FINANCIAL
STATEMENTS5 ADDITIONAL INFORMATION
NOTES

the nominal amount of € 500 million is accrued as interest expense of the financial liability over the expected maturity of the convertible bond using the ‘effective interest method’. As at December 31, 2017, the financial liability amounted to € 31 million (2016: € 257 million).
For further details on future cash outflows SEE RISK AND
OPPORTUNITY REPORT, P. 131
19 » OTHER CURRENT FINANCIAL LIABILITIESOther current financial liabilities consist of the following:
The line item ‘Sundry’ mainly relates to payables due to the divestiture of operating segments and due to customs duties.
For further information about currency options, forward exchange contracts and commodity futures SEE NOTE 30
For further information about finance lease obligations SEE NOTE 29
20 » OTHER PROVISIONSOther provisions consist of the following:
Marketing provisions mainly consist of provisions for promotion contracts, which are comprised of obligations to clubs and athletes.
Provisions for personnel mainly consist of provisions for short- and long-term variable compensation components as well as of provisions for social plans relating to restructuring measures.
Provisions for returns, allowances and warranty primarily arise due to bonus agreements with customers and the obligation of fulfilling customer claims with regard to the return of products sold by adidas. The amount of the provision follows the historical development of returns, allowances and warranty as well as current agreements.
Provisions for taxes other than income taxes mainly relate to value added tax, real estate tax and motor vehicle tax.
Sundry provisions mainly include provisions for customs risks, onerous contracts and provisions due to the divestiture of operating segments.
Management follows past experience from similar transactions when assessing the recognition and the measurement of other provisions; in particular external legal opinions are considered for provisions for customs risks and for litigation and other legal risks. All evidence from events
Gross borrowings as at December 31, 2016 € in millions
Up to1 year
Between1 and 3 years
Between 3 and 5 years
More than 5 years Total
Bank borrowings incl. commercial paper 379 – – – 379Eurobond – – 595 387 982Convertible bond 257 – – – 257Total 636 – 595 387 1,618
Other current financial liabilities € in millions
Dec. 31, 2017
Dec. 31, 2016
Currency options 3 1Forward exchange contracts 271 109Finance lease obligations 0 3Earn-out components 21 7Sundry 67 81Other current financial liabilities 362 201
Other provisions € in millions
Jan. 1, 2017
Currencytranslationdifferences Usage Reversals Additions Transfers
Dec. 31,2017
Thereofnon-current
Marketing 28 (3) (17) (0) 26 (7) 27 –Personnel 99 (10) (56) (1) 96 (11) 117 33Returns, allowances and warranty 230 (16) (187) (2) 251 (16) 261 –Taxes, other than income taxes 36 (4) (14) (0) 9 0 27 –Sundry 224 (11) (78) (14) 260 10 391 47Other provisions 617 (45) (351) (18) 642 (24) 821 80
ADID
AS
ANN
UAL
REPO
RT 2
017
1761 TO OUR SHAREHOLDERS 2 GROUP MANAGEMENT REPORT –
OUR COMPANY3 GROUP MANAGEMENT REPORT –
FINANCIAL REVIEW4 CONSOLIDATED FINANCIAL
STATEMENTS5 ADDITIONAL INFORMATION
NOTES
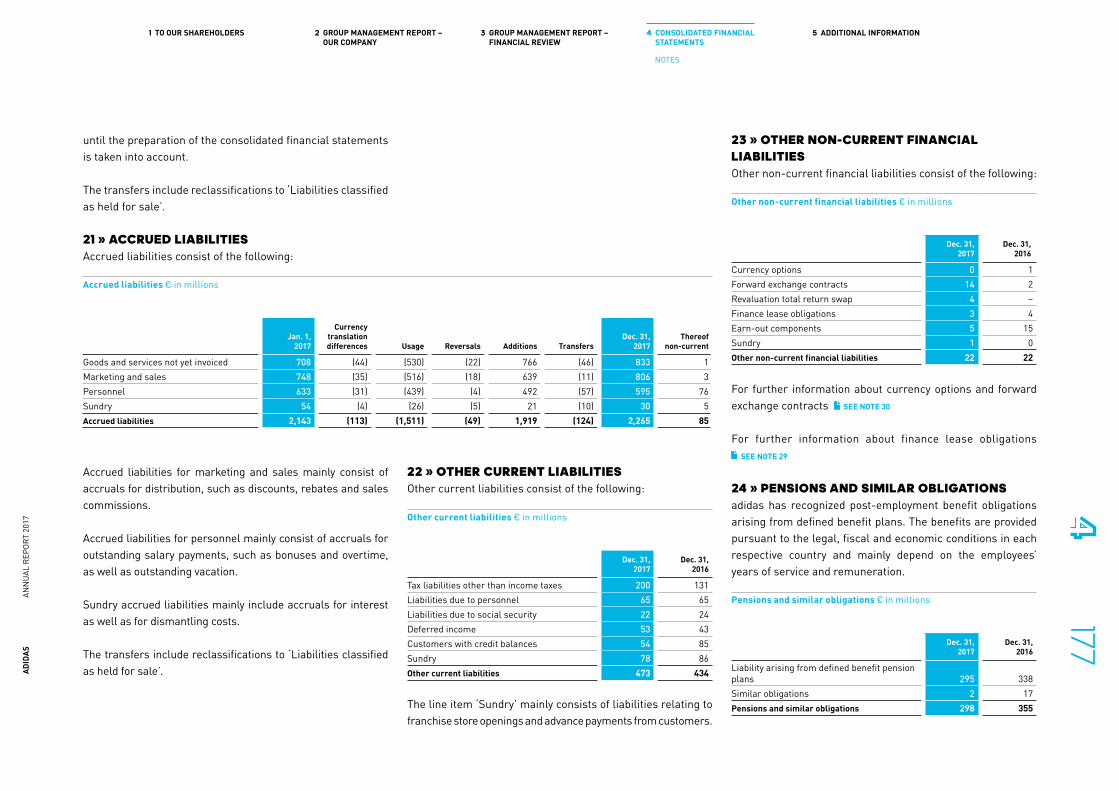
until the preparation of the consolidated financial statements is taken into account.
The transfers include reclassifications to ‘Liabilities classified as held for sale’.
21 » ACCRUED LIABILITIESAccrued liabilities consist of the following:
23 » OTHER NON-CURRENT FINANCIAL LIABILITIESOther non-current financial liabilities consist of the following:
Accrued liabilities for marketing and sales mainly consist of accruals for distribution, such as discounts, rebates and sales commissions.
Accrued liabilities for personnel mainly consist of accruals for outstanding salary payments, such as bonuses and overtime, as well as outstanding vacation.
Sundry accrued liabilities mainly include accruals for interest as well as for dismantling costs.
The transfers include reclassifications to ‘Liabilities classified as held for sale’.
22 » OTHER CURRENT LIABILITIESOther current liabilities consist of the following:
The line item ‘Sundry’ mainly consists of liabilities relating to franchise store openings and advance payments from customers.
For further information about currency options and forward exchange contracts SEE NOTE 30
For further information about finance lease obligations SEE NOTE 29
24 » PENSIONS AND SIMILAR OBLIGATIONS adidas has recognized post-employment benefit obligations arising from defined benefit plans. The benefits are provided pursuant to the legal, fiscal and economic conditions in each respective country and mainly depend on the employees’ years of service and remuneration.
Accrued liabilities € in millions
Jan. 1, 2017
Currencytranslationdifferences Usage Reversals Additions Transfers
Dec. 31, 2017
Thereofnon-current
Goods and services not yet invoiced 708 (44) (530) (22) 766 (46) 833 1Marketing and sales 748 (35) (516) (18) 639 (11) 806 3Personnel 633 (31) (439) (4) 492 (57) 595 76Sundry 54 (4) (26) (5) 21 (10) 30 5Accrued liabilities 2,143 (113) (1,511) (49) 1,919 (124) 2,265 85
Other current liabilities € in millions
Dec. 31, 2017
Dec. 31, 2016
Tax liabilities other than income taxes 200 131Liabilities due to personnel 65 65Liabilities due to social security 22 24Deferred income 53 43Customers with credit balances 54 85Sundry 78 86Other current liabilities 473 434
Other non-current financial liabilities € in millions
Dec. 31, 2017
Dec. 31, 2016
Currency options 0 1Forward exchange contracts 14 2Revaluation total return swap 4 –Finance lease obligations 3 4Earn-out components 5 15Sundry 1 0Other non-current financial liabilities 22 22
Pensions and similar obligations € in millions
Dec. 31, 2017
Dec. 31, 2016
Liability arising from defined benefit pension plans 295 338Similar obligations 2 17Pensions and similar obligations 298 355
ADID
AS
ANN
UAL
REPO
RT 2
017
1771 TO OUR SHAREHOLDERS 2 GROUP MANAGEMENT REPORT –
OUR COMPANY3 GROUP MANAGEMENT REPORT –
FINANCIAL REVIEW4 CONSOLIDATED FINANCIAL
STATEMENTS5 ADDITIONAL INFORMATION
NOTES

Defined contribution pension plans The total expense for defined contribution plans amounted to € 67 million in 2017 (2016: € 66 million).
Defined benefit pension plans Given the company’s diverse structure, different defined benefit pension plans exist, comprising a variety of post-employment benefit arrangements. The company’s major defined benefit pension plans relate to adidas AG and its subsidiaries in the UK and South Korea. The defined benefit pension plans generally provide payments in case of death, disability or retirement to former employees and their survivors. The obligations arising from defined benefit pension plans are partly covered by plan assets.
In Germany, adidas AG grants its employees contribution-based and final salary defined benefit pension schemes, which provide employees with entitlements in the event of retirement, disability and death. German pension plans operate under the legal framework of the German Company Pensions Act (‘Betriebsrentengesetz’) and under general German labor legislation. New employees are entitled to benefits in accordance with the adidas Pension Plan or the adidas Management Pension Plan. The adidas Pension Plan is a matching contribution plan; the contributions to this pension plan are partly paid by the employee and partly paid by the employer. The contributions are transferred into benefit components. The benefits are paid out in the form of a pension, a lump sum or installments. The pension plans in Germany are financed using book reserves, a contractual trust arrangement (CTA) and a pension fund (‘Pensionsfonds’) in combination with a reinsured provident fund (‘Unterstützungskasse’) for certain former members of the Executive Board of adidas AG. Further details about the pension entitlements of members of the Executive Board of adidas AG are contained in the Compensation Report.
SEE COMPENSATION REPORT, P. 39
The final salary defined benefit pension scheme in the UK is closed to new entrants and to future accrual. The benefits are mainly paid out in the form of pensions. The scheme operates under UK trust law as well as under the jurisdiction of the UK Pensions Regulator and therefore is subject to a minimum funding requirement. The Trustee Board is responsible for setting the scheme’s funding objective, agreeing the contributions with the company and determining the investment strategy of the scheme.
In South Korea, adidas grants a final pay pension plan to certain employees. This plan is closed to new entrants. The benefits are paid out in the form of a lump sum. The pension plan operates under the Employee Retirement Benefit Security Act (ERSA). This regulation requires a minimum funding amounting to 80% of the present value of the vested benefit obligation. The annual contribution includes at least the minimum amount in order to meet the funding requirements. The pension plan at TaylorMade South Korea was derecognized due to the divestiture of the TaylorMade business as at October 2, 2017. SEE NOTE 04
The Group’s pension plans are subject to risks from changes in actuarial assumptions, such as the discount rate, salary and pension increase rates, and risks from changes in longevity. A lower discount rate results in a higher defined benefit obligation and/or in higher contributions to the pension funds. Lower than expected performance of the plan assets could lead to an increase in required contributions or to a decline of the funded status.
Breakdown of the present value of the obligation arising from defined benefit pension plans in the major countries € in millions
Dec. 31, 2017 Dec. 31, 2016
Germany UK South Korea Germany UK South Korea
Active members 203 – 18 211 – 17Former employees with vested rights 106 52 – 76 69 –Pensioners 77 7 – 86 4 –Total 386 59 18 375 73 17
ADID
AS
ANN
UAL
REPO
RT 2
017
1781 TO OUR SHAREHOLDERS 2 GROUP MANAGEMENT REPORT –
OUR COMPANY3 GROUP MANAGEMENT REPORT –
FINANCIAL REVIEW4 CONSOLIDATED FINANCIAL
STATEMENTS5 ADDITIONAL INFORMATION
NOTES

The following tables analyze the defined benefit plans, plan assets, present values of the defined benefit pension plans, expenses recognized in the consolidated income statement, actuarial assumptions and further information.
The determination of assets and liabilities for defined benefit plans is based upon statistical and actuarial valuations. In particular, the present value of the defined benefit obligation is driven by financial variables (such as the discount rates or future increases in salaries) and demographic variables (such as mortality and employee turnover). The actuarial assumptions may differ significantly from the actual circumstances and could lead to different cash flows.
The weighted average actuarial assumptions as at the balance sheet date are used to determine the defined benefit liability at that date and the pension expense for the upcoming financial year.
The actuarial assumptions for withdrawal and mortality rates are based on statistical information available in the various countries. In Germany, the Heubeck 2005 G mortality tables are used. In the UK, assumptions are based on the S2PA base table with modified improvement of the life expectancy mortality tables. In South Korea, the KIDI 2015 tables from the Korean Insurance Development Institute are used.
As in the previous year, the calculation of the pension liabilities in Germany is based on a discount rate determined using the ‘Mercer Yield Curve (MYC)’ approach.
Amounts for defined benefit pension plans recognized in the consolidated statement of financial position€ in millions
Dec. 31, 2017
Dec. 31, 2016
Present value of funded obligation from defined benefit pension plans 482 485 Fair value of plan assets (218) (178)Funded status 264 307Present value of unfunded obligation from defined benefit pension plans 31 31Asset ceiling effect 0 0Net defined benefit liability 295 338
Thereof: liability 295 338Thereof: adidas AG 248 275
Thereof: asset (0) (0)Thereof: adidas AG – –
Weighted average actuarial assumptions in %
Dec. 31, 2017
Dec. 31, 2016
Discount rate 2.3 2.1Expected rate of salary increases 3.7 3.1Expected pension increases 1.6 1.7
ADID
AS
ANN
UAL
REPO
RT 2
017
1791 TO OUR SHAREHOLDERS 2 GROUP MANAGEMENT REPORT –
OUR COMPANY3 GROUP MANAGEMENT REPORT –
FINANCIAL REVIEW4 CONSOLIDATED FINANCIAL
STATEMENTS5 ADDITIONAL INFORMATION
NOTES

Remeasurements, such as gains or losses arising from changes in the actuarial assumptions for defined benefit pension plans during the financial year or a return on the plan assets exceeding the interest income, are immediately recognized outside the income statement as a change in other reserves in the consolidated statement of comprehensive income.
Of the total pension expenses recorded in the consolidated income statement, an amount of € 25 million (2016: € 16 million) relates to employees of adidas AG, € 0.6 million (2016: € 0.2 million) relates to employees in the UK and € 2.8 million (2016: € 3 million) relates to employees in South Korea. The pension expense is mainly recorded within other operating expenses. The production-related part of the pension expenses is recognized within cost of sales.
Present value of the defined benefit obligation € in millions
2017 2016
Present value of the obligation from defined benefit pension plans as at January 1 516 419Currency translation differences (7) (8)Current service cost 27 17Interest cost 11 11Contribution by plan participants 0 0Pensions paid (11) (11)Payments for plan settlements 0 (2)Actuarial (gains)/losses (21) 89
Thereof: due to changes in financial assumptions (22) 70Thereof: due to changes in demographic assumptions (2) (1)Thereof: due to experience adjustments 2 21
Past service cost/(credit) 1 (0)Gain on plan settlements (0) (1)Business combinations/transfers/divestitures (2) 1Present value of the obligation from defined benefit pension plans as at December 31 513 516
Pension expenses for defined benefit pension plans € in millions
Year ending Dec. 31,
2017
Year ending Dec. 31,
2016
Current service cost 27 17Net interest expense 7 6
Thereof: interest cost 11 11Thereof: interest income (4) (5)
Past service cost/(credit) 1 (0)Gain on plan settlements (0) (1)Expenses for defined benefit pension plans (recognized in the consolidated income statement) 34 23Actuarial (gains)/losses (21) 89
Thereof: due to changes in financial assumptions (22) 70Thereof: due to changes in demographic assumptions (2) (1)Thereof: due to experience adjustments 2 21
Return on plan assets (not included in net interest income) (7) (6)Asset ceiling effect (0) (0)
Remeasurements for defined benefit pension plans (recognized as (increase)/decrease in other reserves in the consolidated statement of comprehensive income) (29) 84Total 5 106AD
IDAS
AN
NUA
L RE
PORT
201
7
1801 TO OUR SHAREHOLDERS 2 GROUP MANAGEMENT REPORT –
OUR COMPANY3 GROUP MANAGEMENT REPORT –
FINANCIAL REVIEW4 CONSOLIDATED FINANCIAL
STATEMENTS5 ADDITIONAL INFORMATION
NOTES

In the following table, the effects of reasonably conceivable changes in the actuarial assumptions on the present value of the obligation from defined benefit pension plans are analyzed. In addition, for Germany, the UK and South Korea the average duration of the obligation is shown.
In the UK, the plan assets are held under trust within the pension fund. The investment strategy is aligned with the structure of the pension obligations in these countries. In the rest of the world, the plan assets consist predominantly of insurance contracts.
The expected payments for the 2018 financial year amount to € 43 million. Thereof, € 6 million relates to benefits directly paid to pensioners by the subsidiaries and € 37 million to employer contributions paid into the plan assets. In 2017, the actual return on plan assets (including interest income) was € 11 million (2016: € 10 million).
Since many pension plans are closed to future accrual or are not dependent on the salary, the salary trend plays a minor role in determining pension obligations. Due to the fact that about half of the benefits of the German pension plans are paid as lump sums or installment payments, the pension increase rate and the mortality assumption have significantly less impact than the discount rate when calculating the pension obligations.
Approximately 93% (2016: 92%) of the total plan assets are allocated to plan assets in the three major countries: Germany (2017: 63%, 2016: 57%), UK (2017: 23%, 2016: 28%) and South Korea (2017: 7%, 2016: 8%).
Part of the plan assets in Germany is held by a trustee under a Contractual Trust Arrangement (CTA) for the purpose of funding the pension obligations of adidas AG and insolvency insurance with regard to part of the pension obligations of adidas AG. The trustee is the registered association adidas Pension Trust e.V. The investment committee of the adidas Pension Trust determines the investment strategy with the goal to match the pension liabilities as far as possible and to generate a sustainable return. In August 2014, an amount of € 65 million in cash was transferred to the trustee. In addition, in 2017, an amount of € 30 million in cash was transferred to the trustee. The plan assets in the registered association are mainly invested in real estate, equity index funds and hybrid bonds. Another part of the plan assets in Germany is invested in insurance contracts via pension funds or provident funds. For this portion, an insurance entity is responsible for the determination and the implementation of the investment strategy.
All equities and bonds are traded freely and have a quoted market price in an active market.
At each balance sheet date, the company analyzes the over- or underfunding and, where appropriate, adjusts the composition of plan assets.
Sensitivity analysis of the obligation from defined benefit pension plans € in millions
Dec. 31, 2017 Dec. 31, 2016
Germany UK South Korea Germany UK South Korea
Present value of the obligation from defined benefit pension plans 386 59 18 375 73 17Increase in the discount rate by 0.5% 355 51 18 344 63 16Reduction in the discount rate by 0.5% 422 67 19 412 85 18Average duration of the obligations (in years) 17 28 7 18 30 8
Fair value of plan assets € in millions
2017 2016
Fair value of plan assets at January 1 178 173Currency translation differences (3) (7)Pensions paid (4) (3)Contributions by the employer 36 6Contributions paid by plan participants 0 0Interest income from plan assets 4 5Return on plan assets (not included in net interest income) 7 6Settlement payments – (1)Business combinations/transfers/divestitures (1) –Fair value of plan assets at December 31 218 178
Composition of plan assets € in millions
Dec. 31, 2017
Dec. 31, 2016
Cash and cash equivalents 19 28Equity instruments 26 59Bonds 26 34Real estate 50 13Pension plan reinsurance 46 44Investment funds 51 –Insurance policies – 0Other assets 0 0Fair value of plan assets 218 178
ADID
AS
ANN
UAL
REPO
RT 2
017
1811 TO OUR SHAREHOLDERS 2 GROUP MANAGEMENT REPORT –
OUR COMPANY3 GROUP MANAGEMENT REPORT –
FINANCIAL REVIEW4 CONSOLIDATED FINANCIAL
STATEMENTS5 ADDITIONAL INFORMATION
NOTES
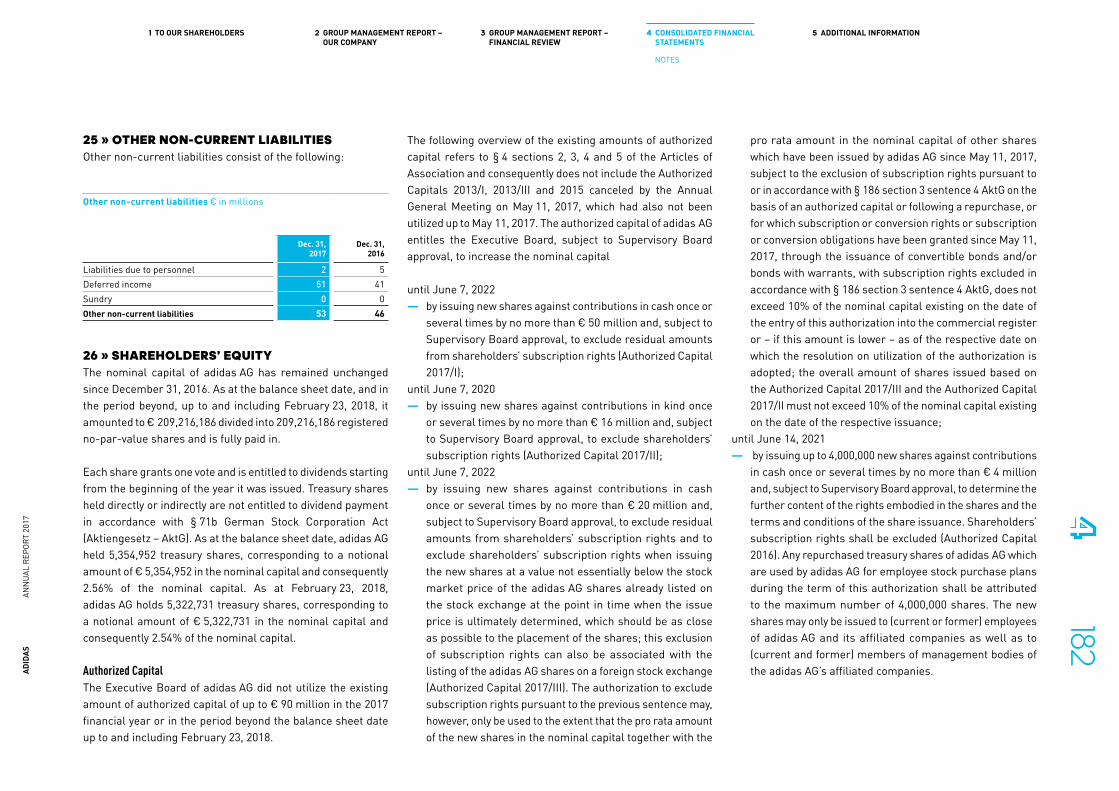
25 » OTHER NON-CURRENT LIABILITIESOther non-current liabilities consist of the following:
26 » SHAREHOLDERS’ EQUITY The nominal capital of adidas AG has remained unchanged since December 31, 2016. As at the balance sheet date, and in the period beyond, up to and including February 23, 2018, it amounted to € 209,216,186 divided into 209,216,186 registered no-par-value shares and is fully paid in.
Each share grants one vote and is entitled to dividends starting from the beginning of the year it was issued. Treasury shares held directly or indirectly are not entitled to dividend payment in accordance with § 71b German Stock Corporation Act (Aktiengesetz – AktG). As at the balance sheet date, adidas AG held 5,354,952 treasury shares, corresponding to a notional amount of € 5,354,952 in the nominal capital and consequently 2.56% of the nominal capital. As at February 23, 2018, adidas AG holds 5,322,731 treasury shares, corresponding to a notional amount of € 5,322,731 in the nominal capital and consequently 2.54% of the nominal capital.
Authorized CapitalThe Executive Board of adidas AG did not utilize the existing amount of authorized capital of up to € 90 million in the 2017 financial year or in the period beyond the balance sheet date up to and including February 23, 2018.
The following overview of the existing amounts of authorized capital refers to § 4 sections 2, 3, 4 and 5 of the Articles of Association and consequently does not include the Authorized Capitals 2013/I, 2013/III and 2015 canceled by the Annual General Meeting on May 11, 2017, which had also not been utilized up to May 11, 2017. The authorized capital of adidas AG entitles the Executive Board, subject to Supervisory Board approval, to increase the nominal capital
until June 7, 2022 — by issuing new shares against contributions in cash once or
several times by no more than € 50 million and, subject to Supervisory Board approval, to exclude residual amounts from shareholders’ subscription rights (Authorized Capital 2017/I);
until June 7, 2020 — by issuing new shares against contributions in kind once
or several times by no more than € 16 million and, subject to Supervisory Board approval, to exclude shareholders’ subscription rights (Authorized Capital 2017/II);
until June 7, 2022 — by issuing new shares against contributions in cash
once or several times by no more than € 20 million and, subject to Supervisory Board approval, to exclude residual amounts from shareholders’ subscription rights and to exclude shareholders’ subscription rights when issuing the new shares at a value not essentially below the stock market price of the adidas AG shares already listed on the stock exchange at the point in time when the issue price is ultimately determined, which should be as close as possible to the placement of the shares; this exclusion of subscription rights can also be associated with the listing of the adidas AG shares on a foreign stock exchange (Authorized Capital 2017/III). The authorization to exclude subscription rights pursuant to the previous sentence may, however, only be used to the extent that the pro rata amount of the new shares in the nominal capital together with the
pro rata amount in the nominal capital of other shares which have been issued by adidas AG since May 11, 2017, subject to the exclusion of subscription rights pursuant to or in accordance with § 186 section 3 sentence 4 AktG on the basis of an authorized capital or following a repurchase, or for which subscription or conversion rights or subscription or conversion obligations have been granted since May 11, 2017, through the issuance of convertible bonds and/or bonds with warrants, with subscription rights excluded in accordance with § 186 section 3 sentence 4 AktG, does not exceed 10% of the nominal capital existing on the date of the entry of this authorization into the commercial register or – if this amount is lower – as of the respective date on which the resolution on utilization of the authorization is adopted; the overall amount of shares issued based on the Authorized Capital 2017/III and the Authorized Capital 2017/II must not exceed 10% of the nominal capital existing on the date of the respective issuance;
until June 14, 2021 — by issuing up to 4,000,000 new shares against contributions
in cash once or several times by no more than € 4 million and, subject to Supervisory Board approval, to determine the further content of the rights embodied in the shares and the terms and conditions of the share issuance. Shareholders’ subscription rights shall be excluded (Authorized Capital 2016). Any repurchased treasury shares of adidas AG which are used by adidas AG for employee stock purchase plans during the term of this authorization shall be attributed to the maximum number of 4,000,000 shares. The new shares may only be issued to (current or former) employees of adidas AG and its affiliated companies as well as to (current and former) members of management bodies of the adidas AG’s affiliated companies.
Other non-current liabilities € in millions
Dec. 31, 2017
Dec. 31, 2016
Liabilities due to personnel 2 5Deferred income 51 41Sundry 0 0Other non-current liabilities 53 46
ADID
AS
ANN
UAL
REPO
RT 2
017
1821 TO OUR SHAREHOLDERS 2 GROUP MANAGEMENT REPORT –
OUR COMPANY3 GROUP MANAGEMENT REPORT –
FINANCIAL REVIEW4 CONSOLIDATED FINANCIAL
STATEMENTS5 ADDITIONAL INFORMATION
NOTES

Contingent CapitalThe following description of the Contingent Capital is based on § 4 sections 6 and 7 of the Articles of Association of adidas AG as well as on the underlying resolutions of the Annual General Meetings held on May 6, 2010 and May 8, 2014. Additional contingent capital does not exist.
Contingent Capital 2010 and Convertible BondThe nominal capital of adidas AG is conditionally increased by up to € 36 million (Contingent Capital 2010). The Contingent Capital serves the purpose of granting holders or creditors of bonds that were issued up to May 5, 2015 based on the resolution of the Annual General Meeting on May 6, 2010 subscription or conversion rights relating to no more than a total of 36,000,000 shares in compliance with the corresponding conditions of the bonds. The new shares shall be issued at the respective option or conversion price to be established in accordance with the aforementioned authorization resolution. The new shares shall carry dividend rights from the commencement of the financial year in which the shares are issued.
On March 14, 2012, the Executive Board, with the approval of the Supervisory Board, made partial use of the authorization of the Annual General Meeting from May 6, 2010, and on March 21, 2012 issued a convertible bond due on June 14, 2019 (including a prolongation option) in a nominal value of € 500 million via an offer to institutional investors outside the USA excluding shareholders’ subscription rights. In principle, the conversion rights are exercisable at any time between May 21, 2012 and June 5, 2019, subject to lapsed conversion rights as set out under § 6 section 3 or to the excluded periods as defined by § 6 section 4 of the bond terms and conditions, and (subject to an adjustment of the conversion ratio resulting from the dilution adjustment regulations set out under § 10 or a change of control in accordance with § 13 of the bond terms and conditions) based on a conversion price of € 81.13 per
share are convertible into 6,163,246 shares of adidas AG. The conversion price currently amounts to € 81.13 per share. The convertible bond bears an interest rate of 0.25% per annum. Bondholders were entitled to demand early redemption of the bonds as at June 14, 2017. Since July 14, 2017, adidas AG may conduct an early redemption of the bond, if, on 20 of 30 consecutive trading days, the share price of adidas AG exceeds the current conversion price of € 81.13 by at least 30%. The bonds are listed on the Open Market segment of the Frankfurt Stock Exchange. For details regarding the servicing of the convertible bond with treasury shares SEE REPURCHASE AND USE
OF TREASURY SHARES, P. 183
Moreover, the authorization to issue bonds with warrants and/or convertible bonds granted on May 6, 2010 was canceled by resolution of the Annual General Meeting on May 8, 2014.
The Executive Board of adidas AG did not issue shares from the Contingent Capital 2010 up to the balance sheet date and in the period beyond the balance sheet date up to and including February 23, 2018.
Contingent Capital 2014At the balance sheet date, the nominal capital is conditionally increased by up to € 12.5 million divided into not more than 12,500,000 shares (Contingent Capital 2014). The contingent capital increase will be implemented only to the extent that holders or creditors of option or conversion rights or the persons obligated to exercise the option or conversion duties based on bonds issued by adidas AG or a subordinated Group company, pursuant to the authorization of the Executive Board granted by the resolution adopted by the Annual General Meeting on May 8, 2014 (Agenda Item 7), up to May 7, 2019 and guaranteed by adidas AG, exercise their option or conversion rights or, if they are obliged to exercise the option or conversion duties, meet their obligations to exercise the warrant or convert the bond, or to the extent that adidas AG exercises its
rights to choose to deliver adidas AG shares for the total amount or a part amount instead of payment of the amount due and insofar as no cash settlement, treasury shares or shares of another publicly listed company are used to service these rights. The new shares will be issued at the respective option or conversion price to be established in accordance with the aforementioned authorization resolution. The new shares will carry dividend rights from the commencement of the financial year in which the shares are issued. The Executive Board is authorized, subject to Supervisory Board approval, to stipulate any additional details concerning the implementation of the contingent capital increase.
Up to the balance sheet date and in the period beyond the balance sheet date up to and including February 23, 2018, the Executive Board of adidas AG did not issue any bonds based on the authorization granted on May 8, 2014 and consequently did not issue any shares from the Contingent Capital 2014.
Repurchase and use of treasury sharesAgainst the background of the introduction of an employee stock purchase plan, the Annual General Meeting of May 12, 2016 canceled the authorization of the Executive Board to repurchase treasury shares granted on May 8, 2014, which was used in 2014 and 2015. At the same time, the Annual General Meeting granted the Executive Board a new authorization to repurchase treasury shares up to an amount totaling 10% of the nominal capital until May 11, 2021. The authorization may be used by adidas AG but also by its subordinated Group companies or by third parties on account of adidas AG or its subordinated Group companies or third parties assigned by adidas AG or one of its subordinated Group companies.
Based on the authorization to repurchase treasury shares granted by the Annual General Meeting on May 8, 2014, the adidas AG Executive Board commenced a share buyback program on November 7, 2014.
ADID
AS
ANN
UAL
REPO
RT 2
017
1831 TO OUR SHAREHOLDERS 2 GROUP MANAGEMENT REPORT –
OUR COMPANY3 GROUP MANAGEMENT REPORT –
FINANCIAL REVIEW4 CONSOLIDATED FINANCIAL
STATEMENTS5 ADDITIONAL INFORMATION
NOTES

Under the granted authorization, adidas AG repurchased a total of 4,889,142 shares for a total price of € 299,999,987 (excluding incidental purchasing costs), i.e. for an average price of € 61.36 per share, in a first tranche between November 7, 2014 and December 12, 2014 inclusive. This corresponded to a notional amount of € 4,889,142 in the nominal capital and consequently to 2.34% of the nominal capital. The shares were repurchased for cancelation (capital reduction) or otherwise used to meet obligations arising from the potential conversion of adidas AG’s € 500 million convertible bond.
Under the granted authorization, adidas AG repurchased a total of 4,129,627 shares for a total price of € 299,999,992 (excluding incidental purchasing costs), i.e. for an average price of € 72.65 per share, in a second tranche between March 6, 2015 and June 15, 2015 inclusive. This corresponded to a notional amount of € 4,129,627 in the nominal capital and consequently to 1.97% of the nominal capital.
The shares were repurchased for cancelation (capital reduction) or otherwise used to meet obligations arising from the potential conversion of adidas AG’s € 500 million convertible bond.
Based on the authorization granted by the Annual General Meeting on May 12, 2016, adidas AG repurchased a total of 2,128,200 shares for a total price of € 299,999,851 (excluding incidental purchasing costs), i.e. for an average price of € 140.96 per share, in a third tranche between November 8, 2016 and January 31, 2017 inclusive. This corresponded to a notional amount of € 2,128,200 in the nominal capital and consequently to 1.02% of the nominal capital. The repurchased shares were either canceled, thus reducing the nominal capital, or used to meet obligations arising from the potential conversion of adidas AG’s € 500 million convertible bond and other admissible purposes under the authorization granted by the Annual General Meeting on May 12, 2016. The share buyback program expired on December 31, 2017.
For details SEE DISCLOSURES PURSUANT TO § 315A SECTION 1 AND § 289A
SECTION 1 OF THE GERMAN COMMERCIAL CODE, P. 120
In the 2017 financial year, a total of 2,814,470 treasury shares were used to meet obligations arising from the conversion of adidas AG’s convertible bond. In the 2018 financial year and up to and including February 23, 2018, a total of 9,861 treasury shares were used to meet obligations arising from the conversion of adidas AG’s convertible bond.
Moreover, in the 2017 financial year, 30,420 treasury shares and in the period beyond up to and including February 23, 2018, another 22,360 treasury shares were used as consideration, inter alia for the transfer or licensing of intellectual property rights and intangible property rights due to contractual obligations.
In the 2017 financial year and up to and including February 23, 2018, adidas AG used a total of 2,877,111 treasury shares.
Employee stock purchase planIn the 2016 financial year, adidas AG introduced an employee stock purchase plan in favor of employees of adidas AG and its affiliated companies.
On January 6, 2017, adidas AG purchased 25,699 adidas AG shares at an average price of € 144.41 in connection with the employee stock purchase plan. This corresponded to a total price of € 3,711,236 (excluding incidental purchasing costs) with a pro rata amount or an amount in the nominal capital of € 25,699 or 0.01%. All shares purchased for this purpose on January 6, 2017 were issued to eligible employees on January 9, 2017 and on January 10, 2017.
On April 7, 2017, adidas AG purchased 20,086 adidas AG shares at an average price of € 176.16 in connection with the employee stock purchase plan. This corresponded to a total
price of € 3,538,364 (excluding incidental purchasing costs) with a pro rata amount or an amount in the nominal capital of € 20,086 or 0.009%. All shares purchased for this purpose on April 7, 2017 were issued to eligible employees on April 11, 2017.
On July 7, 2017, adidas AG purchased 22,563 adidas AG shares at an average price of € 175.61 in connection with the employee stock purchase plan. This corresponded to a total price of € 3,962,498 (excluding incidental purchasing costs) with a pro rata amount or an amount in the nominal capital of € 22,563 or 0.01%. All shares purchased for this purpose on July 7, 2017 were issued to eligible employees on July 11, 2017.
On October 9, 2017, adidas AG purchased 20,454 adidas AG shares at an average price of € 194.40 in connection with the employee stock purchase plan. This corresponded to a total price of € 3,976,337 (excluding incidental purchasing costs) with a pro rata amount or an amount in the nominal capital of € 20,454 or 0.009%. All shares purchased for this purpose on October 9, 2017 were issued to eligible employees on October 11, 2017.
On January 8, 2018, adidas AG purchased 25,672 adidas AG shares at an average price of € 173.27 in connection with the employee stock purchase plan. This corresponded to a total price of € 4,448,258 (excluding incidental purchasing costs) with a pro rata amount or an amount in the nominal capital of € 25,672 or 0.01%. At the same time, adidas AG purchased another 3,642 adidas AG shares at an average price of € 173.27, which were used as matching shares. This corresponded to a total price of € 631,059 (excluding incidental purchasing costs) with a pro rata amount or an amount in the nominal capital of € 3,642 or 0.002%. All shares purchased for this purpose on January 8, 2018 were issued to eligible employees on January 10, 2018. For details on the employee stock purchase plan SEE DISCLOSURES PURSUANT TO § 315A SECTION 1 HGB AND § 289A
SECTION 1 OF THE GERMAN COMMERCIAL CODE, P. 120 SEE NOTES 02 AND 27
ADID
AS
ANN
UAL
REPO
RT 2
017
1841 TO OUR SHAREHOLDERS 2 GROUP MANAGEMENT REPORT –
OUR COMPANY3 GROUP MANAGEMENT REPORT –
FINANCIAL REVIEW4 CONSOLIDATED FINANCIAL
STATEMENTS5 ADDITIONAL INFORMATION
NOTES
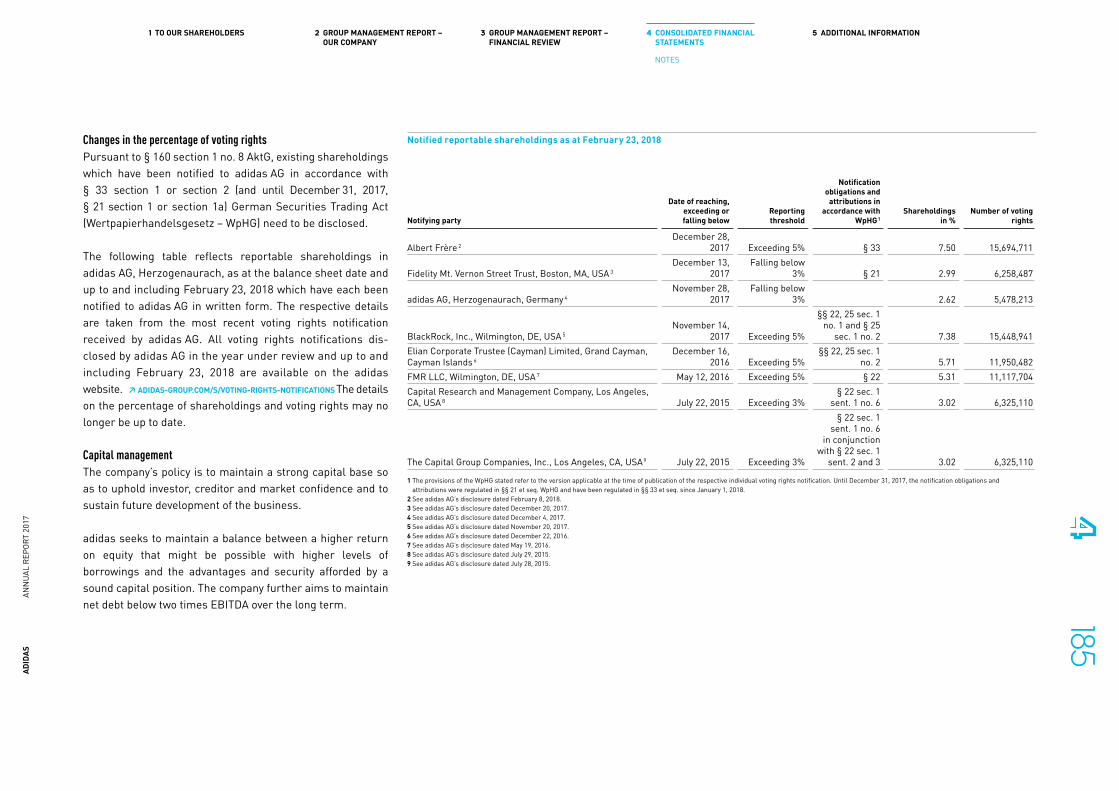
Changes in the percentage of voting rightsPursuant to § 160 section 1 no. 8 AktG, existing shareholdings which have been notified to adidas AG in accordance with § 33 section 1 or section 2 (and until December 31, 2017, § 21 section 1 or section 1a) German Securities Trading Act (Wertpapier handelsgesetz – WpHG) need to be disclosed.
The following table reflects reportable shareholdings in adidas AG, Herzogenaurach, as at the balance sheet date and up to and including February 23, 2018 which have each been notified to adidas AG in written form. The respective details are taken from the most recent voting rights notification received by adidas AG. All voting rights notifications dis-closed by adidas AG in the year under review and up to and including February 23, 2018 are available on the adidas website. ↗ ADIDAS-GROUP.COM/S/VOTING-RIGHTS-NOTIFICATIONS The details on the percentage of shareholdings and voting rights may no longer be up to date.
Capital managementThe company’s policy is to maintain a strong capital base so as to uphold investor, creditor and market confidence and to sustain future development of the business.
adidas seeks to maintain a balance between a higher return on equity that might be possible with higher levels of borrowings and the advantages and security afforded by a sound capital position. The company further aims to maintain net debt below two times EBITDA over the long term.
Notified reportable shareholdings as at February 23, 2018
Notifying party
Date of reaching, exceeding or falling below
Reporting threshold
Notification obligations and
attributions in accordance with
WpHG 1Shareholdings
in %Number of voting
rights
Albert Frère 2December 28,
2017 Exceeding 5% § 33 7.50 15,694,711
Fidelity Mt. Vernon Street Trust, Boston, MA, USA 3December 13,
2017Falling below
3% § 21 2.99 6,258,487
adidas AG, Herzogenaurach, Germany 4November 28,
2017Falling below
3% 2.62 5,478,213
BlackRock, Inc., Wilmington, DE, USA 5November 14,
2017 Exceeding 5%
§§ 22, 25 sec. 1 no. 1 and § 25
sec. 1 no. 2 7.38 15,448,941Elian Corporate Trustee (Cayman) Limited, Grand Cayman, Cayman Islands 6
December 16, 2016 Exceeding 5%
§§ 22, 25 sec. 1 no. 2 5.71 11,950,482
FMR LLC, Wilmington, DE, USA 7 May 12, 2016 Exceeding 5% § 22 5.31 11,117,704Capital Research and Management Company, Los Angeles, CA, USA 8 July 22, 2015 Exceeding 3%
§ 22 sec. 1 sent. 1 no. 6 3.02 6,325,110
The Capital Group Companies, Inc., Los Angeles, CA, USA 9 July 22, 2015 Exceeding 3%
§ 22 sec. 1 sent. 1 no. 6
in conjunction with § 22 sec. 1
sent. 2 and 3 3.02 6,325,110
1 The provisions of the WpHG stated refer to the version applicable at the time of publication of the respective individual voting rights notification. Until December 31, 2017, the notification obligations and attributions were regulated in §§ 21 et seq. WpHG and have been regulated in §§ 33 et seq. since January 1, 2018.
2 See adidas AG’s disclosure dated February 8, 2018. 3 See adidas AG’s disclosure dated December 20, 2017. 4 See adidas AG’s disclosure dated December 4, 2017. 5 See adidas AG’s disclosure dated November 20, 2017. 6 See adidas AG’s disclosure dated December 22, 2016.7 See adidas AG’s disclosure dated May 19, 2016.8 See adidas AG’s disclosure dated July 29, 2015.9 See adidas AG’s disclosure dated July 28, 2015.
ADID
AS
ANN
UAL
REPO
RT 2
017
1851 TO OUR SHAREHOLDERS 2 GROUP MANAGEMENT REPORT –
OUR COMPANY3 GROUP MANAGEMENT REPORT –
FINANCIAL REVIEW4 CONSOLIDATED FINANCIAL
STATEMENTS5 ADDITIONAL INFORMATION
NOTES

Financial leverage amounts to negative 7.5% (2016: positive 1.6%) and is defined as the ratio between net borrowings (short- and long-term borrowings less cash and cash equivalents as well as short-term financial assets) in an amount of negative € 484 million (2016: positive € 103 million) and shareholders’ equity in an amount of € 6.450 billion (2016: € 6.472 billion). EBITDA (continuing operations) amounted to € 2.511 billion for the financial year ending December 31, 2017 (2016: € 1.953 billion). The ratio between net borrowings and EBITDA (continuing operations) amounted to negative 0.2 for the financial year ending December 31, 2017 (2016: positive 0.1).
Reserves Reserves within shareholders’ equity are as follows:
— Capital reserve: primarily comprises the paid premium for the issuance of share capital as well as the equity component of the issued convertible bond.
— Cumulative currency translation differences: comprises all foreign currency differences arising from the translation of the financial statements of foreign operations.
— Hedging reserve: comprises the effective portion of the cumulative net change in the fair value of cash flow hedges related to hedged transactions that have not yet occurred as well as of hedges of net investments in foreign subsidiaries.
— Other reserves: comprises the remeasurements of defined benefit plans consisting of the cumulative net change of actuarial gains or losses relating to the defined benefit obligations, the return on plan assets (excluding interest income) and the asset ceiling effect, expenses recognized for share option plans, effects from the acquisition of non-controlling interests, as well as reserves required by law.
— Retained earnings: comprises both amounts which are required by the Articles of Association and voluntary amounts that have been set aside by adidas. The reserve includes the unappropriated accumulated profits less dividends paid and consideration paid for the repurchase
of treasury shares exceeding the nominal value. In addition, the item includes the effects of the employee stock purchase plan.
The capital reserve includes restricted capital in an amount of € 4 million. Furthermore, other reserves include additional restricted capital in an amount of € 47 million.
Distributable profits and dividendsProfits distributable to shareholders are determined by reference to the retained earnings of adidas AG and calculated under German Commercial Law.
Based on the resolution of the 2017 Annual General Meeting, the dividend for 2016 was € 2.00 per share (total amount: € 405 million). The Executive Board of adidas AG will propose to use retained earnings of adidas AG in an amount of € 573 million as reported in the 2017 financial statements of adidas AG for a dividend payment of € 2.60 per dividend-entitled share for the year 2017 as at December 31, 2017 and to carry forward the subsequent remaining amount.
As at December 31, 2017, 203,861,234 dividend-entitled shares exist, resulting in a dividend payment of € 530 million.
27 » SHARE-BASED PAYMENTEquity-settled share-based payment transactions with employees In 2016, adidas announced the introduction of an open-ended employee stock purchase plan (the ‘plan’). The plan is operated on a quarterly basis, with each calendar quarter referred to as an ‘investment quarter’. The investment shares granted in the first investment quarter between October 1, 2016 and December 31, 2016 were issued to the eligible employees on January 9, 2017 and January 10, 2017, respectively. The investment shares granted in the second investment quarter between January 1, 2017 and March 31, 2017 were issued to the eligible employees on April 11, 2017. The investment
shares granted in the third investment quarter between April 1, 2017 and June 30, 2017 were issued to the eligible employees on July 11, 2017. The investment shares granted in the fourth investment quarter between July 1, 2017 and September 30, 2017 were issued to the eligible employees on October 11, 2017.
The plan enables employees to purchase adidas AG shares with a 15% discount (‘investment shares’) and to benefit from free matching shares. Currently, eligible employees of adidas AG and eleven other subsidiaries can participate in the plan. Up to two weeks before the start of an investment quarter each eligible employee can enroll for the plan. The company accepts enrollment requests on the first day of the relevant investment quarter. This is the grant date for the investment and matching shares. The fair value at the vesting date is equivalent to the fair value of the granted equity instruments at this date. The employees invest an amount up to 10% of their gross base salary per quarter in the plan. A few days after the end of the investment quarter the shares are purchased on the market at fair market value and transferred to the employees. Thereby the amount invested during the quarter plus the top-up from adidas is used. These shares can be sold at any time by the employee. If the shares are held for a period of one year after the last day of an investment quarter, employees will receive one-time free matching shares (one matching share for every six adidas AG shares acquired). This plan currently constitutes an equity-settled share-based payment for both elements. For the component of the matching shares relating to the specific period of service an appropriate discount is taken into account. The effects are presented in the following table:
ADID
AS
ANN
UAL
REPO
RT 2
017
1861 TO OUR SHAREHOLDERS 2 GROUP MANAGEMENT REPORT –
OUR COMPANY3 GROUP MANAGEMENT REPORT –
FINANCIAL REVIEW4 CONSOLIDATED FINANCIAL
STATEMENTS5 ADDITIONAL INFORMATION
NOTES

The number of forfeited matching shares during the period amounted to 1,463 (2016: 0).
As at December 31, 2017, the total expenses recognized relating to investment shares amounted to € 2.5 million (2016: € 0.6 million).
Expenses recognized relating to vesting of matching shares amounted to € 1.4 million in 2017 (2016: € 0.1 million).
As at December 31, 2017, a total amount of € 4 million (2016: € 3 million) was invested by the participants in the stock purchase plan and was not yet transferred into shares by the end of December 2017. Therefore, this has been included in ‘Other current financial liabilities’. SEE NOTE 19
Equity-settled share-based payment transactions with third partiesIn 2016, adidas entered into a promotion and advertising contract, which includes a share-based payment transaction with third parties. The contract has a duration of five years and will end in 2021.
The first part of the agreement grants a one-time transfer of basic shares over five years which correspond to a value of US $ 5 million each year. Based on the contractual terms, the first transfer in 2017 equated to 30,420 shares. The shares from the third tranche of repurchased shares with an average price of € 140.96 per share were used as a consideration.
SEE NOTE 26
As at January 1, 2017 (grant date), an amount of € 5 million was recognized as expenses for basic shares over the vesting period of twelve months.
The second part of the agreement grants bonus shares of US $ 5 million if certain conditions are fulfilled. This option can be granted two times. As at December 31, 2017, it was likely that the bonus shares will be issued. Therefore, expenses recognized for bonus shares amounting to € 1.4 million were accrued in 2017.
Cash-settled share-based payment transactions with employeesIn 2017, adidas implemented a Long-Term Incentive (LTI) plan, which is a share-based remuneration scheme with cash settlement. RSUs (Restricted Stock Units) are granted on the condition that the beneficiary is employed for three or four years by adidas AG or one of its subsidiaries in a position where he or she is not under notice during that period. This minimum period of employment pertains to the calendar year in which the RSUs are granted and the three subsequent calendar years.
The total value of the cash remuneration payable to senior management is recalculated on each reporting date and on the settlement date, based on the fair value of the RSUs, and recognized through an appropriate increase in the provision as personnel expenses that are spread over the period of service of the beneficiary. Furthermore, social security contributions are considered in the calculation of the fair value, if appropriate for the respective country regulations and the seniority of the participants. All changes to the subsequent measurement of this provision are reported under personnel expenses.
Equity-settled share-based payment transactions with employees
As at December 31, 2016 As at December 31, 2017
1st investment quarter
1st investment quarter
2nd investment quarter
3rd investment quarter
4th investment quarter
5th investment quarter
Grant date Oct. 1, 2016 Oct. 1, 2016 Jan. 2, 2017 April 3, 2017 July 3, 2017 Oct. 2, 2017Share price at grant date (in €) 157.40 157.40 151.30 175.85 168.90 196.10Share price at December 31 (in €) 150.15 167.15Number of granted investment shares based on the share price as at December 31 24,665 – – – – 26,671Number of actually purchased investment shares – 25,699 20,086 22,563 20,454 –Outstanding granted matching shares based on the share price as at December 31 or actually purchased investment shares 4,110 3,643 3,016 3,429 3,077 4,445Average remaining vesting period in months as at December 31 (in months) 12 0 3 6 9 12
ADID
AS
ANN
UAL
REPO
RT 2
017
1871 TO OUR SHAREHOLDERS 2 GROUP MANAGEMENT REPORT –
OUR COMPANY3 GROUP MANAGEMENT REPORT –
FINANCIAL REVIEW4 CONSOLIDATED FINANCIAL
STATEMENTS5 ADDITIONAL INFORMATION
NOTES

Due to the implementation of the new LTI, one tranche with a three-year term and another with a four-year term were issued in 2017. The number of RSUs granted depends on the seniority of the beneficiaries. In addition, for the four-year plan, the number of RSUs also depends on the achievement of a target figure which is based on the growth of the diluted earnings per share from continuing operations.
The value of one RSU is the average price of the adidas AG share as quoted for the first 20 stock exchange trading days in January of the respective financial year.
At December 31, 2017, the calculation of the provision is based on a fair value of € 161.61 per RSU for the three-year cycle and a fair value of € 157.91 per RSU for the four-year cycle. The fair value is based on the closing price of the adidas AG share on December 29, 2017, adjusted for future dividend payments.
The average risk-free interest rate is based on German government securities and is 0.71% for the three-year cycle and 0.67% for the four-year cycle.
At December 31, 2017, the RSU Plan worldwide comprised 408,236 RSUs from the three-year tranche and 331,143 RSUs from the four-year tranche. The RSUs for the three-year tranche were issued in 2017. In 2017, this resulted in an expense of € 31 million. The corresponding provision amounted to € 31 million.
28 » NON-CONTROLLING INTERESTSThis line item within equity comprises the non-controlling interests in subsidiaries which are not directly or indirectly attributable to adidas AG.
Non-controlling interests are assigned to two subsidiaries as at December 31, 2017 and 2016, respectively. SEE ATTACHMENT II
TO THE CONSOLIDATED FINANCIAL STATEMENTS SEE SHAREHOLDINGS OF
ADIDAS AG, HERZOGENAURACH, P. 215 These subsidiaries were partly acquired in connection with the acquisition of Reebok and partly through purchases or foundations in the last years.
With respect to the consolidated financial statements of adidas AG, on a single basis, no subsidiary has a material non-controlling interest.
For the following subsidiaries with non-controlling interests the main financial information is presented combined.
The following table presents the main financial information on subsidiaries with non-controlling interests.
Subsidiaries with non-controlling interests
Legal entity name
Principal place of
business
Ownership interests held by non-controlling interests
(in %)
Dec. 31, 2017
Dec. 31, 2016
Life Sport Ltd. Israel 15% 15%Reebok India Company India 6.85% 6.85%
Financial information on subsidiaries with non-controlling interests € in millions
Non-controlling interests
Dec. 31, 2017
Dec. 31, 2016
Net sales (third parties) 185 168Net income 20 15Net income attributable to non-controlling interests 3 2
Other comprehensive income 17 (1)Total comprehensive income 38 15Total comprehensive income attributable to non-controlling interests 4 2
Current assets 98 85Non-current assets 16 16Current liabilities (63) (55)Non-current liabilities (1) (1)Net assets 50 44Net assets attributable to non-controlling interests according to the consolidated statement of financial position (15) (17)
Net cash generated from operating activities 14 18Net cash used in investing activities (3) (8)Net cash (used in)/generated from financing activities (6) 0Net increase of cash and cash equivalents 5 10Dividends paid to non-controlling interests during the year 1 1 2
1 Included in net cash used in financing activities.
ADID
AS
ANN
UAL
REPO
RT 2
017
1881 TO OUR SHAREHOLDERS 2 GROUP MANAGEMENT REPORT –
OUR COMPANY3 GROUP MANAGEMENT REPORT –
FINANCIAL REVIEW4 CONSOLIDATED FINANCIAL
STATEMENTS5 ADDITIONAL INFORMATION
NOTES

29 » LEASING AND SERVICE ARRANGEMENTS
Operating leases adidas leases primarily retail stores as well as offices, warehouses and equipment. The contracts regarding these leases with expiration dates of between one and 21 years partly include renewal options and escalation clauses. Rent expenses (continuing operations), which partly depend on net sales, amounted to € 779 million and € 707 million for the years ending December 31, 2017 and 2016, respectively.
Future minimum lease payments for minimum lease durations on a nominal basis are as follows:
Finance leases adidas also leases various premises for administration and warehousing which are classified as finance leases.
The net carrying amount of these assets of € 5 million and € 8 million was included in property, plant and equipment as at December 31, 2017 and 2016, respectively. For the year ending December 31, 2017, interest expenses (continuing operations) were € 0 million (2016: € 0 million) and depreciation expenses (continuing operations) were € 3 million (2016: € 4 million).
Minimum lease payments for finance leases in 2017 include land leases with a remaining lease term of 95 years. The minimum lease payments under these contracts amount to € 11 million. The estimated amount representing interest is € 10 million and the present value amounts to € 2 million.
The net present values and the minimum lease payments under these contracts over their remaining terms up to 2020 and the land leases with a remaining lease term of 95 years are as follows:
Service arrangements adidas has outsourced certain logistics and information technology functions, for which it has entered into long-term contracts. Financial commitments under these contracts mature as follows:
Minimum lease payments for finance leases € in millions
Dec. 31, 2017
Dec. 31, 2016
Lease payments falling due:Within 1 year 0 3Between 1 and 5 years 1 1After 5 years 11 12
Total minimum lease payments 13 16Less: estimated amount representing interest (10) (10)Present value of minimum lease payments 3 6Thereof falling due:
Within 1 year 0 3Between 1 and 5 years 0 1After 5 years 2 2
Minimum lease payments for operating leases € in millions
Dec. 31, 2017
Dec. 31, 2016
Within 1 year 722 688Between 1 and 5 years 1,341 1,289After 5 years 586 523Total 2,649 2,501
Financial commitments for service arrangements € in millions
Dec. 31, 2017
Dec. 31, 2016
Within 1 year 181 134Between 1 and 5 years 255 233After 5 years 0 0Total 437 366
ADID
AS
ANN
UAL
REPO
RT 2
017
1891 TO OUR SHAREHOLDERS 2 GROUP MANAGEMENT REPORT –
OUR COMPANY3 GROUP MANAGEMENT REPORT –
FINANCIAL REVIEW4 CONSOLIDATED FINANCIAL
STATEMENTS5 ADDITIONAL INFORMATION
NOTES
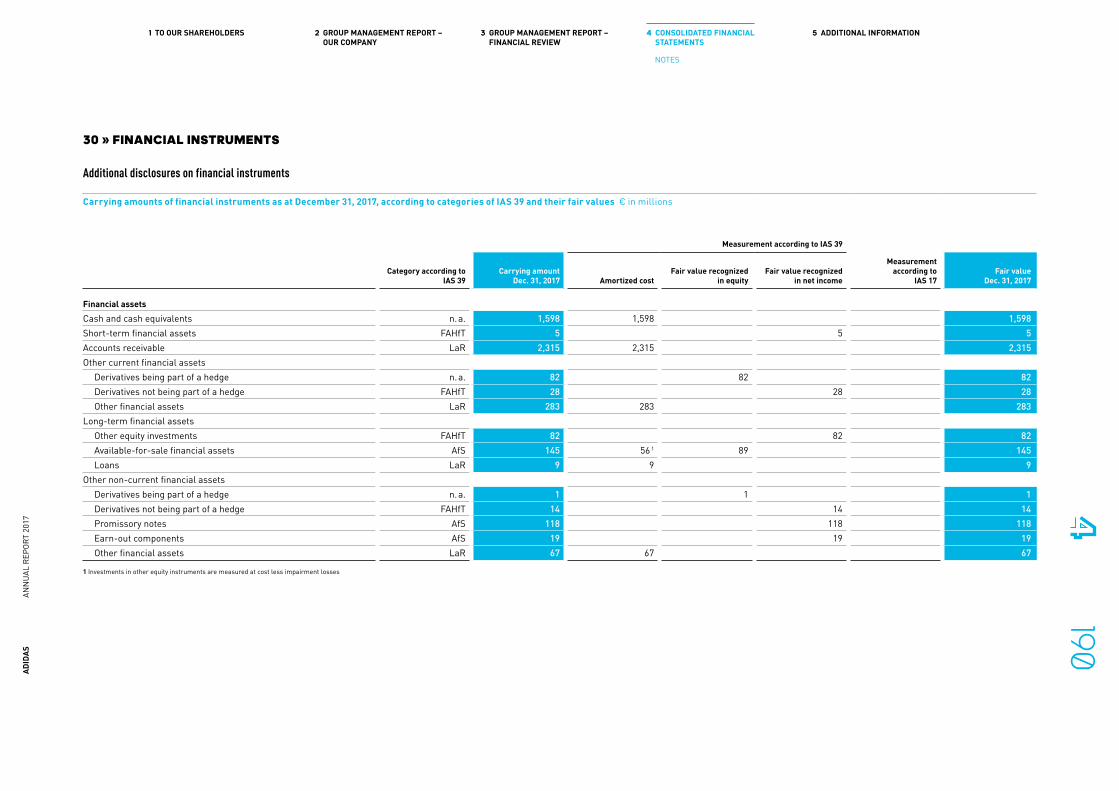
30 » FINANCIAL INSTRUMENTS
Additional disclosures on financial instruments
Carrying amounts of financial instruments as at December 31, 2017, according to categories of IAS 39 and their fair values € in millions
Measurement according to IAS 39
Category according to IAS 39
Carrying amount Dec. 31, 2017 Amortized cost
Fair value recognized in equity
Fair value recognized in net income
Measurement according to
IAS 17Fair value
Dec. 31, 2017
Financial assetsCash and cash equivalents n. a. 1,598 1,598 1,598Short-term financial assets FAHfT 5 5 5Accounts receivable LaR 2,315 2,315 2,315Other current financial assets
Derivatives being part of a hedge n. a. 82 82 82Derivatives not being part of a hedge FAHfT 28 28 28Other financial assets LaR 283 283 283
Long-term financial assetsOther equity investments FAHfT 82 82 82Available-for-sale financial assets AfS 145 56 1 89 145Loans LaR 9 9 9
Other non-current financial assetsDerivatives being part of a hedge n. a. 1 1 1Derivatives not being part of a hedge FAHfT 14 14 14Promissory notes AfS 118 118 118Earn-out components AfS 19 19 19Other financial assets LaR 67 67 67
1 Investments in other equity instruments are measured at cost less impairment losses
ADID
AS
ANN
UAL
REPO
RT 2
017
1901 TO OUR SHAREHOLDERS 2 GROUP MANAGEMENT REPORT –
OUR COMPANY3 GROUP MANAGEMENT REPORT –
FINANCIAL REVIEW4 CONSOLIDATED FINANCIAL
STATEMENTS5 ADDITIONAL INFORMATION
NOTES

Carrying amounts of financial instruments as at December 31, 2017, according to categories of IAS 39 and their fair values € in millions
Measurement according to IAS 39
Category according to IAS 39
Carrying amount Dec. 31, 2017 Amortized cost
Fair value recognized in equity
Fair value recognized in net income
Measurement according to
IAS 17Fair value
Dec. 31, 2017
Financial liabilitiesShort-term borrowings
Bank borrowings FLAC 106 106 106Convertible bond FLAC 31 31 63
Accounts payable FLAC 1,975 1,975 1,975Current accrued liabilities FLAC 837 837 837Other current financial liabilities
Derivatives being part of a hedge n. a. 250 250 250Derivatives not being part of a hedge FLHfT 24 24 24Earn-out components n. a. 21 21 21Other financial liabilities FLAC 67 67 67
Finance lease obligations n. a. 0 0 0Long-term borrowings
Eurobond FLAC 983 983 1,035Convertible bond FLAC – – –
Non-current accrued liabilities FLAC 1 1 1Other non-current financial liabilities
Derivatives being part of a hedge n. a. 9 9 9Derivatives not being part of a hedge FLHfT 5 5 5Earn-out components n. a. 5 5 5Other financial liabilities FLAC 1 1 1
Finance lease obligations n. a. 3 3 3
Thereof: aggregated by category according to IAS 39Financial assets at fair value through profit or loss 129
Thereof: designated as such upon initial recognition (Fair Value Option - FVO) −Thereof: Held for Trading (FAHfT) 129
Loans and Receivables (LaR) 2,674Available-for-Sale Financial Assets (AfS) 282Financial Liabilities Measured at Amortized Cost (FLAC) 4,001Financial Liabilities at fair value through profit or loss Held for Trading (FLHfT) 29
1 Investments in other equity instruments are measured at cost less impairment losses
ADID
AS
ANN
UAL
REPO
RT 2
017
1911 TO OUR SHAREHOLDERS 2 GROUP MANAGEMENT REPORT –
OUR COMPANY3 GROUP MANAGEMENT REPORT –
FINANCIAL REVIEW4 CONSOLIDATED FINANCIAL
STATEMENTS5 ADDITIONAL INFORMATION
NOTES

Carrying amounts of financial instruments as at December 31, 2016, according to categories of IAS 39 and their fair values € in millions
Measurement according to IAS 39
Category according to IAS 39
Carrying amount Dec. 31, 2016 Amortized cost
Fair value recognized in equity
Fair value recognized in net income
Measurement according to
IAS 17Fair value
Dec. 31, 2016
Financial assetsCash and cash equivalents n.a. 1,510 1,510 1,510Short-term financial assets FAHfT 5 5 5Accounts receivable LaR 2,200 2,200 2,200Other current financial assets
Derivatives being part of a hedge n.a. 325 325 325Derivatives not being part of a hedge FAHfT 44 44 44Promissory notes AfS 15 15 15Other financial assets LaR 345 345 345
Long-term financial assetsOther equity investments FAHfT 81 81 81Available-for-sale financial assets AfS 102 64 1 39 102Loans LaR 10 10 10
Other non-current financial assetsDerivatives being part of a hedge n.a. 15 15 15Derivatives not being part of a hedge FAHfT 17 17 17Promissory notes AfS 30 30 30Other financial assets LaR 34 34 34
1 Investments in other equity instruments are measured at cost less impairment losses
ADID
AS
ANN
UAL
REPO
RT 2
017
1921 TO OUR SHAREHOLDERS 2 GROUP MANAGEMENT REPORT –
OUR COMPANY3 GROUP MANAGEMENT REPORT –
FINANCIAL REVIEW4 CONSOLIDATED FINANCIAL
STATEMENTS5 ADDITIONAL INFORMATION
NOTES

Carrying amounts of financial instruments as at December 31, 2016, according to categories of IAS 39 and their fair values € in millions
Measurement according to IAS 39
Category according to IAS 39
Carrying amount Dec. 31, 2016 Amortized cost
Fair value recognized in equity
Fair value recognized in net income
Measurement according to
IAS 17Fair value
Dec. 31, 2016
Financial liabilitiesShort-term borrowings
Bank borrowings FLAC 379 379 379Convertible bond FLAC 257 257 476
Accounts payable FLAC 2,496 2,496 2,496Current accrued liabilities FLAC 704 704 704Other current financial liabilities
Derivatives being part of a hedge n.a. 87 87 87Derivatives not being part of a hedge FLHfT 24 24 24Earn-out components n.a. 7 7 7Other financial liabilities FLAC 81 81 81
Finance lease obligations n.a. 3 3 3Long-term borrowings
Eurobond FLAC 982 982 1,048Convertible bond FLAC – – –
Non-current accrued liabilities FLAC 9 9 9Other non-current financial liabilities
Derivatives being part of a hedge n.a. 2 2 2Derivatives not being part of a hedge FLHfT 1 1 1Earn-out components n.a. 15 15 15Other financial liabilities FLAC 0 0 0
Finance lease obligations n.a. 4 4 4
Thereof: aggregated by category according to IAS 39Financial assets at fair value through profit or loss 148
Thereof: designated as such upon initial recognition (Fair Value Option – FVO) –Thereof: Held for Trading (FAHfT) 148
Loans and Receivables (LaR) 2,590Available-for-Sale Financial Assets (AfS) 148Financial Liabilities Measured at Amortized Cost (FLAC) 4,909Financial Liabilities at fair value through profit or loss Held for Trading (FLHfT) 24
1 Investments in other equity instruments are measured at cost less impairment losses
ADID
AS
ANN
UAL
REPO
RT 2
017
1931 TO OUR SHAREHOLDERS 2 GROUP MANAGEMENT REPORT –
OUR COMPANY3 GROUP MANAGEMENT REPORT –
FINANCIAL REVIEW4 CONSOLIDATED FINANCIAL
STATEMENTS5 ADDITIONAL INFORMATION
NOTES
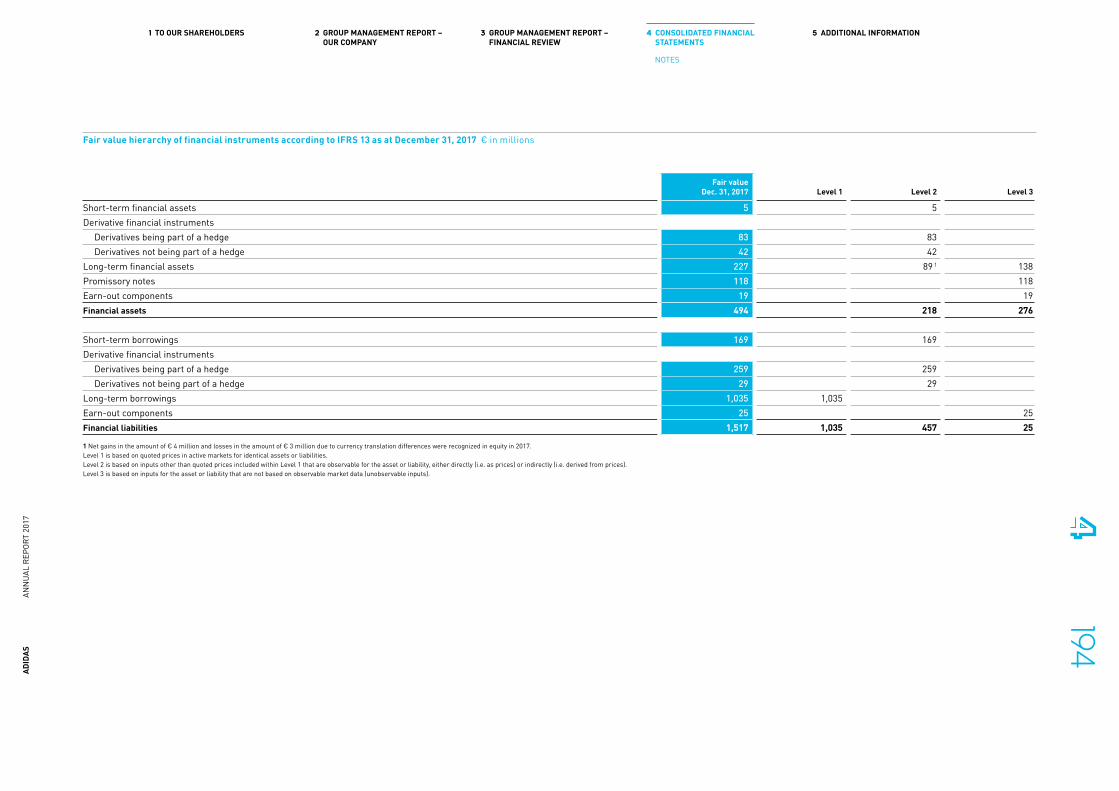
Fair value hierarchy of financial instruments according to IFRS 13 as at December 31, 2017 € in millions
Fair value Dec. 31, 2017 Level 1 Level 2 Level 3
Short-term financial assets 5 5Derivative financial instruments
Derivatives being part of a hedge 83 83Derivatives not being part of a hedge 42 42
Long-term financial assets 227 89 1 138Promissory notes 118 118Earn-out components 19 19Financial assets 494 218 276
Short-term borrowings 169 169Derivative financial instruments
Derivatives being part of a hedge 259 259Derivatives not being part of a hedge 29 29
Long-term borrowings 1,035 1,035Earn-out components 25 25Financial liabilities 1,517 1,035 457 25
1 Net gains in the amount of € 4 million and losses in the amount of € 3 million due to currency translation differences were recognized in equity in 2017.Level 1 is based on quoted prices in active markets for identical assets or liabilities.Level 2 is based on inputs other than quoted prices included within Level 1 that are observable for the asset or liability, either directly (i.e. as prices) or indirectly (i.e. derived from prices).Level 3 is based on inputs for the asset or liability that are not based on observable market data (unobservable inputs).
ADID
AS
ANN
UAL
REPO
RT 2
017
1941 TO OUR SHAREHOLDERS 2 GROUP MANAGEMENT REPORT –
OUR COMPANY3 GROUP MANAGEMENT REPORT –
FINANCIAL REVIEW4 CONSOLIDATED FINANCIAL
STATEMENTS5 ADDITIONAL INFORMATION
NOTES

Fair value hierarchy of financial instruments according to IFRS 13 as at December 31, 2016 € in millions
Fair value Dec. 31, 2016 Level 1 Level 2 Level 3
Short-term financial assets 5 5Derivative financial instruments
Derivatives being part of a hedge 339 339Derivatives not being part of a hedge 62 62
Long-term financial assets 184 39 1 145Promissory notes 45 45Financial assets 636 445 190
Short-term borrowings 855 855Derivative financial instruments
Derivatives being part of a hedge 89 89Derivatives not being part of a hedge 24 24
Long-term borrowings 1,048 1,048Earn-out components 22 22Financial liabilities 2,039 1,048 969 22
1 Net gains in the amount of € 2 million and gains in the amount of € 1 million due to currency translation differences were recognized in equity in 2016.Level 1 is based on quoted prices in active markets for identical assets or liabilities.Level 2 is based on inputs other than quoted prices included within Level 1 that are observable for the asset or liability, either directly (i.e. as prices) or indirectly (i.e. derived from prices).Level 3 is based on inputs for the asset or liability that are not based on observable market data (unobservable inputs).
ADID
AS
ANN
UAL
REPO
RT 2
017
1951 TO OUR SHAREHOLDERS 2 GROUP MANAGEMENT REPORT –
OUR COMPANY3 GROUP MANAGEMENT REPORT –
FINANCIAL REVIEW4 CONSOLIDATED FINANCIAL
STATEMENTS5 ADDITIONAL INFORMATION
NOTES
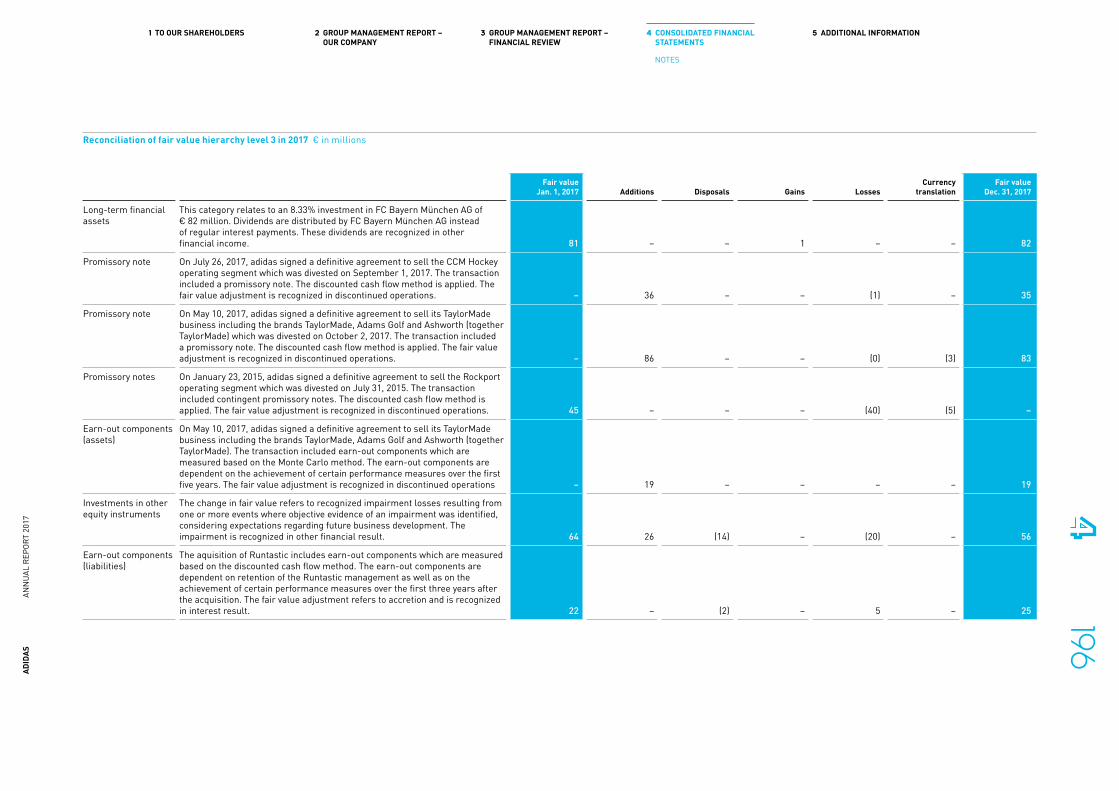
Reconciliation of fair value hierarchy level 3 in 2017 € in millions
Fair value Jan. 1, 2017 Additions Disposals Gains Losses
Currency translation
Fair value Dec. 31, 2017
Long-term financial assets
This category relates to an 8.33% investment in FC Bayern München AG of € 82 million. Dividends are distributed by FC Bayern München AG instead of regular interest payments. These dividends are recognized in other financial income. 81 – – 1 – – 82
Promissory note On July 26, 2017, adidas signed a definitive agreement to sell the CCM Hockey operating segment which was divested on September 1, 2017. The transaction included a promissory note. The discounted cash flow method is applied. The fair value adjustment is recognized in discontinued operations. – 36 – – (1) – 35
Promissory note On May 10, 2017, adidas signed a definitive agreement to sell its TaylorMade business including the brands TaylorMade, Adams Golf and Ashworth (together TaylorMade) which was divested on October 2, 2017. The transaction included a promissory note. The discounted cash flow method is applied. The fair value adjustment is recognized in discontinued operations. – 86 – – (0) (3) 83
Promissory notes On January 23, 2015, adidas signed a definitive agreement to sell the Rockport operating segment which was divested on July 31, 2015. The transaction included contingent promissory notes. The discounted cash flow method is applied. The fair value adjustment is recognized in discontinued operations. 45 – – – (40) (5) –
Earn-out components (assets)
On May 10, 2017, adidas signed a definitive agreement to sell its TaylorMade business including the brands TaylorMade, Adams Golf and Ashworth (together TaylorMade). The transaction included earn-out components which are measured based on the Monte Carlo method. The earn-out components are dependent on the achievement of certain performance measures over the first five years. The fair value adjustment is recognized in discontinued operations – 19 – – – – 19
Investments in other equity instruments
The change in fair value refers to recognized impairment losses resulting from one or more events where objective evidence of an impairment was identified, considering expectations regarding future business development. The impairment is recognized in other financial result. 64 26 (14) – (20) – 56
Earn-out components (liabilities)
The aquisition of Runtastic includes earn-out components which are measured based on the discounted cash flow method. The earn-out components are dependent on retention of the Runtastic management as well as on the achievement of certain performance measures over the first three years after the acquisition. The fair value adjustment refers to accretion and is recognized in interest result. 22 – (2) – 5 – 25
ADID
AS
ANN
UAL
REPO
RT 2
017
1961 TO OUR SHAREHOLDERS 2 GROUP MANAGEMENT REPORT –
OUR COMPANY3 GROUP MANAGEMENT REPORT –
FINANCIAL REVIEW4 CONSOLIDATED FINANCIAL
STATEMENTS5 ADDITIONAL INFORMATION
NOTES

Due to the short-term maturities of cash and cash equivalents, short-term financial assets, accounts receivable and payable as well as other current financial receivables and payables, their respective fair values equal their carrying amount.
The fair values of non-current financial assets and liabilities are estimated by discounting expected future cash flows using current interest rates for debt of similar terms and remaining maturities and adjusted by a company-specific credit risk premium.
Fair values of long-term financial assets classified as ‘Available-for-sale’ are based on quoted market prices in an active market or are calculated as present values of expected future cash flows.
The fair values of currency options, forward exchange contracts and commodity futures are determined on the basis of market conditions at the balance sheet date. The fair value of a currency option is determined using generally accepted models to calculate option prices. The fair market value of an option is influenced not only by the remaining term of the option, but also by other determining factors such as the actual foreign exchange rate and the volatility of the underlying foreign currency base.
In accordance with IFRS 13, the following tables show the valuation methods used in measuring Level 1, Level 2 and Level 3 fair values, as well as the significant unobservable inputs used.
Reconciliation of fair value hierarchy level 3 in 2016 € in millions
Fair value Jan. 1, 2016 Additions Disposals Gains Losses
Currency translation
Fair value Dec. 31, 2016
Long-term financial assets
This category relates to an 8.33% investment in FC Bayern München AG of € 81 million. Dividends are distributed by FC Bayern München AG instead of regular interest payments. These dividends are recognized in other financial income. 81 – – 1 – – 81
Promissory notes On January 23, 2015, adidas signed a definitive agreement to sell the Rockport operating segment which was divested on July 31, 2015. The transaction included contingent promissory notes. The discounted cash flow method is applied. The fair value adjustment is recognized in discontinued operations. 42 – – 2 – 1 45
Investments in other equity instruments
The change in fair value refers to recognized impairment losses resulting from one or more events where objective evidence of an impairment was identified, considering expectations regarding future business development. The impairment is recognized in other financial result. 22 47 – – (5) – 64
Earn-out components (liabilities)
The aquisition of Runtastic includes earn-out components which are measured based on the discounted cash flow method. The earn-out components are dependent on retention of the Runtastic management as well as on the achievement of certain performance measures over the first three years after the acquisition. The fair value adjustment refers to accretion and is recognized in interest result. 21 – – – 1 – 22
ADID
AS
ANN
UAL
REPO
RT 2
017
1971 TO OUR SHAREHOLDERS 2 GROUP MANAGEMENT REPORT –
OUR COMPANY3 GROUP MANAGEMENT REPORT –
FINANCIAL REVIEW4 CONSOLIDATED FINANCIAL
STATEMENTS5 ADDITIONAL INFORMATION
NOTES

Financial instruments Level 1 not measured at fair value
Type Valuation methodSignificant unobservable inputs Category
Convertible bond The fair value is based on the market price of the convertible bond as at December 31, 2017. Not applicable FLACEurobond The fair value is based on the market price of the Eurobond as at December 31, 2017. Not applicable FLAC
Financial instruments Level 2 measured at fair value
Type Valuation methodSignificant unobservable inputs Category
Short-term financial assets The discounted cash flow method is applied, which considers the present value of expected payments, discounted using a risk-adjusted discount rate. Due to their short-term maturities, it is assumed that their respective fair value is equal to the notional amount.
Not applicable FAHfT
Available-for-sale financial assets The fair value is based on the market price of the assets as at December 31, 2017. Not applicable AfSForward exchange contracts In 2017, adidas applied the par method (forward NPV) for all currency pairs to calculate the fair value, implying actively
traded forward curves. Not applicable n.a./FAHfT
Currency options adidas applies the Garman-Kohlhagen model, which is an extended version of the Black-Scholes model. Not applicable n.a./FAHfTCommodity futures The fair value is determined based on commodity forward curves, discounted by deposit and swap interest rates. Not applicable n.a./FAHfTTotal return swap (for own shares) The fair value is based on the market price of the adidas AG share as at December 31, 2017, minus accrued interest. Not applicable n.a./FLHfT
ADID
AS
ANN
UAL
REPO
RT 2
017
1981 TO OUR SHAREHOLDERS 2 GROUP MANAGEMENT REPORT –
OUR COMPANY3 GROUP MANAGEMENT REPORT –
FINANCIAL REVIEW4 CONSOLIDATED FINANCIAL
STATEMENTS5 ADDITIONAL INFORMATION
NOTES

Net gains or losses on financial assets or financial liabilities held for trading include the effects from fair value measurements of the derivatives that are not part of a hedging relationship, and changes in the fair value of other financial instruments as well as interest expenses.
Net losses on available-for-sale financial assets mainly refer to an adjustment to the fair value of the contingent considerations in connection with the sale of the Rockport operating segment in July 2015.
Net gains or losses on loans and receivables comprise mainly impairment losses and reversals.
During the course of 2017, significant unobservable inputs have not significantly changed with the exception of inputs for
the promissory note related to the agreement for the sale of the Rockport operating segment. The dividend underlying the determination of future cash flows is no longer expected. A change in the discount rate by 1 percentage point or a reduction of simulated future EBITDA values by 10% would result in a reduction of fair values of 5% and approximately 10%, respectively.
Net gains or losses on financial liabilities measured at amortized cost include effects from early settlement and reversals of accrued liabilities.
The disclosures required by IFRS 7 ‘Financial Instruments: Disclosures’, paragraphs 13A to 13F (‘Offsetting financial assets and financial liabilities’) as well as 31 to 42 (‘Nature and Extent of Risks arising from Financial Instruments’) can be found in
Financial instruments Level 3 measured at fair value
Type Valuation methodSignificant unobservable inputs
Inter-relationship between signif-icant unobservable inputs and fair value measurement Category
Investment in FC Bayern München AG
This equity security does not have a quoted market price in an active market. Existing contractual arrangements (based on the externally observable dividend policy of FC Bayern München AG) are used in order to calculate the fair value as at December 31, 2017.
See column ‘Valuation method’ FAHfT
Earn-out components (assets) The valuation follows an option price model based on the ‘Monte Carlo method’ to simulate future EBITDA values. The derived earn-out payments are discounted using a risk-adjusted discount rate.
Risk-adjusted maturity-specific discount rate(2.1% – 4.9%) EBITDA values, confidence level
The estimated fair value would increase (decrease) if the dividends were higher (lower) or the risk-adjusted discount rate was lower (higher).
AfS
Promissory notes The discounted cash flow method is applied which considers the present value of expected payments, discounted using a risk-adjusted discount rate. The expected payments are determined by considering the possible scenarios of expected dividends, the amount to be paid under each scenario and the proba-bility of each scenario.
Risk-adjusted maturity-specific discount rate(2.0% – 3.2%)
The estimated fair value would increase (decrease) if the dividends were higher (lower) or the risk-adjusted discount rate was lower (higher).
AfS
Investments in other equity instruments
These equity instruments do not have a quoted market price in an active market. Existing contractual arrangements are used in order to calculate the fair value as at December 31, 2017.
See column ‘Valuation method’ AfS
Earn-out components (liabilities) The discounted cash flow method is applied, which considers the present value of expected payments, discounted using a risk-adjusted discount rate.
Risk-adjusted discount rate(1.75%)
The estimated fair value would increase (decrease) if EBITDA were higher (lower) or the risk-adjusted discount rate were lower (higher).
n.a.
Net gains/(losses) on financial instruments recognized in the consolidated income statement€ in millions
Year ending Dec. 31,
2017
Year ending Dec. 31,
2016
Financial assets or financial liabilities at fair value through profit or loss 1 1
Thereof: designated as such upon initial recognition – –Thereof: classified as held for trading 1 1
Loans and receivables (60) (35)Available-for-sale financial assets (56) (3)Financial liabilities measured at amortized cost 22 15
ADID
AS
ANN
UAL
REPO
RT 2
017
1991 TO OUR SHAREHOLDERS 2 GROUP MANAGEMENT REPORT –
OUR COMPANY3 GROUP MANAGEMENT REPORT –
FINANCIAL REVIEW4 CONSOLIDATED FINANCIAL
STATEMENTS5 ADDITIONAL INFORMATION
NOTES
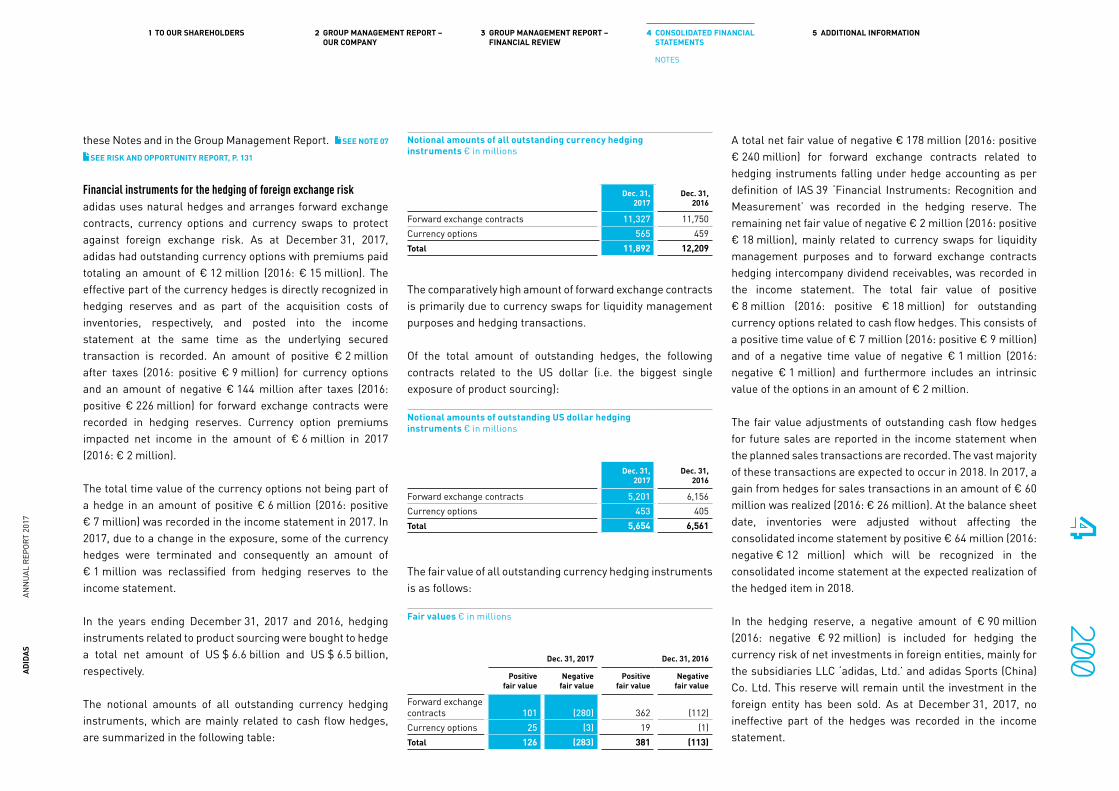
these Notes and in the Group Management Report. SEE NOTE 07 SEE RISK AND OPPORTUNITY REPORT, P. 131
Financial instruments for the hedging of foreign exchange risk adidas uses natural hedges and arranges forward exchange contracts, currency options and currency swaps to protect against foreign exchange risk. As at December 31, 2017, adidas had outstanding currency options with premiums paid totaling an amount of € 12 million (2016: € 15 million). The effective part of the currency hedges is directly recognized in hedging reserves and as part of the acquisition costs of inventories, respectively, and posted into the income statement at the same time as the underlying secured transaction is recorded. An amount of positive € 2 million after taxes (2016: positive € 9 million) for currency options and an amount of negative € 144 million after taxes (2016: positive € 226 million) for forward exchange contracts were recorded in hedging reserves. Currency option premiums impacted net income in the amount of € 6 million in 2017 (2016: € 2 million).
The total time value of the currency options not being part of a hedge in an amount of positive € 6 million (2016: positive € 7 million) was recorded in the income statement in 2017. In 2017, due to a change in the exposure, some of the currency hedges were terminated and consequently an amount of € 1 million was reclassified from hedging reserves to the income statement.
In the years ending December 31, 2017 and 2016, hedging instruments related to product sourcing were bought to hedge a total net amount of US $ 6.6 billion and US $ 6.5 billion, respectively.
The notional amounts of all outstanding currency hedging instruments, which are mainly related to cash flow hedges, are summarized in the following table:
The comparatively high amount of forward exchange contracts is primarily due to currency swaps for liquidity management purposes and hedging transactions.
Of the total amount of outstanding hedges, the following contracts related to the US dollar (i.e. the biggest single exposure of product sourcing):
The fair value of all outstanding currency hedging instruments is as follows:
A total net fair value of negative € 178 million (2016: positive € 240 million) for forward exchange contracts related to hedging instruments falling under hedge accounting as per definition of IAS 39 ‘Financial Instruments: Recognition and Measurement’ was recorded in the hedging reserve. The remaining net fair value of negative € 2 million (2016: positive € 18 million), mainly related to currency swaps for liquidity management purposes and to forward exchange contracts hedging intercompany dividend receivables, was recorded in the income statement. The total fair value of positive € 8 million (2016: positive € 18 million) for outstanding currency options related to cash flow hedges. This consists of a positive time value of € 7 million (2016: positive € 9 million) and of a negative time value of negative € 1 million (2016: negative € 1 million) and furthermore includes an intrinsic value of the options in an amount of € 2 million.
The fair value adjustments of outstanding cash flow hedges for future sales are reported in the income statement when the planned sales transactions are recorded. The vast majority of these transactions are expected to occur in 2018. In 2017, a gain from hedges for sales transactions in an amount of € 60 million was realized (2016: € 26 million). At the balance sheet date, inventories were adjusted without affecting the consolidated income statement by positive € 64 million (2016: negative € 12 million) which will be recognized in the consolidated income statement at the expected realization of the hedged item in 2018.
In the hedging reserve, a negative amount of € 90 million (2016: negative € 92 million) is included for hedging the currency risk of net investments in foreign entities, mainly for the subsidiaries LLC ‘ adidas, Ltd.’ and adidas Sports (China) Co. Ltd. This reserve will remain until the investment in the foreign entity has been sold. As at December 31, 2017, no ineffective part of the hedges was recorded in the income statement.
Notional amounts of all outstanding currency hedging instruments € in millions
Dec. 31, 2017
Dec. 31, 2016
Forward exchange contracts 11,327 11,750Currency options 565 459Total 11,892 12,209
Notional amounts of outstanding US dollar hedging instruments € in millions
Dec. 31, 2017
Dec. 31, 2016
Forward exchange contracts 5,201 6,156Currency options 453 405Total 5,654 6,561
Fair values € in millions
Dec. 31, 2017 Dec. 31, 2016
Positivefair value
Negativefair value
Positivefair value
Negativefair value
Forward exchange contracts 101 (280) 362 (112)Currency options 25 (3) 19 (1)Total 126 (283) 381 (113)
ADID
AS
ANN
UAL
REPO
RT 2
017
2001 TO OUR SHAREHOLDERS 2 GROUP MANAGEMENT REPORT –
OUR COMPANY3 GROUP MANAGEMENT REPORT –
FINANCIAL REVIEW4 CONSOLIDATED FINANCIAL
STATEMENTS5 ADDITIONAL INFORMATION
NOTES
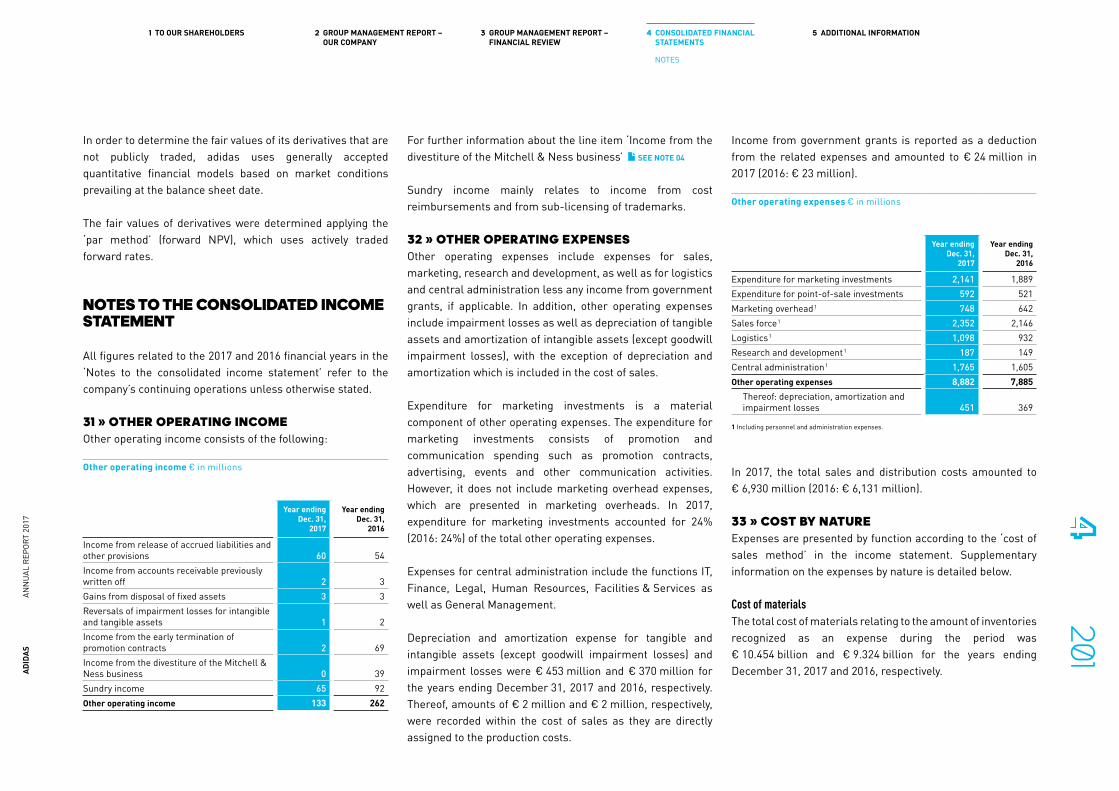
In order to determine the fair values of its derivatives that are not publicly traded, adidas uses generally accepted quantitative financial models based on market conditions prevailing at the balance sheet date.
The fair values of derivatives were determined applying the ‘par method’ (forward NPV), which uses actively traded forward rates.
NOTES TO THE CONSOLIDATED INCOME STATEMENT
All figures related to the 2017 and 2016 financial years in the ‘Notes to the consolidated income statement’ refer to the company’s continuing operations unless otherwise stated.
31 » OTHER OPERATING INCOMEOther operating income consists of the following:
For further information about the line item ‘Income from the divestiture of the Mitchell & Ness business’ SEE NOTE 04
Sundry income mainly relates to income from cost reimbursements and from sub-licensing of trademarks.
32 » OTHER OPERATING EXPENSESOther operating expenses include expenses for sales, marketing, research and development, as well as for logistics and central administration less any income from government grants, if applicable. In addition, other operating expenses include impairment losses as well as depreciation of tangible assets and amortization of intangible assets (except goodwill impairment losses), with the exception of depreciation and amortization which is included in the cost of sales.
Expenditure for marketing investments is a material component of other operating expenses. The expenditure for marketing investments consists of promotion and communication spending such as promotion contracts, advertising, events and other communication activities. However, it does not include marketing overhead expenses, which are presented in marketing overheads. In 2017, expenditure for marketing investments accounted for 24% (2016: 24%) of the total other operating expenses.
Expenses for central administration include the functions IT, Finance, Legal, Human Resources, Facilities & Services as well as General Management.
Depreciation and amortization expense for tangible and intangible assets (except goodwill impairment losses) and impairment losses were € 453 million and € 370 million for the years ending December 31, 2017 and 2016, respectively. Thereof, amounts of € 2 million and € 2 million, respectively, were recorded within the cost of sales as they are directly assigned to the production costs.
Income from government grants is reported as a deduction from the related expenses and amounted to € 24 million in 2017 (2016: € 23 million).
In 2017, the total sales and distribution costs amounted to € 6,930 million (2016: € 6,131 million).
33 » COST BY NATURE Expenses are presented by function according to the ‘cost of sales method’ in the income statement. Supplementary information on the expenses by nature is detailed below.
Cost of materialsThe total cost of materials relating to the amount of inventories recognized as an expense during the period was € 10.454 billion and € 9.324 billion for the years ending December 31, 2017 and 2016, respectively.
Other operating income € in millions
Year ending Dec. 31,
2017
Year ending Dec. 31,
2016
Income from release of accrued liabilities and other provisions 60 54Income from accounts receivable previously written off 2 3Gains from disposal of fixed assets 3 3Reversals of impairment losses for intangible and tangible assets 1 2Income from the early termination of promotion contracts 2 69Income from the divestiture of the Mitchell & Ness business 0 39Sundry income 65 92Other operating income 133 262
Other operating expenses € in millions
Year ending Dec. 31,
2017
Year ending Dec. 31,
2016
Expenditure for marketing investments 2,141 1,889 Expenditure for point-of-sale investments 592 521 Marketing overhead 1 748 642 Sales force 1 2,352 2,146 Logistics 1 1,098 932 Research and development 1 187 149 Central administration 1 1,765 1,605 Other operating expenses 8,882 7,885
Thereof: depreciation, amortization and impairment losses 451 369
1 Including personnel and administration expenses.
ADID
AS
ANN
UAL
REPO
RT 2
017
2011 TO OUR SHAREHOLDERS 2 GROUP MANAGEMENT REPORT –
OUR COMPANY3 GROUP MANAGEMENT REPORT –
FINANCIAL REVIEW4 CONSOLIDATED FINANCIAL
STATEMENTS5 ADDITIONAL INFORMATION
NOTES
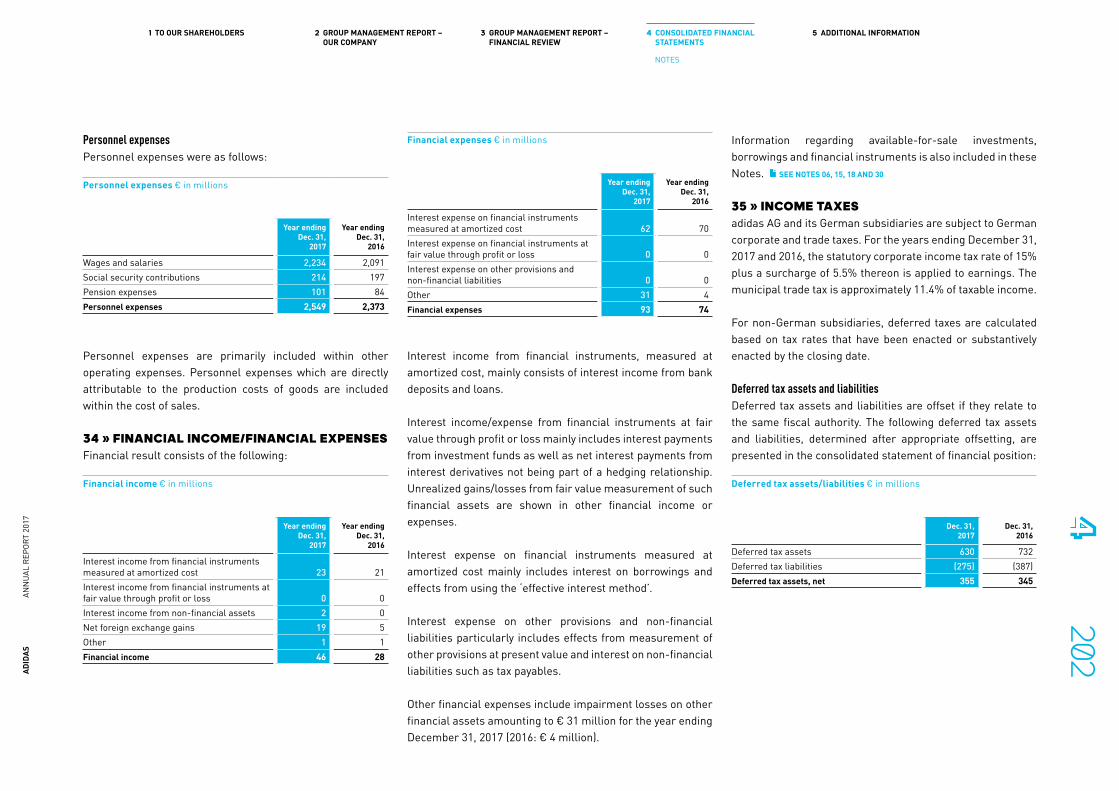
Personnel expensesPersonnel expenses were as follows:
Personnel expenses are primarily included within other operating expenses. Personnel expenses which are directly attributable to the production costs of goods are included within the cost of sales.
34 » FINANCIAL INCOME/FINANCIAL EXPENSES Financial result consists of the following:
Information regarding available-for-sale investments, borrowings and financial instruments is also included in these Notes. SEE NOTES 06, 15, 18 AND 30
35 » INCOME TAXES adidas AG and its German subsidiaries are subject to German corporate and trade taxes. For the years ending December 31, 2017 and 2016, the statutory corporate income tax rate of 15% plus a surcharge of 5.5% thereon is applied to earnings. The municipal trade tax is approximately 11.4% of taxable income.
For non-German subsidiaries, deferred taxes are calculated based on tax rates that have been enacted or substantively enacted by the closing date.
Deferred tax assets and liabilities Deferred tax assets and liabilities are offset if they relate to the same fiscal authority. The following deferred tax assets and liabilities, determined after appropriate offsetting, are presented in the consolidated statement of financial position:
Interest income from financial instruments, measured at amortized cost, mainly consists of interest income from bank deposits and loans.
Interest income/expense from financial instruments at fair value through profit or loss mainly includes interest payments from investment funds as well as net interest payments from interest derivatives not being part of a hedging relationship. Unrealized gains/losses from fair value measurement of such financial assets are shown in other financial income or expenses.
Interest expense on financial instruments measured at amortized cost mainly includes interest on borrowings and effects from using the ‘effective interest method’.
Interest expense on other provisions and non-financial liabilities particularly includes effects from measurement of other provisions at present value and interest on non-financial liabilities such as tax payables.
Other financial expenses include impairment losses on other financial assets amounting to € 31 million for the year ending December 31, 2017 (2016: € 4 million).
Personnel expenses € in millions
Year ending Dec. 31,
2017
Year ending Dec. 31,
2016
Wages and salaries 2,234 2,091Social security contributions 214 197Pension expenses 101 84Personnel expenses 2,549 2,373
Financial income € in millions
Year ending Dec. 31,
2017
Year ending Dec. 31,
2016
Interest income from financial instruments measured at amortized cost 23 21Interest income from financial instruments at fair value through profit or loss 0 0Interest income from non-financial assets 2 0Net foreign exchange gains 19 5Other 1 1Financial income 46 28
Financial expenses € in millions
Year ending Dec. 31,
2017
Year ending Dec. 31,
2016
Interest expense on financial instruments measured at amortized cost 62 70Interest expense on financial instruments at fair value through profit or loss 0 0Interest expense on other provisions and non-financial liabilities 0 0Other 31 4Financial expenses 93 74
Deferred tax assets/liabilities € in millions
Dec. 31, 2017
Dec. 31, 2016
Deferred tax assets 630 732Deferred tax liabilities (275) (387)Deferred tax assets, net 355 345
ADID
AS
ANN
UAL
REPO
RT 2
017
2021 TO OUR SHAREHOLDERS 2 GROUP MANAGEMENT REPORT –
OUR COMPANY3 GROUP MANAGEMENT REPORT –
FINANCIAL REVIEW4 CONSOLIDATED FINANCIAL
STATEMENTS5 ADDITIONAL INFORMATION
NOTES

The movement of deferred taxes is as follows:
Gross company deferred tax assets and liabilities after valuation allowances, but before appropriate offsettings, are attributable to the items detailed in the table below:
Deferred tax assets are recognized only to the extent that the realization of the related benefit is probable. For the assessment of probability, in addition to past performance and the respective prospects for the foreseeable future, appropriate tax structuring measures are also taken into consideration.
Deferred tax assets for which the realization of the related tax benefits is not probable decreased from € 731 million to € 518 million for the year ending December 31, 2017. These amounts mainly relate to tax losses carried forward and unused foreign tax credits of the US tax group, which begin to expire in 2026. The remaining unrecognized deferred tax assets relate to subsidiaries operating in markets where the realization of the related tax benefit is not considered probable.
The divestiture of TaylorMade has been reflected as a share transaction in the US. Under US law, the buyer has the option to elect to treat the transaction as an asset acquisition for income tax purposes. In the event that the buyer chooses this option, the deferred tax assets and liabilities in this regard may change.
adidas does not recognize deferred tax liabilities for unremitted earnings of non-German subsidiaries to the extent that they are expected to be permanently invested in international operations. These earnings, the amount of which cannot be practicably computed, could become subject to additional tax if they were remitted as dividends or if the company were to sell its shareholdings in the subsidiaries.
Tax expensesTax expenses are split as follows:
The current tax expenses include interest and penalties in respect of income tax.
The deferred tax income includes tax income of € 80 million in total (2016: € 29 million) related to the origination and reversal of temporary differences.
Movement of deferred taxes € in millions
2017 2016
Deferred tax assets, net as at January 1 345 269Deferred tax (expense)/income (19) 56Change in consolidated companies 1 (17) 1Change in deferred taxes attributable to remeasurements of defined benefit plans recorded in other comprehensive income 2 (7) 21Change in deferred taxes attributable to the change in the effective portion of the fair value of qualifying hedging instruments recorded in other comprehensive income 3 68 (2)Currency translation differences (15) 0Deferred tax assets, net as at December 31 355 345
1 See Note 04.2 See Note 24.3 See Note 30.
Deferred taxes € in millions
Dec. 31, 2017
Dec. 31, 2016
Non-current assets 150 202Current assets 219 193Accrued liabilities and provisions 302 334Accumulated tax loss carry-forwards 30 76Deferred tax assets 702 805Non-current assets 255 346Current assets 69 68Accrued liabilities and provisions 23 46Deferred tax liabilities 347 460Deferred tax assets, net 355 345
Income tax expenses € in millions
Year ending Dec. 31,
2017
Year ending Dec. 31,
2016
Current tax expenses 649 482Deferred tax expenses/(income) 19 (56)Income tax expenses 668 426
ADID
AS
ANN
UAL
REPO
RT 2
017
2031 TO OUR SHAREHOLDERS 2 GROUP MANAGEMENT REPORT –
OUR COMPANY3 GROUP MANAGEMENT REPORT –
FINANCIAL REVIEW4 CONSOLIDATED FINANCIAL
STATEMENTS5 ADDITIONAL INFORMATION
NOTES

The company’s effective tax rate differs from an assumed tax rate of 30% for the year ending December 31, 2017 as follows:
In 2017, the effective tax rate of 33.0% was affected by the US tax reform. The one-time non-cash effect of € 76 million is reflected in 2017 in the line item ‘Changes in tax rates’. Excluding the effect of the US tax reform, the effective tax rate in 2017 was 29.3%.
For 2016 and 2017, the line item ‘Losses for which benefits were not recognizable and changes in valuation allowances’ mainly related to changes in valuation allowances for Brazil.
For 2017, the line item ‘Changes in tax rates’ mainly reflects tax rate reductions in the US. For 2016, this line item mainly reflected a UK tax rate reduction.
36 » EARNINGS PER SHAREBasic earnings per share are calculated by dividing the net income from continuing operations attributable to shareholders by the weighted average number of shares outstanding during the year, excluding ordinary shares purchased by adidas and held as treasury shares.
It is necessary to include 1.8 million and 6.0 million potential dilutive shares arising from the convertible bond issuance in March 2012 in the calculation of diluted earnings per share in 2017 and 2016, respectively, as due to the potential dilutive shares a dilutive effect resulted as at the balance sheet date.
SEE NOTE 18 The average share price reached € 176.02 per share during 2017 and thus exceeded the conversion price of € 81.13 per share. As a consequence of contractual provisions relating to dividend protection, the conversion price was adjusted from € 81.57 to € 81.13 per share. This adjustment became effective on May 12, 2017.
The bonus shares vested under the equity-settled share-based payment program with third parties were not considered in the calculation of the diluted earnings per share because the conditions have not yet been met. SEE NOTE 27
Tax rate reconciliation
Year ending Dec. 31, 2017 Year ending Dec. 31, 2016
€ in millions in %
€ in millions in %
Expected income tax expenses 607 30.0 434 30.0Tax rate differentials (215) (10.6) (160) (11.0)Non-deductible expenses 44 2.2 48 3.3Losses for which benefits were not recognizable and changes in valuation allowances 37 1.8 51 3.5Changes in tax rates 87 4.3 (8) (0.5)Other, net 2 0.1 0 0.0 563 27.8 365 25.3Withholding tax expenses 105 5.2 61 4.2Income tax expenses 668 33.0 426 29.5
ADID
AS
ANN
UAL
REPO
RT 2
017
2041 TO OUR SHAREHOLDERS 2 GROUP MANAGEMENT REPORT –
OUR COMPANY3 GROUP MANAGEMENT REPORT –
FINANCIAL REVIEW4 CONSOLIDATED FINANCIAL
STATEMENTS5 ADDITIONAL INFORMATION
NOTES

For further information on basic and diluted earnings per share from discontinued operations SEE NOTE 03
ADDITIONAL INFORMATION
37 » SEGMENTAL INFORMATION adidas operates predominantly in one industry segment – the design, distribution and marketing of athletic and sports lifestyle products.
As at December 31, 2017, following the company’s internal management reporting by markets and in accordance with the definition of IFRS 8 ‘Operating Segments’, 13 operating segments were identified: Western Europe, North America (excluding USA Reebok), USA Reebok, Greater China, Russia/CIS, Latin America, Japan, Middle East, South Korea, Southeast Asia/Pacific, adidas Golf, Runtastic and Other centrally managed businesses. Due to the completed divestitures of the former TaylorMade and CCM Hockey operating segments on October 2, 2017 and September 1, 2017, respectively, income and expenses of the former TaylorMade and CCM Hockey operating segments were reported as discontinued operations as at December 31, 2017. SEE NOTE 03 In 2017, the former operating segment North America was split into two operating segments: North America (excluding USA Reebok) and USA Reebok. The operating segments Middle East, South Korea and Southeast Asia/Pacific were aggregated to MEAA (’Middle East, Africa and other Asian markets’). The operating segments North America (excluding USA Reebok) and USA Reebok were aggregated to North America. Furthermore, the former operating segment TaylorMade- adidas Golf was split into the operating segments TaylorMade and adidas Golf. According to the criteria of IFRS 8 for reportable segments, the operating segments Western Europe, North America, Greater China, Russia/CIS, Latin America, Japan and MEAA are reported separately. The remaining operating segments are aggregated under Other Businesses due to their only subordinate materiality. Historic and estimated future economic indicators that have been assessed in determining
Earnings per share
Continuing operations Discontinued operations Total
Year ending Dec. 31, 2017
Year ending Dec. 31, 2016
Year ending Dec. 31, 2017
Year ending Dec. 31, 2016
Year ending Dec. 31, 2017
Year ending Dec. 31, 2016
Net income from continuing operations (€ in millions) 1,354 1,082 – – – –Net income attributable to non-controlling interests (€ in millions) 3 2 – – – –Net income attributable to shareholders (€ in millions) 1,352 1,079 (254) (62) 1,097 1,017Weighted average number of shares 202,391,673 200,188,276 202,391,673 200,188,276 202,391,673 200,188,276Basic earnings per share (in €) 6.68 5.39 (1.26) (0.31) 5.42 5.08
Net income attributable to shareholders (€ in millions) 1,352 1,079 (254) (62) 1,097 1,017Interest expense on convertible bond, net of taxes (€ in millions) 1 12 – – 1 12Net income used to determine diluted earnings per share (€ in millions) 1,353 1,091 (254) (62) 1,099 1,029Weighted average number of shares 202,391,673 200,188,276 202,391,673 200,188,276 202,391,673 200,188,276Weighted assumed conversion of the convertible bond 1,846,245 5,958,632 1,846,245 5,958,632 1,846,245 5,958,632Dilutive effect of share-based payments 2,712 – 2,712 – 2,712 –Weighted average number of shares for diluted earnings per share 204,240,629 206,146,908 204,240,629 206,146,908 204,240,629 206,146,908
Diluted earnings per share (in €) 6.63 5.29 (1.26) (0.31) 5.38 4.99
ADID
AS
ANN
UAL
REPO
RT 2
017
2051 TO OUR SHAREHOLDERS 2 GROUP MANAGEMENT REPORT –
OUR COMPANY3 GROUP MANAGEMENT REPORT –
FINANCIAL REVIEW4 CONSOLIDATED FINANCIAL
STATEMENTS5 ADDITIONAL INFORMATION
NOTES
that the aggregated operating segments share similar characteristics were profitability characteristics on net margin and contribution level, gross domestic product (GDP) growth rates as well as consumer price inflation.
Each market comprises all wholesale, retail and e-commerce business activities relating to the distribution and sale of products of the adidas and Reebok brands to retail customers and end consumers.
adidas Golf comprises the distribution and sale of adidas Golf branded products.
Runtastic operates in the digital health and fitness space. The company provides a comprehensive ecosystem for tracking and managing health and fitness data.
Other centrally managed businesses primarily includes the business activities of the Y-3 label.
Certain centralized corporate functions do not meet the definition of IFRS 8 for an operating segment. This includes, in particular, functions such as Global Brands and Global Sales (central brand and distribution management for the adidas and Reebok brands), central treasury, global sourcing as well as other headquarter functions. Assets, liabilities, income and expenses relating to these corporate functions are presented in the reconciliations.
The chief operating decision maker for adidas has been defined as the entire Executive Board of adidas AG.
There are no intersegment sales between the reportable segments. Accounting and valuation policies applied for reporting segmental information are the same as those used for adidas. SEE NOTE 02
The results of the operating segments are reported in the line item ‘Segmental operating profit’. This is defined as gross profit minus other operating expenses plus royalty and commission income and other operating income attributable to the segment or group of segments, however without considering headquarter costs and central expenditure for marketing investments.
Segmental assets include accounts receivable as well as inventories. Only these items are reported to the chief operating decision maker on a regular basis. Depreciation, amortization, impairment losses (except for goodwill) and reversals of impairment losses as well as capital expenditures for tangible and intangible assets are part of the segmental reporting, even though segmental assets do not contain tangible and intangible assets. Depreciation and amortization as well as impairment losses and reversals of impairment losses not directly attributable to a segment or a group of segments are presented under HQ and Consolidation in the reconciliations.
Segmental liabilities only contain accounts payable from operating activities as there are no other liability items reported regularly to the chief operating decision maker.
Interest income and interest expenses as well as income taxes are not allocated to the reportable segments and are not reported separately to the chief operating decision maker.
ADID
AS
ANN
UAL
REPO
RT 2
017
2061 TO OUR SHAREHOLDERS 2 GROUP MANAGEMENT REPORT –
OUR COMPANY3 GROUP MANAGEMENT REPORT –
FINANCIAL REVIEW4 CONSOLIDATED FINANCIAL
STATEMENTS5 ADDITIONAL INFORMATION
NOTES

ReconciliationsThe following tables include reconciliations of segmental information to the aggregate numbers of the consolidated financial statements, taking into account items which are not directly attributable to a segment or a group of segments.
Segmental information I € in millions
Net sales(third parties) 1
Segmentaloperating profit 1
Segmentalassets 2
Segmentalliabilities 2
2017 2016 2017 2016 2017 2016 2017 2016
Western Europe 5,883 5,291 1,178 951 1,728 1,595 129 200North America 4,275 3,412 468 214 1,500 1,273 77 117Greater China 3,789 3,010 1,342 1,060 627 507 153 167Russia/CIS 660 679 136 105 216 284 7 6Latin America 1,907 1,731 268 227 724 757 66 73Japan 1,056 1,007 266 207 236 218 44 38MEAA 2,907 2,685 847 722 715 751 88 90Reportable segments 20,479 17,816 4,504 3,485 5,747 5,385 563 691Other Businesses (continuing operations) 739 667 68 52 306 594 26 143Other Businesses (discontinued operations) 667 808 26 (66) – – – –Other Businesses 1,405 1,475 95 (14) 306 594 26 143Total 21,885 19,291 4,599 3,471 6,053 5,978 589 834
1 Year ending December 31.2 At December 31.
Segmental information II € in millions
Capitalexpenditure 1
Depreciation and amortization 1
Impairment lossesand reversals of
impairment losses 1
2017 2016 2017 2016 2017 2016
Western Europe 75 76 50 40 1 1North America 62 87 32 21 4 2Greater China 120 97 71 52 2 2Russia/CIS 38 47 27 21 1 0Latin America 29 48 28 22 1 0Japan 20 14 14 13 0 1MEAA 41 60 36 31 2 1Reportable segments 385 430 258 199 11 7Other Businesses (continuing operations) 9 5 10 12 13 (1)Other Businesses (discontinued operations) 7 7 7 14 7 2Other Businesses 16 12 17 26 20 1Total 401 442 275 225 30 8
1 Year ending December 31.
Net sales (third parties) € in millions
Year ending Dec. 31,
2017
Year ending Dec. 31,
2016
Reportable segments 20,479 17,816Other Businesses 1,405 1,475Reclassification to discontinued operations (667) (808)Total 21,218 18,483
Operating profit € in millions
Year ending Dec. 31,
2017
Year ending Dec. 31,
2016
Operating profit for reportable segments 4,504 3,485Operating profit for Other Businesses 95 (14)Segmental operating profit 4,599 3,471Reclassification to discontinued operations (26) 66HQ (1,623) (1,327)Central expenditure for marketing investments (842) (703)Consolidation (38) 74Operating profit 2,070 1,582Financial income 46 28Financial expenses (93) (74)Income before taxes 2,023 1,536
ADID
AS
ANN
UAL
REPO
RT 2
017
2071 TO OUR SHAREHOLDERS 2 GROUP MANAGEMENT REPORT –
OUR COMPANY3 GROUP MANAGEMENT REPORT –
FINANCIAL REVIEW4 CONSOLIDATED FINANCIAL
STATEMENTS5 ADDITIONAL INFORMATION
NOTES
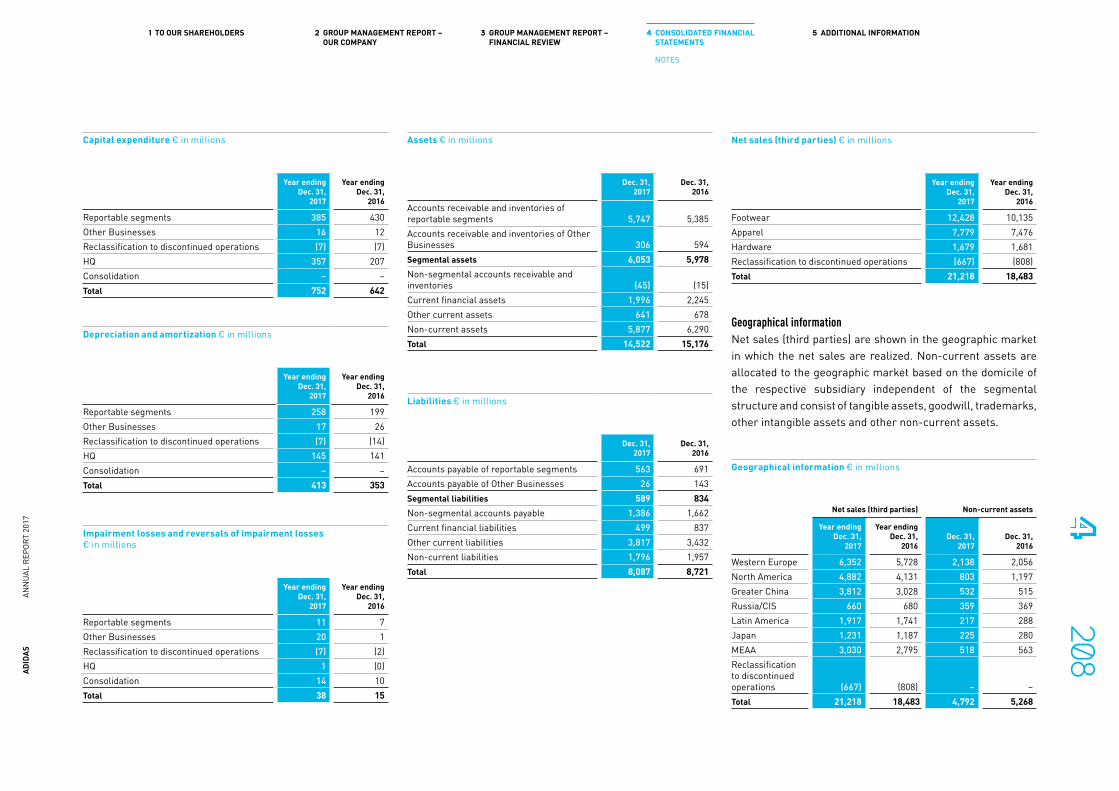
Geographical informationNet sales (third parties) are shown in the geographic market in which the net sales are realized. Non-current assets are allocated to the geographic market based on the domicile of the respective subsidiary independent of the segmental structure and consist of tangible assets, goodwill, trademarks, other intangible assets and other non-current assets.
Capital expenditure € in millions
Year ending Dec. 31,
2017
Year ending Dec. 31,
2016
Reportable segments 385 430Other Businesses 16 12Reclassification to discontinued operations (7) (7)HQ 357 207Consolidation – –Total 752 642
Impairment losses and reversals of impairment losses € in millions
Year ending Dec. 31,
2017
Year ending Dec. 31,
2016
Reportable segments 11 7Other Businesses 20 1Reclassification to discontinued operations (7) (2)HQ 1 (0)Consolidation 14 10Total 38 15
Assets € in millions
Dec. 31, 2017
Dec. 31, 2016
Accounts receivable and inventories of reportable segments 5,747 5,385Accounts receivable and inventories of Other Businesses 306 594Segmental assets 6,053 5,978Non-segmental accounts receivable and inventories (45) (15)Current financial assets 1,996 2,245Other current assets 641 678Non-current assets 5,877 6,290Total 14,522 15,176
Liabilities € in millions
Dec. 31, 2017
Dec. 31, 2016
Accounts payable of reportable segments 563 691Accounts payable of Other Businesses 26 143Segmental liabilities 589 834Non-segmental accounts payable 1,386 1,662Current financial liabilities 499 837Other current liabilities 3,817 3,432Non-current liabilities 1,796 1,957Total 8,087 8,721
Depreciation and amortization € in millions
Year ending Dec. 31,
2017
Year ending Dec. 31,
2016
Reportable segments 258 199Other Businesses 17 26Reclassification to discontinued operations (7) (14)HQ 145 141Consolidation – –Total 413 353
Net sales (third parties) € in millions
Year ending Dec. 31,
2017
Year ending Dec. 31,
2016
Footwear 12,428 10,135Apparel 7,779 7,476Hardware 1,679 1,681Reclassification to discontinued operations (667) (808)Total 21,218 18,483
Geographical information € in millions
Net sales (third parties) Non-current assets
Year ending Dec. 31,
2017
Year ending Dec. 31,
2016 Dec. 31,
2017 Dec. 31,
2016
Western Europe 6,352 5,728 2,138 2,056North America 4,882 4,131 803 1,197Greater China 3,812 3,028 532 515Russia/CIS 660 680 359 369Latin America 1,917 1,741 217 288Japan 1,231 1,187 225 280MEAA 3,030 2,795 518 563Reclassification to discontinued operations (667) (808) – –Total 21,218 18,483 4,792 5,268
ADID
AS
ANN
UAL
REPO
RT 2
017
2081 TO OUR SHAREHOLDERS 2 GROUP MANAGEMENT REPORT –
OUR COMPANY3 GROUP MANAGEMENT REPORT –
FINANCIAL REVIEW4 CONSOLIDATED FINANCIAL
STATEMENTS5 ADDITIONAL INFORMATION
NOTES

With regard to Germany, Western Europe contains net sales (third parties) (continuing operations) amounting to € 1,226 million and € 1,092 million as well as non-current assets amounting to € 1,082 million and € 1,015 million for the years 2017 and 2016, respectively. With regard to the USA, North America contains net sales (third parties) (continuing operations) amounting to € 4,092 million and € 3,253 million as well as non-current assets amounting to € 695 million and € 1,062 million for the years 2017 and 2016, respectively.
38 » ADDITIONAL CASH FLOW INFORMATIONIn 2017, the increase in cash generated from operating activities compared to the prior year was primarily due to an increase in income before taxes which was partly offset by higher operating working capital requirements and an increase in income taxes paid.
Net cash used in investing activities in 2017 mainly related to spending for property, plant and equipment such as investments in the furnishing and fitting of own-retail stores, in new office buildings and IT systems and the purchase of financial assets and other long-term assets. This was partly offset by proceeds from the disposal of discontinued operations.
Net cash used in financing activities mainly related to the dividend paid to shareholders of adidas AG, the repayment of short-term borrowings and the repurchase of treasury shares.
As of October 2, 2017, the TaylorMade operating segment was divested. The following assets and liabilities were consequently derecognized from the consolidated statement of financial position as of October 2, 2017:
As of September 1, 2017, the CCM Hockey operating segment was divested. The following assets and liabilities were consequently derecognized from the consolidated statement of financial position as of September 1, 2017:
In 2017, the following changes in financial liabilities impacted the net cash used in financing activities:
Impact of divestiture on items in the consolidated statement of financial position € in millions
October 2, 2017
Cash and cash equivalents (11)Current assets (234)Non-current assets (93)Liabilities 153Net assets (185)
Consideration received in cash 131Less: cash and cash equivalents disposed of (11)Net cash inflow 119
Impact of divestiture on items in the consolidated statement of financial position € in millions
September 1, 2017
Cash and cash equivalents (10)Current assets (138)Non-current assets 0Liabilities 55Net assets (94)
Consideration received in cash 65Less: cash and cash equivalents disposed of (10)Net cash inflow 55
Net cash generated from discontinued operations € in millions
Year ending Dec. 31,
2017
Year ending Dec. 31,
2016
Net cash generated from operating activities 6 39Net cash (used in) investing activities (4) (9)Net cash (used in) financing activities (0) (9)Net cash generated from discontinued operations 2 22
ADID
AS
ANN
UAL
REPO
RT 2
017
2091 TO OUR SHAREHOLDERS 2 GROUP MANAGEMENT REPORT –
OUR COMPANY3 GROUP MANAGEMENT REPORT –
FINANCIAL REVIEW4 CONSOLIDATED FINANCIAL
STATEMENTS5 ADDITIONAL INFORMATION
NOTES
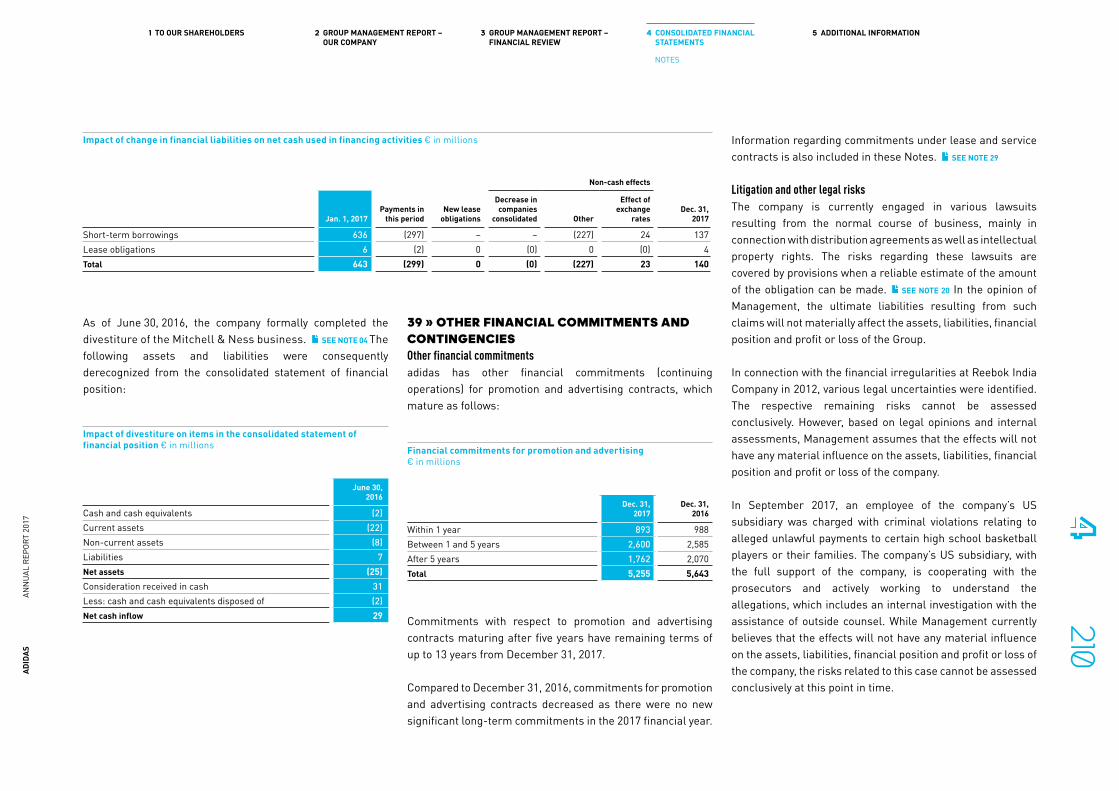
As of June 30, 2016, the company formally completed the divestiture of the Mitchell & Ness business. SEE NOTE 04 The following assets and liabilities were consequently derecognized from the consolidated statement of financial position:
39 » OTHER FINANCIAL COMMITMENTS AND CONTINGENCIESOther financial commitments adidas has other financial commitments (continuing operations) for promotion and advertising contracts, which mature as follows:
Commitments with respect to promotion and advertising contracts maturing after five years have remaining terms of up to 13 years from December 31, 2017.
Compared to December 31, 2016, commitments for promotion and advertising contracts decreased as there were no new significant long-term commitments in the 2017 financial year.
Information regarding commitments under lease and service contracts is also included in these Notes. SEE NOTE 29
Litigation and other legal risksThe company is currently engaged in various lawsuits resulting from the normal course of business, mainly in connection with distribution agreements as well as intellectual property rights. The risks regarding these lawsuits are covered by provisions when a reliable estimate of the amount of the obligation can be made. SEE NOTE 20 In the opinion of Management, the ultimate liabilities resulting from such claims will not materially affect the assets, liabilities, financial position and profit or loss of the Group.
In connection with the financial irregularities at Reebok India Company in 2012, various legal uncertainties were identified. The respective remaining risks cannot be assessed conclusively. However, based on legal opinions and internal assessments, Management assumes that the effects will not have any material influence on the assets, liabilities, financial position and profit or loss of the company.
In September 2017, an employee of the company’s US subsidiary was charged with criminal violations relating to alleged unlawful payments to certain high school basketball players or their families. The company’s US subsidiary, with the full support of the company, is cooperating with the prosecutors and actively working to understand the allegations, which includes an internal investigation with the assistance of outside counsel. While Management currently believes that the effects will not have any material influence on the assets, liabilities, financial position and profit or loss of the company, the risks related to this case cannot be assessed conclusively at this point in time.
Financial commitments for promotion and advertising € in millions
Dec. 31, 2017
Dec. 31, 2016
Within 1 year 893 988Between 1 and 5 years 2,600 2,585After 5 years 1,762 2,070Total 5,255 5,643
Impact of divestiture on items in the consolidated statement of financial position € in millions
June 30, 2016
Cash and cash equivalents (2)Current assets (22)Non-current assets (8)Liabilities 7Net assets (25)Consideration received in cash 31Less: cash and cash equivalents disposed of (2)Net cash inflow 29
Impact of change in financial liabilities on net cash used in financing activities € in millions
Non-cash effects
Jan. 1, 2017Payments in
this periodNew lease
obligations
Decrease in companies
consolidated Other
Effect of exchange
ratesDec. 31,
2017
Short-term borrowings 636 (297) – – (227) 24 137Lease obligations 6 (2) 0 (0) 0 (0) 4Total 643 (299) 0 (0) (227) 23 140
ADID
AS
ANN
UAL
REPO
RT 2
017
2101 TO OUR SHAREHOLDERS 2 GROUP MANAGEMENT REPORT –
OUR COMPANY3 GROUP MANAGEMENT REPORT –
FINANCIAL REVIEW4 CONSOLIDATED FINANCIAL
STATEMENTS5 ADDITIONAL INFORMATION
NOTES

40 » RELATED PARTY DISCLOSURESAccording to the definitions of IAS 24 ‘Related Party Disclosures’, the Supervisory Board and the Executive Board of adidas AG have been identified as related parties who solely receive remuneration in connection with their function as key management personnel. For information about the remuneration of the Supervisory Board and the Executive Board of adidas AG SEE NOTE 41 SEE COMPENSATION REPORT, P. 39
In addition, adidas Pension Trust e.V., a registered association, is regarded as a related party. Based on a Contractual Trust Arrangement, adidas Pension Trust e.V. manages the plan assets in the form of an administrative trust to fund and protect part of the pension obligations of adidas AG. SEE NOTE 24
Employees, senior executives and members of the Executive Board of adidas AG can be members of the registered association. adidas AG has the right to claim a refund of pension payments from adidas Pension Trust e.V. under specific contractually agreed conditions.
41 » OTHER INFORMATION Employees The average numbers of employees (continuing operations) are as follows:
Accountant service fees for the auditor of the financial statementsThe expenses for the audit fees comprise the expenses of adidas AG, Herzogenaurach, as well as all German subsidiaries of adidas AG. In 2017, the expenses for the professional audit service fees for the auditor KPMG AG Wirtschafts prüfungsgesellschaft amounted to € 1.6 million (2016: € 1.3 million).
Expenses for tax consultancy services provided by the auditor, for other confirmation services provided by the auditor and for other services provided by the auditor amounted to € 0.1 million (2016: € 0.1 million), € 0.1 million (2016: € 0.0 million) and € 0.0 million (2016: € 0.1 million), respectively.
Expenses for the audit fees of KPMG AG Wirtschafts-prüfungsgesellschaft were mainly related to the audits of both the consolidated financial statements and the financial statements of adidas AG, as well as the audit of the financial statements of its subsidiary, adidas CDC Immobilieninvest GmbH. Integrated IT project audits were also conducted.
Other confirmation services consist of audits which are either required by law or contractually agreed, such as European Market Infrastructure Regulation (EMIR) audits according to § 20 WpHG, audits according to the German Packaging Ordinance (Verpackungsverordnung – VerpackV), audits of the utilization of funds, and other contractually agreed-upon confirmation services.
The tax consultancy services include support services for transfer pricing and consulting for sales taxes on a case-by-case basis.
Other services provided by the auditor consist of supporting services to ensure the quality of sales transactions and of legal consultancy services.
Employees
Year ending Dec. 31,
2017
Year ending Dec. 31,
2016
Own retail 32,349 33,307Sales 3,981 3,778Logistics 5,914 5,876Marketing 5,717 4,959Central administration 5,114 4,840Production 1,241 1,150Research and development 1,059 967Information technology 1,204 1,169Total 56,577 56,046
ADID
AS
ANN
UAL
REPO
RT 2
017
2111 TO OUR SHAREHOLDERS 2 GROUP MANAGEMENT REPORT –
OUR COMPANY3 GROUP MANAGEMENT REPORT –
FINANCIAL REVIEW4 CONSOLIDATED FINANCIAL
STATEMENTS5 ADDITIONAL INFORMATION
NOTES

Remuneration of the Supervisory Board and the Executive Board of adidas AGSupervisory BoardPursuant to the Articles of Association, the Supervisory Board members’ fixed annual payment amounted to € 1.8 million (2016: € 1.3 million).
Members of the Supervisory Board were not granted any loans or advance payments in 2017.
Executive BoardIn 2017, the overall compensation of the members of the Executive Board totaled € 23.3 million (2016: € 21.2 million), € 23.3 million thereof relates to short-term benefits (2016: € 11.3 million) and € 0.0 million to long-term benefits (2016: € 9.9 million). Post-employment benefits (costs for accrued pension entitlements for members of the Executive Board as well as follow-up bonuses for resigned members of the Executive Board) totaled € 4.9 million (2016: € 4.8 million).
In 2017, former members of the Executive Board and their survivors received pension payments totaling € 3.7 million (2016: € 3.6 million).
Pension obligations relating to former members of the Executive Board and their survivors amount in total to € 84.7 million (2016: € 75.3 million).
Benefits confirmed to former members of the Executive Board in 2017 due to the termination of their Executive Board mandates were recognized in the consolidated income statement and amounted to € 1.4 million (2016: € 2.6 million).
Current members of the Executive Board were not granted any loans or advance payments in 2017.
Advance payments were made to a former member of the Executive Board with regard to the Performance Bonus for 2017 and prorated for 2018, as well as with regard to the LTIP 2015/2017.
Further information on disclosures according to § 314 section 1 no. 6a HGB is provided in the Compensation Report.
SEE COMPENSATION REPORT, P. 39
42 » INFORMATION RELATING TO THE GERMAN CORPORATE GOVERNANCE CODE
Information pursuant to § 161 German Stock Corporation Act (Aktiengesetz – AktG)In February 2018, the Executive Board and Supervisory Board of adidas AG issued an updated Declaration of Compliance in accordance with § 161 AktG and made it permanently available to the shareholders. The full text of the Declaration of Compliance is available on the company’s corporate website.
43 » EVENTS AFTER THE BALANCE SHEET DATECompany-specific subsequent eventsNo company-specific subsequent events are known which might have a material influence on the assets, liabilities, financial position and profit or loss of the company.
Date of preparationThe Executive Board of adidas AG prepared and approved the consolidated financial statements for submission to the Supervisory Board on February 23, 2018. It is the Supervisory Board’s task to examine the consolidated financial statements and give their approval and authorization for issue.
Herzogenaurach, February 23, 2018
The Executive Board of adidas AG
Kasper Rorsted Roland Auschel Eric Liedtke
Harm Ohlmeyer Karen Parkin Gil Steyaert
ADID
AS
ANN
UAL
REPO
RT 2
017
2121 TO OUR SHAREHOLDERS 2 GROUP MANAGEMENT REPORT –
OUR COMPANY3 GROUP MANAGEMENT REPORT –
FINANCIAL REVIEW4 CONSOLIDATED FINANCIAL
STATEMENTS5 ADDITIONAL INFORMATION
NOTES

Statement of Movements of Intangible and Tangible Assets € in millions Attachment 1
Goodwill Trademarks
Software, patents and concessions
Internally generated
software Total intangible
assets
Land, land leases, buildings
and leasehold improvements
Technical equipment and
machinery
Other equipment,
furniture and fixtures
Construction in progress
Total tangible assets
Acquisition cost
January 1, 2016 1,879 1,628 865 20 4,392 1,319 300 1,502 100 3,221 Currency effect 29 53 12 – 93 28 10 33 1 73 Additions – – 65 – 65 87 27 272 201 586 Transfers to assets held for sale – – (6) – (6) (0) (0) (1) – (1)Transfers – 0 (2) – (2) (8) 13 79 (82) 2 Disposals (0) – (29) – (29) (31) (25) (175) (2) (233)December 31, 2016/January 1, 2017 1,908 1,681 904 20 4,513 1,395 325 1,710 218 3,648 Currency effect (119) (197) (40) – (356) (83) (20) (118) (10) (231)Additions – – 74 – 74 89 27 300 266 681 Transfers to assets held for sale (113) (152) (101) – (366) (156) (31) (66) (4) (256)Decrease in companies consolidated (0) – (0) – (0) (0) 0 0 0 (0)Transfers – – (2) – (2) 48 6 36 (89) 1 Disposals – – (17) – (17) (52) (18) (142) (3) (215)December 31, 2017 1,675 1,332 819 20 3,846 1,242 288 1,721 378 3,629
STATEMENT OF MOVEMENTS OF INTANGIBLE AND TANGIBLE ASSETS
ADID
AS
ANN
UAL
REPO
RT 2
017
2131 TO OUR SHAREHOLDERS 2 GROUP MANAGEMENT REPORT –
OUR COMPANY3 GROUP MANAGEMENT REPORT –
FINANCIAL REVIEW4 CONSOLIDATED FINANCIAL
STATEMENTS5 ADDITIONAL INFORMATION
STATEMENT OF MOVEMENTS OF INTANGIBLE AND TANGIBLE ASSETS
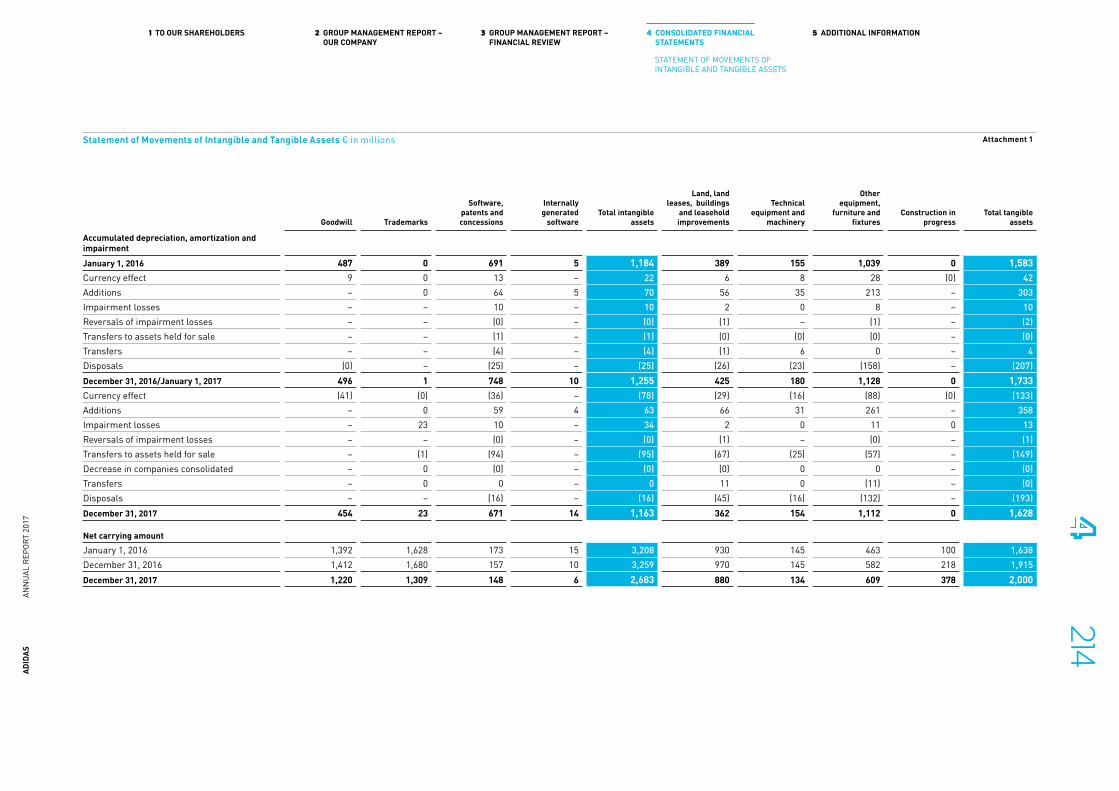
Statement of Movements of Intangible and Tangible Assets € in millions Attachment 1
Goodwill Trademarks
Software, patents and concessions
Internally generated
software Total intangible
assets
Land, land leases, buildings
and leasehold improvements
Technical equipment and
machinery
Other equipment,
furniture and fixtures
Construction in progress
Total tangible assets
Accumulated depreciation, amortization and impairment
January 1, 2016 487 0 691 5 1,184 389 155 1,039 0 1,583 Currency effect 9 0 13 – 22 6 8 28 (0) 42 Additions – 0 64 5 70 56 35 213 – 303 Impairment losses – – 10 – 10 2 0 8 – 10 Reversals of impairment losses – – (0) – (0) (1) – (1) – (2)Transfers to assets held for sale – – (1) – (1) (0) (0) (0) – (0)Transfers – – (4) – (4) (1) 6 0 – 4 Disposals (0) – (25) – (25) (26) (23) (158) – (207)December 31, 2016/January 1, 2017 496 1 748 10 1,255 425 180 1,128 0 1,733 Currency effect (41) (0) (36) – (78) (29) (16) (88) (0) (133)Additions – 0 59 4 63 66 31 261 – 358 Impairment losses – 23 10 – 34 2 0 11 0 13 Reversals of impairment losses – – (0) – (0) (1) – (0) – (1)Transfers to assets held for sale – (1) (94) – (95) (67) (25) (57) – (149)Decrease in companies consolidated – 0 (0) – (0) (0) 0 0 – (0)Transfers – 0 0 – 0 11 0 (11) – (0)Disposals – – (16) – (16) (45) (16) (132) – (193)December 31, 2017 454 23 671 14 1,163 362 154 1,112 0 1,628
Net carrying amount January 1, 2016 1,392 1,628 173 15 3,208 930 145 463 100 1,638 December 31, 2016 1,412 1,680 157 10 3,259 970 145 582 218 1,915 December 31, 2017 1,220 1,309 148 6 2,683 880 134 609 378 2,000
ADID
AS
ANN
UAL
REPO
RT 2
017
2141 TO OUR SHAREHOLDERS 2 GROUP MANAGEMENT REPORT –
OUR COMPANY3 GROUP MANAGEMENT REPORT –
FINANCIAL REVIEW4 CONSOLIDATED FINANCIAL
STATEMENTS5 ADDITIONAL INFORMATION
STATEMENT OF MOVEMENTS OF INTANGIBLE AND TANGIBLE ASSETS

SHAREHOLDINGS
Shareholdings of adidas AG, Herzogenaurach at December 31, 2017
Company and Domicile Currency
Equity (currency units
in thousands)Share in capital
held by 1 in %
Germany1 adidas Insurance & Risk Consultants GmbH 2 Herzogenaurach (Germany) EUR 26 directly 1002 adidas Beteiligungsgesellschaft mbH 2 Herzogenaurach (Germany) EUR 681,990 directly 1003 adidas CDC Immobilieninvest GmbH Herzogenaurach (Germany) EUR 8,702 14 1004 adidas Verwaltungsgesellschaft mbH 3 Herzogenaurach (Germany) EUR 4,303 76 1005 adidas anticipation GmbH 2 Herzogenaurach (Germany) EUR 25 directly 100
Europe (incl. Middle East and Africa)6 adidas sport gmbh Cham (Switzerland) CHF 6,721 directly 1007 adidas Austria GmbH Klagenfurt (Austria) EUR 6,926 directly 95.89
6 4.118 runtastic GmbH Pasching (Austria) EUR 999 10 1009 adidas France S.a.r.l. Landersheim (France) EUR 200,297 directly 10010 adidas International B.V. Amsterdam (Netherlands) EUR 6,832,931 directly 93.97
9 6.0311 adidas International Trading B.V. Amsterdam (Netherlands) EUR 1,626,127 10 10012 adidas International Marketing B.V. Amsterdam (Netherlands) EUR 54,009 10 10013 adidas International Finance B.V. Amsterdam (Netherlands) EUR 46,191 10 10014 adidas International Property Holding B.V. Amsterdam (Netherlands) EUR 50,955 86 10015 adidas Infrastructure Holding B.V. Amsterdam (Netherlands) EUR (23) 10 10016 adidas Benelux B.V. Amsterdam (Netherlands) EUR 4,663 directly 10017 Hydra Ventures B.V. Amsterdam (Netherlands) EUR (17,979) 10 10018 adidas (UK) Limited Stockport (Great Britain) GBP 30,907 10 10019 Reebok International Limited 5 London (Great Britain) EUR 340,383 76 10020 Trafford Park DC Limited London (Great Britain) GBP 1,089 15 10021 Reebok Pensions Management Limited 3, 5 London (Great Britain) GBP – 19 10022 Reebok Europe Holdings London (Great Britain) GBP 26,493 19 100
1 The number refers to the number of the company.2 Profit and loss transfer agreement. 3 Company with no active business.4 Sub-group Reebok International Ltd.5 Sub-group Reebok International Limited.6 Sub-group adidas Indy, LLC (formerly: Sports Licensed Division of the adidas Group, LLC).
ADID
AS
ANN
UAL
REPO
RT 2
017
2151 TO OUR SHAREHOLDERS 2 GROUP MANAGEMENT REPORT –
OUR COMPANY3 GROUP MANAGEMENT REPORT –
FINANCIAL REVIEW4 CONSOLIDATED FINANCIAL
STATEMENTS5 ADDITIONAL INFORMATION
SHAREHOLDINGS
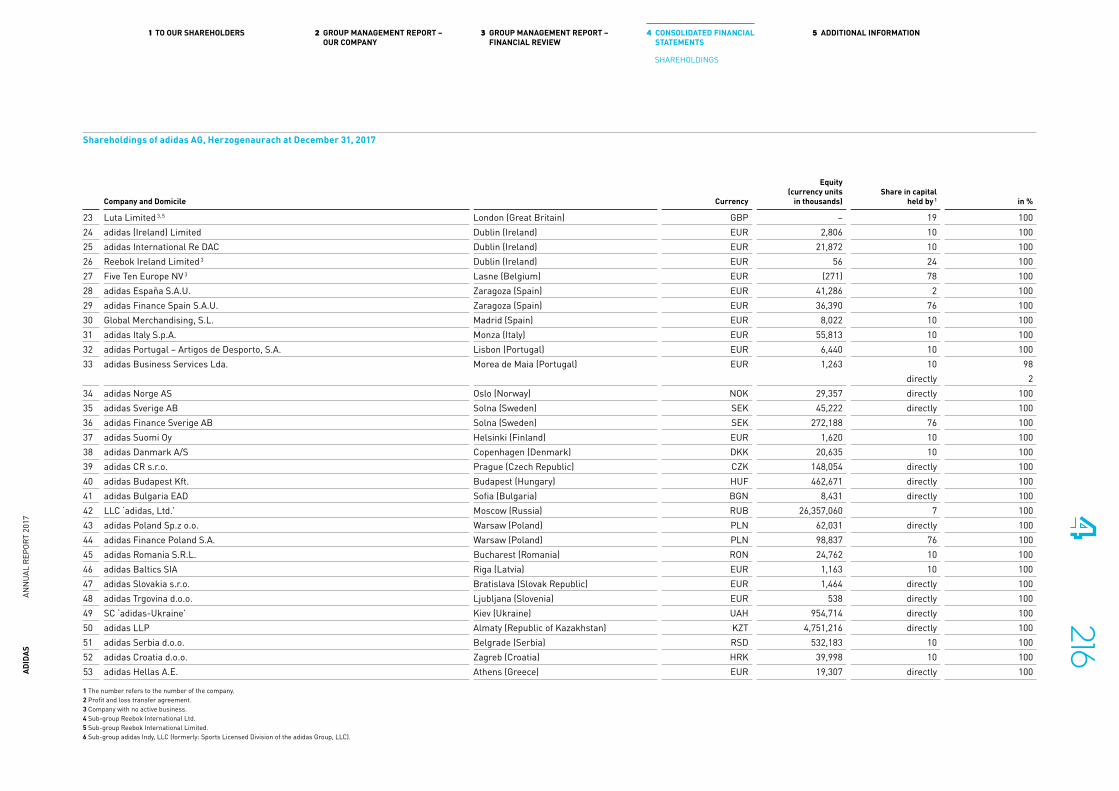
Shareholdings of adidas AG, Herzogenaurach at December 31, 2017
Company and Domicile Currency
Equity (currency units
in thousands)Share in capital
held by 1 in %
23 Luta Limited 3, 5 London (Great Britain) GBP – 19 10024 adidas (Ireland) Limited Dublin (Ireland) EUR 2,806 10 10025 adidas International Re DAC Dublin (Ireland) EUR 21,872 10 10026 Reebok Ireland Limited 3 Dublin (Ireland) EUR 56 24 10027 Five Ten Europe NV 3 Lasne (Belgium) EUR (271) 78 10028 adidas España S.A.U. Zaragoza (Spain) EUR 41,286 2 10029 adidas Finance Spain S.A.U. Zaragoza (Spain) EUR 36,390 76 10030 Global Merchandising, S.L. Madrid (Spain) EUR 8,022 10 10031 adidas Italy S.p.A. Monza (Italy) EUR 55,813 10 10032 adidas Portugal – Artigos de Desporto, S.A. Lisbon (Portugal) EUR 6,440 10 10033 adidas Business Services Lda. Morea de Maia (Portugal) EUR 1,263 10 98
directly 234 adidas Norge AS Oslo (Norway) NOK 29,357 directly 10035 adidas Sverige AB Solna (Sweden) SEK 45,222 directly 10036 adidas Finance Sverige AB Solna (Sweden) SEK 272,188 76 10037 adidas Suomi Oy Helsinki (Finland) EUR 1,620 10 10038 adidas Danmark A/S Copenhagen (Denmark) DKK 20,635 10 10039 adidas CR s.r.o. Prague (Czech Republic) CZK 148,054 directly 10040 adidas Budapest Kft. Budapest (Hungary) HUF 462,671 directly 10041 adidas Bulgaria EAD Sofia (Bulgaria) BGN 8,431 directly 10042 LLC ‘adidas, Ltd.’ Moscow (Russia) RUB 26,357,060 7 10043 adidas Poland Sp.z o.o. Warsaw (Poland) PLN 62,031 directly 10044 adidas Finance Poland S.A. Warsaw (Poland) PLN 98,837 76 10045 adidas Romania S.R.L. Bucharest (Romania) RON 24,762 10 10046 adidas Baltics SIA Riga (Latvia) EUR 1,163 10 10047 adidas Slovakia s.r.o. Bratislava (Slovak Republic) EUR 1,464 directly 10048 adidas Trgovina d.o.o. Ljubljana (Slovenia) EUR 538 directly 10049 SC ‘adidas-Ukraine’ Kiev (Ukraine) UAH 954,714 directly 10050 adidas LLP Almaty (Republic of Kazakhstan) KZT 4,751,216 directly 10051 adidas Serbia d.o.o. Belgrade (Serbia) RSD 532,183 10 10052 adidas Croatia d.o.o. Zagreb (Croatia) HRK 39,998 10 10053 adidas Hellas A.E. Athens (Greece) EUR 19,307 directly 100
1 The number refers to the number of the company.2 Profit and loss transfer agreement. 3 Company with no active business.4 Sub-group Reebok International Ltd.5 Sub-group Reebok International Limited.6 Sub-group adidas Indy, LLC (formerly: Sports Licensed Division of the adidas Group, LLC).
ADID
AS
ANN
UAL
REPO
RT 2
017
2161 TO OUR SHAREHOLDERS 2 GROUP MANAGEMENT REPORT –
OUR COMPANY3 GROUP MANAGEMENT REPORT –
FINANCIAL REVIEW4 CONSOLIDATED FINANCIAL
STATEMENTS5 ADDITIONAL INFORMATION
SHAREHOLDINGS

Shareholdings of adidas AG, Herzogenaurach at December 31, 2017
Company and Domicile Currency
Equity (currency units
in thousands)Share in capital
held by 1 in %
54 adidas (Cyprus) Limited Nicosia (Cyprus) EUR 923 directly 10055 adidas Spor Malzemeleri Satis ve Pazarlama A.S. Istanbul (Turkey) TRY 316,405 10 10056 adidas Emerging Markets L.L.C Dubai (United Arab Emirates) USD 18,958 indirectly 51
9 4957 adidas Emerging Markets FZE Dubai (United Arab Emirates) USD 119,681 10 10058 adidas Levant Limited Dubai (United Arab Emirates) JOD 2,956 57 10059 adidas Levant Limited – Jordan Amman (Jordan) JOD 1,720 58 10060 adidas Imports & Exports Ltd. Cairo (Egypt) EGP (34,455) 61 10061 adidas Sporting Goods Ltd. Cairo (Egypt) EGP 263,559 10 90
11 1062 adidas Egypt Ltd. 3 Cairo (Egypt) USD (1,831) directly 10063 Reebok Israel Ltd. Holon (Israel) ILS 15,839 directly 10064 Life Sport Ltd. Holon (Israel) ILS 128,827 10 8565 adidas Morocco LLC Casablanca (Morocco) MAD (57,870) directly 10066 adidas (South Africa) (Pty) Ltd. Cape Town (South Africa) ZAR 320,376 directly 100
North America67 adidas North America, Inc. Portland, Oregon (USA) USD 4,775,256 10 10068 adidas America, Inc. Portland, Oregon (USA) USD 221,944 67 10069 adidas International, Inc. Portland, Oregon (USA) USD 88,314 67 10070 adidas Team, Inc. 3 Des Moines, Iowa (USA) USD (1,013) 67 10071 The Reebok Worldwide Trading Company, LLC Wilmington, Delaware (USA) USD 17,918 76 10072 Reebok Securities Holdings LLC 3, 4 Wilmington, Delaware (USA) USD – 76 10073 Textronics, Inc. Wilmington, Delaware (USA) USD 12,389 69 10074 Onfield Apparel Group, LLC 3, 6 Dover, Delaware (USA) USD – 76 99
75 175 Reebok Onfield, LLC 3, 6 Dover, Delaware (USA) USD – 76 10076 Reebok International Ltd. 4 Canton, Massachusetts (USA) USD (1,263,280) 67 10077 adidas Indy, LLC6 (formerly: Sports Licensed Division of the adidas Group, LLC) Wilmington, Delaware (USA) USD 33,560 76 99
72 178 Stone Age Equipment, Inc. Redlands, California (USA) USD (512) 68 10079 Spartanburg DC, Inc. Spartanburg, South Carolina (USA) USD 12,661 68 100
1 The number refers to the number of the company.2 Profit and loss transfer agreement. 3 Company with no active business.4 Sub-group Reebok International Ltd.5 Sub-group Reebok International Limited.6 Sub-group adidas Indy, LLC (formerly: Sports Licensed Division of the adidas Group, LLC).
ADID
AS
ANN
UAL
REPO
RT 2
017
2171 TO OUR SHAREHOLDERS 2 GROUP MANAGEMENT REPORT –
OUR COMPANY3 GROUP MANAGEMENT REPORT –
FINANCIAL REVIEW4 CONSOLIDATED FINANCIAL
STATEMENTS5 ADDITIONAL INFORMATION
SHAREHOLDINGS

Shareholdings of adidas AG, Herzogenaurach at December 31, 2017
Company and Domicile Currency
Equity (currency units
in thousands)Share in capital
held by 1 in %
80 adidas Canada Ltd. Woodbridge, Ontario (Canada) CAD 122,500 10 100
Asia81 adidas Sourcing Limited Hong Kong (China) USD 548,652 11 10082 adidas Services Limited Hong Kong (China) USD 13,414 10 10083 adidas Hong Kong Limited Hong Kong (China) HKD 380,686 2 10084 Reebok Trading (Far East) Limited Hong Kong (China) USD 31,406 76 10085 adidas (Suzhou) Co. Ltd. Suzhou (China) CNY 230,058 2 10086 adidas Sports (China) Co. Ltd. Suzhou (China) CNY 9,647,843 2 10087 adidas (China) Ltd. Shanghai (China) CNY 987,565 10 10088 adidas Sports Goods (Shanghai) Co., Ltd Shanghai (China) CNY – 87 10089 Runtastic Software Technology (Shanghai) Co., Ltd. Shanghai (China) CNY – 10 10090 Zhuhai adidas Technical Services Limited Zhuhai (China) CNY 42,458 81 10091 adidas Logistics (Tianjin) Co., Ltd. Tianjin (China) CNY 151,388 15 10092 adidas Business Services (Dalian) Limited Dalian (China) CNY 9,439 10 10093 adidas Japan K.K. Tokyo (Japan) JPY 15,943,471 10 10094 adidas Korea LLC. Seoul (Korea) KRW 203,106,999 directly 10095 adidas Korea Technical Services Limited Pusan (Korea) KRW 3,894,309 81 10096 adidas India Private Limited New Delhi (India) INR 4,636,148 directly 10.67
10 89.3397 adidas India Marketing Private Limited New Delhi (India) INR 6,042,126 96 98.62
10 1.00directly 0.37
98 adidas Technical Services Private Limited New Delhi (India) USD 3,407 81 10099 Reebok India Company New Delhi (India) INR (21,851,375) 109 93.15100 PT adidas Indonesia Jakarta (Indonesia) IDR 383,423,936 10 99
directly 1101 adidas (Malaysia) Sdn. Bhd. Petaling Jaya (Malaysia) MYR 58,014 directly 60
10 40102 adidas Philippines Inc. Pasig City (Philippines) PHP 822,484 directly 100103 adidas Singapore Pte. Ltd. Singapore (Singapore) SGD 9,062 directly 100104 adidas Taiwan Limited Taipei (Taiwan) TWD 1,774,204 10 100
1 The number refers to the number of the company.2 Profit and loss transfer agreement. 3 Company with no active business.4 Sub-group Reebok International Ltd.5 Sub-group Reebok International Limited.6 Sub-group adidas Indy, LLC (formerly: Sports Licensed Division of the adidas Group, LLC).
ADID
AS
ANN
UAL
REPO
RT 2
017
2181 TO OUR SHAREHOLDERS 2 GROUP MANAGEMENT REPORT –
OUR COMPANY3 GROUP MANAGEMENT REPORT –
FINANCIAL REVIEW4 CONSOLIDATED FINANCIAL
STATEMENTS5 ADDITIONAL INFORMATION
SHAREHOLDINGS

Shareholdings of adidas AG, Herzogenaurach at December 31, 2017
Company and Domicile Currency
Equity (currency units
in thousands)Share in capital
held by 1 in %
105 adidas (Thailand) Co., Ltd. Bangkok (Thailand) THB 1,419,989 directly 100106 adidas Australia Pty Limited Mulgrave (Australia) AUD 88,584 10 100107 adidas New Zealand Limited Auckland (New Zealand) NZD 6,115 directly 100108 adidas Vietnam Company Limited Ho Chi Minh City (Vietnam) VND 224,561,408 10 100109 Reebok (Mauritius) Company Limited Port Louis (Mauritius) USD (154) 76 99
71 1
Latin America110 adidas Argentina S.A. Buenos Aires (Argentina) ARS 1,280,248 10 76.96
2 23.04111 Reebok Argentina S.A. 3 Buenos Aires (Argentina) ARS 89,365 11 96.25
10 3.75112 adidas do Brasil Ltda. São Paulo (Brazil) BRL 571,730 2 100113 adidas Franchise Brasil Servicos Ltda. São Paulo (Brazil) BRL 36,088 112 100114 Reebok Produtos Esportivos Brasil Ltda. 3 Jundiaí (Brazil) BRL 10,469 10 100115 adidas Chile Limitada Santiago de Chile (Chile) CLP 116,551,782 directly 99
1 1116 adidas Colombia Ltda. Bogotá (Colombia) COP (45,422,402) directly 100117 adidas Perú S.A.C. Lima (Peru) PEN 95,948 directly 99.21
115 0.79118 adidas de Mexico, S.A. de C.V. Mexico City (Mexico) MXN 1,346,420 directly 100119 adidas Industrial, S.A. de C.V. Mexico City (Mexico) MXN 362,084 directly 100120 Reebok de Mexico, S.A. de C.V. 3 Mexico City (Mexico) MXN (1,260,310) directly 100121 adidas Latin America, S.A. Panama City (Panama) USD (72,607) directly 100122 Concept Sport, S.A. Panama City (Panama) USD 1,988 10 100123 adidas Market LAM, S.A. 3 Panama City (Panama) USD (2,782) 10 100124 3 Stripes S.A. (adidas Uruguay) 3 Montevideo (Uruguay) UYU (436) directly 100125 Tafibal S.A. Montevideo (Uruguay) UYU 37,568 directly 100126 Raelit S.A. Montevideo (Uruguay) UYU 48,959 directly 100127 Reebok Central America S.A. 4 San Pedro Sula (Honduras) HNL – 76 99.60
71 0.40128 adidas Corporation de Venezuela, S.A. 3 Caracas (Venezuela) VEF (17) directly 100129 adisport Corporation San Juan (Puerto Rico) USD (2,605) 10 100
1 The number refers to the number of the company.2 Profit and loss transfer agreement. 3 Company with no active business.4 Sub-group Reebok International Ltd.5 Sub-group Reebok International Limited.6 Sub-group adidas Indy, LLC (formerly: Sports Licensed Division of the adidas Group, LLC).
ADID
AS
ANN
UAL
REPO
RT 2
017
2191 TO OUR SHAREHOLDERS 2 GROUP MANAGEMENT REPORT –
OUR COMPANY3 GROUP MANAGEMENT REPORT –
FINANCIAL REVIEW4 CONSOLIDATED FINANCIAL
STATEMENTS5 ADDITIONAL INFORMATION
SHAREHOLDINGS

RESPONSIBILITY STATEMENT
To the best of our knowledge, and in accordance with the applicable reporting principles, the consolidated financial statements give a true and fair view of the assets, liabilities, financial position and profit or loss of the Group, and the Group Management Report, which has been combined with the Management Report of adidas AG, includes a fair review of the development and performance of the business and the position of the Group, together with a description of the material opportunities and risks associated with the expected development of the Group.
Herzogenaurach, February 23, 2018
KASPER RORSTED CEO
ROLAND AUSCHEL GLOBAL SALES
ERIC LIEDTKE GLOBAL BRANDS
HARM OHLMEYER CFO
KAREN PARKIN GLOBAL HUMAN RESOURCES
GIL STEYAERT GLOBAL OPERATIONS
ADID
AS
ANN
UAL
REPO
RT 2
017
2201 TO OUR SHAREHOLDERS 2 GROUP MANAGEMENT REPORT –
OUR COMPANY3 GROUP MANAGEMENT REPORT –
FINANCIAL REVIEW4 CONSOLIDATED FINANCIAL
STATEMENTS5 ADDITIONAL INFORMATION
RESPONSIBILITY STATEMENT

Note: This is a translation of the German original. Solely the original text in German language is authoritative.
INDEPENDENT AUDITOR’S REPORT
REPORT ON THE AUDIT OF THE CONSOLIDATED FINANCIAL STATEMENTS AND OF THE GROUP MANAGEMENT REPORT
OPINIONSWe have audited the consolidated financial statements of adidas AG, Herzogenaurach and its subsidiaries (the Group), which comprise the consolidated statement of financial position as at December 31, 2017, and the consolidated income statement, the consolidated statement of profit and loss and other comprehensive income, consolidated statement of changes in equity and consolidated statement of cash flows for the financial year from January 1, 2017 to December 31, 2017, and notes to the consolidated financial statements, including a summary of significant accounting policies. In addition, we have audited the report on the position of the Company and the Group (“group management report”) of adidas AG, Herzogenaurach for the financial year from January 1, 2017 to December 31, 2017. In accordance with the German legal requirements we have not audited the content of the non-financial statement, as such included in the group management report, and the corporate governance state-ment as well as the corporate governance report which are included in section ”Corporate Governance Report including the Declaration on Corporate Governance” of the group management report.
In our opinion, on the basis of the knowledge obtained in the audit,
— the accompanying consolidated financial statements comply, in all material respects, with the IFRSs as adopted by the EU, and the additional requirements of German commercial law pursuant to Section 315e (1) HGB [Handelsgesetzbuch: German Commercial Code] and, in compliance with these requirements, give a true and fair view of the assets, liabilities, and financial position of the Group as at December 31, 2017, and of its financial performance for the financial year from January 1, 2017 to December 31, 2017, and
— the accompanying group management report as a whole provides an appropriate view of the Group’s position. In all material respects, this group management report is consistent with the consolidated financial statements, complies with German legal requirements and appropri-ately presents the opportunities and risks of future devel-opment. Our opinion on the group management report does not cover the content of the non-financial statement, the corporate governance statement and the corporate governance report mentioned above.
Pursuant to Section 322 (3) sentence 1 HGB, we declare that our audit has not led to any reservations relating to the legal compliance of the consolidated financial statements and of the group management report.
BASIS FOR THE OPINIONSWe conducted our audit of the consolidated financial statements and of the group management report in accordance with Section 317 HGB and the EU Audit Regulation No. 537/2014 (referred to subsequently as “EU Audit Regulation”) and in compliance with German Generally Accepted Standards for Financial Statement Audits promulgated by the Institut der Wirtschaftsprüfer [Institute of
Public Auditors in Germany] (IDW). Our responsibilities under those requirements and principles are further described in the “Auditor’s Responsibilities for the Audit of the Consolidated Financial Statements and of the Group Management Report” section of our auditor’s report. We are independent of the group entities in accordance with the requirements of European law and German commercial and professional law, and we have fulfilled our other German professional responsibilities in accordance with these requirements. In addition, in accordance with Article 10 (2) point (f) of the EU Audit Regulation, we declare that we have not provided non-audit services prohibited under Article 5 (1) of the EU Audit Regulation. We believe that the evidence we have obtained is sufficient and appropriate to provide a basis for our opinions on the consolidated financial statements and on the group management report.
KEY AUDIT MATTERS IN THE AUDIT OF THE CONSOLIDATED FINANCIAL STATEMENTS Key audit matters are those matters that, in our professional judgment, were of most significance in our audit of the consolidated financial statements for the financial year from January 1, 2017 to December 31, 2017. These matters were addressed in the context of our audit of the consolidated financial statements as a whole, and in forming our opinion thereon, we do not provide a separate opinion on these matters.
VALUATION AND PRESENTATION OF THE DISPOSAL GROUPS TAYLORMADE UND CCM
HOCKEY IN ACCORDANCE WITH IFRS 5
For information on the accounting and valuation methods used, as well as management’s judgements and sources of estimation uncertainty, please refer to Note 02 in the consolidated financial statements. For the disclosures on Discontinued Operations and Disposal of subsidiaries as well as assets and liabilities, please refer to Notes 3 and 4, respectively, in the consolidated Financial Statements.
ADID
AS
ANN
UAL
REPO
RT 2
017
2211 TO OUR SHAREHOLDERS 2 GROUP MANAGEMENT REPORT –
OUR COMPANY3 GROUP MANAGEMENT REPORT –
FINANCIAL REVIEW4 CONSOLIDATED FINANCIAL
STATEMENTS5 ADDITIONAL INFORMATION
INDEPENDENT AUDITOR’S REPORT

THE RISK TO THE CONSOLIDATED FINANCIAL STATEMENTSAfter the Supervisory Board passed resolutions for the disposals of TaylorMade and CCM Hockey in May 2017 and June 2017, respectively, adidas entered into contracts dated May 10, 2017 and July 26, 2017, respectively, to dispose of the two business segments. The disposals of the two discontinued operations were completed so that they were both deconsolidated during the financial year. For the fiscal year 2017, adidas reported a loss from discontinued operations, after tax, of EUR 254 million. The sales contracts include, among other things, variable purchase price components, payment for which will become due in the future and whose amount depends on the achievement of certain future performance goals for the buyer. Promissory notes and earn-out components were therefore recognized as other non-current financial assets in the amount of EUR 137 million.
The classification and reporting of the two business segments TaylorMade and CCM Hockey as discontinued operations in accordance with IFRS 5 is complex and requires judgement. The assumptions underlying the valuation of the financial assets related to the variable purchase price components contained in the sales contracts are subject to judgement. In addition, the disclosures in the notes to the consolidated financial statements related to discontinued operations are complex.
There exists a risk to the consolidated financial statements that the discontinued operations were inappropriately identified as such and that the disclosure as discontinued operations in the consolidated income statement is therefore incorrect. In addition, there is a risk that the valuation of the financial assets for the variable purchase price components contained in the sales contracts is not appropriate. There also exists a risk that the disclosures for discontinued operations in the notes to the consolidated financial statements are not sufficient.
OUR AUDIT APPROACHWe first assessed whether the classification of the two disposal groups TaylorMade and CCM Hockey as discontinued operations in accordance with IFRS 5 was appropriate. We inquired of corporate accounting and reviewed the minutes of the Supervisory Board’s meetings. In addition, amongst others we reviewed internal and external communications to assess whether the criteria for classification as discontinued operations were met.
With the assistance of KPMG valuation specialists, we also assessed the valuation of the variable purchase price components included in the contracts, which are accounted for as other non-current financial assets.
In addition, we assessed whether the discontinued operations disclosures are sufficiently detailed and appropriate.
OUR CONCLUSIONSThe disclosure of the disposal groups TaylorMade and CCM Hockey as discontinued operations is in accordance with IFRS 5. The valuation of the financial assets related to the variable purchase price components contained in the sales contracts is appropriate. The discontinued operations disclosures in the notes are sufficiently detailed and appropriate.
THE VALUATION AND ACCURACY OF STOCK-BASED COMPENSATION PROGRAMS
For information on the accounting and valuation methods used, as well as management’s judgements and sources of estimation uncertainty, please refer to Note 02 in the consolidated financial statements. For information on the share-based payment programs, please refer to Note 27 in the consolidated financial statements.
THE RISK TO THE CONSOLIDATED FINANCIAL STATEMENTSIn 2017, adidas AG launched a new share-based compensation program for executives and introduced an employee participation program as of October 1, 2016. In addition, a share-based compensation program was agreed to for an artist and a designer (non-employees), with a contract date of 19 May 2016 for the years 2017 to 2021. The respective programs contain various vesting conditions, which are linked to grants of equity instruments or a cash settlement. As of December 31, 2017, adidas has accrued stock-based compensation expense in equity, as well as short- and long-term sales and personnel provisions.
The interpretation of the contractual agreements and thus the classification of share-based payment programs in accordance with IFRS 2 are complex. Furthermore, assessing the likelihood of achieving the vesting conditions as of the balance sheet date and during the vesting period involves judgement.
There is a risk to the consolidated financial statements that the criteria for classification as share-based payment programs under IFRS 2 are not met, or that the classification as equity-settled or cash-settled share-based payment in accordance with IFRS 2 was incorrect. There is also the risk that the fair values of the equity instruments granted or the respective liability were not measured in accordance with IFRS 2.
OUR AUDIT APPROACHWe first assessed whether the criteria for classification as share-based payment programs under IFRS 2 were met. We analyzed the contractual obligations of the respective programs in detail and evaluated whether the share-based payments are equity or cash-settled in accordance with IFRS 2.
ADID
AS
ANN
UAL
REPO
RT 2
017
2221 TO OUR SHAREHOLDERS 2 GROUP MANAGEMENT REPORT –
OUR COMPANY3 GROUP MANAGEMENT REPORT –
FINANCIAL REVIEW4 CONSOLIDATED FINANCIAL
STATEMENTS5 ADDITIONAL INFORMATION
INDEPENDENT AUDITOR’S REPORT

Among other things, we assessed the valuation model and the reasonableness of the assumptions used for vesting conditions (employee turnover) and performance conditions (stock price at the end of the vesting period). In doing so, we compared assumptions used for vesting conditions with historical employee turnover, and compared projections for future share prices with actuarial valuation models.
By examining the respective contracts and the related accounting treatment, we ensured that the underlying assumptions regarding the likelihood of achieving vesting conditions were reasonable as of the reporting date, and that the accounting for the share-based programs was appropriate.
OUR CONCLUSIONSThe share-based compensation programs have been appro-priately classified in accordance with IFRS 2. The valuation methods used are appropriate, and the assumptions underly-ing the valuation regarding the achievement of vesting condi-tions as of the reporting date have been reasonably estimated.
THE VALUATION OF RISKS FROM TAX AUDITS
For information on the accounting and valuation methods used, as well as management’s judgements and sources of estimation uncertainty, please refer to Note 02 in the consolidated financial statements. For disclosures on income taxes, please see Note 35 in the consolidated financial statements.
THE RISK TO THE CONSOLIDATED FINANCIAL STATEMENTSadidas conducts business in various tax jurisdictions. As of December 31, 2017, income tax liabilities include provisions for risks from tax audits in the amount of EUR 424 million. The application of local tax legislation and tax relief is complex and involves various risks.
The assessment of provisions for tax obligations requires that adidas exercise judgement in the assessment of tax matters and make estimates regarding tax risks.
There exists a risk to the consolidated financial statements that the provisions for tax obligations arising from tax audits are either over- or undervalued.
OUR AUDIT APPROACHadidas regularly appoints external experts to substantiate its own risk assessment with tax expert opinions. Among other things, we involved KPMG local and international tax specialists in the audit team to review both adidas’s risk assessment and tax expert opinions. KPMG specialists reviewed the correspondence with the relevant tax authorities, and they also analyzed and examined the assumptions used in determining tax provisions based on their knowledge and experience of the current application of the relevant legislation by public authorities and courts. With our international network, we have also included tax specialists with the relevant knowledge of the respective local legal systems and regulations, who reported the results of their assessment to us.
OUR CONCLUSIONSThe judgement used by adidas in determining the amounts to be recognized as provisions for tax obligations arising from tax audits is appropriate.
OTHER INFORMATIONManagement is responsible for the other information. The other information comprises:
— the non-financial statement, — the corporate governance statement, — the Corporate Governance Report in accordance with
Nr. 3.10 of German Corporate Governance Code, and
— the remaining parts of the annual report, with the exception of the audited consolidated financial statements and group management report and our auditor’s report.
Our opinions on the consolidated financial statements and on the group management report do not cover the other information, and consequently we do not express an opinion or any other form of assurance conclusion thereon.
In connection with our audit, our responsibility is to read the other information and, in so doing, to consider whether the other information
— is materially inconsistent with the consolidated financial statements, with the group management report or our knowledge obtained in the audit, or
— otherwise appears to be materially misstated. We were engaged to perform a separate independent limited assurance engagement on the non-financial statement. With regards to content, scope and results of this independent limited assurance engagement we refer to our report hereon from February, 23, 2018.
RESPONSIBILITIES OF MANAGEMENT AND THE SUPERVISORY BOARD FOR THE CONSOLIDATED FINANCIAL STATEMENTS AND THE GROUP MANAGEMENT REPORTManagement is responsible for the preparation of the consolidated financial statements that comply, in all material respects, with IFRSs as adopted by the EU and the additional requirements of German commercial law pursuant to Section 315e (1) HGB and that the consolidated financial statements, in compliance with these requirements, give a true and fair view of the assets, liabilities, financial position, and financial performance of the Group. In addition, management is responsible for such internal controls as they have determined
ADID
AS
ANN
UAL
REPO
RT 2
017
2231 TO OUR SHAREHOLDERS 2 GROUP MANAGEMENT REPORT –
OUR COMPANY3 GROUP MANAGEMENT REPORT –
FINANCIAL REVIEW4 CONSOLIDATED FINANCIAL
STATEMENTS5 ADDITIONAL INFORMATION
INDEPENDENT AUDITOR’S REPORT

necessary to enable the preparation of consolidated financial statements that are free from material misstatement, whether due to fraud or error.
In preparing the consolidated financial statements, management is responsible for assessing the Group’s ability to continue as a going concern. They also have the responsibility for disclosing, as applicable, matters related to going concern. In addition, they are responsible for financial reporting based on the going concern basis of accounting unless there is an intention to liquidate the Group or to cease operations, or there is no realistic alternative but to do so.
Furthermore, management is responsible for the preparation of the group management report that, as a whole, provides an appropriate view of the Group’s position and is, in all material respects, consistent with the consolidated financial statements, complies with German legal requirements, and appropriately presents the opportunities and risks of future development. In addition, management is responsible for such arrangements and measures (systems) as they have considered necessary to enable the preparation of a group management report that is in accordance with the applicable German legal requirements, and to be able to provide sufficient appropriate evidence for the assertions in the group management report.
The supervisory board is responsible for overseeing the Group’s financial reporting process for the preparation of the consolidated financial statements and of the group manage-ment report.
AUDITOR’S RESPONSIBILITIES FOR THE AUDIT OF THE CONSOLIDATED FINANCIAL STATEMENTS AND OF THE GROUP MANAGEMENT REPORT Our objectives are to obtain reasonable assurance about whether the consolidated financial statements as a whole are free from material misstatement, whether due to fraud or error, and whether the group management report as a whole provides an appropriate view of the Group’s position and, in all material respects, is consistent with the consolidated financial statements and the knowledge obtained in the audit, complies with the German legal requirements and appropriately presents the opportunities and risks of future development, as well as to issue an auditor’s report that includes our opinions on the consolidated financial statements and on the group management report.
Reasonable assurance is a high level of assurance, but is not a guarantee that an audit conducted in accordance with Section 317 HGB and the EU Audit Regulation and in compliance with German Generally Accepted Standards for Financial Statement Audits promulgated by the Institut der Wirtschaftsprüfer (IDW) will always detect a material misstatement. Misstatements can arise from fraud or error and are considered material if, individually or in the aggregate, they could reasonably be expected to influence the economic decisions of users taken on the basis of these consolidated financial statements and this group management report.
We exercise professional judgment and maintain professional skepticism throughout the audit. We also:
— Identify and assess the risks of material misstatement of the consolidated financial statements and of the group management report, whether due to fraud or error, design and perform audit procedures responsive to those risks, and obtain audit evidence that is sufficient and appropriate to provide a basis for our opinions. The risk of not detecting a material misstatement resulting from fraud is higher than
for one resulting from error, as fraud may involve collusion, forgery, intentional omissions, misrepresentations, or the override of internal controls.
— Obtain an understanding of internal controls relevant to the audit of the consolidated financial statements and of arrangements and measures (systems) relevant to the audit of the group management report in order to design audit procedures that are appropriate in the circumstances, but not for the purpose of expressing an opinion on the effectiveness of these systems.
— Evaluate the appropriateness of accounting policies used by management and the reasonableness of estimates made by management and related disclosures.
— Conclude on the appropriateness of management’s use of the going concern basis of accounting and, based on the audit evidence obtained, whether a material uncertainty exists related to events or conditions that may cast significant doubt on the Group’s ability to continue as a going concern. If we conclude that a material uncertainty exists, we are required to draw attention in the auditor’s report to the related disclosures in the consolidated financial statements and in the group management report or, if such disclosures are inadequate, to modify our respective opinions. Our conclusions are based on the audit evidence obtained up to the date of our auditor’s report. However, future events or conditions may cause the Group to cease to be able to continue as a going concern.
— Evaluate the overall presentation, structure and content of the consolidated financial statements, including the disclosures, and whether the consolidated financial statements present the underlying transactions and events in a manner that the consolidated financial statements give a true and fair view of the assets, liabilities, financial position and financial performance of the Group in compliance with IFRSs as adopted by the EU and the additional requirements of German commercial law pursuant to Section 315e (1) HGB.
ADID
AS
ANN
UAL
REPO
RT 2
017
2241 TO OUR SHAREHOLDERS 2 GROUP MANAGEMENT REPORT –
OUR COMPANY3 GROUP MANAGEMENT REPORT –
FINANCIAL REVIEW4 CONSOLIDATED FINANCIAL
STATEMENTS5 ADDITIONAL INFORMATION
INDEPENDENT AUDITOR’S REPORT

— Obtain sufficient appropriate audit evidence regarding the financial information of the entities or business activities within the Group to express opinions on the consolidated financial statements and on the group management report. We are responsible for the direction, supervision and performance of the group audit. We remain solely responsible for our opinions.
— Evaluate the consistency of the group management report with the consolidated financial statements, its conformity with [German] law, and the view of the Group’s position it provides.
— Perform audit procedures on the prospective information presented by management in the group management report. On the basis of sufficient appropriate audit evidence we evaluate, in particular, the significant assumptions used by management as a basis for the prospective information, and evaluate the proper derivation of the prospective information from these assumptions. We do not express a separate opinion on the prospective information and on the assumptions used as a basis. There is a substantial unavoidable risk that future events will differ materially from the prospective information.
We communicate with those charged with governance regarding, among other matters, the planned scope and timing of the audit and significant audit findings, including any significant deficiencies in internal controls that we identify during our audit.
We also provide those charged with governance with a statement that we have complied with the relevant independence requirements, and communicate with them all relationships and other matters that may reasonably be thought to bear on our independence, and where applicable, the related safeguards.
From the matters communicated with those charged with governance, we determine those matters that were of most significance in the audit of the consolidated financial statements of the current period and are therefore the key audit matters. We describe these matters in our auditor’s report unless law or regulation precludes public disclosure about the matter.
OTHER LEGAL AND REGULATORY REQUIREMENTS
FURTHER INFORMATION PURSUANT TO ARTICLE 10 OF THE EU AUDIT REGULATIONWe were elected as auditor by the annual general meeting on May 11, 2017. We were engaged by the supervisory board on October 13, 2017. We have been the auditor of the adidas AG as a listed entity since 1995 without interruption.
We declare that the opinions expressed in this auditor’s report are consistent with the additional report to the audit committee pursuant to Article 11 of the EU Audit Regulation (long-form audit report).
GERMAN PUBLIC AUDITOR RESPONSIBLE FOR THE ENGAGEMENT
The German Public Auditor responsible for the engagement is Haiko Schmidt.
Munich, February 23, 2018
KPMG AGWirtschaftsprüfungsgesellschaft [Original German version signed by:]
Karl Braun Haiko SchmidtWirtschaftsprüfer Wirtschaftsprüfer[German Public Auditor] [German Public Auditor]
ADID
AS
ANN
UAL
REPO
RT 2
017
2251 TO OUR SHAREHOLDERS 2 GROUP MANAGEMENT REPORT –
OUR COMPANY3 GROUP MANAGEMENT REPORT –
FINANCIAL REVIEW4 CONSOLIDATED FINANCIAL
STATEMENTS5 ADDITIONAL INFORMATION
INDEPENDENT AUDITOR’S REPORT

LIMITED ASSURANCE REPORT OF THE INDEPENDENT AUDITOR REGARDING THE COMBINED NON-FINANCIAL STATEMENT
To the Supervisory Board of adidas AG, Herzogenaurach
We have performed an independent limited assurance engagement on the Combined Non-Financial Statement of adidas AG, Herzogenaurach, (further the “Company” or “ adidas”) and the adidas Group according to §§ 315b, 315c German Commercial Code (HGB) in conjunction with §§ 289b to 289e HGB (further the “Report“) for the year from January 1 to December 31, 2017.
MANAGEMENT’S RESPONSIBILITYThe management board of adidas is responsible for the preparation of the Report in accordance with §§ 315b, 315c HGB in conjunction with §§ 289b to 289e HGB.
This responsibility of the management board includes the selection and application of appropriate methods to prepare the Report and the use of assumptions and estimates for individual disclosures which are reasonable under the given circumstances. Furthermore, the responsibility includes designing, implementing and maintaining systems and processes relevant for the preparation of the Report in a way that is free of – intended or unintended – material misstatements.
INDEPENDENCE AND QUALITY ASSURANCE ON THE PART OF THE AUDITING FIRM We are independent from the Company in accordance with the requirements of independence and quality assurance set out in legal provisions and professional pronouncements and have fulfilled our additional professional obligations in accordance with these requirements.
Our audit firm applies the legal provisions and professional pronouncements for quality assurance, in particular the professional code for German Public Auditors and Chartered Accountants (in Germany) and the quality assurance standard of the German Institute of Public Auditors (Institut der Wirtschafts-prüfer, IDW) regarding quality assurance requirements in audit practice (IDW QS 1).
PRACTITIONER’S RESPONSIBILITYOur responsibility is to express a conclusion based on our work performed of the Report within a limited assurance engagement.
We conducted our work in accordance with the International Standard on Assurance Engagements (ISAE) 3000 (Revised): “Assurance Engagements other than Audits or Reviews of Historical Financial Information” published by IAASB. This Standard requires that we plan and perform the assurance engagement to obtain limited assurance whether any matters have come to our attention that cause us to believe that the Report for the period from January 1 to December 31, 2017, has not been prepared, in all material respects in accordance with §§ 315b, 315c HGB in conjunction with §§ 289b to 289e HGB. We do not, however, issue a separate conclusion for each disclosure. In a limited assurance engagement the evidence gathering procedures are more limited than in a reasonable assurance engagement and therefore less assurance is obtained than in a reasonable assurance engagement. The choice of audit procedures is subject to the auditor’s own judgement.
Within the scope of our engagement, we performed amongst others the following procedures:
— Inquiries of personnel on group level who are responsible for the materiality analysis to get an understanding of the process for identifying material topics and respective report boundaries for adidas
— A risk assessment, including a media research, of relevant information about the sustainability performance of adidas in the reporting period
— Evaluation of the design and implementation of systems and processes for the collection, processing and monitoring of disclosures on environmental, employee and social matters, human rights, corruption and bribery, including data consolidation
— Inquiries of personnel on group level who are responsible for determining disclosures on concepts, due diligence processes, results and risks, the conduction of internal controls and consolidation of the disclosures
— Evaluation of selected internal and external documents — Analytical evaluation of data and trends of quantitative
disclosures which are reported by all sites on group level — Assessment of local data collection and reporting processes
and reliability of reported data via a sampling survey in Herzogenaurach (Germany) and a video conference with Sports Licensed Division Indianapolis (USA)
— Assessment of the overall presentation of the disclosures
As described in the section “Our Performance (Supply Chain)” in the Report, 1,015 social compliance and environmental audits at suppliers were performed by in-house technical staff as well as external third-party monitors commissioned by adidas business entities and licensees. The reasonableness and accuracy of the conclusions from the performed audit work were not part of our limited assurance engagement.
ADID
AS
ANN
UAL
REPO
RT 2
017
2261 TO OUR SHAREHOLDERS 2 GROUP MANAGEMENT REPORT –
OUR COMPANY3 GROUP MANAGEMENT REPORT –
FINANCIAL REVIEW4 CONSOLIDATED FINANCIAL
STATEMENTS5 ADDITIONAL INFORMATION
INDEPENDENT AUDITOR’S ASSURANCE REPORT

CONCLUSIONBased on the procedures performed and the evidence received to obtain assurance, nothing has come to our attention that causes us to believe that the Report of adidas for the business year from January 1 to December 31, 2017 is not prepared, in all material respects, in accordance with §§ 315b, 315c HGB in conjunction with §§ 289b to 289e HGB.
RESTRICTION OF USE/CLAUSE ON GENERAL ENGAGEMENT TERMSThis report is issued for purposes of the Supervisory Board of adidas AG, Herzogenaurach, only. We assume no responsibility with regard to any third parties.
Our assignment for the Supervisory Board of adidas AG, Herzogenaurach, and professional liability is governed by the General Engagement Terms for Wirtschaftsprüfer and Wirtschaftsprüfungsgesellschaften (Allgemeine Auftrags-bedingungen für Wirtschaftsprüfer und Wirtschaftsprüfungs-gesellschaften) in the version dated January 1, 2017 (HTTPS://
WWW.KPMG.DE/BESCHEINIGUNGEN/LIB/AAB_ENGLISH.PDF). By reading and using the information contained in this report, each recipient confirms notice of provisions of the General Engagement Terms (including the limitation of our liability for negligence to EUR 4 million as stipulated in No. 9) and accepts the validity of the General Engagement Terms with respect to us.
Munich, February 23, 2018
KPMG AGWirtschaftsprüfungsgesellschaft [Original German version signed by:]
Laue ppa. AuerWirtschaftsprüfer[German Public Auditor]
ADID
AS
ANN
UAL
REPO
RT 2
017
2271 TO OUR SHAREHOLDERS 2 GROUP MANAGEMENT REPORT –
OUR COMPANY3 GROUP MANAGEMENT REPORT –
FINANCIAL REVIEW4 CONSOLIDATED FINANCIAL
STATEMENTS5 ADDITIONAL INFORMATION
INDEPENDENT AUDITOR’S ASSURANCE REPORT

ADID
AS
ANN
UAL
REPO
RT 2
017
A D D I T I O N A L I N F O R M A T I O N
Ten-Year Overview 229
Glossary 232
Declaration of Support 236
Financial Calendar 237
228
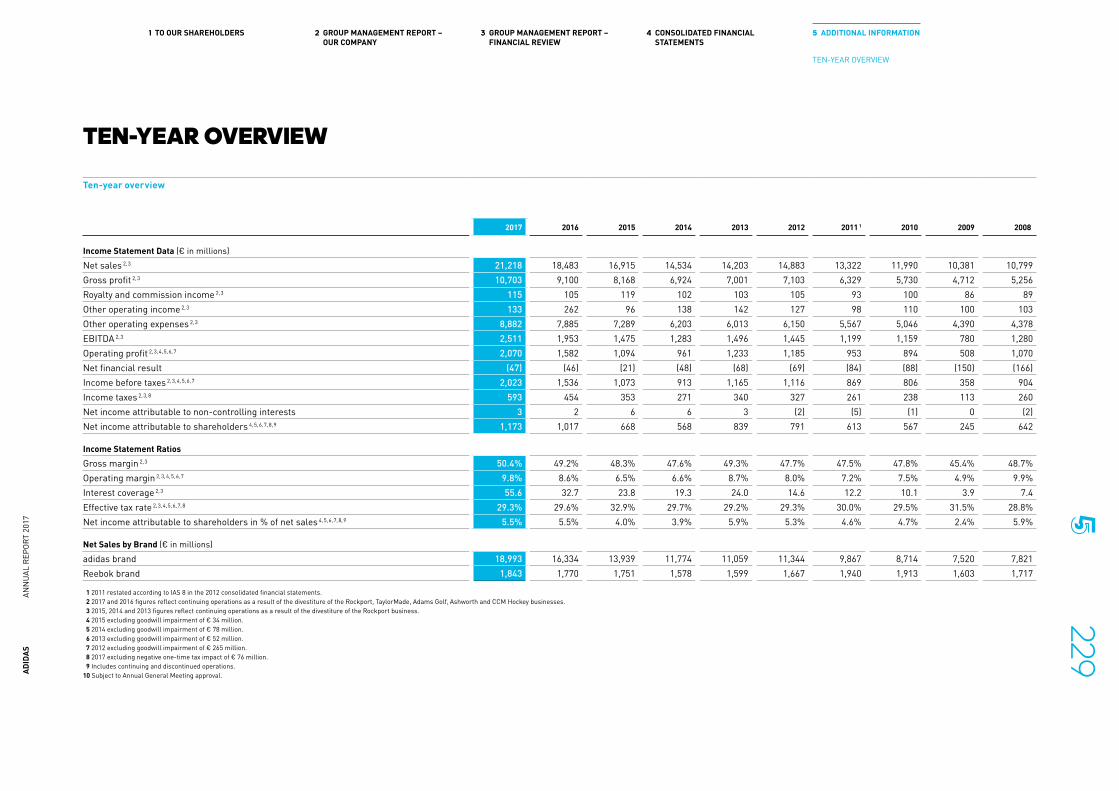
TEN-YEAR OVERVIEW
Ten-year overview
2017 2016 2015 2014 2013 2012 2011 1 2010 2009 2008
Income Statement Data (€ in millions)Net sales 2, 3 21,218 18,483 16,915 14,534 14,203 14,883 13,322 11,990 10,381 10,799Gross profit 2, 3 10,703 9,100 8,168 6,924 7,001 7,103 6,329 5,730 4,712 5,256Royalty and commission income 2, 3 115 105 119 102 103 105 93 100 86 89Other operating income 2, 3 133 262 96 138 142 127 98 110 100 103Other operating expenses 2, 3 8,882 7,885 7,289 6,203 6,013 6,150 5,567 5,046 4,390 4,378EBITDA 2, 3 2,511 1,953 1,475 1,283 1,496 1,445 1,199 1,159 780 1,280Operating profit 2, 3, 4, 5, 6, 7 2,070 1,582 1,094 961 1,233 1,185 953 894 508 1,070Net financial result (47) (46) (21) (48) (68) (69) (84) (88) (150) (166)Income before taxes 2, 3, 4, 5, 6, 7 2,023 1,536 1,073 913 1,165 1,116 869 806 358 904Income taxes 2, 3, 8 593 454 353 271 340 327 261 238 113 260Net income attributable to non-controlling interests 3 2 6 6 3 (2) (5) (1) 0 (2)Net income attributable to shareholders 4, 5, 6, 7, 8, 9 1,173 1,017 668 568 839 791 613 567 245 642
Income Statement RatiosGross margin 2, 3 50.4% 49.2% 48.3% 47.6% 49.3% 47.7% 47.5% 47.8% 45.4% 48.7%Operating margin 2, 3, 4, 5, 6, 7 9.8% 8.6% 6.5% 6.6% 8.7% 8.0% 7.2% 7.5% 4.9% 9.9%Interest coverage 2, 3 55.6 32.7 23.8 19.3 24.0 14.6 12.2 10.1 3.9 7.4Effective tax rate 2, 3, 4, 5, 6, 7, 8 29.3% 29.6% 32.9% 29.7% 29.2% 29.3% 30.0% 29.5% 31.5% 28.8%Net income attributable to shareholders in % of net sales 4, 5, 6, 7, 8, 9 5.5% 5.5% 4.0% 3.9% 5.9% 5.3% 4.6% 4.7% 2.4% 5.9%
Net Sales by Brand (€ in millions)adidas brand 18,993 16,334 13,939 11,774 11,059 11,344 9,867 8,714 7,520 7,821Reebok brand 1,843 1,770 1,751 1,578 1,599 1,667 1,940 1,913 1,603 1,717
1 2011 restated according to IAS 8 in the 2012 consolidated financial statements. 2 2017 and 2016 figures reflect continuing operations as a result of the divestiture of the Rockport, TaylorMade, Adams Golf, Ashworth and CCM Hockey businesses. 3 2015, 2014 and 2013 figures reflect continuing operations as a result of the divestiture of the Rockport business. 4 2015 excluding goodwill impairment of € 34 million. 5 2014 excluding goodwill impairment of € 78 million. 6 2013 excluding goodwill impairment of € 52 million. 7 2012 excluding goodwill impairment of € 265 million. 8 2017 excluding negative one-time tax impact of € 76 million. 9 Includes continuing and discontinued operations.10 Subject to Annual General Meeting approval.AD
IDAS
AN
NUA
L RE
PORT
201
7
2291 TO OUR SHAREHOLDERS 2 GROUP MANAGEMENT REPORT –
OUR COMPANY3 GROUP MANAGEMENT REPORT –
FINANCIAL REVIEW4 CONSOLIDATED FINANCIAL
STATEMENTS5 ADDITIONAL INFORMATION
TEN-YEAR OVERVIEW

Ten-year overview
2017 2016 2015 2014 2013 2012 2011 1 2010 2009 2008
Net Sales by Product Category (€ in millions)Footwear 2, 3 12,427 10,132 8,360 6,658 6,587 6,922 6,242 5,389 4,642 4,919Apparel 2, 3 7,747 7,352 6,970 6,279 5,811 6,290 5,733 5,380 4,663 4,775Hardware 2, 3 1,044 999 1,585 1,597 1,806 1,671 1,347 1,221 1,076 1,105
Balance Sheet Data (€ in millions)Total assets 14,522 15,176 13,343 12,417 11,599 11,651 11,237 10,618 8,875 9,533Inventories 3,692 3,763 3,113 2,526 2,634 2,486 2,502 2,119 1,471 1,995Receivables and other current assets 3,277 3,607 3,003 2,861 2,583 2,444 2,431 2,324 2,038 2,523Working capital 2,354 2,121 2,133 2,970 2,125 2,504 1,990 1,972 1,649 1,290Net cash/(net borrowings) 484 (103) (460) (185) 295 448 90 (221) (917) (2,189)Shareholders’ equity 6,450 6,472 5,666 5,624 5,489 5,304 5,137 4,616 3,771 3,386
Balance Sheet RatiosNet borrowings/EBITDA 2, 3 (0.2) 0.1 0.3 0.1 (0.2) (0.3) (0.1) 0.2 1.2 1.7Average operating working capital in % of net sales 2, 3 20.4% 21.1% 20.5% 22.4% 21.3% 20.0% 20.4% 20.8% 24.3% 24.5%Financial leverage (7.5%) 1.6% 8.1% 3.3% (5.4%) (8.5%) (1.8%) 4.8% 24.3% 64.6%Equity ratio 44.4% 42.6% 42.5% 45.3% 47.3% 45.5% 45.7% 43.5% 42.5% 35.5%Equity-to-fixed-assets ratio 109.7% 102.9% 96.9% 110.9% 115.8% 111.1% 104.6% 97.4% 85.9% 73.6%Asset coverage I 140.3% 134.0% 136.8% 158.7% 145.0% 152.7% 140.7% 141.5% 137.4% 127.7%Asset coverage II 86.2% 83.8% 89.3% 105.9% 93.2% 100.4% 93.2% 97.7% 102.9% 89.1%Fixed asset intensity of investments 40.5% 41.4% 43.8% 40.8% 40.9% 41.0% 43.7% 44.6% 49.5% 48.2%Current asset intensity of investments 59.5% 58.6% 56.2% 59.2% 59.1% 59.0% 56.3% 55.4% 50.5% 51.8%Liquidity I 25.5% 22.4% 25.5% 38.6% 34.4% 44.3% 31.6% 35.5% 30.0% 10.5%Liquidity II 62.3% 54.9% 63.7% 83.0% 72.6% 82.9% 68.3% 78.2% 80.4% 55.1%Liquidity III 121.0% 110.6% 121.8% 140.7% 128.3% 139.7% 126.0% 132.4% 132.2% 109.8%Working capital turnover 2, 3 9.0 8.7 7.9 4.9 6.7 5.9 6.7 6.1 6.3 8.4Return on equity 9 17.0% 15.7% 11.2% 8.7% 14.3% 9.9% 11.9% 12.3% 6.5% 18.9%Return on capital employed 9 39.8% 24.2% 16.5% 13.8% 23.6% 19.3% 19.9% 20.2% 11.3% 19.8%
1 2011 restated according to IAS 8 in the 2012 consolidated financial statements. 2 2017 and 2016 figures reflect continuing operations as a result of the divestiture of the Rockport, TaylorMade, Adams Golf, Ashworth and CCM Hockey businesses. 3 2015, 2014 and 2013 figures reflect continuing operations as a result of the divestiture of the Rockport business. 4 2015 excluding goodwill impairment of € 34 million. 5 2014 excluding goodwill impairment of € 78 million. 6 2013 excluding goodwill impairment of € 52 million. 7 2012 excluding goodwill impairment of € 265 million. 8 2017 excluding negative one-time tax impact of € 76 million. 9 Includes continuing and discontinued operations.10 Subject to Annual General Meeting approval.
ADID
AS
ANN
UAL
REPO
RT 2
017
2301 TO OUR SHAREHOLDERS 2 GROUP MANAGEMENT REPORT –
OUR COMPANY3 GROUP MANAGEMENT REPORT –
FINANCIAL REVIEW4 CONSOLIDATED FINANCIAL
STATEMENTS5 ADDITIONAL INFORMATION
TEN-YEAR OVERVIEW
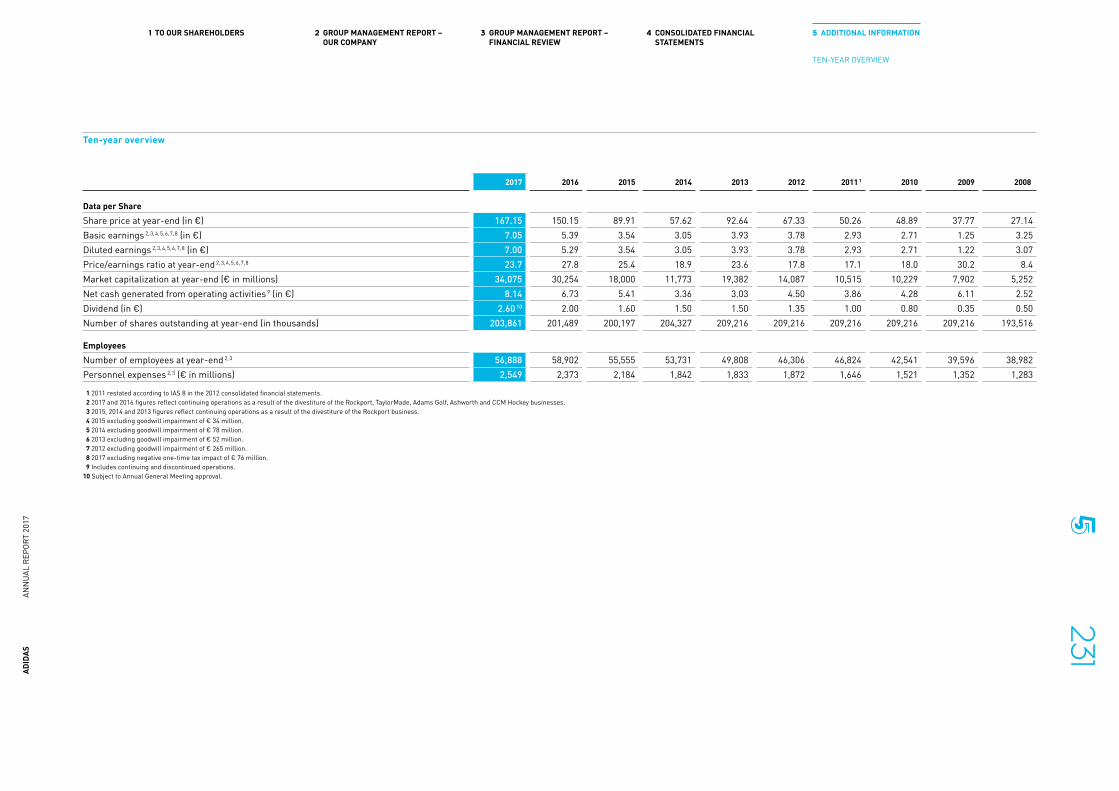
Ten-year overview
2017 2016 2015 2014 2013 2012 2011 1 2010 2009 2008
Data per ShareShare price at year-end (in €) 167.15 150.15 89.91 57.62 92.64 67.33 50.26 48.89 37.77 27.14Basic earnings 2, 3, 4, 5, 6, 7, 8 (in €) 7.05 5.39 3.54 3.05 3.93 3.78 2.93 2.71 1.25 3.25Diluted earnings 2, 3, 4, 5, 6, 7, 8 (in €) 7.00 5.29 3.54 3.05 3.93 3.78 2.93 2.71 1.22 3.07Price/earnings ratio at year-end 2, 3, 4, 5, 6, 7, 8 23.7 27.8 25.4 18.9 23.6 17.8 17.1 18.0 30.2 8.4Market capitalization at year-end (€ in millions) 34,075 30,254 18,000 11,773 19,382 14,087 10,515 10,229 7,902 5,252Net cash generated from operating activities 9 (in €) 8.14 6.73 5.41 3.36 3.03 4.50 3.86 4.28 6.11 2.52Dividend (in €) 2.60 10 2.00 1.60 1.50 1.50 1.35 1.00 0.80 0.35 0.50Number of shares outstanding at year-end (in thousands) 203,861 201,489 200,197 204,327 209,216 209,216 209,216 209,216 209,216 193,516
EmployeesNumber of employees at year-end 2, 3 56,888 58,902 55,555 53,731 49,808 46,306 46,824 42,541 39,596 38,982Personnel expenses 2, 3 (€ in millions) 2,549 2,373 2,184 1,842 1,833 1,872 1,646 1,521 1,352 1,283
1 2011 restated according to IAS 8 in the 2012 consolidated financial statements. 2 2017 and 2016 figures reflect continuing operations as a result of the divestiture of the Rockport, TaylorMade, Adams Golf, Ashworth and CCM Hockey businesses. 3 2015, 2014 and 2013 figures reflect continuing operations as a result of the divestiture of the Rockport business. 4 2015 excluding goodwill impairment of € 34 million. 5 2014 excluding goodwill impairment of € 78 million. 6 2013 excluding goodwill impairment of € 52 million. 7 2012 excluding goodwill impairment of € 265 million. 8 2017 excluding negative one-time tax impact of € 76 million. 9 Includes continuing and discontinued operations.10 Subject to Annual General Meeting approval.
ADID
AS
ANN
UAL
REPO
RT 2
017
2311 TO OUR SHAREHOLDERS 2 GROUP MANAGEMENT REPORT –
OUR COMPANY3 GROUP MANAGEMENT REPORT –
FINANCIAL REVIEW4 CONSOLIDATED FINANCIAL
STATEMENTS5 ADDITIONAL INFORMATION
TEN-YEAR OVERVIEW
GLOSSARY
/ AATHLEISURE The term is composed of the words athletic and leisure. It describes a fashion trend of sportswear no longer being just meant for training but increasingly shaping everyday clothing.
/ BBACKLOGS Also called order backlogs. The value of orders received for future delivery. Most retailers’ orders are received six to nine months in advance.
BRAND LEADERSHIPadidas’ operating model that aims at providing an organizational structure which enables a ‘consumer-obsessed’ culture that can act with speed, agility and empowerment.
/ CCAPITAL EXPENDITURE Total cash expenditure used for the purchase of tangible and intangible assets, excluding acquisitions and finance leases.
CASH POOLING A cash management technique for physical concentration of cash. Cash pooling allows adidas to combine credit and debit positions from various accounts and several subsidiaries into one central account. This technique supports our in-house bank concept where advantage is taken of any surplus funds of subsidiaries to cover cash requirements of other subsidiaries, thus reducing external financing needs and optimizing our net interest expenses.
CONTROLLED SPACE Includes own-retail business, mono-branded franchise stores, shop-in-shops, joint ventures with retail partners and co-branded stores. Controlled space offers a high level of brand control and ensures optimal product offering and presentation according to brand requirements.
CONVERSION RATE A key ratio in retail business describing the number of buying customers compared to those who entered the store without buying something; i.e. a 25% conversion rate means that 100 persons entered a store with 25 of them buying something.
/ DDROP RATEShare of articles that are dropped because they do not meet the demand or strategic direction for a given season, despite being created initially. These articles are excluded from the range, do not go into serial production and are not sold to customers.
/ FFITHUB FitHub is Reebok’s new own-retail store concept, inspired by CrossFit gyms and fitness studios. Each FitHub offers a selection of Reebok’s best product assortment, from footwear to apparel and accessories. Also, it inspires people to move, to train, to get fit and have fun doing it with innovative fitness products, trusted advice from trained staff and community-based events.
/ GGENDERDAXAn industry- and science-based gender and diversity project, including a ranking of German companies which are committed to actively supporting highly qualified and career-oriented women within their human resource and diversity management.
GOODWILL Intangible asset that quantifies the price that a buyer of a company has paid for the reputation, know-how and market position of the acquired company. Goodwill is the excess of the amount paid over the fair value of the net assets acquired at the purchase date. It is stated at cost and tested for impairment annually or on such other occasions that events or changes in circumstances indicate that it might be impaired.
ADID
AS
ANN
UAL
REPO
RT 2
017
2321 TO OUR SHAREHOLDERS 2 GROUP MANAGEMENT REPORT –
OUR COMPANY3 GROUP MANAGEMENT REPORT –
FINANCIAL REVIEW4 CONSOLIDATED FINANCIAL
STATEMENTS5 ADDITIONAL INFORMATION
GLOSSARY
/ HHARDWARE A product category which comprises equipment that is used rather than worn by the consumer, such as bags, balls, fitness equipment, golf clubs and hockey sticks.
/ LLEED Leadership in Energy and Environmental Design (LEED) certification is an internationally recognized green building certification system, providing third-party verification that a building was designed and built using strategies aimed at improvements in the following areas: energy savings, water efficiency, CO2 emission reduction, indoor environmental quality and stewardship of resources and sensitivity to their impacts.
/ MMARKETING EXPENDITURE Expenditures that relate to point-of-sale and marketing investments. While point-of-sale investments include expenses for advertising and promotion initiatives at the point of sale as well as store fittings and furniture, marketing investments relate to sponsorship contracts with teams and individual athletes as well as to advertising, events and other communication activities. Marketing overhead expenses are not included in marketing expenditure.
/ NNEIGHBOURHOODNeighbourhood is adidas Originals’ premium own-retail store concept which brings the style and spirit of sport to the streets. The aim is to turn Originals stores into a local cultural epicenter. The store environment takes its inspiration from the neighborhood, which is at the heart of Originals.
NET CASH/NET BORROWINGS Net cash is when the sum of cash and short-term financial assets exceeds gross borrowings. Net borrowings is the portion of gross borrowings not covered by the sum of cash and short-term financial assets.
Net cash/net borrowings =
cash and cash equivalents
+ short-term financial assets – short-term borrowings – long-term borrowings
NET PROMOTER SCORE (NPS)A survey-based measure of how likely people are to recommend a brand. The survey is based on one single question to consumers: ‘How likely are you to recommend this brand to your friends?’, which can be answered within a scale from 0 to 10. Promoters are consumers giving the brand a 9 or 10 rating, while detractors are those between a 0 and 6 rating. The NPS is the difference between promoters and detractors measured in percentage points.
NON-CONTROLLING INTERESTS Part of net income or equity which is not attributable to the shareholders of the reporting company as it relates to outside ownership interests in subsidiaries that are consolidated with the parent company for financial reporting purposes.
NON-TRADE PROCUREMENT ACTIVITIESNon-trade procurement is the sourcing of goods and services which are not linked or indirectly linked to regular trade products sold to customers. The goods and services are classified as consumption by internal stakeholders and include things such as repairing equipment and purchasing office supplies.
ADID
AS
ANN
UAL
REPO
RT 2
017
2331 TO OUR SHAREHOLDERS 2 GROUP MANAGEMENT REPORT –
OUR COMPANY3 GROUP MANAGEMENT REPORT –
FINANCIAL REVIEW4 CONSOLIDATED FINANCIAL
STATEMENTS5 ADDITIONAL INFORMATION
GLOSSARY
/ OOMNI-CHANNEL SALES APPROACH Describes the ambition to achieve a globally consistent product offer, brand communication, availability and service across all sales channels (wholesale, retail and e-commerce) and consumer touchpoints.
OPERATING CASH FLOW Comprises operating profit, change in operating working capital and net investments.
Operating cash flow =
operating profit
+/– change in operating working capital
+/– net investments (capital expenditure less depreciation)
OPERATING OVERHEAD EXPENSES Expenses which are not directly attributable to the products or services sold, such as costs for distribution, marketing overhead costs, logistics, research and development, as well as general and administrative costs, but not including costs for promotion, advertising and communication.
OPERATING WORKING CAPITALA company’s short-term disposable capital which is used to finance its day-to-day business. In comparison to working capital, operating working capital does not include non-operational items such as financial assets and taxes.
Operating working capital =
accounts receivable
+ inventories – accounts payable
/ PPARLEY FOR THE OCEANS Parley for the Oceans is the network and space where creators, thinkers and leaders raise awareness for the beauty and fragility of the oceans and collaborate on projects that can end their destruction. As a founding member since 2015, adidas supports Parley for the Oceans in its education and communication efforts and commits to the Parley A.I.R. (Avoid, Intercept, Redesign) strategy.
PARLEY OCEAN PLASTICParley Ocean Plastic is a material created from upcycled plastic waste that is intercepted before it reaches beaches and coastal communities. Parley for the Oceans works with its partners to collect, sort and transport the recovered raw material (mainly PET bottles) to our supplier who produces the yarn, which is legally trademarked.
PERFORMANCE PRODUCTS In the sporting goods industry, performance products relate to technical footwear and apparel used primarily in doing sports.
PRICE POINTS Specific selling prices, normally using ‘psychological’ numbers, e. g. a product price of US $ 99.99 instead of US $ 100.
PROMOTION PARTNERSHIPS Partnerships with events, associations, leagues, clubs and individual athletes. In exchange for the services of promoting the company’s brands, the party is provided with products and/or cash and/or promotional materials.
/ RROLLING FORECAST A projection about the future that is updated at regular intervals, keeping the forecasting period constant (e. g. twelve months).
/ SSHARE TURNOVER The total value of all shares traded in the share price currency over a specific period of time (normally daily). It is calculated by multiplying the number of shares traded by the respective price.
SINGLE-SOURCING MODEL Supply chain activities limited to one specific supplier. Due to the dependency on only one supplier, a company can face disadvantages during the sourcing process.
ADID
AS
ANN
UAL
REPO
RT 2
017
2341 TO OUR SHAREHOLDERS 2 GROUP MANAGEMENT REPORT –
OUR COMPANY3 GROUP MANAGEMENT REPORT –
FINANCIAL REVIEW4 CONSOLIDATED FINANCIAL
STATEMENTS5 ADDITIONAL INFORMATION
GLOSSARY

SPEEDFACTORY adidas Speedfactory is a digitally automated, hyper-flexible shoe factory that can be placed anywhere in the world. It enables us to combine speed in manufacturing with the flexibility to rethink conventional processes, and give the consumers what they want, when they want it. Speedfactory provides greater precision, athlete data-driven design opportunities, and high performance. It also enables accelerated speed to market – three times faster than the standard production times – allowing for quicker response time to trends and shifts in the marketplace. There are currently two Speedfactory locations in the world: one in Ansbach, Germany and the other in Atlanta, USA.
STADIUMStadium is a new own-retail store concept for the adidas brand, inspired by high school stadiums. It aims at creating a sports stadium-like atmosphere to enhance the in-store experience, such as a tunnel entrance, stands for live-game viewing on big screens, locker rooms instead of dressing rooms and track and field areas where consumers can test and experience products.
SUSTAINABLE COTTONFor adidas, sustainable cotton means certified organic cotton or any other form of sustainably produced cotton that is currently available or might be in future, and Better Cotton.
/ TTOP AND BOTTOM LINE A company’s bottom line is its net income attributable to shareholders. More specifically, the bottom line is a company’s income after all expenses have been deducted from revenues. The top line refers to a company’s sales or revenues.
TOP-DOWN, BOTTOM-UP A specific concept for information and knowledge processing. In a first step, information and empowerment of management decisions is delegated from top to bottom. After going into more detail on the bottom level, the final information and decision are then transported back to the top.
/ VVERTICAL RETAILER A retail company that (vertically) controls the entire design, production and distribution processes of its products.
/ WWET PROCESSES Wet processes are defined as water-intense processes, such as dyeing and finishing of materials.
ADID
AS
ANN
UAL
REPO
RT 2
017
2351 TO OUR SHAREHOLDERS 2 GROUP MANAGEMENT REPORT –
OUR COMPANY3 GROUP MANAGEMENT REPORT –
FINANCIAL REVIEW4 CONSOLIDATED FINANCIAL
STATEMENTS5 ADDITIONAL INFORMATION
GLOSSARY
DECLARATION OF SUPPORT
adidas AG declares support, except in the case of political risk, that the below-mentioned companies are able to meet their contractual liabilities. This declaration replaces the declaration dated February 17, 2017, which is no longer valid. The declaration of support automatically ceases from the time that a company no longer is a subsidiary of adidas AG.
adidas (China) Ltd., Shanghai, Chinaadidas (Cyprus) Limited, Nicosia, Cyprusadidas (Ireland) Limited, Dublin, Irelandadidas (Malaysia) Sdn. Bhd., Petaling Jaya, Malaysiaadidas (South Africa) (Pty) Ltd., Cape Town, South Africaadidas (Suzhou) Co. Ltd., Suzhou, Chinaadidas (Thailand) Co., Ltd., Bangkok, Thailandadidas (UK) Limited, Stockport, Great Britainadidas America, Inc., Portland, Oregon, USAadidas anticipation GmbH, Herzogenaurach, Germanyadidas Argentina S.A., Buenos Aires, Argentinaadidas Australia Pty Limited, Mulgrave, Australiaadidas Austria GmbH, Klagenfurt, Austriaadidas Baltics SIA, Riga, Latviaadidas Benelux B.V., Amsterdam, Netherlandsadidas Budapest Kft., Budapest, Hungaryadidas Bulgaria EAD, Sofia, Bulgariaadidas Business Services (Dalian) Limited, Dalian, Chinaadidas Business Services Lda., Morea de Maia, Portugaladidas Canada Ltd., Woodbridge, Ontario, Canadaadidas CDC Immobilieninvest GmbH, Herzogenaurach,
Germanyadidas Chile Limitada, Santiago de Chile, Chileadidas Colombia Ltda., Bogotá, Colombiaadidas CR s.r.o., Prague, Czech Republic
adidas Croatia d.o.o., Zagreb, Croatiaadidas Danmark A/S, Copenhagen, Denmarkadidas de Mexico, S.A. de C.V., Mexico City, Mexicoadidas do Brasil Ltda., São Paulo, Braziladidas Emerging Markets FZE, Dubai, United Arab Emiratesadidas Emerging Markets L.L.C, Dubai, United Arab Emiratesadidas España S.A.U., Zaragoza, Spainadidas France S.a.r.l., Landersheim, Franceadidas Hellas A.E., Athens, Greeceadidas Hong Kong Limited, Hong Kong, Chinaadidas Imports & Exports Ltd., Cairo, Egyptadidas India Marketing Private Limited, New Delhi, Indiaadidas Industrial, S.A. de C.V., Mexico City, Mexicoadidas Indy, LLC (formerly: Sports Licensed Division of the
adidas Group, LLC), Wilmington, Delaware, USAadidas Insurance & Risk Consultants GmbH,
Herzogenaurach, Germanyadidas International B.V., Amsterdam, Netherlandsadidas International Finance B.V., Amsterdam, Netherlandsadidas International Marketing B.V., Amsterdam, Netherlandsadidas International Property Holding B.V., Amsterdam,
Netherlandsadidas International Re DAC, Dublin, Irelandadidas International Trading B.V., Amsterdam, Netherlandsadidas International, Inc., Portland, Oregon, USAadidas Italy S.p.A., Monza, Italyadidas Japan K.K., Tokyo, Japanadidas Korea LLC., Seoul, Koreaadidas Latin America, S.A., Panama City, Panamaadidas LLP, Almaty, Republic of Kazakhstanadidas Logistics (Tianjin) Co., Ltd., Tianjin, Chinaadidas Morocco LLC, Casablanca, Moroccoadidas New Zealand Limited, Auckland, New Zealandadidas Norge AS, Oslo, Norwayadidas North America, Inc., Portland, Oregon, USAadidas Perú S.A.C., Lima, Peruadidas Philippines Inc., Pasig City, Philippines
adidas Poland Sp.z o.o., Warsaw, Polandadidas Portugal - Artigos de Desporto, S.A., Lisbon, Portugaladidas Romania S.R.L., Bucharest, Romaniaadidas Serbia d.o.o., Belgrade, Serbiaadidas Services Limited, Hong Kong, Chinaadidas Singapore Pte. Ltd., Singapore, Singaporeadidas Slovakia s.r.o., Bratislava, Slovak Republicadidas Sourcing Limited, Hong Kong, Chinaadidas Spor Malzemeleri Satis ve Pazarlama A.S., Istanbul,
Turkeyadidas sport gmbh, Cham, Switzerlandadidas Sporting Goods Ltd., Cairo, Egyptadidas Sports Goods (Shanghai) Co., Ltd., Shanghai, China adidas Sports (China) Co. Ltd., Suzhou, Chinaadidas Suomi Oy, Helsinki, Finlandadidas Sverige AB, Solna, Swedenadidas Taiwan Limited, Taipei, Taiwanadidas Trgovina d.o.o., Ljubljana, Sloveniaadidas Vietnam Company Limited, Ho Chi Minh City, Vietnamadisport Corporation, San Juan, Puerto RicoConcept Sport, S.A., Panama City, PanamaGlobal Merchandising, S.L., Madrid, SpainHydra Ventures B.V., Amsterdam, NetherlandsLLC ‘adidas, Ltd.’, Moscow, RussiaPT adidas Indonesia, Jakarta, IndonesiaRaelit S.A., Montevideo, UruguayReebok Argentina S.A., Buenos Aires, Argentina Reebok International Limited, London, Great BritainReebok International Ltd., Canton, Massachusetts, USAReebok Produtos Esportivos Brasil Ltda., Jundiaí, Brazil Reebok Israel Ltd., Holon, IsraelSC ‘adidas-Ukraine’, Kiev, UkraineSpartanburg DC, Inc., Spartanburg, South Carolina, USAStone Age Equipment, Inc., Redlands, California, USATafibal S.A., Montevideo, UruguayTextronics, Inc., Wilmington, Delaware, USATrafford Park DC Limited, London, Great Britain
ADID
AS
ANN
UAL
REPO
RT 2
017
2361 TO OUR SHAREHOLDERS 2 GROUP MANAGEMENT REPORT –
OUR COMPANY3 GROUP MANAGEMENT REPORT –
FINANCIAL REVIEW4 CONSOLIDATED FINANCIAL
STATEMENTS5 ADDITIONAL INFORMATION
DECLARATION OF SUPPORT

F I N A N C I A LC A L E N D A R
2 0 1 8
FIRST HALF 2018 RESULTS
Press Release / Conference Call and Webcast / Publication of First Half Report
FIRST QUARTER 2018 RESULTS
Press Release / Conference Call and Webcast
FULL YEAR 2017 RESULTS Press Conference in Herzogenaurach, Germany /
Press Release / Conference Call and Webcast / Publication of 2017 Annual Report
DIVIDEND PAYMENT
(subject to Annual General Meeting approval)
ANNUAL GENERAL MEETING Fuerth (Bavaria),
Germany / Webcast
NINE MONTHS 2018 RESULTS
Press Release / Conference Call and Webcast
237AD
IDAS
AN
NUA
L RE
PORT
201
7

ADI-DASSLER-STR. 1
91074 HERZOGENAURACH
GERMANY
TEL + 49 (0) 91 32 84 – 0
FAX + 49 (0) 91 32 84 – 22 41
ADIDAS-GROUP . COM
INVESTOR RELATIONS
TEL + 49 (0) 91 32 84 – 29 20
FAX + 49 (0) 91 32 84 – 31 27
↗ INVESTOR.RELATIONS@ADIDAS–GROUP.COM
↗ ADIDAS–GROUP.COM ⁄ INVESTORS
ADIDAS IS A MEMBER OF DIRK
(GERMAN INVESTOR RELATIONS ASSOCIATION)
CONCEPT, DESIGN AND REALIZATION
MPM CORPORATE COMMUNICATION SOLUTIONS, MAINZ, GERMANY
WWW.MPM.DE
A D I D A S A G
© 2018 adidas AG
238AD
IDAS
AN
NUA
L RE
PORT
201
7