Our Lean Journey - OrHIMA
56
1 Our Lean Journey Introduction to Lean and Kaizen in HIM
Transcript of Our Lean Journey - OrHIMA

1
Our Lean Journey
Introduction to Lean and Kaizen in HIM
2
ObjectivesAt the end of the presentation participants will
be able to:
• Restate a brief overview of Lean
• Explain why Lean is selected as a
management and Improvement system
• Describe different improvement methods
3
Lean
Lean is about eliminating waste in all forms throughout the organization to create value for the customer. To do this employees need to become problem solvers and continually ask the question WHY. (Lean Pathways, 2011)
4
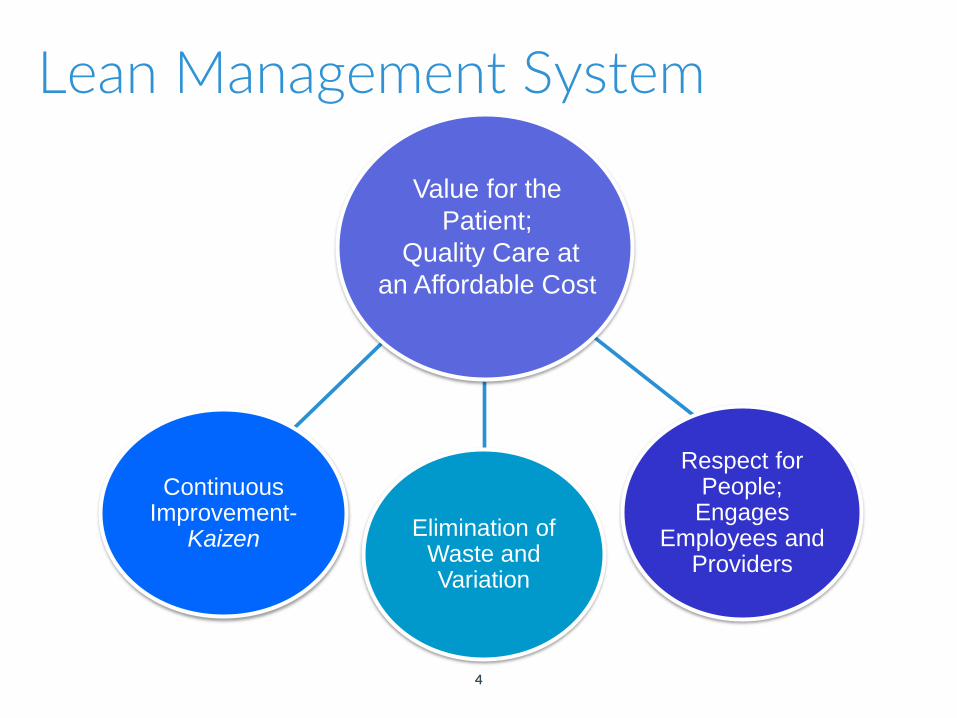
Lean Management System
Continuous Improvement-
Kaizen Elimination of Waste and Variation
Respect for People; Engages
Employees and Providers
Value for the
Patient;
Quality Care at
an Affordable Cost
5
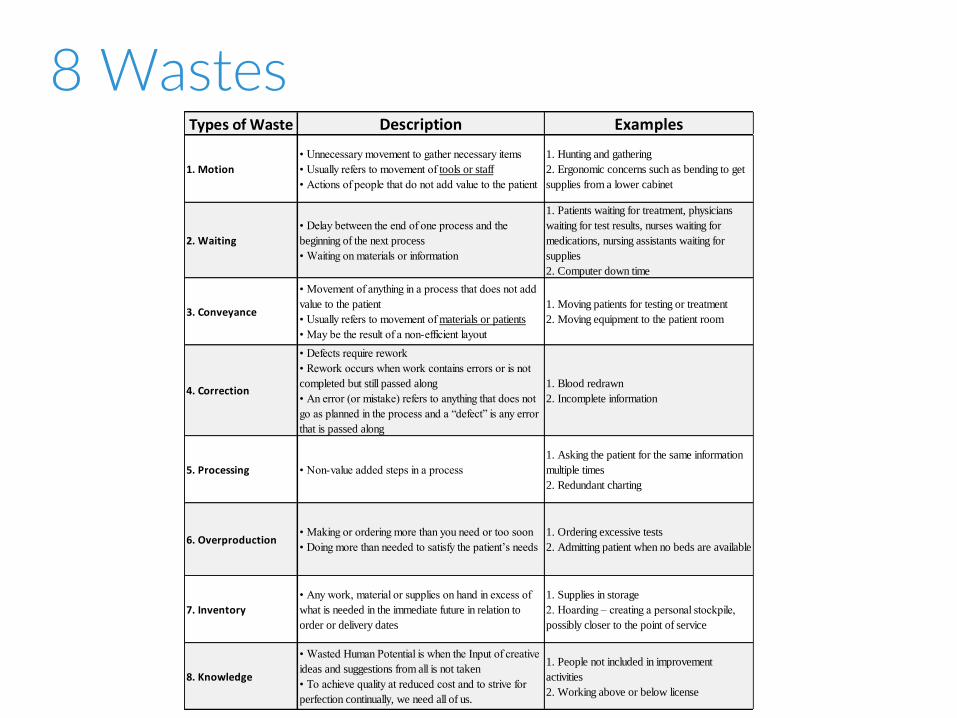
8 WastesTypes of Waste Description Examples
1. Motion
• Unnecessary movement to gather necessary items
• Usually refers to movement of tools or staff
• Actions of people that do not add value to the patient
1. Hunting and gathering
2. Ergonomic concerns such as bending to get
supplies from a lower cabinet
2. Waiting
• Delay between the end of one process and the
beginning of the next process
• Waiting on materials or information
1. Patients waiting for treatment, physicians
waiting for test results, nurses waiting for
medications, nursing assistants waiting for
supplies
2. Computer down time
3. Conveyance
• Movement of anything in a process that does not add
value to the patient
• Usually refers to movement of materials or patients
• May be the result of a non-efficient layout
1. Moving patients for testing or treatment
2. Moving equipment to the patient room
4. Correction
• Defects require rework
• Rework occurs when work contains errors or is not
completed but still passed along
• An error (or mistake) refers to anything that does not
go as planned in the process and a “defect” is any error
that is passed along
1. Blood redrawn
2. Incomplete information
5. Processing • Non-value added steps in a process
1. Asking the patient for the same information
multiple times
2. Redundant charting
6. Overproduction• Making or ordering more than you need or too soon
• Doing more than needed to satisfy the patient’s needs
1. Ordering excessive tests
2. Admitting patient when no beds are available
7. Inventory
• Any work, material or supplies on hand in excess of
what is needed in the immediate future in relation to
order or delivery dates
1. Supplies in storage
2. Hoarding – creating a personal stockpile,
possibly closer to the point of service
8. Knowledge
• Wasted Human Potential is when the Input of creative
ideas and suggestions from all is not taken
• To achieve quality at reduced cost and to strive for
perfection continually, we need all of us.
1. People not included in improvement
activities
2. Working above or below license

6
Signature Business
7
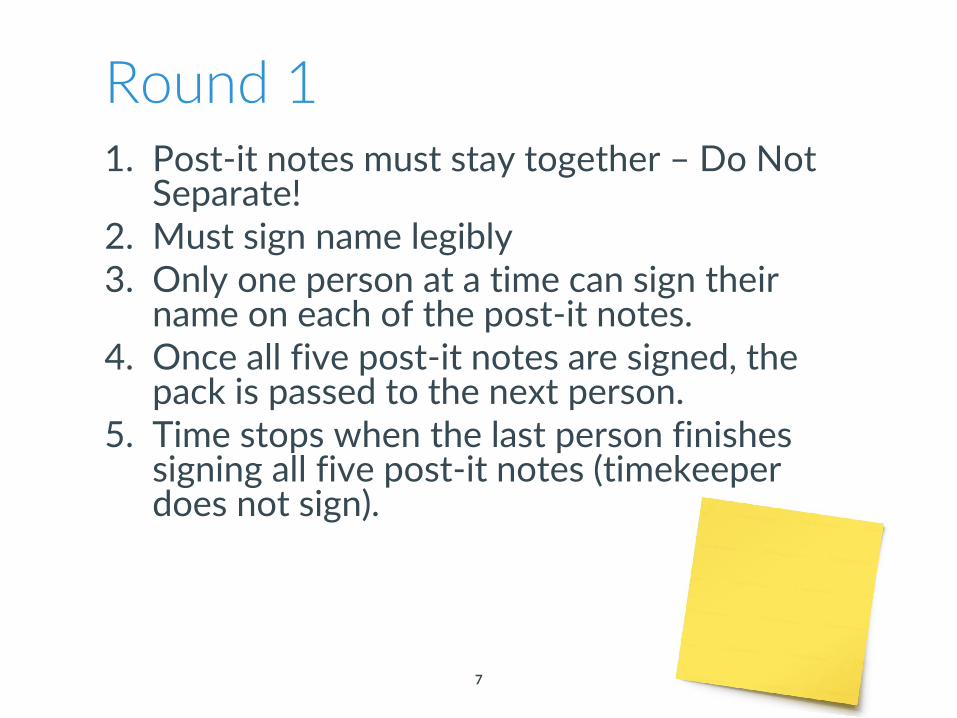
Round 11. Post-it notes must stay together – Do Not
Separate!2. Must sign name legibly 3. Only one person at a time can sign their
name on each of the post-it notes. 4. Once all five post-it notes are signed, the
pack is passed to the next person.5. Time stops when the last person finishes
signing all five post-it notes (timekeeper does not sign).
8
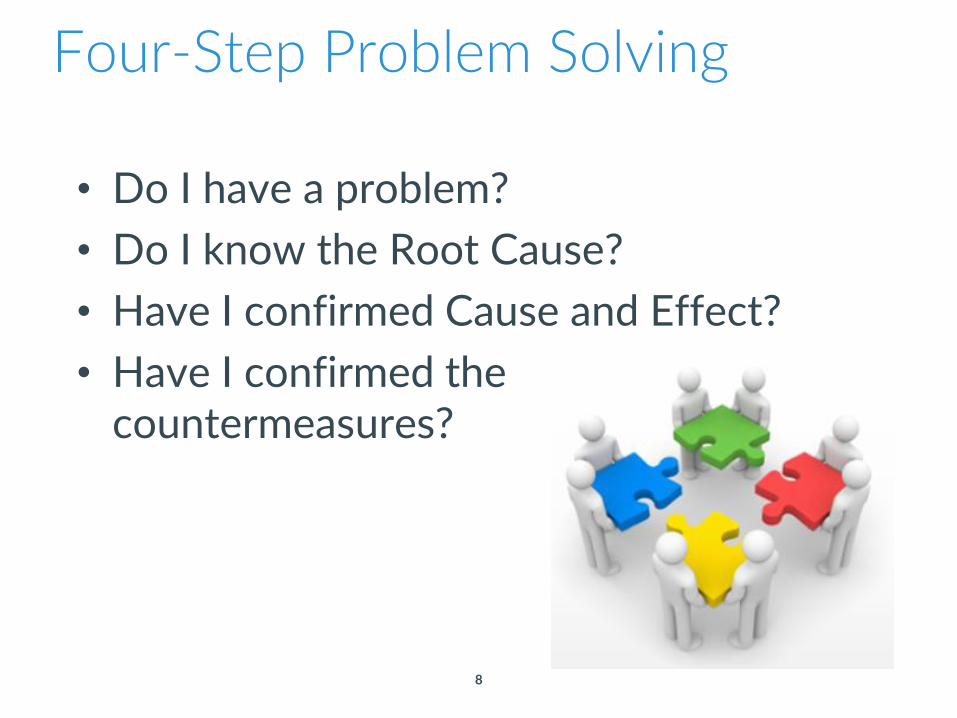
• Do I have a problem?
• Do I know the Root Cause?
• Have I confirmed Cause and Effect?
• Have I confirmed the countermeasures?
Four-Step Problem Solving

9
Step 1Do I have a problem?
What should be happening?
What is actually happening
GO AND SEE
Process Observation
Data Collection
10
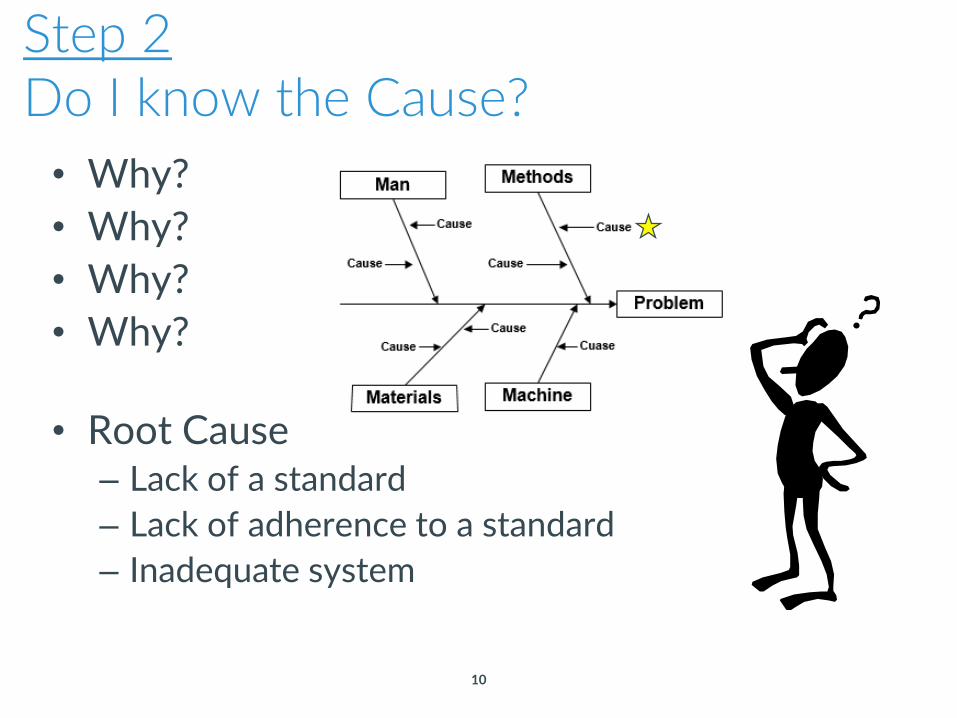
Step 2Do I know the Cause?
• Why?
• Why?
• Why?
• Why?
• Root Cause– Lack of a standard
– Lack of adherence to a standard
– Inadequate system
11
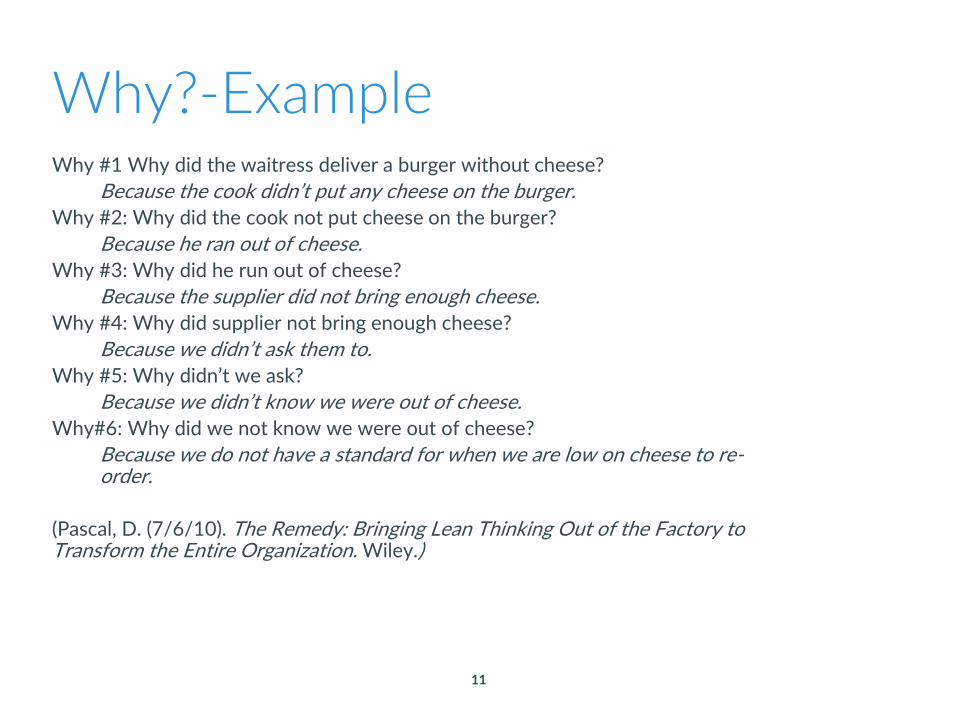
Why?-ExampleWhy #1 Why did the waitress deliver a burger without cheese?
Because the cook didn’t put any cheese on the burger.
Why #2: Why did the cook not put cheese on the burger?
Because he ran out of cheese.
Why #3: Why did he run out of cheese?
Because the supplier did not bring enough cheese.
Why #4: Why did supplier not bring enough cheese?
Because we didn’t ask them to.
Why #5: Why didn’t we ask?
Because we didn’t know we were out of cheese.
Why#6: Why did we not know we were out of cheese?
Because we do not have a standard for when we are low on cheese to re-order.
(Pascal, D. (7/6/10). The Remedy: Bringing Lean Thinking Out of the Factory to Transform the Entire Organization. Wiley.)
12
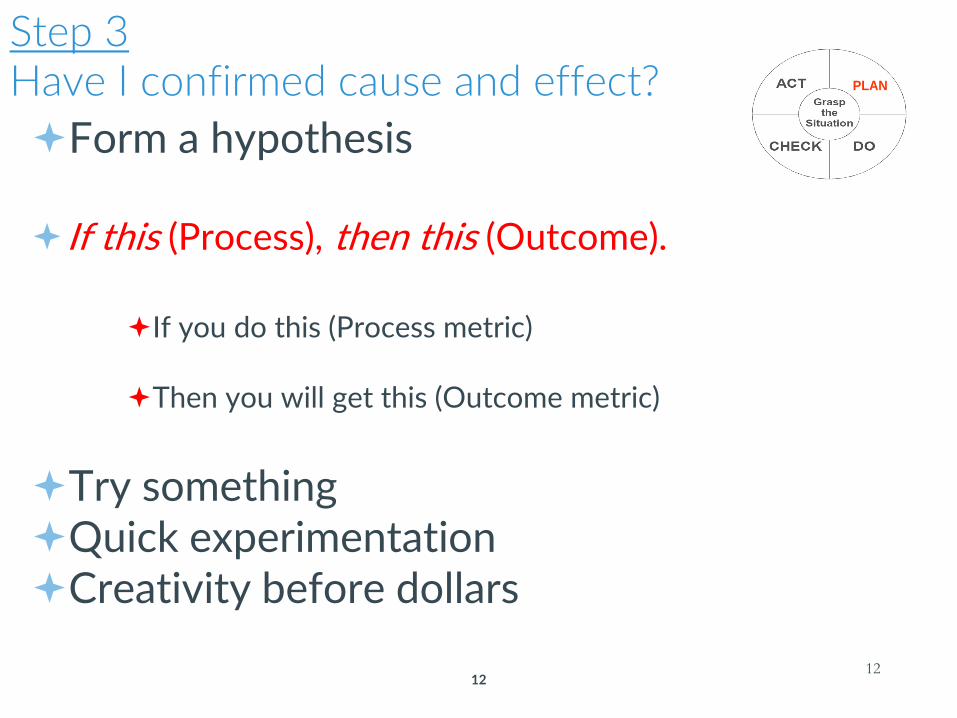
Step 3Have I confirmed cause and effect?
Form a hypothesis
If this (Process), then this (Outcome).
If you do this (Process metric)
Then you will get this (Outcome metric)
Try something Quick experimentationCreativity before dollars
12
PLANPLAN
13
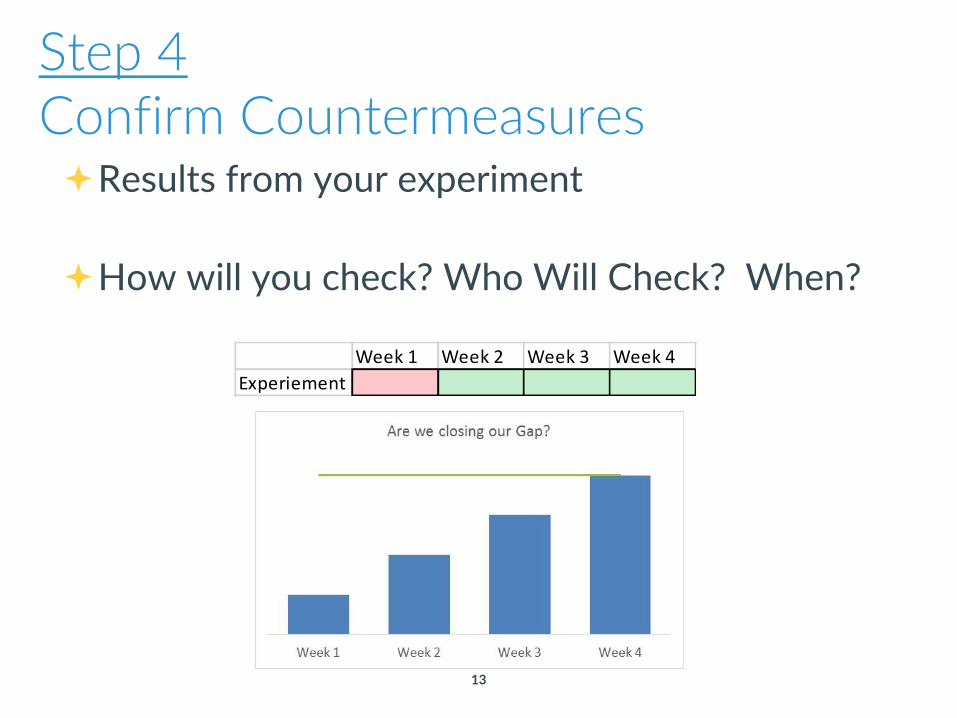
Step 4Confirm Countermeasures Results from your experiment
How will you check? Who Will Check? When?
Week 1 Week 2 Week 3 Week 4
Experiement
14
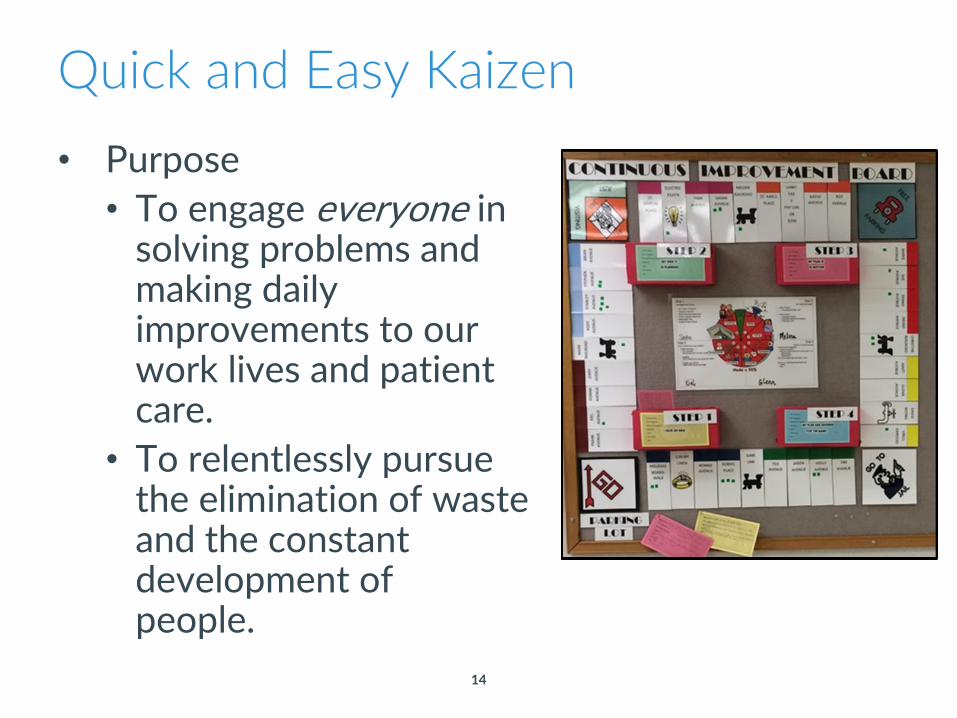
Quick and Easy Kaizen
• Purpose
• To engage everyone in solving problems and making daily improvements to our work lives and patient care.
• To relentlessly pursue the elimination of waste and the constant development of people.
15
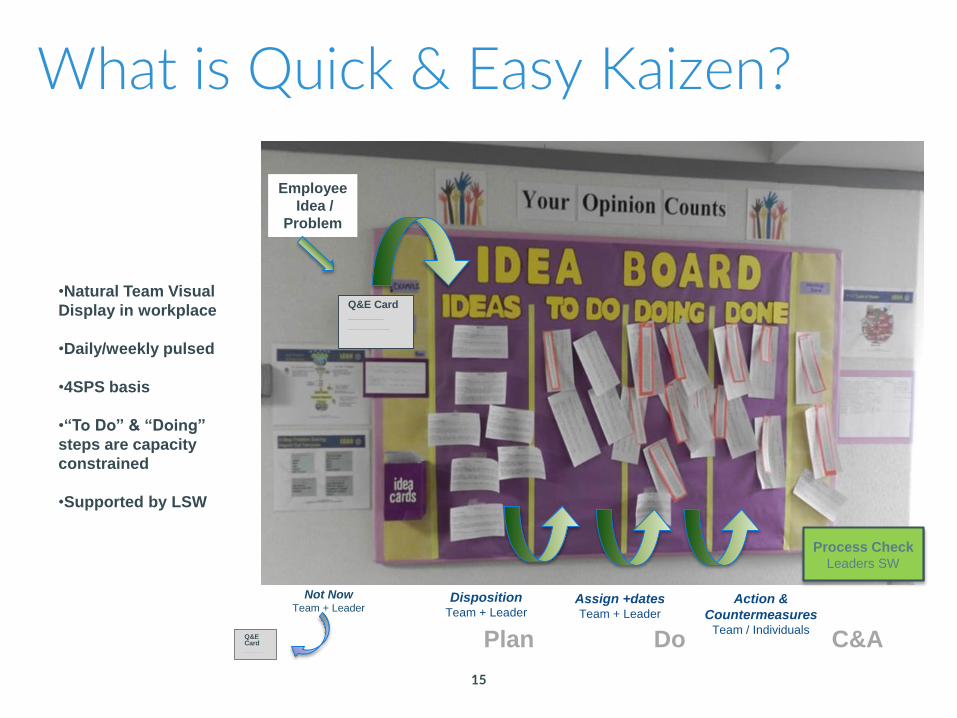
Employee
Idea /
Problem
Q&E Card_____
Not NowTeam + Leader
DispositionTeam + Leader
Assign +datesTeam + Leader
Action &
CountermeasuresTeam / Individuals
Process CheckLeaders SW
•Natural Team Visual
Display in workplace
•Daily/weekly pulsed
•4SPS basis
•“To Do” & “Doing”
steps are capacity
constrained
•Supported by LSW
Plan Do C&A
What is Quick & Easy Kaizen?
Q&E Card_____________
16
17
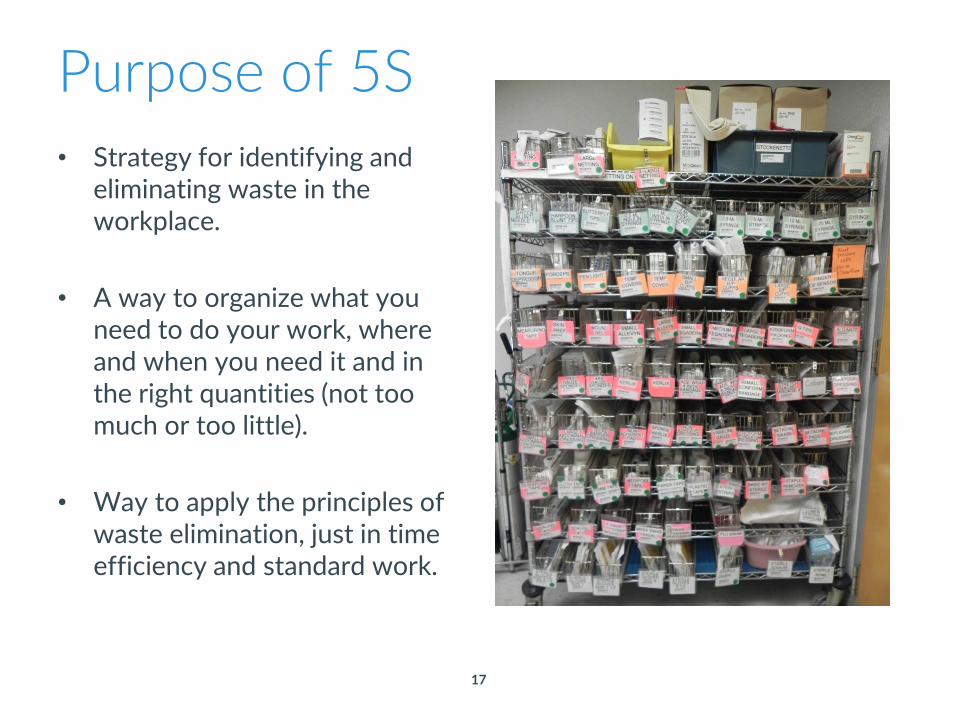
Purpose of 5S
• Strategy for identifying and eliminating waste in the workplace.
• A way to organize what you need to do your work, where and when you need it and in the right quantities (not too much or too little).
• Way to apply the principles of waste elimination, just in time efficiency and standard work.
18
19

20
21
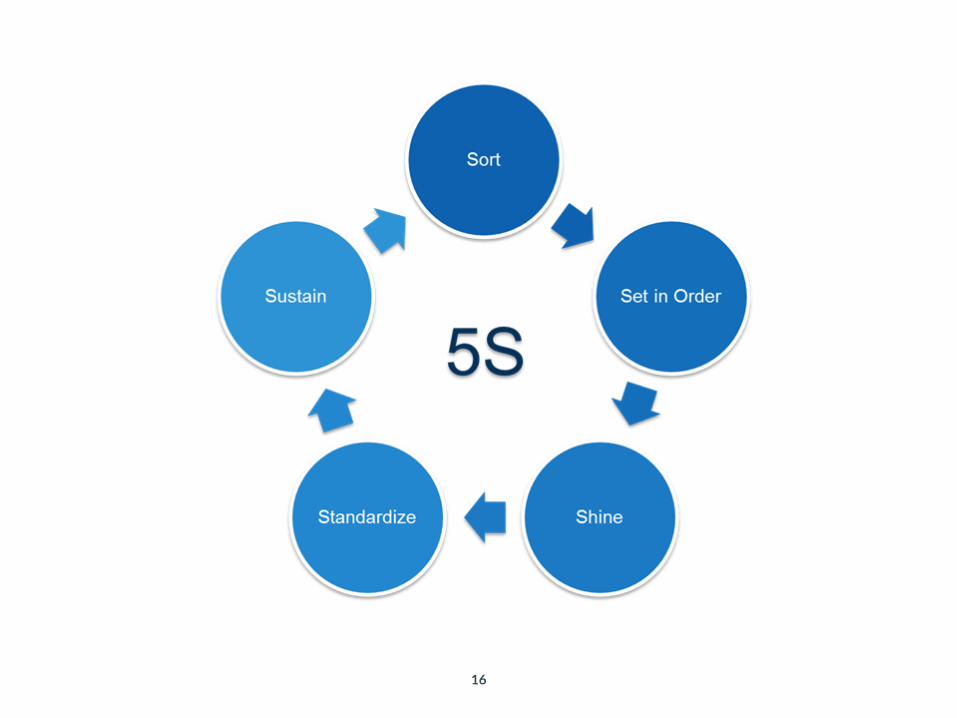
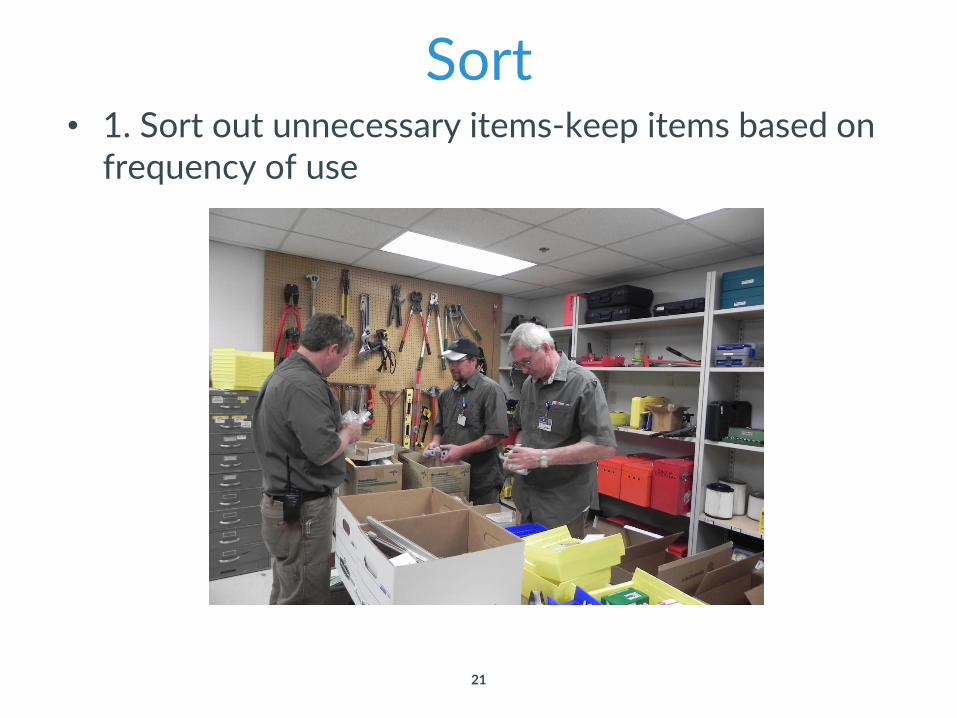
Sort• 1. Sort out unnecessary items-keep items based on
frequency of use
22
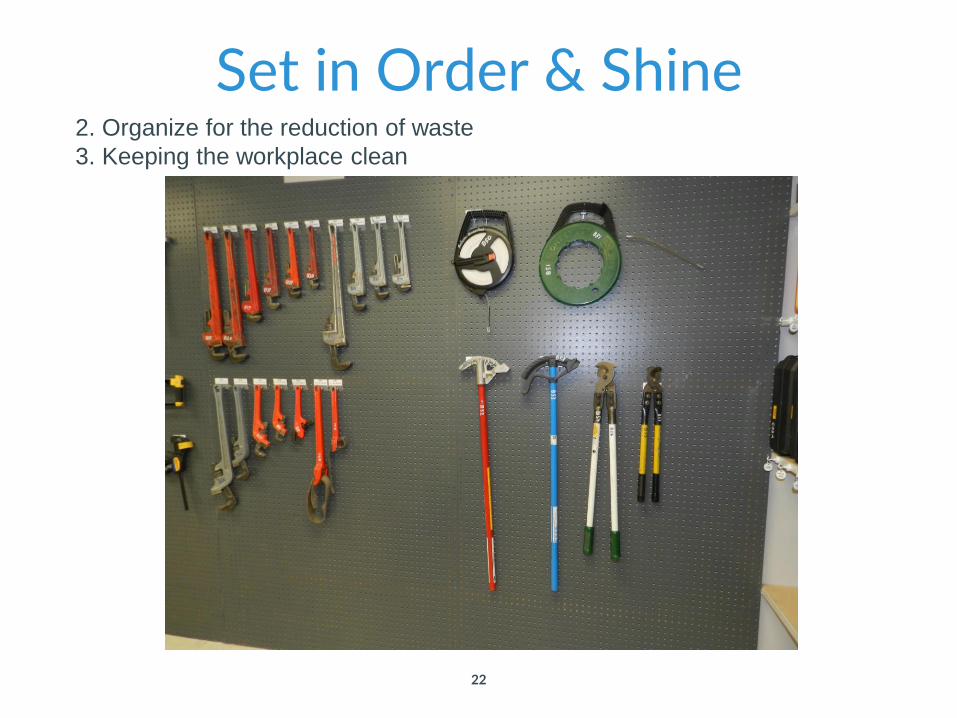
2. Organize for the reduction of waste
3. Keeping the workplace clean
Set in Order & Shine

23
Standardize & Sustain• 4. Developing a consistently organized workplace
• 5. A system for ongoing support of the first 4 steps

24
“Without
standards there
can be no
improvement”
- Taiichi Ohno
25
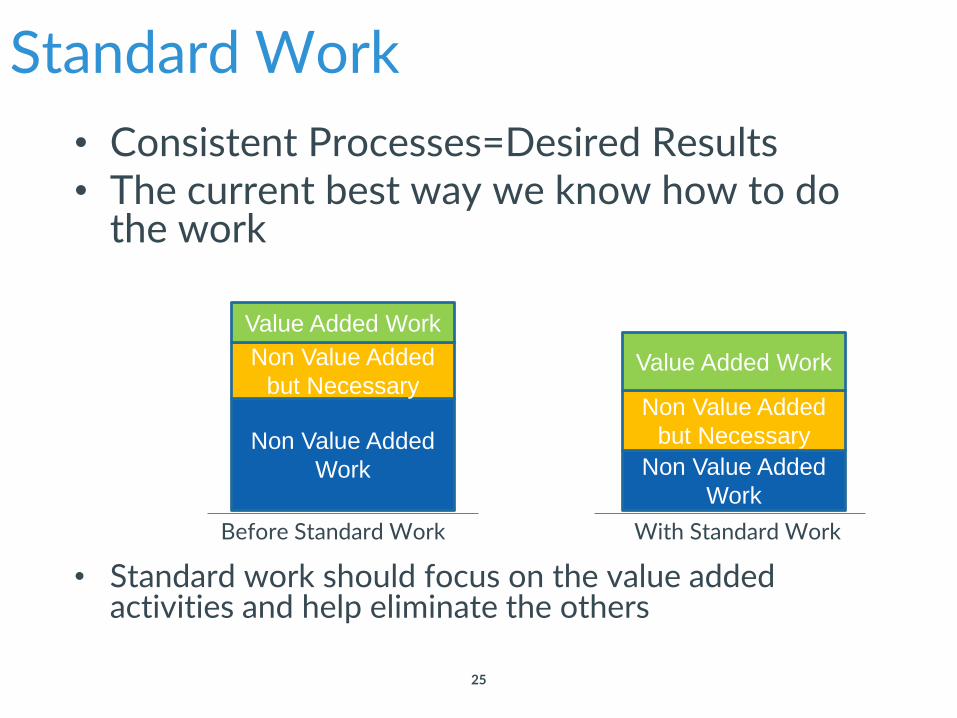
Standard Work
• Consistent Processes=Desired Results• The current best way we know how to do
the work
Before Standard Work With Standard Work
• Standard work should focus on the value added activities and help eliminate the others
Non Value Added
Work
Non Value Added
but Necessary
Value Added Work
Non Value Added
Work
Non Value Added
but Necessary
Value Added Work
26
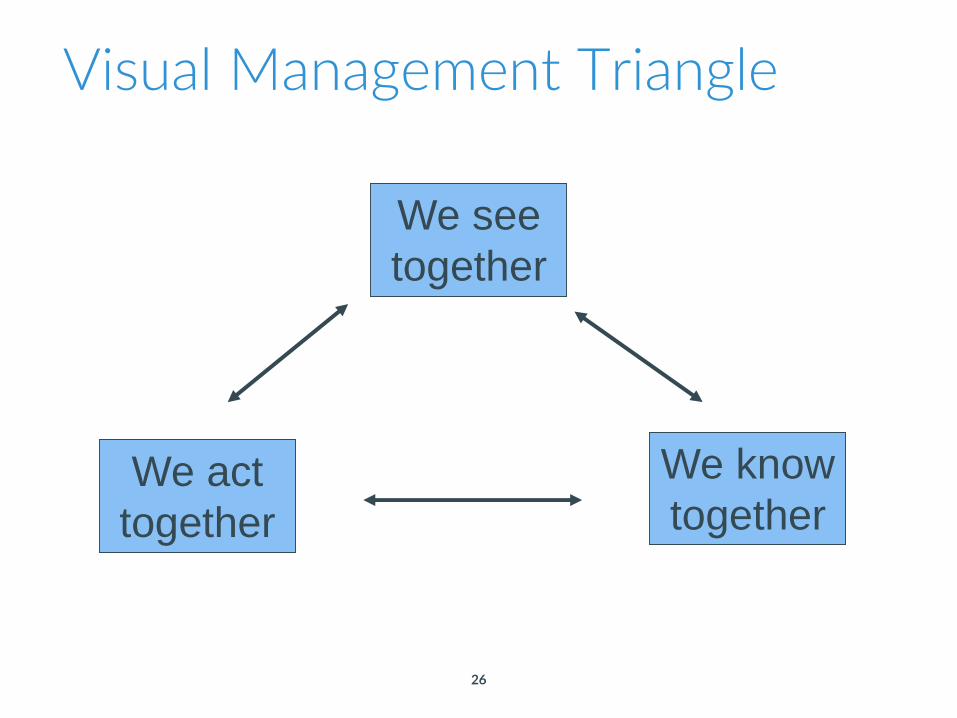
Visual Management Triangle
We see
together
We act
together
We know
together
27
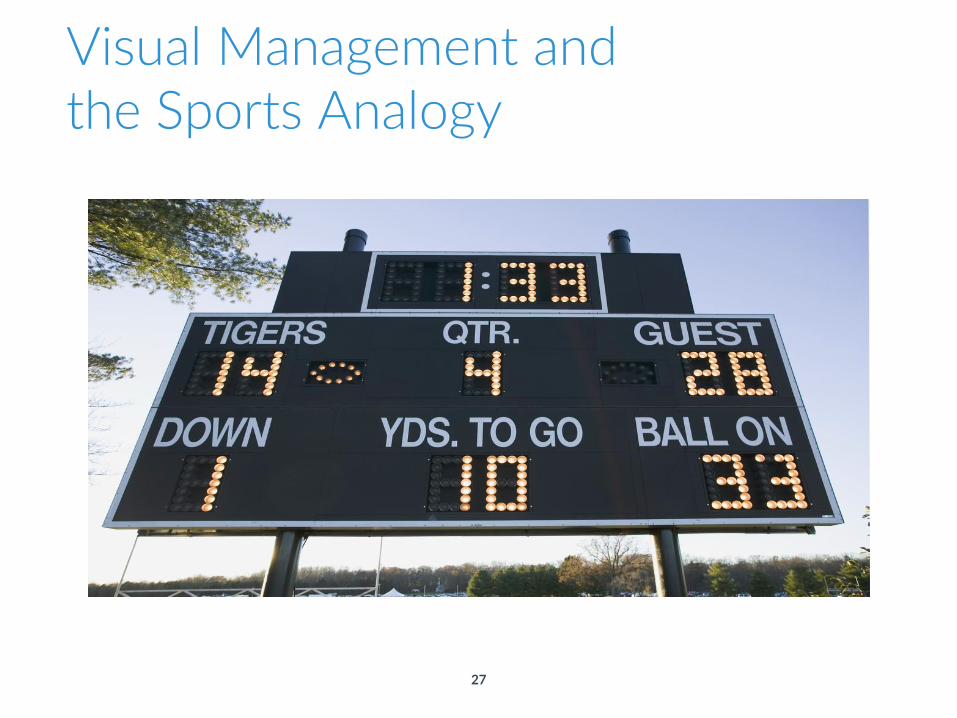
Visual Management and the Sports Analogy
28
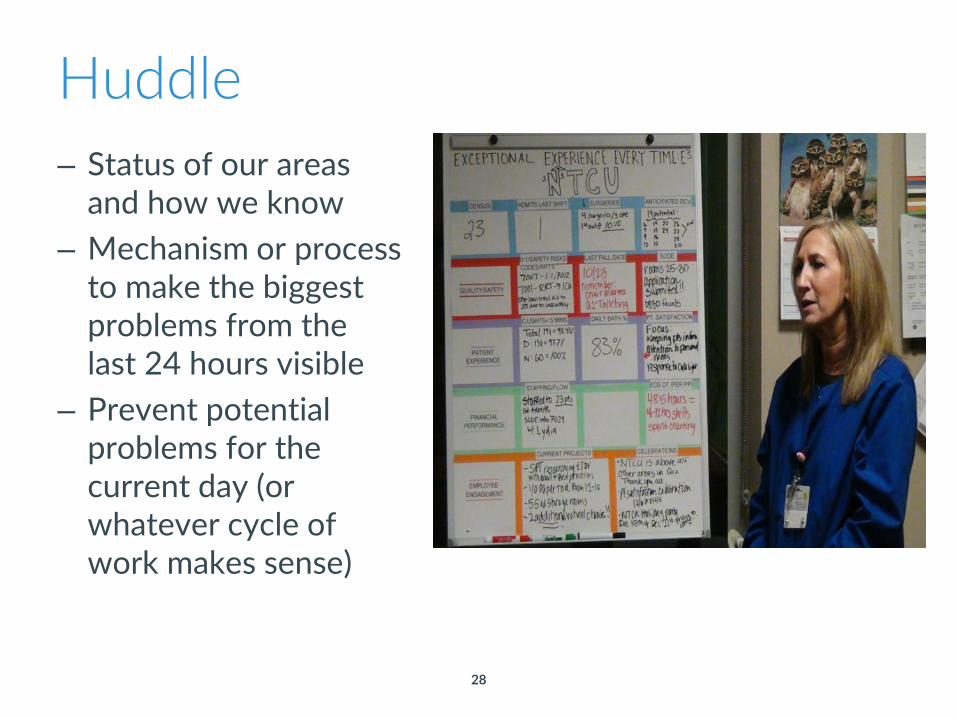
Huddle
– Status of our areas and how we know
– Mechanism or process to make the biggest problems from the last 24 hours visible
– Prevent potential problems for the current day (or whatever cycle of work makes sense)
29
How Does Kaizen Benefit SH HIM Department?
• 387 WQ 4sps
• 387 Process and Outcome Metric
• Q&E Fish Idea
• Savings from fish idea from metric tracker
• Overall HIM Department 2016 FY savings from Lean Activities
30
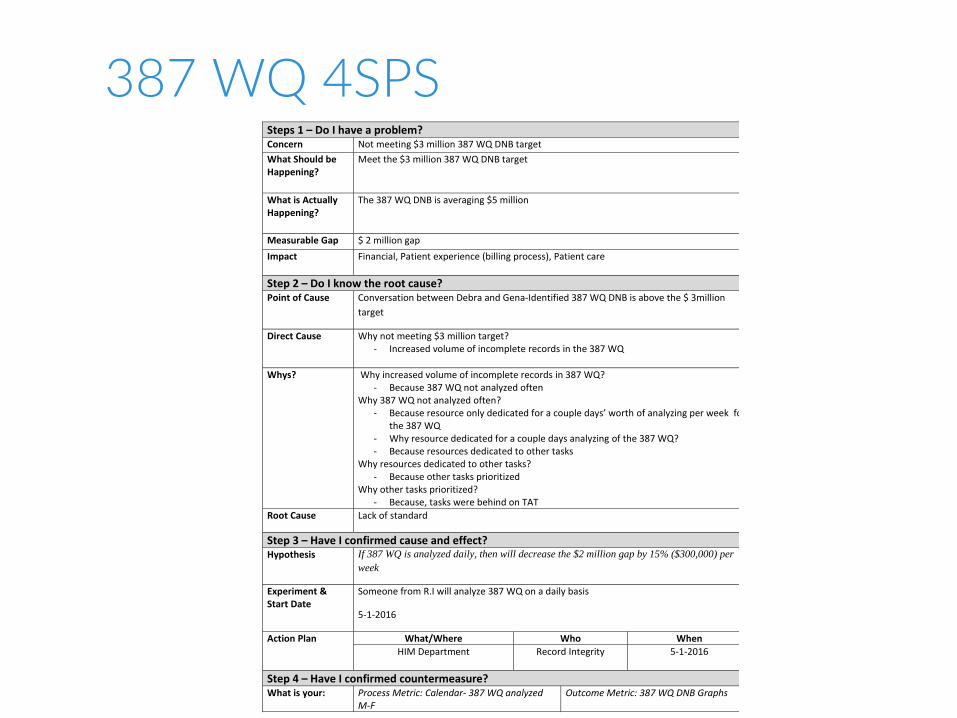
387 WQ 4SPS 387 WQ HIM Department
Steps 1 – Do I have a problem? Concern Not meeting $3 million 387 WQ DNB target
What Should be Happening?
Meet the $3 million 387 WQ DNB target
What is Actually Happening?
The 387 WQ DNB is averaging $5 million
Measurable Gap $ 2 million gap
Impact Financial, Patient experience (billing process), Patient care
Step 2 – Do I know the root cause? Point of Cause Conversation between Debra and Gena-Identified 387 WQ DNB is above the $ 3million
target
Direct Cause Why not meeting $3 million target? - Increased volume of incomplete records in the 387 WQ
Whys? Why increased volume of incomplete records in 387 WQ? - Because 387 WQ not analyzed often
Why 387 WQ not analyzed often? - Because resource only dedicated for a couple days’ worth of analyzing per week for
the 387 WQ - Why resource dedicated for a couple days analyzing of the 387 WQ? - Because resources dedicated to other tasks
Why resources dedicated to other tasks? - Because other tasks prioritized
Why other tasks prioritized? - Because, tasks were behind on TAT
Root Cause Lack of standard
Step 3 – Have I confirmed cause and effect? Hypothesis If 387 WQ is analyzed daily, then will decrease the $2 million gap by 15% ($300,000) per
week
Experiment & Start Date
Someone from R.I will analyze 387 WQ on a daily basis
5-1-2016
Action Plan What/Where Who When
HIM Department
Record Integrity 5-1-2016
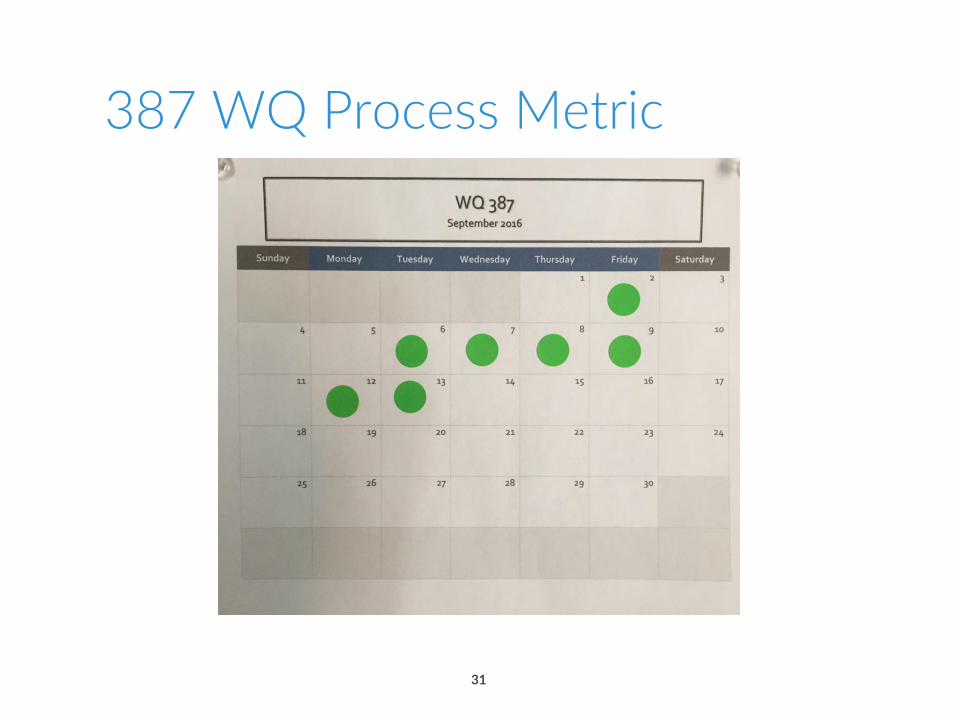
Step 4 – Have I confirmed countermeasure? What is your: Process Metric: Calendar- 387 WQ analyzed
M-F Outcome Metric: 387 WQ DNB Graphs
31
387 WQ Process Metric

32
4.14.4
4.8
3.6
4.8
6.1
5.25 5 5
5.8
6.7
4.3
3
6.1
5.2 5.25.5
5.2
4.8
5.6
5 5 55.3
44.2
3.9
3 3 3 3 3 3 3 3 3 3 3 3 3 3 3 3 3 3 3 3 3 3 3 3 3 3 3 3
0
1
2
3
4
5
6
7
8
$ M
illio
n
Axis Title
April 387 DNBAvg DNB for Month= $4.9 Million
Target =$3 Million
387 WQ Outcome Metric
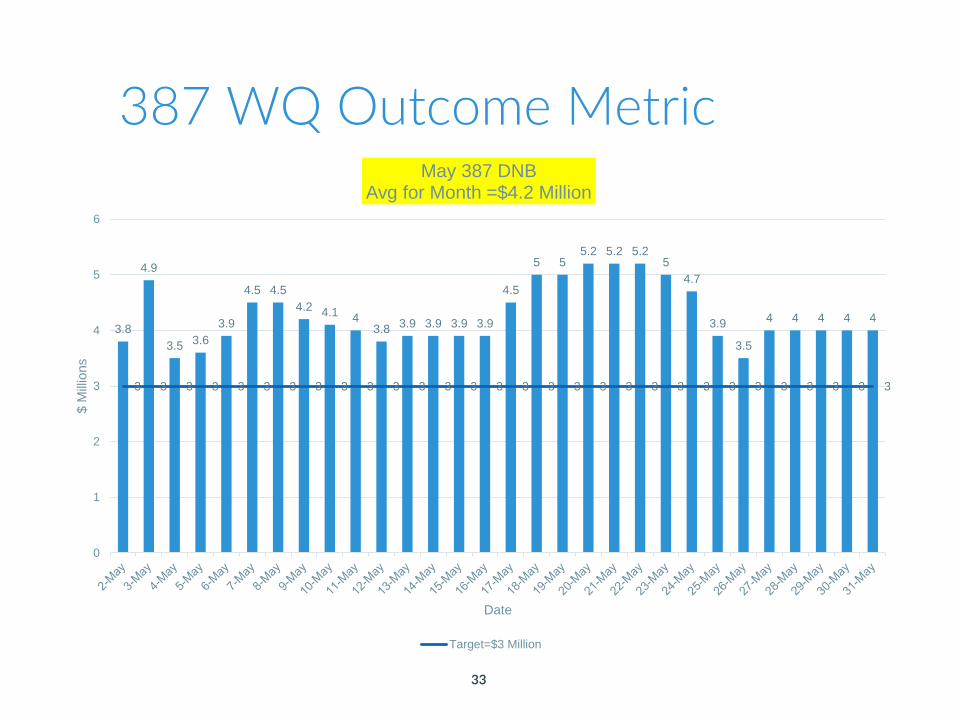
33
3.8
4.9
3.5 3.6
3.9
4.5 4.5
4.2 4.1 43.8 3.9 3.9 3.9 3.9
4.5
5 55.2 5.2 5.2
5
4.7
3.9
3.5
4 4 4 4 4
3 3 3 3 3 3 3 3 3 3 3 3 3 3 3 3 3 3 3 3 3 3 3 3 3 3 3 3 3 3
0
1
2
3
4
5
6
$ M
illio
ns
Date
May 387 DNBAvg for Month =$4.2 Million
Target=$3 Million
387 WQ Outcome Metric
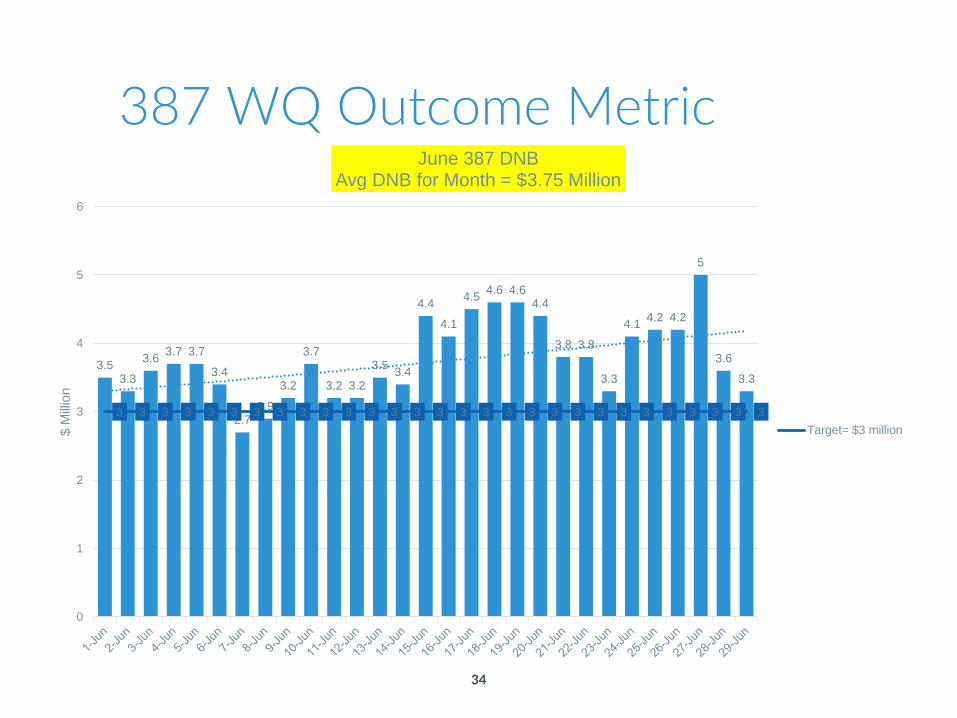
34
3.53.3
3.63.7 3.7
3.4
2.72.9
3.2
3.7
3.2 3.2
3.53.4
4.4
4.1
4.54.6 4.6
4.4
3.8 3.8
3.3
4.14.2 4.2
5
3.6
3.3
3 3 3 3 3 3 3 3 3 3 3 3 3 3 3 3 3 3 3 3 3 3 3 3 3 3 3 3 3
0
1
2
3
4
5
6
$ M
illio
n
June 387 DNB Avg DNB for Month = $3.75 Million
Target= $3 million
387 WQ Outcome Metric
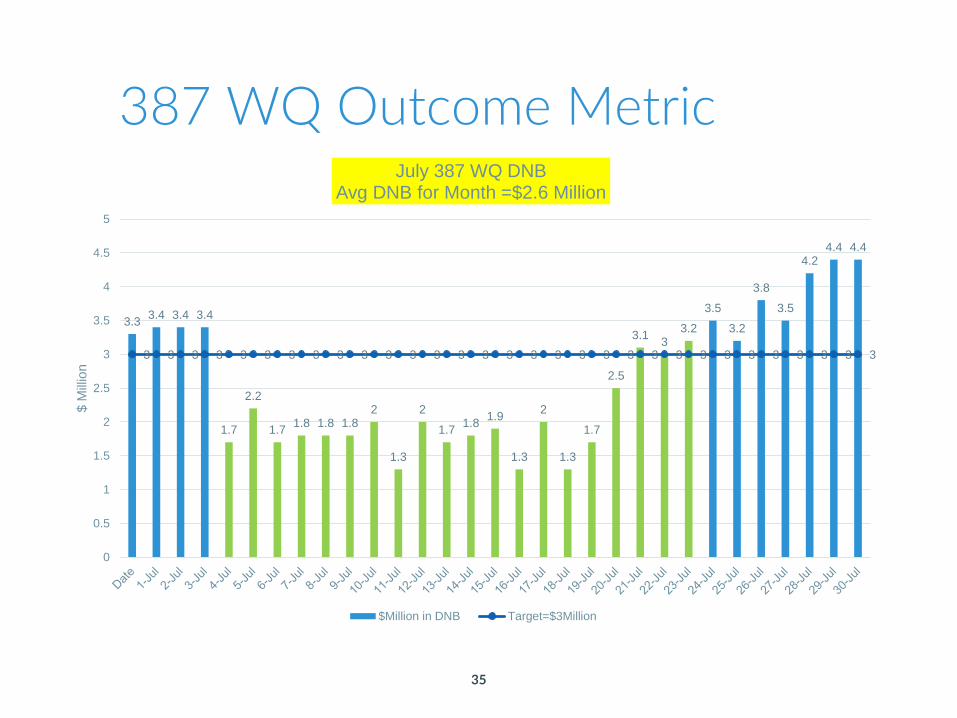
35
3.33.4 3.4 3.4
1.7
2.2
1.71.8 1.8 1.8
2
1.3
2
1.71.8
1.9
1.3
2
1.3
1.7
2.5
3.13
3.2
3.5
3.2
3.8
3.5
4.24.4 4.4
3 3 3 3 3 3 3 3 3 3 3 3 3 3 3 3 3 3 3 3 3 3 3 3 3 3 3 3 3 3 3
0
0.5
1
1.5
2
2.5
3
3.5
4
4.5
5
$ M
illio
n
July 387 WQ DNBAvg DNB for Month =$2.6 Million
$Million in DNB Target=$3Million
387 WQ Outcome Metric
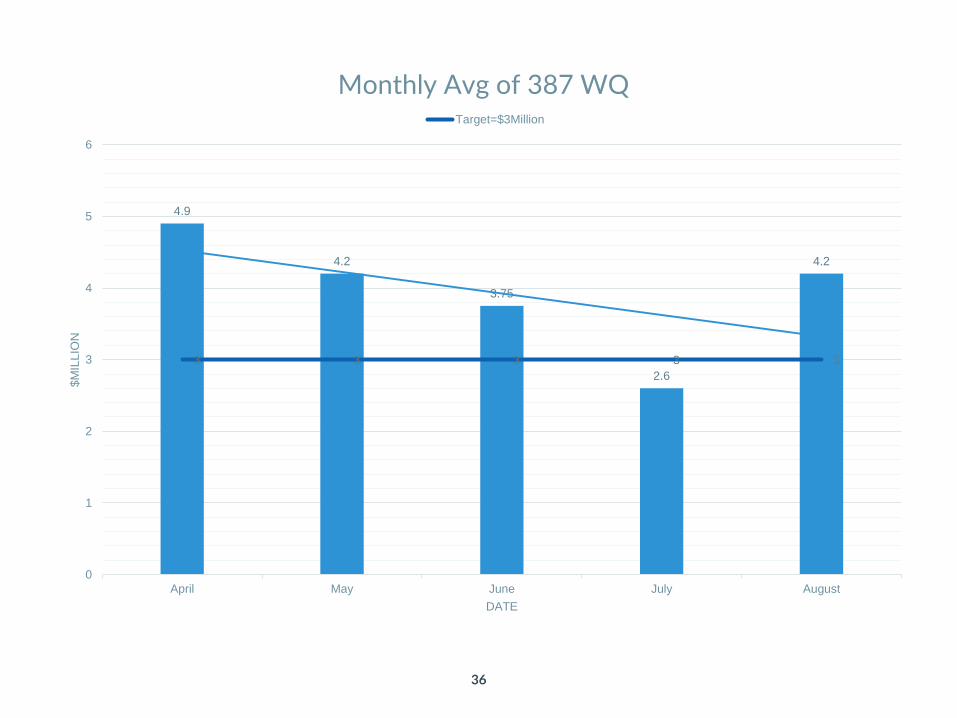
36
4.9
4.2
3.75
2.6
4.2
3 3 3 3 3
0
1
2
3
4
5
6
April May June July August
$M
ILL
ION
DATE
Monthly Avg of 387 WQ Target=$3Million

37
Date:
Owner:
Problem:
WSBH:
WAH:
Impact:
Hypothesis:
Problem:
WSBH:
WAH:
Impact:
Hypothesis:
G
A
P
G
A
P
:
:
Metric Tracker Results:
Metric Tracker
Results:
Q&E Fish Idea• Q&E ideas can be quick and simple
38
Date:
Owner:
Problem:
WSBH:
WAH:
Impact:
Hypothesis:
Problem:
WSBH:
WAH:
Impact:
Hypothesis:
G
A
P
G
A
P
:
:
Metric Tracker Results:
Metric Tracker
Results:
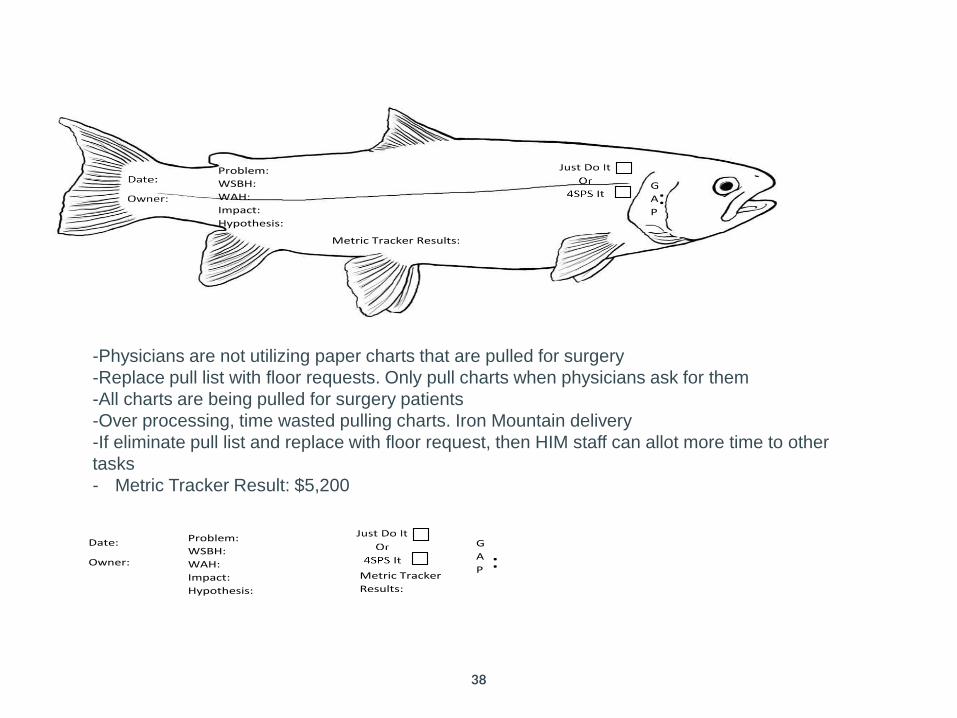
-Physicians are not utilizing paper charts that are pulled for surgery
-Replace pull list with floor requests. Only pull charts when physicians ask for them
-All charts are being pulled for surgery patients
-Over processing, time wasted pulling charts. Iron Mountain delivery
-If eliminate pull list and replace with floor request, then HIM staff can allot more time to other
tasks
- Metric Tracker Result: $5,200
39
Date:
Owner:
Problem:
WSBH:
WAH:
Impact:
Hypothesis:
Problem:
WSBH:
WAH:
Impact:
Hypothesis:
G
A
P
G
A
P
:
:
Metric Tracker Results:
Metric Tracker
Results:
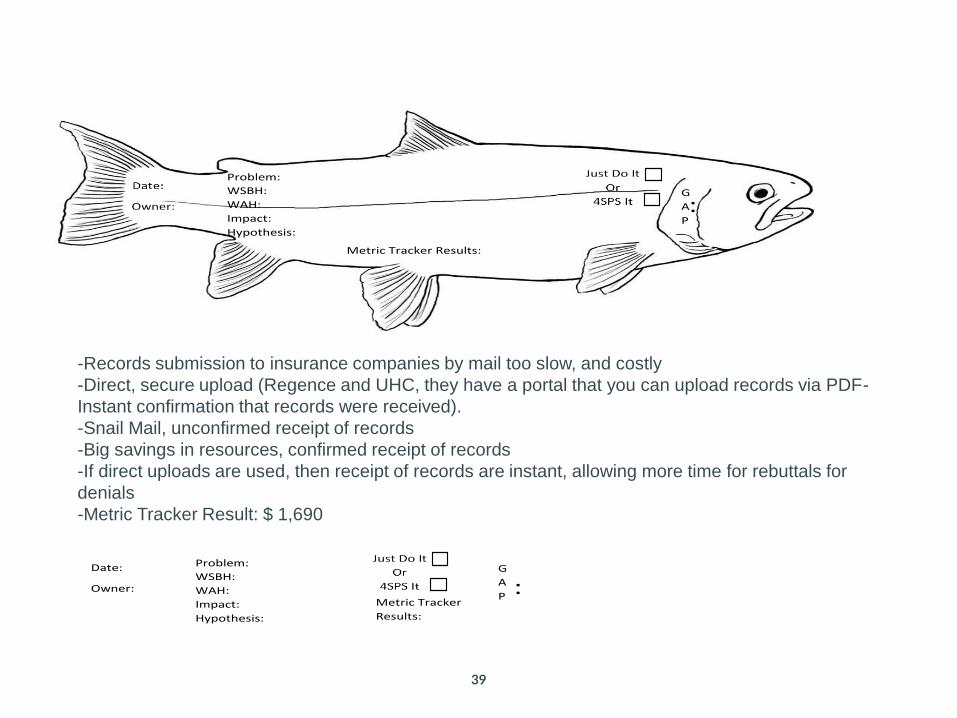
-Records submission to insurance companies by mail too slow, and costly
-Direct, secure upload (Regence and UHC, they have a portal that you can upload records via PDF-
Instant confirmation that records were received).
-Snail Mail, unconfirmed receipt of records
-Big savings in resources, confirmed receipt of records
-If direct uploads are used, then receipt of records are instant, allowing more time for rebuttals for
denials
-Metric Tracker Result: $ 1,690
40
Date:
Owner:
Problem:
WSBH:
WAH:
Impact:
Hypothesis:
Problem:
WSBH:
WAH:
Impact:
Hypothesis:
G
A
P
G
A
P
:
:
Metric Tracker Results:
Metric Tracker
Results:
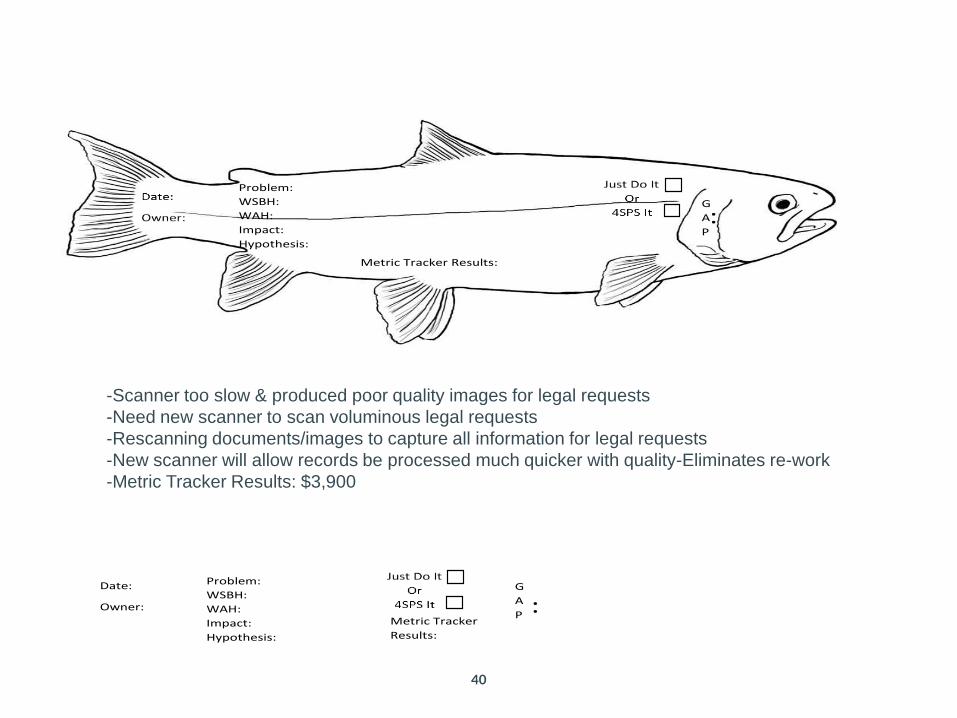
-Scanner too slow & produced poor quality images for legal requests
-Need new scanner to scan voluminous legal requests
-Rescanning documents/images to capture all information for legal requests
-New scanner will allow records be processed much quicker with quality-Eliminates re-work
-Metric Tracker Results: $3,900
41
Savings
• Savings from fish idea from metric tracker
• $10,790 (Total of the 3 examples shown)
• Over all HIM Department 2016 FY savings from Lean Activities
• $1,293,975
• Hourly wage & time used before lean activity and after activity to capture true savings
42
Lean in CodingEmphasis on engaging remote staff
43
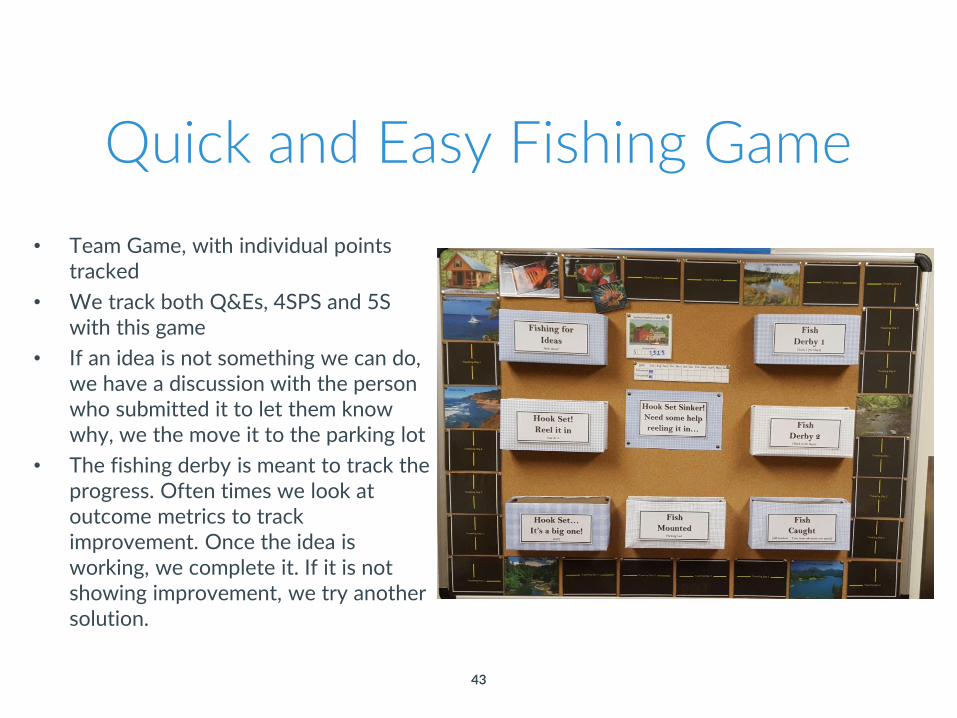
Quick and Easy Fishing Game
• Team Game, with individual points tracked
• We track both Q&Es, 4SPS and 5S with this game
• If an idea is not something we can do, we have a discussion with the person who submitted it to let them know why, we the move it to the parking lot
• The fishing derby is meant to track the progress. Often times we look at outcome metrics to track improvement. Once the idea is working, we complete it. If it is not showing improvement, we try another solution.
44
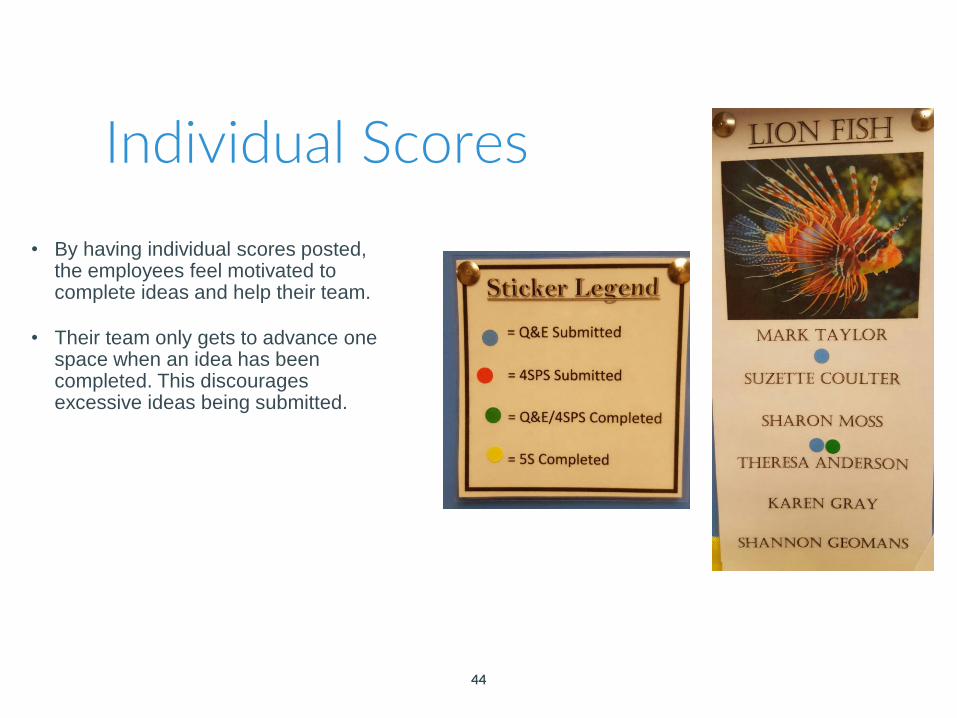
Individual Scores
• By having individual scores posted, the employees feel motivated to complete ideas and help their team.
• Their team only gets to advance one space when an idea has been completed. This discourages excessive ideas being submitted.
45
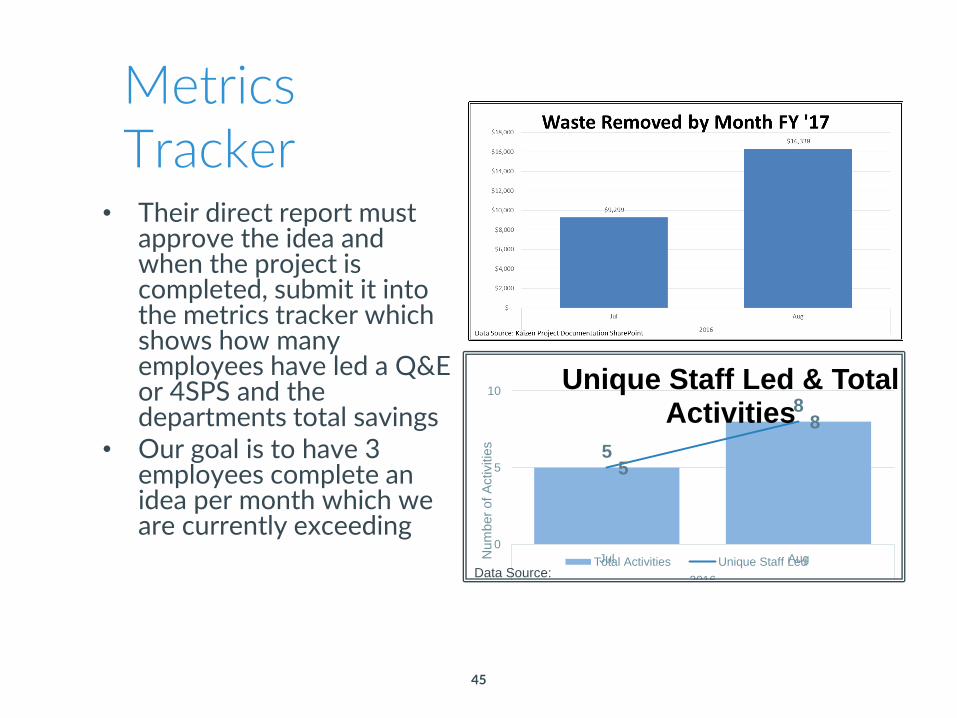
• Their direct report must approve the idea and when the project is completed, submit it into the metrics tracker which shows how many employees have led a Q&E or 4SPS and the departments total savings
• Our goal is to have 3 employees complete an idea per month which we are currently exceeding
Metrics Tracker
5
8
5
8
0
5
10
Jul Aug
2016
Num
ber
of
Activitie
s
Unique Staff Led & Total Activities
Total Activities Unique Staff LedData Source:
Kaizen Project
46
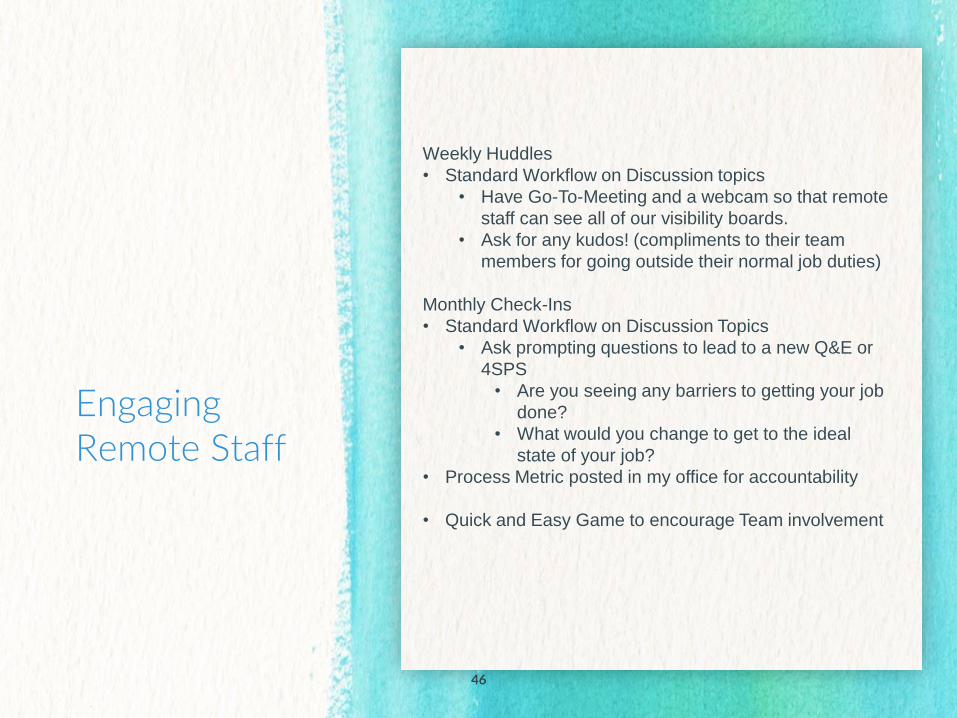
Engaging Remote Staff
Weekly Huddles
• Standard Workflow on Discussion topics
• Have Go-To-Meeting and a webcam so that remote
staff can see all of our visibility boards.
• Ask for any kudos! (compliments to their team
members for going outside their normal job duties)
Monthly Check-Ins
• Standard Workflow on Discussion Topics
• Ask prompting questions to lead to a new Q&E or
4SPS
• Are you seeing any barriers to getting your job
done?
• What would you change to get to the ideal
state of your job?
• Process Metric posted in my office for accountability
• Quick and Easy Game to encourage Team involvement
47
Standard Workflows in Coding to Identify Gaps
48
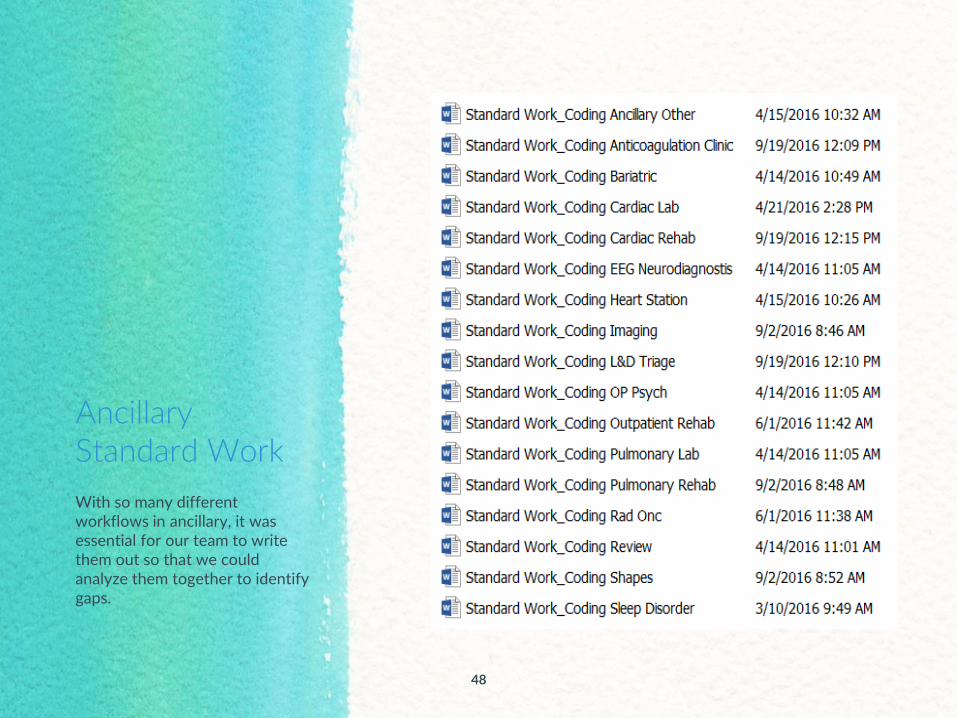
Ancillary Standard Work
With so many different workflows in ancillary, it was essential for our team to write them out so that we could analyze them together to identify gaps.
49
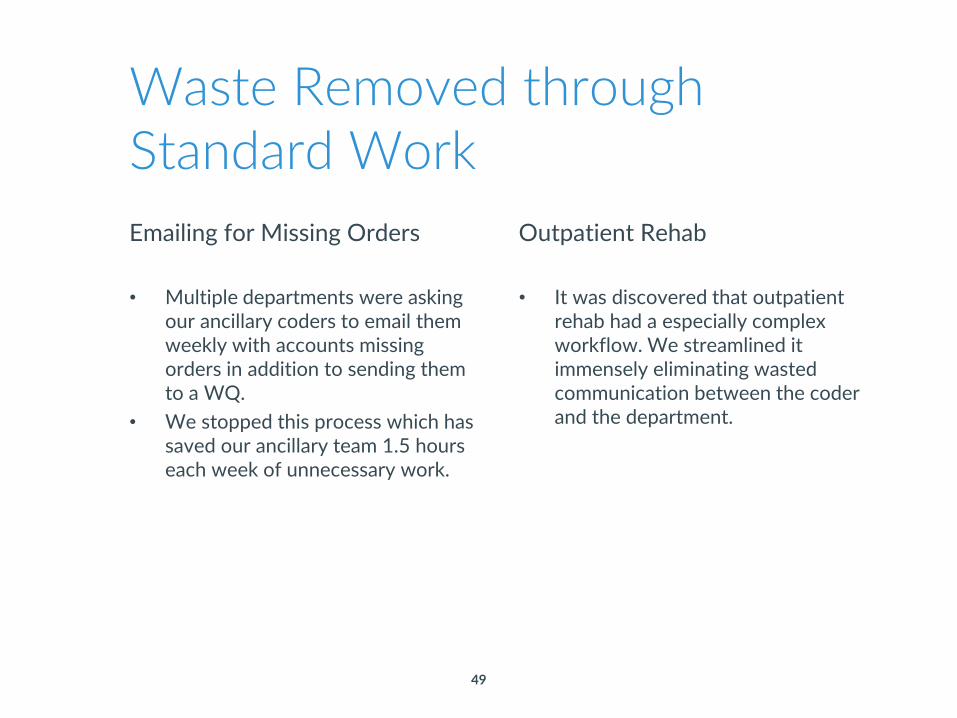
Waste Removed through Standard Work
Emailing for Missing Orders
• Multiple departments were asking our ancillary coders to email them weekly with accounts missing orders in addition to sending them to a WQ.
• We stopped this process which has saved our ancillary team 1.5 hours each week of unnecessary work.
Outpatient Rehab
• It was discovered that outpatient rehab had a especially complex workflow. We streamlined it immensely eliminating wasted communication between the coder and the department.
50
Departmental A3 Financial Performance Focus: Discharge Dispositions
51
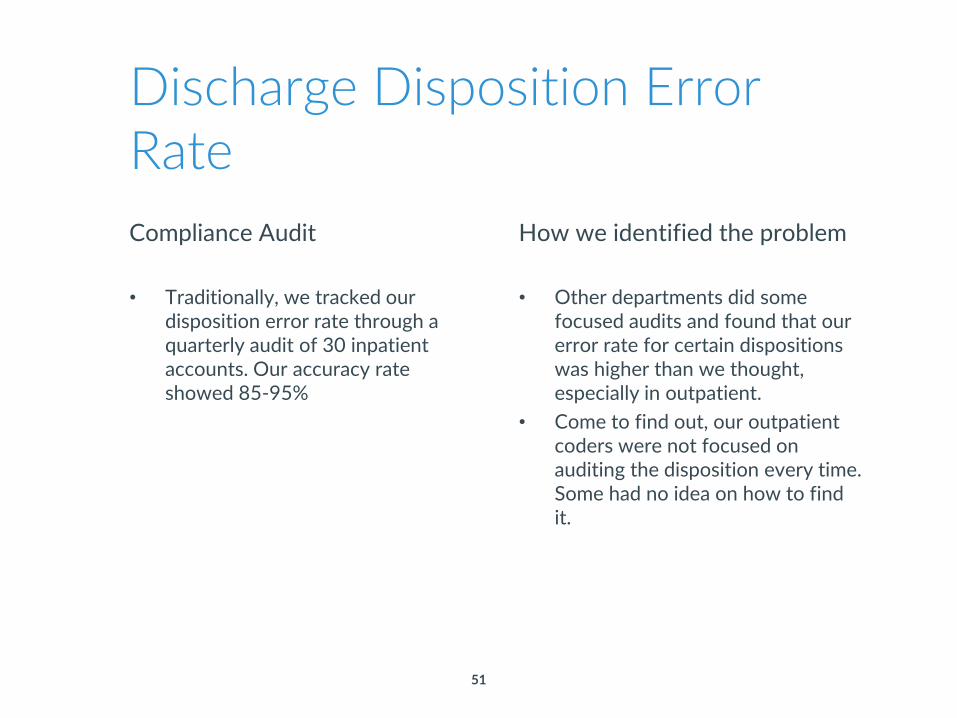
Discharge Disposition Error Rate
Compliance Audit
• Traditionally, we tracked our disposition error rate through a quarterly audit of 30 inpatient accounts. Our accuracy rate showed 85-95%
How we identified the problem
• Other departments did some focused audits and found that our error rate for certain dispositions was higher than we thought, especially in outpatient.
• Come to find out, our outpatient coders were not focused on auditing the disposition every time. Some had no idea on how to find it.
52
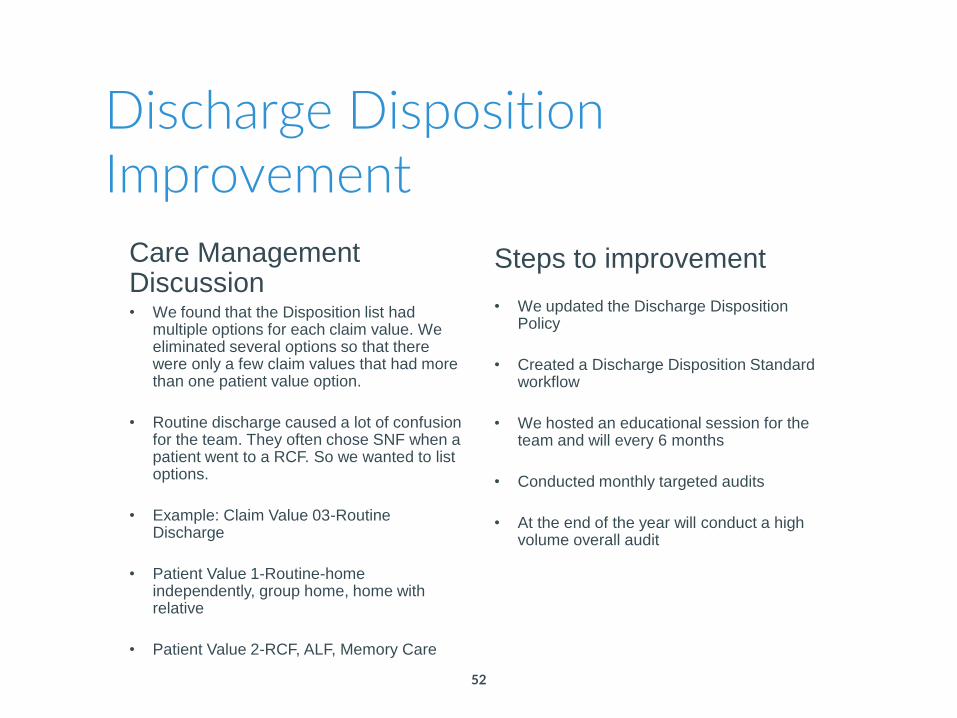
Discharge Disposition Improvement
Care Management Discussion• We found that the Disposition list had
multiple options for each claim value. We eliminated several options so that there were only a few claim values that had more than one patient value option.
• Routine discharge caused a lot of confusion for the team. They often chose SNF when a patient went to a RCF. So we wanted to list options.
• Example: Claim Value 03-Routine Discharge
• Patient Value 1-Routine-home independently, group home, home with relative
• Patient Value 2-RCF, ALF, Memory Care
Steps to improvement
• We updated the Discharge Disposition Policy
• Created a Discharge Disposition Standard workflow
• We hosted an educational session for the team and will every 6 months
• Conducted monthly targeted audits
• At the end of the year will conduct a high volume overall audit
53
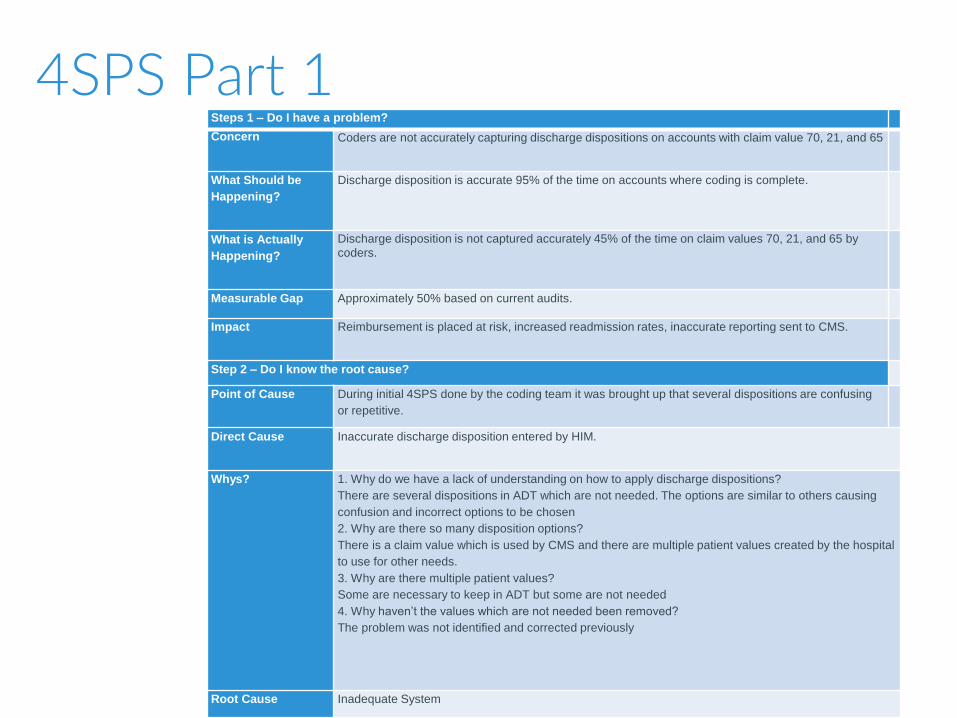
4SPS Part 1Steps 1 – Do I have a problem?
Concern Coders are not accurately capturing discharge dispositions on accounts with claim value 70, 21, and 65
What Should be
Happening?
Discharge disposition is accurate 95% of the time on accounts where coding is complete.
What is Actually
Happening?
Discharge disposition is not captured accurately 45% of the time on claim values 70, 21, and 65 by
coders.
Measurable Gap Approximately 50% based on current audits.
Impact Reimbursement is placed at risk, increased readmission rates, inaccurate reporting sent to CMS.
Step 2 – Do I know the root cause?
Point of Cause During initial 4SPS done by the coding team it was brought up that several dispositions are confusing
or repetitive.
Direct Cause Inaccurate discharge disposition entered by HIM.
Whys? 1. Why do we have a lack of understanding on how to apply discharge dispositions?
There are several dispositions in ADT which are not needed. The options are similar to others causing
confusion and incorrect options to be chosen
2. Why are there so many disposition options?
There is a claim value which is used by CMS and there are multiple patient values created by the hospital
to use for other needs.
3. Why are there multiple patient values?
Some are necessary to keep in ADT but some are not needed
4. Why haven’t the values which are not needed been removed?
The problem was not identified and corrected previously
Root Cause Inadequate System
54
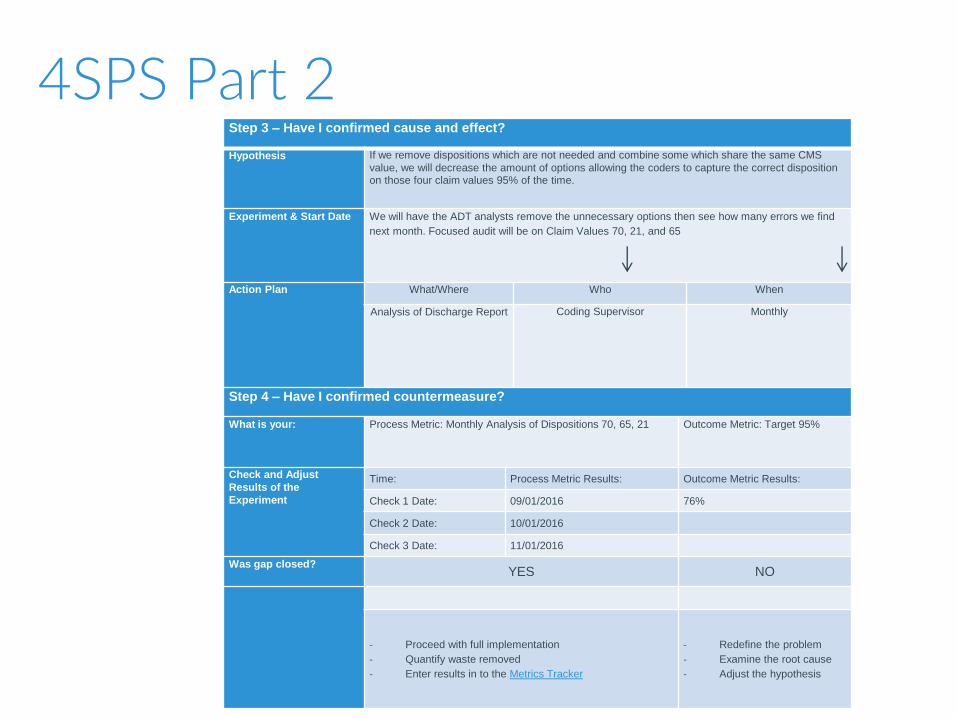
4SPS Part 2Step 3 – Have I confirmed cause and effect?
Hypothesis If we remove dispositions which are not needed and combine some which share the same CMS
value, we will decrease the amount of options allowing the coders to capture the correct disposition on those four claim values 95% of the time.
Experiment & Start Date We will have the ADT analysts remove the unnecessary options then see how many errors we find
next month. Focused audit will be on Claim Values 70, 21, and 65
Action Plan What/Where Who When
Analysis of Discharge Report Coding Supervisor Monthly
Step 4 – Have I confirmed countermeasure?
What is your: Process Metric: Monthly Analysis of Dispositions 70, 65, 21 Outcome Metric: Target 95%
Check and Adjust
Results of the
Experiment
Time: Process Metric Results: Outcome Metric Results:
Check 1 Date: 09/01/2016 76%
Check 2 Date: 10/01/2016
Check 3 Date: 11/01/2016
Was gap closed?YES NO
- Proceed with full implementation
- Quantify waste removed
- Enter results in to the Metrics Tracker
- Redefine the problem
- Examine the root cause
- Adjust the hypothesis
55
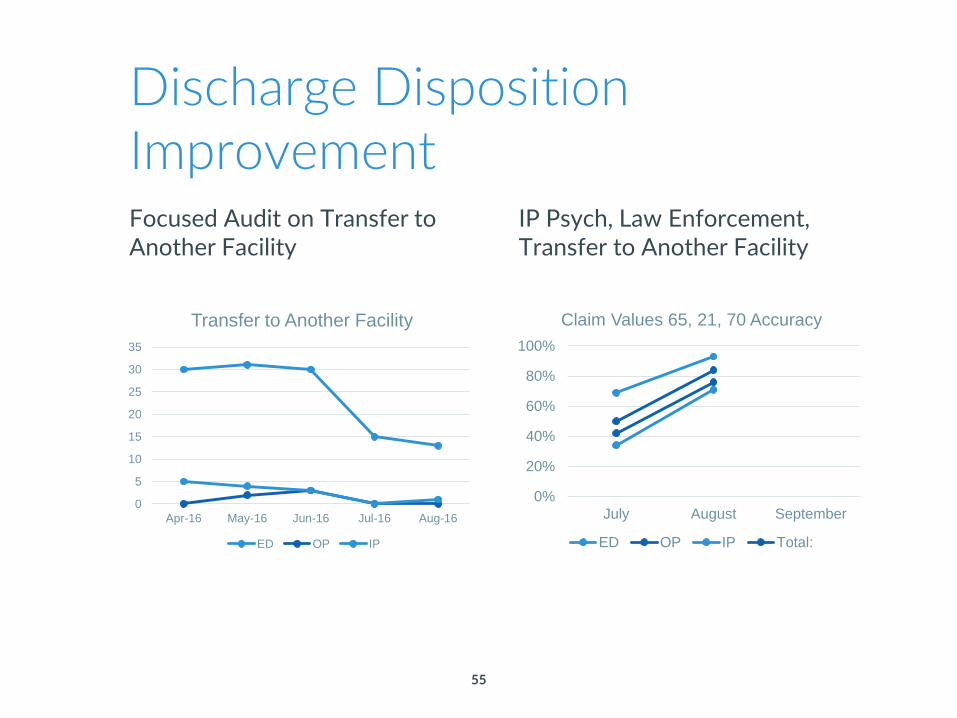
Discharge Disposition ImprovementFocused Audit on Transfer to Another Facility
IP Psych, Law Enforcement, Transfer to Another Facility
0
5
10
15
20
25
30
35
Apr-16 May-16 Jun-16 Jul-16 Aug-16
Transfer to Another Facility
ED OP IP
0%
20%
40%
60%
80%
100%
July August September
Claim Values 65, 21, 70 Accuracy
ED OP IP Total:

56
Questions?