Our industry 2016 - Syngenta/media/Files/S/Syngenta/our-industry... · Food Feed Fuel 3 2 1 0...
96
Our industry 2016
Transcript of Our industry 2016 - Syngenta/media/Files/S/Syngenta/our-industry... · Food Feed Fuel 3 2 1 0...

Our industry 2016
Our
indu
stry
201
6

Food
Feed
Fuel
3
2
1
0
+1.2-1.6%CAGR
20272015200019901980
We need to grow more with less
Our global challenge
Agricultural production will need to increase substantially with limited natural resources■■ The UN estimates that by 2030 the world will
need 30 % more fresh water and 50 % more energy; by 2050 we will need 70 % more food
Global grain demand
Population growth and greater economic prosperity in emerging markets will drive future demand for food and feed production■■ Population is growing: by 2050, global
population will grow to greater than nine billion, more than two billion additional people compared to today
■■ Diets are changing: demand for meat and dairy is growing, especially in emerging markets
Limited natural resources
Agriculture must meet rising demand for food, feed and fuel while protecting the planet’s natural resources■■ Expanding farmland increases environmental sustainability challenges■■ Urbanization continues: by 2050, three billion more people are expected to be living in cities,
with urban sprawl further reducing arable land and putting biodiversity resources under stress■■ Water scarcity: agriculture uses 70 % of the world’s fresh water
Global demand of major grains*bn tons, CAGR (% per annum)
* Corn, soybean, wheat and rice
Sources: USDA; FAPRI; Syngenta analysis
IntroductionSyngenta at a glance

Contents01 Global challenges
Global agriculture: growing more from less 4Demand 5Environmental stress 10
02 Sustainable agricultural systemsSustainable intensification of agriculture 19Improving productivity 20Reducing agriculture’s environmental footprint 24Building rural prosperity 25
03 Regions in focusIntroduction 29Asia-Pacific 30Europe, Africa and Middle East 34Latin America 40North America 44
04 Crops in focusIntroduction 49Corn 52Cereals 54Soybean 56Rice 58Vegetables 59Diverse field crops 60Sugar cane 62Specialty crops 63
05 Technology in agricultureEvolution of the industry 65The role of crop protection 66Crop protection: market overview 67Crop protection products 68Beyond traditional crop protection 69R&D in crop protection 70Seeds: market overview 71Plant breeding history 72Benefits of hybridization 73Biotechnology 75Research, development and regulatory environment for biotech crops 77Innovation and intellectual property 79
06 Lawn and GardenMarket overview 82Flowers, home and garden solutions 82Professional market and products 82
07 Syngenta key financial information and ratiosSyngenta 5-year financial summary 85Regional 5-year financial summary 865-year sales summary 872015 sales by crop 88Balance sheet 89Cash flow 90Significant acquisitions 91Reference sources 92Cautionary statement 93
1

13.41
15.1314.69
151413
11.0
11.010.0
151413
17.78
19.4219.30
151413
20.7
19.319.7
151413
2.78
2.932.90
151413
0.80
1.080.39
151413
0.65
0.690.69
151413
1.84
2.031.94
151413
3.88
4.554.22
151413
3.63
4.283.99
151413
3.41
3.583.85
151413
Syngenta at a glance
Sales
US$ 13.4bn -11%EBITDA
US$ 2.8bn -5%EBITDA margin
20.7% +140bpsEarnings per share2
US$ 17.78 -8%Free cash flow
US$ 0.8bn -27%Dividend per share, 2015 proposed
CHF 11.00
Europe, Africa and Middle East
US$ 3.9bn -15%North America
US$ 3.4bn -5%Latin America
US$ 3.6bn -15%Asia Pacific
US$ 1.8bn -10%
US$ 0.6bn –7%1 For further explanation of financial information, see Section 7, Syngenta key financial information and ratios2 Fully diluted excluding restructuring and impairment
Regional sales 20151
Lawn and Garden sales 20151
Financial highlights 20151
2

Global challenges
01

Asia and the Paci�c 505Sub-Saharan Africa 214Latin America and the Caribbean 37Near East and North Africa 33Developed countries 15
millions of people
~805millionpeople
Global agriculture: growing more from less
Our global challenge: increase agricultural productivity by at least 70% in 40 years with limited natural resources
The ability of our planet to sustain life is fragile and under increasing stress. Despite significant growth in food production over the past 50 years, 805 million people in the world still suffer from hunger and even more are malnourished. By 2050, the global food requirement will increase significantly, driven by a population increase to more than nine billion and a demand for improved diets, particularly in emerging markets.
Agriculture is receiving increasing attention worldwide as government and non-government authorities recognize a need to accelerate productivity in order to ensure food security and improved nutrition to a growing population. Farmers will need to produce around 1.4 % more grain every year, representing an increase of approximately 30% by 2030 and around 70% by 2050.
At the same time, responding to changes in climate, using the limited natural resources in a sustainable way and respecting biodiversity pose additional challenges to achieving increased farm productivity at the required speed.
Agriculture holds the key role to tackling these challenges and achieving food security today and in the future. The World Food Summit of 1996 explained that food security exists when “all people, at all times have access to sufficient, safe, nutritious food to maintain a healthy and active life”. But reaching this goal will not be easy.
Undernourished population in 2014
Source: FAO
4 Global challenges01

Biofuels 5%Feed 37%Food 58%
Biofuels ~10%Feed ~60%Food ~30%
Food
Feed
Fuel
3
2
1
0
+1.2-1.6%CAGR
20272015200019901980
Population growth
Economic growth
TotalBiofuels growth
1964 to 1980
1980 to 1997
1997 to 2014
<1.7%
<1.4%
1.1%
>1.9%
~0.7%
~0.0%
~0.0%
~0.4%
~3.6%
~2.1%
>0.5% ~1.9%
Demand
Since 1980, demand for field crops has increased almost 90%, from 1.2 billion to almost 2.7 billion tons, with the increased demand for food and feed the key driver. In addition, biofuels have increasingly played a role to meet our energy needs in ways that mitigate the growing problem of green house emissions.
Grain demand is expected to increase ~30% by 2025 – an additional 600 million tons. This demand will not only be driven by population growth but also by greater economic prosperity in emerging markets, as well as biofuels expansion. Around 30% of this additional demand will come from changes in consumer diets as opposed to population growth.
Demand for grain has increased almost 90% since 1980 and will continue to increase at an average rate of around 1.4% per year
Global demand of major grains*bn tons, CAGR (% per annum)
2014 Use of major grains*
Demand drivers for the next 10 years (to 2025)
* Corn, soybean, wheat and rice
Sources: USDA; FAPRI; Syngenta analysis
Sources: USDA; Syngenta * Corn, soybean, wheat and rice
Source: Syngenta analysis
* Corn, soybean, wheat and rice
Source: USDA
5Global challenges 01

0.0
0.5
1.0
1.5
2.0
2.5
0
1
2
3
4
5
6
7
8
2020E201020001990198019701960
7478787989
7573 77868276
5753
Year-on-year absolute change (in millions)
1.0%CAGR
0
1
2
3
4
5
6
7
8
9
202520152005200019901970 19801960 2020 20302010199519851965 197519551950
World total population World urban population World rural population
Demand
World population is growing at a rate of around 80 million additional people per year – a trend that is forecast to continue until 2020
Today 52% of the population in China live in cities, compared with ~17% in 1961
The global population is expected to rise from around seven billion today to more than nine billion by 2050. Most of this population growth will occur in developing countries, where the populations are projected to reach around eight billion in 2050, an increase of almost 40%. In contrast, the population of the more developed regions is expected to increase at a much slower rate, to around 1.3 billion.
For the first time in history, more people worldwide are living in cities than in the countryside. By 2050, around three billion more people are expected to be living in urban areas. In China 52% of the population now live in cities. Given that their spend per capita on food is 270% higher than that of their rural counterparts, the pressure on achieving food security becomes increasingly challenging.
Source: FAO, CAGR 2012–2020
Source: United Nations Department of Economic and Social Affairs
World populationbillions of people
Year-on-year growth%
Urban and rural population of the worldin billions
6 Global challenges01

0
50
100
150
200
250
300
350
400
20142006199619861976
Production Per capita consumption Population
BioethanolBiodiesel
US
EU28
BrazilRest ofworld
1.30
14.0
0.7
6.0
2.51.1
~1.7~1.8
Demand
By 2025 global meat demand to rise 40%; an increase of around 100 million tonsSource: FAO
In parallel, a greater number of people will experience increased wealth and higher purchasing power, and as a result will increase consumption of processed food, meat, dairy and fish. A Goldman Sachs study estimates that the world’s middle class – people earning between US$ 6,000 and US$ 30,000 a year – will expand by two billion people by 2030. In China alone, the McKinsey Global Institute has forecasted that the middle class will grow to be 76% of the population by 2025. That means not only more people to feed, but also feeding each person with a higher calorie and protein diet thereby impacting significantly demand for feed.
Since 2005, global meat demand is expected to increase by 40% by 2025. The type of meat consumed affects the amount of grain demand: one kilogram of beef requires seven kilograms of grain, whereas pork requires four kilograms and poultry two kilograms.
Global meat consumptionIndex 1971 = 100
Source: USDA
Global energy demands expected to increase by ~40% by 2030
Biofuels represent around 5% of global road transport fuels
Since 2010 global energy demands are expected to increase by approximately 40% by 2030 and energy from biofuels produced from plants is increasingly playing a more important role as an alternative.
2014 biofuel production estimate: 29 billion gallonsbillions of gallons
Sources: US Energy Information Administration (EIA)(1 gallon = 3,8 litres)
7Global challenges 01
0
5
10
15
2015E200920072005200320011999 201020082006200420022000
Demand
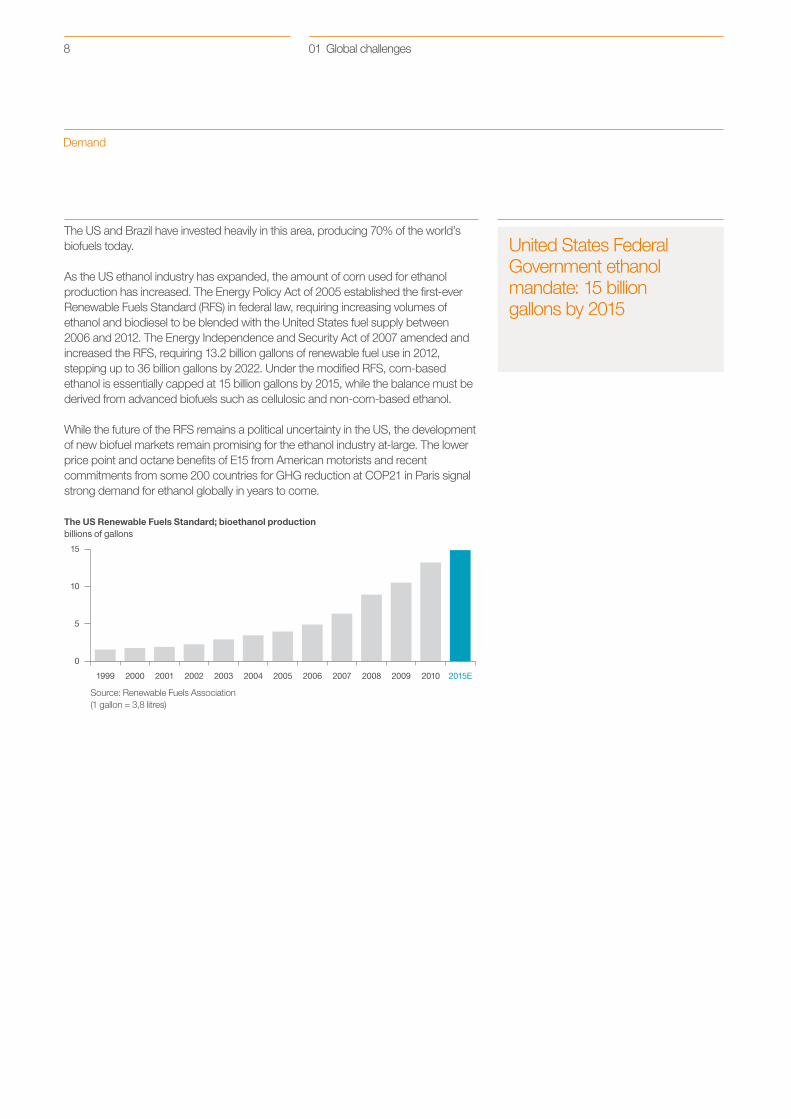
United States Federal Government ethanol mandate: 15 billion gallons by 2015
The US and Brazil have invested heavily in this area, producing 70% of the world’s biofuels today.
As the US ethanol industry has expanded, the amount of corn used for ethanol production has increased. The Energy Policy Act of 2005 established the first-ever Renewable Fuels Standard (RFS) in federal law, requiring increasing volumes of ethanol and biodiesel to be blended with the United States fuel supply between 2006 and 2012. The Energy Independence and Security Act of 2007 amended and increased the RFS, requiring 13.2 billion gallons of renewable fuel use in 2012, stepping up to 36 billion gallons by 2022. Under the modified RFS, corn-based ethanol is essentially capped at 15 billion gallons by 2015, while the balance must be derived from advanced biofuels such as cellulosic and non-corn-based ethanol.
While the future of the RFS remains a political uncertainty in the US, the development of new biofuel markets remain promising for the ethanol industry at-large. The lower price point and octane benefits of E15 from American motorists and recent commitments from some 200 countries for GHG reduction at COP21 in Paris signal strong demand for ethanol globally in years to come.
Source: Renewable Fuels Association(1 gallon = 3,8 litres)
The US Renewable Fuels Standard; bioethanol production billions of gallons
8 Global challenges01

100
80
40
10 10 10
45
85
110
128
150
180
Oil based gasoline Palm Brazil sugar cane EU wheatUS corn US soybeanMalaysia palm EU oilseed rape
Corn ethanol CelluloseOilseed rape Sugar cane
CO2 balance%
US$ 100 per barreloil price
Crude oil equivalentUS$ per barrel
Demand
CO2 output from sugarcane bioethanol is 90% lower than oil-based gasoline
One ton of sugar cane produces 80 liters of ethanol compared to 38 liters from one ton of corn
Brazil mandatory biofuels blend rate planned to return to 25% as sugar cane production shows signs of recovery
Since December 2011 the tax credit on ethanol production (46 cents/gallon) as well as US import tariffs on foreign bioethanol (54 cents/gallon) have been discontinued. However the US ethanol production and demand have remained resilient. While the figures in the previous graph are correct at time of publication, the current overall budget discussions in the United States may result in changes to the RFS commitments and requirements.
In Brazil, ethanol from sugar cane produces ~35% of the world’s bioethanol and has replaced ~35% of the gasoline used in light vehicles in the country. Sugar cane ethanol represents a low carbon and cost efficient fuel option in comparison to many other biofuels.
The Brazilian government continues to strongly support the bioethanol industry and has returned to the mandatory blend of 25% in May 2013 (after two consecutive years of poor sugar cane yields the mandate was temporarily reduced to 20%). Around 60% of the country’s automobile fleet is composed of flex-fuel cars.
The EU Renewable Energy Directive in 2009 established a target of a minimum of 10% renewables in transport for 2020 and requested national action plans for each member state to outline a path for meeting the target. More recently, an increasing public debate on competition between food and fuel, aggravated by high crop prices, triggered the European Commission to submit a draft biofuels policy limiting food-crop based biofuels to 5% of EU transport fuel consumption. The draft still needs to be approved by the EU governments.
Sugar cane: low carbon and cost-efficient fuel option
Sources: Farrell et aI, Science January 2006; GTZ; Syngenta
9Global challenges 01

13.0
4.0
4.1
4.9
4.9
0.3
3.0
3.3
0.14
1.2
0.3Land Agricultural Agricultural
Total planted area ~1.6 billion ha
Major crops
Permanentmeadows
Permanentcrops
Unde�nedForest Other
Potential areafor agriculturalexpansion
Eastern Europe 13%Africa 18%Western Europe, Middle East 6%China 8%India 11%Rest of Asia Paci�c 20%United States of America 10%Rest of North America 5%Brazil 5%Rest of LATAM 4%
~1.6 billionhectares
Europe, Africa and the Mid
dle E
ast
Nor
th A
mer
ica
AmericaLatin
Asia-Paci�c
Environmental stress
2014 crop area: approximately 1.6 billion hectares globally; 12% of land surface
As demand for increased quantity and quality of crops grows, agriculture must evolve in order to meet these demands in a sustainable way. Changes in climate will further stress the availability of water, land, and biodiversity necessary for productive agriculture.
Limited land for agricultureWithin the 13 billion hectares of total land, only 1.6 billion is under farmland production; 36% of that land is in Europe, the Middle East and Africa, 39% in Asia Pacific, 15% in North America and the remaining 10% in Latin America.
2014 crop areas
Sources: FAO; Syngenta estimates
Sources: FAO; World Bank; WWF; Syngenta analysis
Global land use and agricultural landbillion hectares
10 Global challenges01

0%
1%
2%
3%
4%
201520102000199019801970
100
120
140
160
180
200
220
240
260
280
300
2015201020001990198019701960
Area Yield
Environmental stress
In the 1980s one hectare of arable land produced 2.3 tons of grain* annually; today it produces 3.6 tons* Corn, soybean, wheat and rice
Productivity levels are steadily increasing, average grain yields per hectare almost doubling in the past 40 years
Yield improvement slowing down in major crops
In the last 50 years, there has been only a gradual expansion in agricultural areas because yield has increased at a much faster pace as farmers have adopted more technology, keeping pace with the rising demand for grain.
Until now demand has been met primarily through yield improvement. However, the improvement rate of yields in the major grains has been slowing down and will not be sufficient to fulfill increasing demand.
Rolling 10 year average growth in crop yield (corn, soybean, rice, wheat)%
Yield and acreage trend (corn, soybean, wheat, rice)Index: 1960 = 100)
Source: USDA
Source: USDA
11Global challenges 01

millions of hectares
100% Total land area 850
7% Farmed land ~60
25% Cattle raising ~210
49% Amazon & Atlantic forest, rivers 420
9% Cities, roads, infrastructure 75
~10% Potential additional area for cultivation 70– 85
2.3
3.3
4.5
5.6
3.0 billion 4.4 billion 6.0 billion 7.5 billion
20201960 1980 2000
Environmental stress
In 2020 one hectare will be required to feed more than five people compared to 1960 when it only had to feed two people
To produce the same amount of food today with yield levels from 50 years ago would require additional land equivalent in size to the USA
Agriculture must meet rising demand for food, feed and fuel without stressing natural habitats
To meet future global grain demand, the FAO estimates suggest that ~80% of crop production growth by 2050 is expected to come from higher yields, but land available for farming will also have to expand by approximately 120 million hectares in developing countries, mainly Sub-Saharan Africa and Latin America. These 120 million hectares should come primarily from a change in land use, for example pastures to arable land which will require significant investment, knowledge transfer and education. However, the area suitable for agriculture is only available in limited geographies.
Brazil represents about 60% of this opportunity, with approximately 70–85 million hectares that could be brought into production in the future without impacting natural ecosystems such as the rainforest.
The challenge going forward is to meet demand without stressing natural resources.
Number of people fed per hectare of planted land
Sources: FAO; WWF; Syngenta
Source: FAOSTAT
Brazil uses of land
12 Global challenges01

0 1 2 3 4 5 6
2005-201420142012
Environmental stress
Water stress is already limiting productivity: around US$ 40 billion in crop losses in 2012 due to drought
Climate variability and agricultural riskEvery year, some part of the world suffers from drought which can hamper the growth of crops and significantly reduce the level of grain harvested. Today, some 80 countries are already suffering from water shortages, and the problem is not confined to the arid regions of the world. Nations like Brazil, Canada, Colombia, Indonesia, and Russia are all teeming with fresh water – but even they sometimes experience severe drought.
Source: USDA
Average yield of corn, soybean and cerealstons per hectare (t/ha)
13Global challenges 01

70
80
90
100
110
120
130
Jan-15Oct-14Jul-14Apr-14Jan-14
Wheat Corn Soybean Rice
Environmental stress
Drought conditions frequently observed in regions with no water scarcity
The impact of cyclical weather variability, which varies in intensity and character year by year, has seen some fundamental changes in the climatic patterns over the last decades. The most visible ones were:1) widespread global temperature increase, 2) change in precipitation patterns (increased in some regions and decreased in others) and 3) change of frequency and intensity of some extreme weather events.
Fundamental changes in the patterns of temperature and precipitation could possibly shift production seasons, pest and disease patterns, and modify the types of crops grown in certain areas. A potential decrease in productivity due to hotter and more variable weather may lead to more erratic production patterns overall. Although there will be gains in some crops in some regions of the world, the overall impact on agriculture may be negative.
Simulations using greenhouse gas emissions models suggest by 2100 an increase of global average temperature of up to 2.5°C, with more and stronger extreme events. These changes are expected to drive a further increase in water stress, the acidification of oceans and potentially the risk of extinction of 20–30% of assessed plant and animal species.
Commodity price evolution since Jan 2014Index @ Jan 2014 = 100
Source: CBOT/Bloomberg
14 Global challenges01

Physical water scarcityApproaching physical water scarcity
Economic water scarcityLittle or no water scarcityNot estimated
Environmental stress
China and India together have <10 % of the world’s fresh water
Water scarcityGlobal water scarcity has a critical impact on food security and health. Only about 3% of the Earth’s water is fresh, and less than a third of that is economically accessible for human use in an environmentally responsible way – making water one of the biggest limiting factors in the world’s ability to feed a growing population.
Even though global fresh water resources are sufficient, they are unevenly distributed with water scarcity in some locations already reaching alarming levels. China and India, with one-third of the world’s people, have between them less than 10% of the world’s fresh water.
Areas of physical and economic water scarcity
Source: International Water Management Institute
15Global challenges 01

0
20
40
60
80
0
100
200
300
400
500
600
Sub-SaharanAfrica
SouthAsia
EastAsia &Paci�c
Middle East& NorthAfrica
Europe &Central
Asia
LatinAmerica &Carribean
OECDcountries
Environmental stress
In China around 50% of all farmland is irrigated
Over two billion people live in areas that have no access to clean water and sanitation
Practically everything we do requires water. With the world population growing, becoming wealthier and more economically productive, the demand for water will surge. Along with the economic development over the last 50 years, we have seen water use triple.
With the competing demands on this finite resource – drinking, sanitation, agriculture, energy and industry – it is not surprising that 80 countries suffer from water shortages that threaten health and economies, while 40% of the world – more than two billion people – does not have access to clean water or sanitation.
Agriculture is still the largest consumer of fresh water. It is estimated that almost 70% of the global fresh water withdrawal is used for agricultural production, not always in the most efficient way.
In Africa many countries use over 50% of their available water resources in agriculture, whereas in other regions such as Latin America the proportion is significantly lower. Water availability, water quality, climatic conditions and soil quality as well as local policies, legislation and regulation all play an important part in ensuring that holistic solutions are developed to meet grower needs and constraints.
Source: International Water Management Institute
% of total populationPopulation in water scarce
areas in millions
Population living in areas of absolute water scarcity
16 Global challenges01

Environmental stress
Use of water to support agriculture is expected to grow around 11% globally
Today, one kilogram of rice requires 3,400 liters of water
On average it takes one liter of water to produce one calorie of food
Many countries already face temporary or permanent water shortages and, in the future, changes in climatic patterns will likely make these shortages worse. In many developing countries agriculture employs a significant portion of the labor force and represents a large percentage of total GDP. Therefore these people, who are already vulnerable and food insecure, are likely to be the most seriously affected.
The United Nations Environment Programme estimates that two out of three people will live in drought or water-stressed conditions by 2025. In addition to changes in climate, it is also anticipated that the amount of irrigation water used in agriculture in developing countries might grow by around 14% while at the same time it is expected to decline by around 2% in developed countries. This means that on average we will need to use around 11% more water globally to support agriculture, much of which might come from the continued unsustainable use of groundwater, increasing the competition for industrial water and sanitation.
There is an urgent need to increase water use efficiency in agriculture by developing new technologies that will help to secure and enhance yields with less water. Global water consumption will continue to increase steadily and will, without corrective actions, hit global supply thresholds.
Looking forward, solutions need to be found that will not only increase yields but do so in a way which reduces the amount of water required. The combination of changes in grower practices, increased availability of drought tolerant plants, crop protection and crop enhancement technologies as well as improved grower education will help deliver tailored solutions that will increase not only output but also improve overall land stewardship.
17Global challenges 01

Sustainable agricultural systems
02

Technology
Improve farm productivity
Enhance agriculture’s environmental footprint
Build rural prosperity
People Land
Rural economies
Bet
ter s
olut
ions
Resource ef�ciencies
Sustainable intensification of agriculture
GDP growth generated by agriculture is up to four times more effective in benefitting the poor
The dilemma facing the world today is how to feed a growing population while safeguarding the only planet we have. Although this poses significant challenges, they are by no means unachievable.
A system-wide approach to sustainable agriculture which focuses on the links between technology, people and land can contribute to solving these challenges.
Agricultural technologies enable a sustainable production system that protects the long-term economic and environmental viability of farming. Farmers can earn better incomes, live better lives and become stewards of the land.
Strong rural economies are the keystone of sustainable agricultural systems and fundamental in achieving food security. Technology combined with supporting infrastructure, access to markets and financial resources enable better solutions for farmers so they can increase productivity and improve the farm economy. At the same time, agricultural solutions can have a beneficial impact on water, land and biodiversity by allowing more efficient and responsible use of these basic natural resources. Creative financial solutions are necessary for sustainable increases in productivity. Bad weather and sub-optimal harvests, for instance, can result in a cycle of poor productivity and low incomes, which can be hard to break. The International Fund for Agriculture Development (IFAD) has shown that GDP growth generated by agriculture is up to four times more effective in benefiting the poor compared to growth generated by other sectors.
19Sustainable agricultural systems 02

0
1
2
3
4
5
6
7
201020052000199519901985
Developed countriesEast Asia & Paci�cLatin America & CaribbeanSouth AsiaSub-Saharan Africa
* Barley, buckwheat, canary seed, fonio, corn, millet, mixed grain, oats, quinoa, rice, rye, sorghum, triticale, wheat and other cereals
Improving productivity
Over the past 20 years a ton of corn can be grown using 37% less land
Global production of corn, soybean, wheat and rice more than tripled since 1960
The Green Revolution that began in 1945 transformed agriculture through the introduction and expansion of technology in certain parts of the world. Farm productivity benefitted greatly as the Green Revolution focused on developing improved crop varieties, together with crop protection products, irrigation projects and synthetic nitrogen fertilizer to successfully alleviate hunger in many areas.
Yields grew dramatically in many regions while limiting the expansion of cultivated land. Global production of the major crops corn, soybean, wheat and rice has more than tripled since 1960. During that time, yields for rice have more than doubled and those of wheat have increased by around 160%.
Cereal* yieldstons per hectare (t/ha)
Source: FAO
20 Sustainable agricultural systems02

0.5
1.5
2.5
3.5
0
10
20
30
40
50
60
Poverty Yields
1987 1990 1993 1996 1999 2002
0.5
1.5
2.5
3.5
0
10
20
30
40
50
60
1987 1990 1993 1996 1999 2002
Improving productivity
Agricultural productivity is a key driver to reduce poverty
However, the revolution was never fully realized with many places in the world by-passed, especially Africa. This is reflected, for example, in the loss of international competitiveness of many traditional African export crops during the past 30 years. At the same time, many domestic crops have become less competitive and import dependence has increased. For the foreseeable future, reducing poverty in Africa will largely depend on stimulating agricultural growth.
Clearly, the world’s farmers need to increase yields per hectare sharply and sustainably. This means without using more water or other natural resources, while using chemical inputs like fertilizers and pesticides as efficiently as possible.
Note: Cereals includes corn, wheat, rice, barley, rye and sorghum
Sources: Ravallion and Chen 2004; World Bank 2006
Cereal yields(t/ha)
Cereal yields(t/ha)
Poverty incidence%
Poverty incidence%
Sub-Saharan Africa South Asia
21Sustainable agricultural systems 02

* Up to 100% possible if all technologies are implemented together, based on selected crop and country combinations ** Represents average range; certain crop and location combinations may see up to 50% post-harvest loss
Potentialproduction
Yield gap Harvest loss Production Post-harvestloss
Processingloss
Distributionwaste
Consumerwaste
Consumed
110–140% 10–40%*
2–10%
100% 5–30%**
1–5%1–5%
10–30%
50–70%~30–50%
Improving productivity
Insects and weeds destroy ~25% of crops in Africa
In developing countries 40% of grain losses occur post-harvest
However, there is also a need to reduce inefficiencies that occur in the current production system. Around 40% of all food produced is never used. Much of it is wasted during the post-harvest process which is effectively a waste of the resources invested in the crop: the land, water and nutrients needed to grow the crop. Another significant portion is thrown away by consumers and retailers.
Crop losses in fields can be addressed by applying better products and using more effective practices, so that the yield gap is closed and valuable production is not lost during the harvest process. In Africa, insects and weeds destroy an estimated 25% of the crop. Post-harvest losses can be addressed with in-farm and out-farm solutions.
By focusing on post-harvest crop protection products and increasing the efficacy of the supply chain, we can help combat some of the issues related to storage, transportation and processing losses.
In the area of smallholder farming, this is particularly important given the number of smallholders who live on the edge of food security. If we are able to successfully address some of these challenges, we can have a significant impact on the livelihoods of many people.
Sources: FAO; Syngenta
An estimated 30–50% of food is lost or wasted in the chain(around 1.3 billion tons annually)
Estimated range of avoidable losses and waste by stage globally
22 Sustainable agricultural systems02

0
2
4
6
8
10
Rest of worldDeveloped countries = NAFTA, EU28, Japan
Brazil, Russia, India, China
2022
8.2
2014
7.4
~83% of global
production growth
Improving productivity
Without the intensification of agriculture, 50–100% more land would need to be cultivated compared to 1960
Many regions of the world hold the potential to increase productivity significantly in the coming years by adopting modern technologies. For example, in Russia and the Ukraine, once considered the “breadbasket of Europe”, only 10% of the land surface is farmed efficiently. Asia has the potential to boost productivity by approximately 20% in 10 years by adopting current technology. BRIC countries (Brazil, Russia, India and China) are expected to undergo the greatest growth between 2010 and 2021, with the OECD foreseeing around 30% of global production growth and continuing professionalization of those markets, with the ongoing adoption of technology.
A recent study from Stanford University found that without the intensification of agriculture, 50–100% more land would need to be cultivated compared to 1960. At the same time, there are those who call for extensification, such as increased organic production. Organic production methods can fit into integrated farming systems when the products and methods used are safe, effective and economical. Currently organic farming occupies less than 1% of total land used for food production, with average yields approximately 35% lower than those from conventional agriculture. This level of output is not sustainable or sufficient to feed a growing global population.
Global agricultural production*billions of tons
* Wheat, coarse grains, rice, oilseeds, protein meals, vegetable oils, meat, dairy and sugar
Sources: OECD; FAO
23Sustainable agricultural systems 02

Reducing agriculture’s environmental footprint
Soil loss in corn cultivation has dropped 69% per ton in the past 20 years
Agriculture accounts for 14% of all man-made greenhouse gas emissions
Nature takes 500 years to replace 25 mm of lost soil
Improved farming practices and solutions will not only address the need for increased productivity but also help farmers manage and protect the environment. Many stakeholders from a wide range of disciplines, including academia, governmental and non-governmental settings, are acknowledging that agricultural intensification is necessary to produce enough food without further compromising nature.
Greenhouse gas emissions directly associated with crop farming and livestock (excluding deforestation) represent around 14% of all man-made emissions and have been continuously decreasing per ton of crop produced due to the intensification and modernization of practices and products.
In addition, agricultural productivity has been contributing to more optimized land use and consequently the conservation of natural habitats. The most concerning land use change in modern times has been deforestation, which is also the second major contributor for man-made greenhouse gas emissions. In Brazil, for instance, Amazon deforestation plunged to a historic low in 2010, more than 75% below its 2004 peak, while productivity increased faster than most countries across the globe.
Fertile soil is the foundation of sustainable agricultural systems; biodiversity is the basis for agricultural resilience. But poor farming practices leave soils depleted and exposed to soil erosion. Already, some 40% of the world’s farmland is seriously degraded. Cultivating more wilderness for human consumption threatens biodiversity, so it is crucial that farmers become more productive and manage their land to protect and improve biodiversity on farm and around the field.
Millions of hectares of farm land become infertile globally each year as a result of soil erosion. Much of this soil is lost as a result of traditional tillage used for weed control. By breaking up and turning the soil, tillage leaves it more vulnerable to erosion and soil is more easily washed off the fields by heavy rain. Globally around 15% of the population has become affected by land degradation since 1981.
Farmers need help to increase soil fertility and improve the productivity on their land in sustainable ways. That means crop rotations, restoring degraded land, planting vegetation around fields to prevent erosion and techniques to avoid unnecessary tilling. It takes nature 500 years to replace 25 mm of lost soil – making soil a top priority for every farmer.
Farming also depends on biodiversity. Diversity of genetic material is the key to adapting crops to changing conditions – and changes in climate are accelerating the need for adaptation. Farmers need the pollination provided by bees and other insects – a number of the world’s agricultural crops depend on pollination.
See how Syngenta’s operation pollinator helps with biodiversity on: www.syngenta.com
24 Sustainable agricultural systems02

Building rural prosperity
Smallholder farmers in China, India and Sub-Saharan Africa account for around 35% of global grain* production* Corn, soybean, wheat and rice
An estimated 2.5 billion people in the developing world depend on agriculture for their livelihoods
The world’s 450 million smallholder farmers – farming less than two hectares of land – are the largest farmer group globally and of key importance to local, national and global food security, especially in developing countries.
In Asia and Sub-Saharan Africa, more than 80% of farmers are smallholders produce 35% of the world’s grain (corn, soybean, wheat and rice) output. However, the regions where smallholder farmers make up the majority of the farming communities are also the regions that are most food insecure, where the largest agricultural yield gaps exist and where overall country development is blocked by undeveloped rural systems. In fact, smallholders constitute half the hungry people in the world today. In order to feed themselves and the growing world population, smallholder farms will need to more than double their current production by 2050. It is clear that we will need to focus on smallholder farmers to ensure rural prosperity and global food security.
Smallholder farmers often lack access to technology, education and agronomy training, information on weather, pests, diseases, markets and financial resources – and this hinders their productivity. It also curtails the ability of farmers to be profitable and to support the development of their families and communities. Around two thirds of the farmers in low- and middle-income countries have inadequate access to resources and markets. Appropriate technology, coupled with agronomic knowledge and best practice, can help these farms increase productivity in an environmentally sustainable manner. For example, labor costs for weeding have been found to absorb up to 50% of a smallholder’s production costs and this will increase as labor availability for agriculture decreases in many countries. Not only does this impact the farmer’s wallet but such laborious tasks leave less time to focus on other potential income generating activities and can often require children to miss school in order to help on the farm. Access to the right technology, such as herbicides, can significantly reduce labor costs as well as bring environmental benefits, yield increases and more time for children in the classroom.
25Sustainable agricultural systems 02

0 20 40 60 80 100
Agricultural self employment
Agricultural wage employment
Nonagricultural self employment
Nonagricultural wage employment
Sub-Saharan Africa
South Asia
East Asia and Paci�c
Middle East and North Africa
Europe and Central Asia
Latin America and Carribean
Building rural prosperity
In Asia and Africa women make up 60–75% of the agricultural workforce
In Asia, where more than 90% of the world’s rice is produced, rice yields have increased by an average of 1% per annum. But to meet the growing food demand and keep the price of rice affordable to the poor, the annual yield increase needs to reach around 1.5%. Increasing yields can be met through further intensification, while taking account of the increasing scarcity of resources and minimizing the environmental impact.
When smallholder farmers are given access to improved agricultural technology, new crop varieties and better irrigation methods, they can be efficient producers per hectare and achieve high levels of yield. Vietnam, for instance, transitioned from being a food deficit country to being the second largest rice exporter in the world largely through developing its smallholder farming sector. It is estimated by the FAO that around US$ 30 billion per year needs to be invested in re-invigorating smallholder agriculture on a global scale, in order to reverse the decades of under-investment.
But simply increasing productivity is not enough. Farming needs to be profitable. For this farmers need access to markets and fair prices for their produce. Developing farmer cooperatives, partnering with food chain companies and accessing market and price information via mobile phones are some of the ways in which farmers secure better prices for their produce. The risk of farming can also be reduced through the provision of affordable credit and insurance. Public-private partnerships that are supported by governments and encourage private cooperation, such as Grow Africa and Grow Asia, have the potential to deliver scalable solutions to smallholders, and are equally as important in accelerating investments and transformative change in smallholder agriculture.
The role of women farmers is another aspect that demands focus. In the smallholder regions of Asia and Africa women make up 60–75% of the agricultural workforce and this is increasing with the growing trend of men migrating to urban areas, leaving women to care for the family and farm. Yet women often have no title over the land and find it harder than the men to access markets, financial services and technology. In instances where women have had better access to inputs such as seeds and fertilizer, results show substantial increases in staple crops. To reduce the burden of intensive labor while increasing the productivity of smallholder farms and the food security of rural communities, women farmers need to be considered when developing agricultural solutions.
Women’s contribution to agricultural employment(% of women)
Source: IFAD 2009, FAO 2010, World Bank 2008, UN Gender Diversity Program 2009, WDR 2008
26 Sustainable agricultural systems02

Building rural prosperity
Investments focusing on economic, social and environmental returns will create the most sustainable long-term value
Private investment accounts for 50% of R&D spend in developed countries; in emerging markets it is only 6%
Public-private partnershipsWorking in partnership is key to enable and accelerate the development of functioning markets. The combination of public and private expertise allows traditional public sector skills of rural development, long-term research and policy to be combined with the more practical elements of companies and business such as technical and market development as well as marketing and distribution expertise. Public-private partnerships are most successful when clearly defined agreements exist regarding contribution to the collaboration and share of the output. Common goals, objectives and deliverables must be underpinned by a commitment from all parties, open communication, trust and an agreed balance of power sharing.
The benefits to be gained include wider access to technology, improved connectivity between growers and markets, ability to build on individual expertise, ability to share costs and optimize investment decisions as well as overall increased chance of success in R&D related projects. Private investment accounts for 50% of R&D spend in developed countries; in emerging markets it is only 6%.
Critical agricultural challenges such as water efficiency, infrastructure and post-harvest loss management can be better addressed when joining up the right partners, including those who provide financing, technology, machinery, irrigation, farming expertise and infrastructure. Through long-term investment and commitments, the benefits can be substantial in enabling many countries not only to produce enough food to replace current imports, but also to become resource efficient and competitive in global markets.
A good example is Africa where agriculture is likely to continue growing but at different paces depending on the country. Governments are directing more investments to agriculture, especially in the productivity of smallholder farming, a sector that suffers from the difficulty of accessing markets and technology. The large opportunity for public-private or private-private partnerships is to develop innovative new business models that will remove existing constraints and attract investors. Joint efforts in knowledge sharing through agronomy training, including the best use of crop protection and seed programs, and in better farm management practices pay out in better productivity and profitability of agriculture.
27Sustainable agricultural systems 02

Regions in focus
03

~1.0~1.1
~2.5
0.5
0.70.3
1.0
~2.4
0.5
0.70.3
0.95
~0.4~0.3
~0.6~0.5
Production
Major grain and
meat exporters
NORTHAMERICA
2014bn t
Major soybean and
meat exporters
LATINAMERICA
Production gap,
repressed demandAME WORLD
EU28: net importers
CIS: increasing export share
EUROPE Focus on self suf�ciencyAPAC
Consumption Production Consumption Production Consumption
Production ConsumptionProduction ConsumptionProduction Consumption
~0.3~0.2
~0.2~0.3
Wheat RiceCorn Soy
Introduction
Each of the world’s four regions – North America, Latin America, Europe, Africa and the Middle East (EAME) and Asia-Pacific – consists of multiple territories with different climatic zones and soil composition affecting the fertility of the land and the type of crops cultivated. Additionally, the degree of mechanization and technology adoption can vary substantially between territories.
Supply versus demand patterns of major field crops by region
DistributionEach region has a different distribution structure for bringing crop protection, seeds and traits to market. Farmers in some regions have direct access to suppliers but generally distribution takes place through wholesalers, retailers and cooperatives. The distribution model usually depends on the size of the farms, the level of country infrastructure and on the food chain regulation policies.
There is also a variable degree of government or local subsidies provided to the agricultural sector. North America and EAME run significant government-backed subsidy schemes which have been increasing over recent years, whereas Latin America and Asia-Pacific have few to none at all.
Public-private partnershipsPublic-private partnerships are seen as an important factor for the development of sustainable agricultural systems with most governmental institutions taking significant action in recent years to strengthen their contribution.
29Regions in focus 03

China––––
#2#2#1#1
India#7#2
–
#2#2#2
Australia#4 one of
manyThailand
#1 #5
ExportsGlobalrank
Globalrank
Production0 1101020 220
Wheat Rice CottonCorn
ChinaCornRiceWheatVegetables
SE AsiaRicePalmCornRubber
IndiaRiceWheatPulsesCotton
AustralasiaWheatOilseed rape
NE AsiaRiceVegetablesFruits
Around 40% of the global cropped area is in Asia
The region can be clustered into four distinct agricultural systems:
■■ South Asia and parts of ASEAN: Basic agricultural systems, where difficult access to credit and the prevalence of smallholder farming limit technology adoption. Yield levels are significantly lower than global peers across all crops, despite favorable natural conditions. The channel structure is normally very fragmented and characterized by multiple layers.
Major grain exports and production in 2014millions of tons (mt)
Key crops by area
Source: USDA
Asia-Pacific
The Asia-Pacific region is characterized by a conglomerate of countries with different languages, cultural backgrounds and economic and political systems, where agriculture varies from the basic systems in countries such as India to the highest technical standards found in Japan. Around 40% of the global cropped area is in Asia (~600 Mha), with India covering around 200 Mha, which is the largest planted area for any single country.
Common characteristics across the region are the predominance of smallholders and the importance of rice, with Australasia being the only exception. The food security agenda is a priority for local governments in developing Asia and rice is largely subsidized in most countries, including Japan. Around 90% of the global rice area is concentrated in Asia, with 28% in India and 20% in China, mostly cultivated under paddy conditions and consequently very dependent on the annual monsoon season.
Besides rice, tropical perennial crops such as palm play a significant role in the region. Asia is also the biggest producer of cotton worldwide and New Zealand the largest exporter of milk powder and butter. There is a significant trend across the whole region which sees the young generation moving out of rural areas and into cities, resulting in agricultural labor becoming increasingly expensive and scarce. In addition, although supportive climatic conditions enable multiple growing seasons in a year, the majority of the countries suffer from extreme climatic and natural events which often disrupt production. As a consequence, emerging Asia is increasingly focused on intensification and mechanization, whereas more mature systems are looking to simplify operations.
30 Regions in focus03
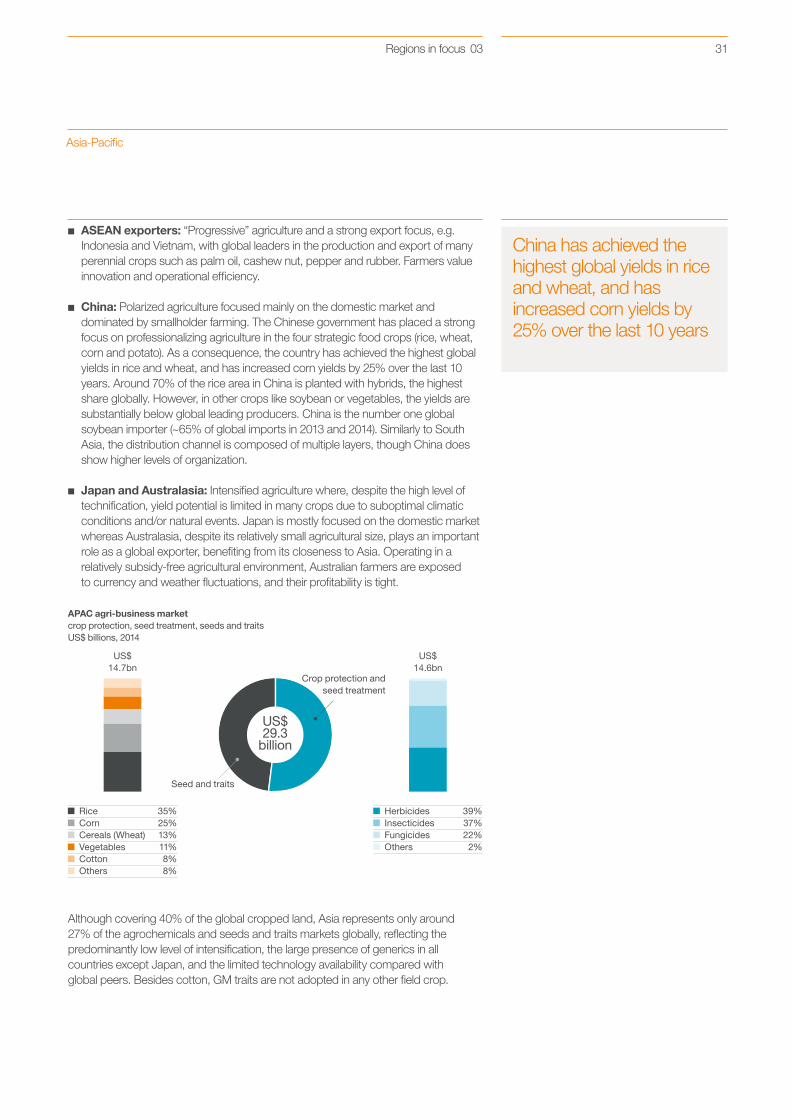
Rice 35%Corn 25%Cereals (Wheat) 13%Vegetables 11%Cotton 8%Others 8%
Herbicides 39%Insecticides 37%Fungicides 22%Others 2%
US$29.3
billion
Crop protection andseed treatment
Seed and traits
US$14.7bn
US$14.6bn
Asia-Pacific
China has achieved the highest global yields in rice and wheat, and has increased corn yields by 25% over the last 10 years
■■ ASEAN exporters: “Progressive” agriculture and a strong export focus, e.g. Indonesia and Vietnam, with global leaders in the production and export of many perennial crops such as palm oil, cashew nut, pepper and rubber. Farmers value innovation and operational efficiency.
■■ China: Polarized agriculture focused mainly on the domestic market and dominated by smallholder farming. The Chinese government has placed a strong focus on professionalizing agriculture in the four strategic food crops (rice, wheat, corn and potato). As a consequence, the country has achieved the highest global yields in rice and wheat, and has increased corn yields by 25% over the last 10 years. Around 70% of the rice area in China is planted with hybrids, the highest share globally. However, in other crops like soybean or vegetables, the yields are substantially below global leading producers. China is the number one global soybean importer (~65% of global imports in 2013 and 2014). Similarly to South Asia, the distribution channel is composed of multiple layers, though China does show higher levels of organization.
■■ Japan and Australasia: Intensified agriculture where, despite the high level of technification, yield potential is limited in many crops due to suboptimal climatic conditions and/or natural events. Japan is mostly focused on the domestic market whereas Australasia, despite its relatively small agricultural size, plays an important role as a global exporter, benefiting from its closeness to Asia. Operating in a relatively subsidy-free agricultural environment, Australian farmers are exposed to currency and weather fluctuations, and their profitability is tight.
APAC agri-business marketcrop protection, seed treatment, seeds and traitsUS$ billions, 2014
Although covering 40% of the global cropped land, Asia represents only around 27% of the agrochemicals and seeds and traits markets globally, reflecting the predominantly low level of intensification, the large presence of generics in all countries except Japan, and the limited technology availability compared with global peers. Besides cotton, GM traits are not adopted in any other field crop.
31Regions in focus 03

Seed and crop protection companies
Wholesalers
Small retailers
Large retailers Tender process
Government & cooperatives
Farmers
SubsidiesHistorically, the sharp increase of the population living in the region has led Asian countries to develop agricultural subsidy programs with the aim of ensuring self-sufficiency. Nowadays, the agricultural sector is heavily supported by national governments across Asia to guarantee a level of income to farmers.
In countries where agriculture is the primary sector, subsidy programs represent a significant share of the national budgets. For example, nearly 20% of India’s 2014/2015 budget is dedicated to agricultural subsidies. Subsidies may range from farm inputs (water, electricity, seeds and chemical products) to transport to guaranteed purchase prices by the government. Structural changes in diets, as well as increasing trade flows between countries, have in recent years required governments such as Japan and Thailand to adapt their subsidy schemes in order to ensure that their agricultural sectors remain competitive at a reasonable cost for the nations’ budgets.
Nearly 20% of India’s 2014/2015 budget is dedicated to agricultural subsidies
Distribution structureIndia’s distribution structure is an example of the route to the farmer in developing Asian markets. The distribution of farm inputs to farmers and rural communities across India, as in many countries across developing Asia, is facing several challenges. The vastness of the rural area, the lack of road and communication infrastructures and the diversity of languages spoken make it difficult for input companies to have a direct reach to farmers through local outlets. Prior to the liberalization of the Indian economy in 1991, agricultural policy was governed by a planning framework, characterized by a high level of control of the distribution of farm inputs. Under the effect of successive reforms, private companies have been allowed to distribute their production directly to retailers, which constitute about two-thirds of the total quantities sold. The balance is sold through state cooperatives via tender offers.
India distribution infrastructure
Retailers account for two thirds of total quantity sold in India
Asia-Pacific
32 Regions in focus03

Asia-Pacific
Public-private partnershipsPublic-private partnerships (PPPs) have become an essential way for private industry to successfully navigate the often volatile business environment in Asia-Pacific. Arguably the most geographically and politically diverse environment on the planet, Asia offers abundant opportunities but is hindered by a complex regulatory environment. Governments also remain cautious in engaging with private (especially multinational) organizations, making policy makers difficult to access through traditional channels. This lack of access to government can often be a blocker to the formation of successful collaboration between the public and private sectors. Some of the other risks involved with establishing effective PPPs include financing risks, public opposition, overrun of operating costs, and lack of supporting materials and infrastructure.
As many public-private partnerships are geared toward the development of infrastructure, in emerging markets such as ASEAN and South Asia many partnerships are found in areas such as transport, energy, and telecommunications. Currently the most active countries in the Asia-Pacific region are Australia, the Republic of Korea, Japan, India and the Philippines.
In Asia, agriculture is still a major employer and contributor to GDP in many countries. For this reason, governments are becoming increasingly aware of the important role that the private sector plays in increasing the quality and quantity of domestic production. Due to the highly politicized nature of agriculture in the region and the complexities of a predominantly smallholder farming system, working with government is essential for businesses to be successful. In order to facilitate successful partnerships, aid agencies and third party organizations are often used as intermediaries between the public and private sector. Companies provide market-based solutions to address key development issues, looking with their core competence as the lever, while the public sector then provides the enabling environment through policies and basic social infrastructure to ensure the sustainability of these partnerships.
Asia offers abundant opportunities for PPPs but access to governments is a challenge
33Regions in focus 03

EU28#3#4#2#1
#1#4#1#2
CIS#2
–#1#2
#5–#2#1
AME#6#7#8#9
#6#4#3#5
ExportsGlobalrank
Globalrank
Production0 802550 160
Wheat Barley Sun�owerCorn
CISWheatBarleySun�owerCorn
Western EuropeWheatCornBarleyRapeseedSun�ower
AMECornWheatRiceMilletBarley
With 300 Mha under cultivation, Europe represents ~20% of the global planted area
Key crops by area Major grain exports and production in 2014millions of tons (mt)
Europe comprises a multitude of countries with around 300 Mha under cultivation, which represents around 20% of the global planted area. The largest agricultural areas are found in Eastern Europe. The region is characterized by a broad diversity of crops and is divided between small size farms (15 ha/farm on average) with highly intensified farming systems in the West, and increasingly consolidated, professionalized producers in the East, particularly in the CIS countries.
Strong agricultural fundamentals enable the region to be a leading producer and exporter of key agricultural goods. The most important cultivated crops grown are wheat, barley, corn, sunflower, winter oilseed rape, sugar beet and vegetables.
Source: USDA
Europe, Africa and Middle East
34 Regions in focus03
Europe, Africa and Middle East
Wheat production in Western Europe is 15% of the global planted area and 15% of the global production
CIS covers 20% of the global wheat planted area but only 15% of the global production due to low average yields
The region can be clustered into two distinct agricultural systems:
■■ Western Europe: Mature, highly intensified systems benefiting from favorable climatic conditions and availability of natural resources with tech-savvy, highly educated farmers and an organized distribution channel dominated by cooperatives. Optimized farming practices and efficient infrastructure enable these countries to occupy top quartile positions in global yields for key crops, and to play a leading role in the production and export of many agricultural and livestock products, e.g. France (wine, wheat, corn, sugar), Netherlands (vegetables), Iberia (fruits and vegetables) and Denmark (pork).
Due to its favorable agro-climatic conditions, Western Europe is one of the best places in the word to produce wheat, representing 8% of the global planted area and 15% of global wheat production, with highly competitive yields of 6-9 t/ha.
Despite the low adoption of GM traits, Western Europe is one of the regions with the highest spend per hectare in agriculture worldwide, It represents only ~5% of the total global crop planted area but accounts for 17% of the global agrochemicals spend and 12% of the seeds and traits market. The GM insect-resistant Bt trait, approved at EU level for corn, is only cultivated in five countries, with Spain being the only one to have relevant area coverage in excess of 100kha.
Key challenges in Western Europe are resistance management and dealing with operational complexity, partially driven by tightening regulatory boundaries.
■■ Central and Eastern Europe: Countries with intensification potential and an unsatisfied demand for technology, exposed to irregular weather patterns and natural constraints. The region is characterized by multiple agricultural patterns and maturity levels, with EU member countries profiting from the EU “machine” and infrastructure.
In the CIS, where subsidy levels are less relevant and where natural conditions are more challenging, yields of main crops are clearly below Western European norms. Ukraine, the leading sunflower and sunflower oil producer worldwide, has professional agriculture focused on exports which are a major contributor to GDP. Russia is focused mainly on domestic markets and agriculture is not a primary driver of the country’s economy.
Similarly to Western Europe, wheat is the leading crop across the CIS, covering 46 Mha and consequently 20% of the global wheat planted area, but equating to only 15% of global production with average yields of around 2.5-3 t/ha.
Logistics infrastructure and quality are key blockers for global competitiveness in the region.
35Regions in focus 03

Corn 34%Cereals 20%Vegetables 19%Sugarbeat 7%Sun�ower 5%Rapseed 3%Others 12%
Herbicides 43%Insecticides 38%Fungicides 18%Others 1%
US$27.5
billion
Crop protection andseed treatment
Seed and traits
US$11.4bn
US$16.1bn
Europe, Africa and Middle East agri-business marketcrop protection, seed treatment, seeds and traitsUS$ billions, 2014
Overall Europe has a balanced contribution of area and agribusiness market, representing 20% of the global agricultural planted land, 25% of the agrochemicals market and 20% of the seeds and traits market. However, the CIS spend per hectare is clearly below the Western European norm.
Europe represents 25% of the agrochemicals market and 20% of the seeds and traits market
Europe, Africa and Middle East
36 Regions in focus03

Seed and crop protection companies
National distribution and private cooperatives
Contractors, independent retailers
Regional distributors (with or without affiliation)
Farmers
Seed and crop protection companies
Direct Regional distributorsNational distributors
Mega Medium-sizeLarge SmallFarm size
Europe, Africa and Middle East
Distribution structureThe structure of the distribution channels greatly varies between countries. The distribution systems can be broadly summarized in two groups: on the one hand, markets operating under the regulation of the EU and, on the other hand, countries from the former Soviet block, where the CIS represent the largest share of the agricultural sector.
Distribution channels in EU countries are organized on a national basis, with suppliers having in most cases national sales organizations or distributing via the sales organization of another manufacturer. The distribution systems differ widely between countries: Italy, France and Spain have quite fragmented distribution systems whereas Nordic countries have highly concentrated networks. Distributors and retailers are generally not linked to an exclusive contract and will sell a wide range of crop protection and seed products from different manufacturers. Alongside large distribution networks and small retailers, cooperatives play a significant role in the distribution activities in France and Norway.
The dismantling of state control in former Soviet countries in the 1990s created major disruptions in the agricultural sector. The countries, now part of the Commonwealth of Independent States (CIS), responded to the crisis in the sector with different land distribution policies. As a result, the CIS distribution systems cater for very a diverse farming structure. In Russia, Ukraine and Kazakhstan, huge farming structures operate in the grain industry, next to smallholders. In Azerbaijan, distribution of land resulted in a smallholder farming structure.
CIS distribution infrastructure
Western Europe distribution infrastructure
Distribution channels are split in two groups: the EU countries and countries from the former Soviet block
37Regions in focus 03
Subsidies – EU Common Agricultural Policy (CAP)The Common Agricultural Policy (CAP) subsidy program has been a cornerstone of EU policy for the past 50 years. According to the European Commission, there are 12 million full-time farmers in the EU, managing an average of 15 hectares (vs. 2 million, 180 hectares respectively in the USA). Overall, agriculture and the wider agri-food industry provide 7% of all jobs and generate 6% of EU GDP. The CAP agreement, covering the period 2014 to 2020, continues a clear policy shift away from production-based support and towards a more cost-effective, equitable, and environmentally-friendly support. The total budget over the period is around €407 billion and is distributed via two pillars of support.
Under the first pillar, which accounts for around 77% of total spend, direct payments provide support to farmers who are actively engaged in agricultural activities. The pillar also promotes more sustainable farming practices with Green Payments accounting for 30% of the first pillar distribution.
The second pillar, accounting for the remaining 23% of total spend, covers multi-annual rural development programs. Member States design their own programs but at least 30% of the pillar budget is reserved for farmers who adopt voluntary measures beyond mandatory standards and requirements.
There are 12 million full-time farmers in the EU, managing an average of 15 hectares
Europe, Africa and Middle East
38 Regions in focus03

Europe, Africa and Middle East
Public-private partnershipsThe landscape for public-private partnerships (PPPs) differs widely between Western Europe and Eastern Europe. In Western Europe, the first PPPs emerged in the UK in the early 1990s, with Initiatives aimed at funding infrastructure projects with private funds. In 2003, the European Commission established a framework to improve the efficiency of PPPs by fostering a better coordination between member states, the EU bodies and the private sector. France and the UK are the countries where PPPs are the most widely used. The European Union is also a major catalyst for such initiatives, which are typically launched under large, multi-year umbrella initiatives. Horizon 2020 is an €80 billion research and innovation program launched in 2014 that encompasses, among others, the development of solutions for a sustainable agriculture. In contrast, former economies of the Soviet block have had few PPP initiatives in the agricultural sector as their economic model was centrally planned. As these countries are implementing economic reforms and reshaping their agricultural sector, private companies play an increasing role in developing the sector.
Except for South Africa, which is the only country offering a mature PPP framework in Africa, public private partnerships are at an infancy stage. The development of partnerships is conditional on the creation of a legal and regulatory framework that provides a route for the private sector to invest in infrastructure development projects.
In 2014, the EU launched ‘Horizon 2020’ to invest €80 billion in a research and innovation program for the development of sustainable agricultural solutions
39Regions in focus 03

#1#1
–
#3#3–
ExportsGlobalrank
Globalrank
Production0 8050100 160
Corn
WheatSoybean
LANCornSorghumDrybeans
LASSoybeanCornCaneDrybeansWheat
Brazil / Brazil SCCornRicePlantations
Latin America
With almost 10% of the global cultivated area, Latin America plays a key role in global trade
Key crops by area Major grain exports and production in 2014millions of tons (mt)
The countries of Latin America operate different economic systems but agriculture plays an important role in all of them. Latin American agriculture covers a wide range of farming structures and practices, from smallholders in Central America to professionalized mega farmers in Brazil and Argentina.
With around 145 Mha, close to 10% of the global cultivated area is found in Latin America. The main crops are soybean (40%) and corn (around 25%), mostly concentrated across the three biggest countries, Brazil, Argentina and Mexico. Supportive natural conditions enable double cropping in many countries, multiplying the agricultural potential of the region, although creating some challenges in terms of resistance management.
Latin America plays an important role in global agricultural trade, with Brazil and Argentina among the top three exporters of corn and soybean. Perennial crops are also important, with Brazil being the leading global producer and exporter of orange juice, coffee and sugar (cane). Central America is a key exporter of tropical fruit, profiting from favorable agro-climatic conditions, proximity to the USA and sea access on both sides.
Compared with other regions, Latin American agriculture is much less supported by central subsidy schemes, and can be affected by restrictive export policies (e.g. Argentina). As a consequence, the returns from professionalized agriculture are mainly determined by operational efficiency and scale.
The region can be clustered divided into three main agricultural systems:
■■ Professional grain exporters (Brazil, Argentina, Paraguay, Uruguay): export-driven, extensive farming with efficient use of resources, covering areas with strong agricultural potential and focused on major grains, predominantly soybean. Farmers are rapid technology adopters but sensitive to cost versus benefit.
Soybean is a highly technified crop including the use of GM seeds, with Brazil and Argentina delivering leading global yields. It is the crop with the best economic return and as such lower risk compared with alternative crops.
Source: USDA
40 Regions in focus 03

Corn 47%Soybean 35%Vegetables 6%Others 12%
Herbicides 37%Insecticides 37%Fungicides 24%Others 2%
US$27.4
billion
Crop protection andseed treatment
Seed and traits
US$8.4bn
US$19.0bn
Latin America
Latin America represents ~27% of the global agrochemicals market but only 15% of the seeds and traits markets
Latin America agri-business marketcrop protection, seed treatment, seeds and traitsUS$ billions, 2014
More variable intensification and agronomic practices are observed in corn, where yields are much more uneven depending on the region and returns strongly dependent on crop price levels. Whereas Argentina achieves productivity similar to the USA, corn in Brazil is split between highly intensified fields and subsistence farming with low to non-existent technology use.
Availability of land and water, favourable climatic conditions and good soil quality are key competitive advantages for the region’s exporters, but governmental intervention and pest resistance as a consequence of suboptimal rotational patterns are increasing challenges.
■■ Professional niche exporters: intensive professional agriculture operating under high food chain standards in relatively small areas, focused on high value niche exports. Examples include Chile with fresh fruits and wine, Guatemala and Mexico in vegetables, tropical fruit plantations in Central America and coffee in Colombia.
■■ Small-scale local agriculture (Central America, Northern Andean countries): food crops for domestic or subsistence consumption (e.g. corn, rice, potato), supported by the government and based on traditional smallholder farming. Levels of intensification are low and topography often constrains mechanization.
Latin America represents around 27% of the global agrochemicals market but only 15% of the seeds and traits markets, reflecting the different maturity of the two segments. The tropical conditions have severe disease pressure (particularly for soybean in Brazil), driving the strong growth and increasing relevance of the fungicides segment. The ramp-up of existing and new GM traits, predominantly in corn and soybean in Brazil and Argentina, has contributed to above average regional growth since 2006. More than 90% of planted soybean and more than 80% of planted corn in Brazil and Argentina are cultivated with GM seeds. After the USA, Brazil and Argentina are the countries with highest share of GM traited crops worldwide.
41Regions in focus03

Dealers DealersCooperatives Retailers
Mega & large Medium-size SmallFarm size
Seeds and crop protection companies
Latin America
Distribution structureThe farming industry in Brazil is dualistic. Large-scale farms operating in the south and center-west regions co-exist with traditional farms located in the north-east and the Amazon basin, including many small and resource-poor farms producing for self-consumption or local markets.
There are three main channels of distribution in the country: agricultural cooperatives, distributors of inputs (or dealers), and direct sale from the supplier to large farm operations. After a period of consolidation in the mid 2000s, dealers represent about 60% of the sales of agricultural inputs and the remainder is sold via cooperatives.
Brazil distribution infrastructure
SubsidiesLatin American economies have undertaken agricultural trade liberalization over the past 30 years. The Uruguay Round agreement launched in the mid-1980s was a key catalyst to these changes, although many countries had already started reducing farming support in order to curtail chronic budget deficits caused by the debt crisis and hyperinflation.
In Brazil, the removal of trade barriers has favored large-scale farms that are benefiting from higher incomes as a result of a better access to technology at cheaper costs. Progress has however created inequalities with smaller farmers who have been disadvantaged by the fall in crop prices not being compensated by a similar reduction in farm input costs.
In comparison, Argentina has retained higher levels of subsidies.
Although the level of subsidies granted to the agriculture sector in countries such as Brazil or Chile is much lower than the average of OECD countries governments retain an active role via access to subsidized credit for farmers.
Dealers represent about 60% of the indirect sales of agricultural inputs
42 Regions in focus 03

0
2
4
6
8
10
12
14
16
18
Federal district State City council Unions
2006
Projects
2007 2008 2009 2010 2011 2012 2013 2014 2015
2
1 1
4
2
2
7
31
11
13
1
11
2
1
12
3
41
3
Latin America
Public-private partnershipsPublic-private partnerships (PPPs) have been thriving over the past decade in the region. Although such partnerships have existed for decades in various forms, most countries started putting legal frameworks in place in the past 15 years: Brazil’s Federal and State Policy was established in 2004. The global financial crisis in 2008 has highlighted the predominant role played by PPPs in the region as the tightening of liquidity on the markets has pushed governments to seek additional support from private funding to progress major investments. As in many other parts of the world, the private sector was initially engaged in PPPs to deliver public infrastructure projects. In recent years, PPPs have been evolving towards social infrastructure such as transport, schools, health services, power generation and sanitation.
Brazil represents the bulk of the PPPs, followed by Mexico and Peru, 2014 was the year in which most PPP contracts were signed in Brazil’s history.
Overview of signed public-private partnerships in Brazil
Tighter liquidity on markets push governments to seek additional support from PPPs
43Regions in focus03

#2#2#1#1
#1#2#3#2
ExportsGlobalrank
Globalrank
Production0 2003060 400
Corn Wheat CanolaSoybean
WheatCanolaBarleyPulsesSoybean
CornSoybeanWheat AlfalfaCotton
North America
The USA is the largest exporter of wheat and corn
The North America region represents 50% of the global GM planted area
North America is the most homogeneous region in terms of intensification level and farmer profile, while spanning a wide range of agro-climatic zones and crops. With around 160 Mha, the USA and Canada together represent around 10% of the global planted area and 50% of the global GM area. Around 70% of the cultivated area is planted with corn, soybean and wheat, which vary from year to year but are broadly equal in terms of importance, followed by canola, alfalfa, cotton and barley. With close to 30% of global production of the three major grains (corn, soybean and wheat), North America is a net exporter of agricultural goods.
The region is mainly dominated by large scale operations (176 ha/farm on average) primarily focused on exports with a very organized and professionalized distribution chain.
Fertile soils, availability of water and land, entrepreneurial farmers and efficient infrastructure are key competitive advantages for the whole region. However, the need to optimize the use of natural resources and manage increasing labor costs are key challenges for local agriculture.
Although geographically close, the USA and Canada present some important differences in their agricultural patterns.
The USA is an agricultural giant with around 130 Mha of cropped land and takes the leading role in the production and export of many crops and livestock segments. Globally, the US is the largest exporter of wheat and the largest producer and exporter of corn and, alongside Brazil, of soybean. The USA has the highest share of the agri-business market worldwide, with the largest seeds and traits market and the second biggest crop protection and seed treatment market after Brazil. As a fast adopter of technology, with robust regulatory and patent protection systems, the country profits from first-hand innovation, maintaining top quartile yield positions in many crops and sustaining very efficient operations. The USA is the leading adopter of GM traits and has the highest number of traits used per hectare.
High intensification and a suboptimal frequency of crop rotations have resulted in a continuous increase in resistance pressure which is becoming a major challenge for local farmers and an important driver for innovation.
Key crops by area Major grain exports and production in 2014millions of tons (mt)
Source: USDA
44 Regions in focus03
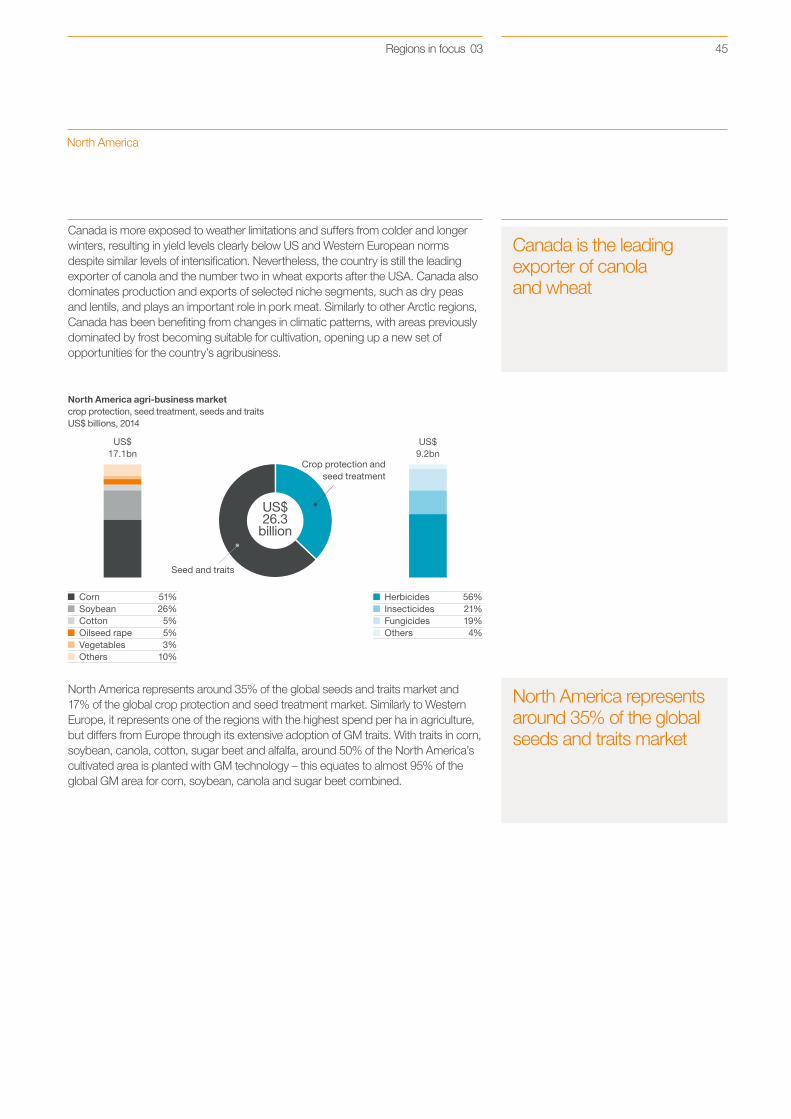
Corn 51%Soybean 26%Cotton 5%Oilseed rape 5%Vegetables 3%Others 10%
Herbicides 56%Insecticides 21%Fungicides 19%Others 4%
US$26.3
billion
Crop protection andseed treatment
Seed and traits
US$17.1bn
US$9.2bn
North America
Canada is the leading exporter of canola and wheat
North America represents around 35% of the global seeds and traits market
Canada is more exposed to weather limitations and suffers from colder and longer winters, resulting in yield levels clearly below US and Western European norms despite similar levels of intensification. Nevertheless, the country is still the leading exporter of canola and the number two in wheat exports after the USA. Canada also dominates production and exports of selected niche segments, such as dry peas and lentils, and plays an important role in pork meat. Similarly to other Arctic regions, Canada has been benefiting from changes in climatic patterns, with areas previously dominated by frost becoming suitable for cultivation, opening up a new set of opportunities for the country’s agribusiness.
North America represents around 35% of the global seeds and traits market and 17% of the global crop protection and seed treatment market. Similarly to Western Europe, it represents one of the regions with the highest spend per ha in agriculture, but differs from Europe through its extensive adoption of GM traits. With traits in corn, soybean, canola, cotton, sugar beet and alfalfa, around 50% of the North America’s cultivated area is planted with GM technology – this equates to almost 95% of the global GM area for corn, soybean, canola and sugar beet combined.
North America agri-business marketcrop protection, seed treatment, seeds and traitsUS$ billions, 2014
45Regions in focus 03
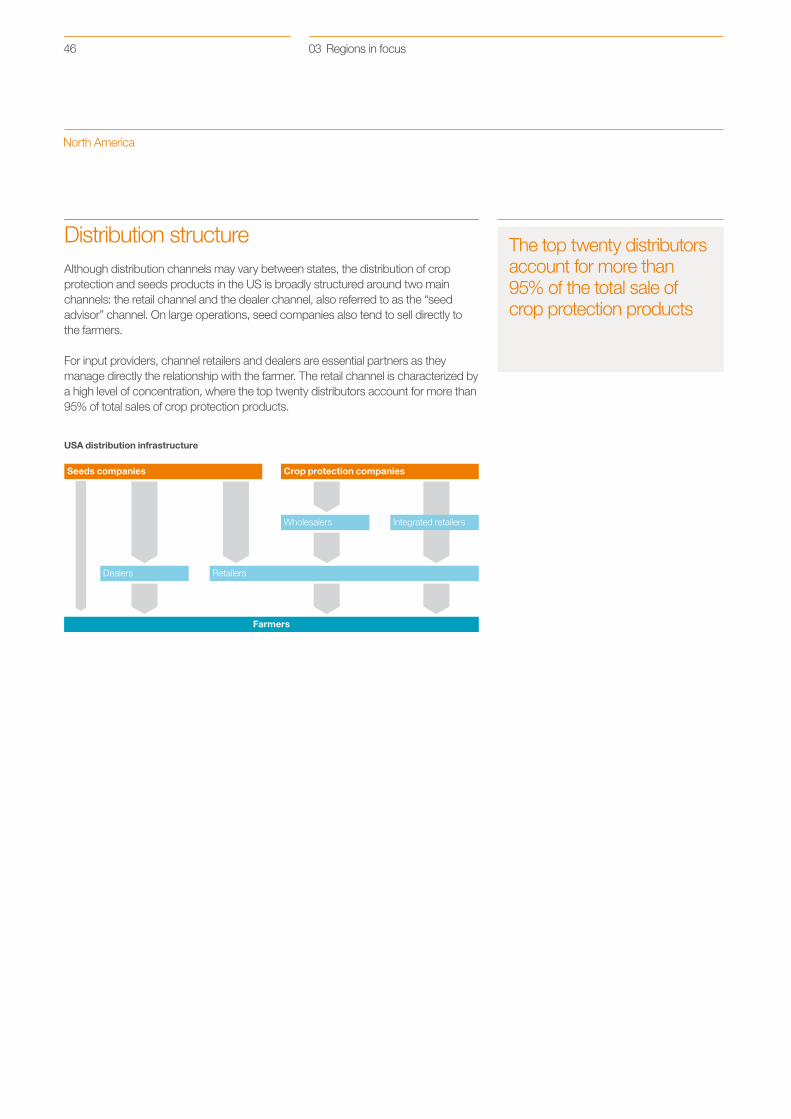
Seeds companies Crop protection companies
Wholesalers Integrated retailers
Retailers
Farmers
Dealers
North America
Distribution structureAlthough distribution channels may vary between states, the distribution of crop protection and seeds products in the US is broadly structured around two main channels: the retail channel and the dealer channel, also referred to as the “seed advisor” channel. On large operations, seed companies also tend to sell directly to the farmers.
For input providers, channel retailers and dealers are essential partners as they manage directly the relationship with the farmer. The retail channel is characterized by a high level of concentration, where the top twenty distributors account for more than 95% of total sales of crop protection products.
USA distribution infrastructure
The top twenty distributors account for more than 95% of the total sale of crop protection products
46 Regions in focus03

North America
Subsidies (US Farm Bill)Government subsidies play a large role in the US agricultural sector. Under “The Agricultural Act of 2014” (2014 US Farm Bill) total expenditure over the next 10 years is estimated at $956 billion for the entire legislation. The legislation, which remains in effect for five years, covers 12 titles and over 450 provisions driving commodity support, conservation, international food aid, nutrition assistance, farm credit, rural development, forestry, energy, horticulture, regulatory reforms and crop insurance.
Around 20% of the mandatory dollars committed under the 2014 Farm Bill will provide domestic support for farmers and ranchers mainly through government-backed crop insurance and support programs. The remaining 80% of the Farm Bill expenditures cover nutrition programs such as The Emergency Food Assistance Program and the Supplemental Nutrition Assistance Program (food stamps).
Under the 2014 US Farm Bill, farmers will receive support through a variety of federal programs:
■■ Commodity programs providing price and income support
■■ Crop insurance offered to farmers at favorable rates
■■ Conservation programs to assist producers and landowners in adopting activities that protect and improve the environment
Public-private partnershipsIn North America, the use of public-private partnerships has been growing over the past 20 years. More U.S. states are using private initiatives to develop and maintain public infrastructure, healthcare, and agricultural programs following the trend seen in markets such as the UK and Canada. From 2005 to 2014, 48 public-private infrastructure transactions with an aggregate value of $61 billion reached the formal announcement phase in the US.
In agriculture, pollinator health is one of the most recent examples of public-private partnership activity. In its 2015 report, the White House Pollinator Health Task Force identified strongly built public-private partnerships as a central element of their strategy to reinvigorate pollinator health.
Around 20% of the 2014 US Farm Bill will provide domestic support for farmers and ranchers
47Regions in focus 03

Crops in focus
04

China: large-scale production model, major soybean importersAsia: largest vegetable and rice producer
EU28: net importersCIS: increasing export share, largest oilseeds producers
Production gap,unmet demand
Major soybean and meat exporters,largest sugar cane producer
Major grain and meat exporters
Introduction
Wheat, corn, soybean and rice account for approximately 90% of global grain consumption
There are eight major crops/crop groupings grown globally: corn, cereals, soybean, vegetables, rice, diverse field crops, sugar cane and a number of smaller more diverse crops referred to as specialty crops. These crops represent the majority of global food production and planted area worldwide.
Currently we consume 2.4 billion tons of grain per year for food, feed and fuel with four crops – corn and soybean (primarily for feed), and wheat and rice (primarily for food). Most grain is locally produced and consumed. Only a few countries, such as the United States, Brazil and Argentina, have sufficient industrial-scale grain production to contribute significantly to global trade.
Regional agriculture patterns
Source: Syngenta
49Crops in focus 04

1,009
13313%**
319
12640%**
479
439%**
725
16523%**
Introduction
Today, more than 80% of grain is locally produced and consumed
Around 24% of wheat and 41% of soybean are traded globally. Only 14% of corn, 9% of rice, 4% of sunflower and less than 3% of vegetables are traded globally, with the rest being consumed locally. In sugar cane the level of export of raw cane is minimal but the exports of processed sugar account for 33% of total production.
2014 global consumption and trade by crop
Feed crops
Food crops
■■ Relative feed use has fallen from 70% to ~60% over last decade mainly due to biofuels
■■ ~90% of the US crop is genetically modified
■■ Major producers: US, China, EU, Brazil
■■ Major exporters: US, Argentina, Brazil
■■ Major importers: Japan, Mexico, South East Asia, South Korea
■■ 70% used for human consumption
■■ Major producers: EU, China, India, Russia, US
■■ Major exporters: CIS*, US, EU, Canada, Australia
■■ Major importers: North Africa, Middle East, Southeast Asia
■■ ~80% is used as meal for animal feed
■■ 79% of the global crop is genetically modified
■■ Major producers: US, Brazil, Argentina
■■ Major exporters: US, Brazil, Argentina
■■ Major importers: China, EU
■■ 90 % of rice is grown and consumed in Asia
■■ > 50 % of the crop area is irrigated
■■ Major producers: China, India. Indonesia, Bangladesh
■■ Major exporters: India, Thailand, Vietnam
■■ Major importers: Middle East, Philippines, Nigeria, China
Wheatmillions of tons (Mt)
Cornmillions of tons (Mt)
Ricemillions of tons (Mt)
Soybeanmillions of tons (Mt)
Consumption Trade (export)
* Commonwealth of Independent States (former Soviet Republic)** Trade as % of production
Sources: USDA; ISAAA
50 Crops in focus04

Jun Jul Aug Sep Oct Nov Dec Jan Feb Mar Apr May Jun Jul Aug Sep Oct Nov Dec
Winter crop
Spring crop
Winter cropSpring crop
1st Harvest
2nd Harvest
1st Harvest
2nd Harvest
Crop 1
Crop 2
Winter crop
Summer crop
Crop 1
Crop 2
Crop 3
Cereals
Corn
Soybean
Rice
EU
US
Australia
South America
Japan
Thailand
India
Vietnam
US
USBrazilArgentina
China
EU
US
Brazil
Argentina
Jan Feb Mar Apr May Jun Jul Aug Sep Oct Nov Dec
EU
CIS
Brazil
Center South
Brazil
Northeast
Canada
EUCIS
Sunflower
Sugar cane
Canola
Winter oilseed rape
Planting
Planting
Planting
Harvesting
Harvesting
Harvesting
Harvesting
Harvesting
Harvesting
Harvesting Harvesting
Planting
Planting
PlantingPlanting
Planting
Planting
Introduction
Crop seasons for global agriculture: major grains
Crop seasons for global agriculture: oilseeds and sugar cane
Sources: Phillips McDougall; Syngenta
Source: Syngenta
51Crops in focus 04

10
15
20
25
30
35
0
100
200
300
400
500
12 13 14 15E1110090807060504030201
Corn
It takes ~950 liters of water to grow one kilogram of corn
Corn production is largely driven by animal feed requirements, which account for 60% of demand
One planted seed delivers over 500 kernels of corn
Corn (also known as maize) is widely cultivated throughout the world, resulting in more tons produced each year than any other grain. Feed use has fallen from 70% to ~60% over the last decade, mostly due to growth in biofuels. Given that ~60% of corn is still used for animal feed, a key driver of future growth will be meat consumption and demand. The underlying feed demand for corn will continue to grow as protein consumption grows in emerging markets. As far as non-food and feed uses are concerned, the main factor will continue to be US demand for ethanol. Currently around 36% of US corn production is used for ethanol. Another important outlet for corn products after feed and fuel is industrial use, in particular starch and sweeteners.
Stocks-to-use ratio*%
Crop price indexMay 2001 = 100
* Current prices, stocks estimated by end of marketing seasonPrices: last update April 2016
Source: WASDE, Bloomberg and Syngenta analysis
52 Crops in focus04
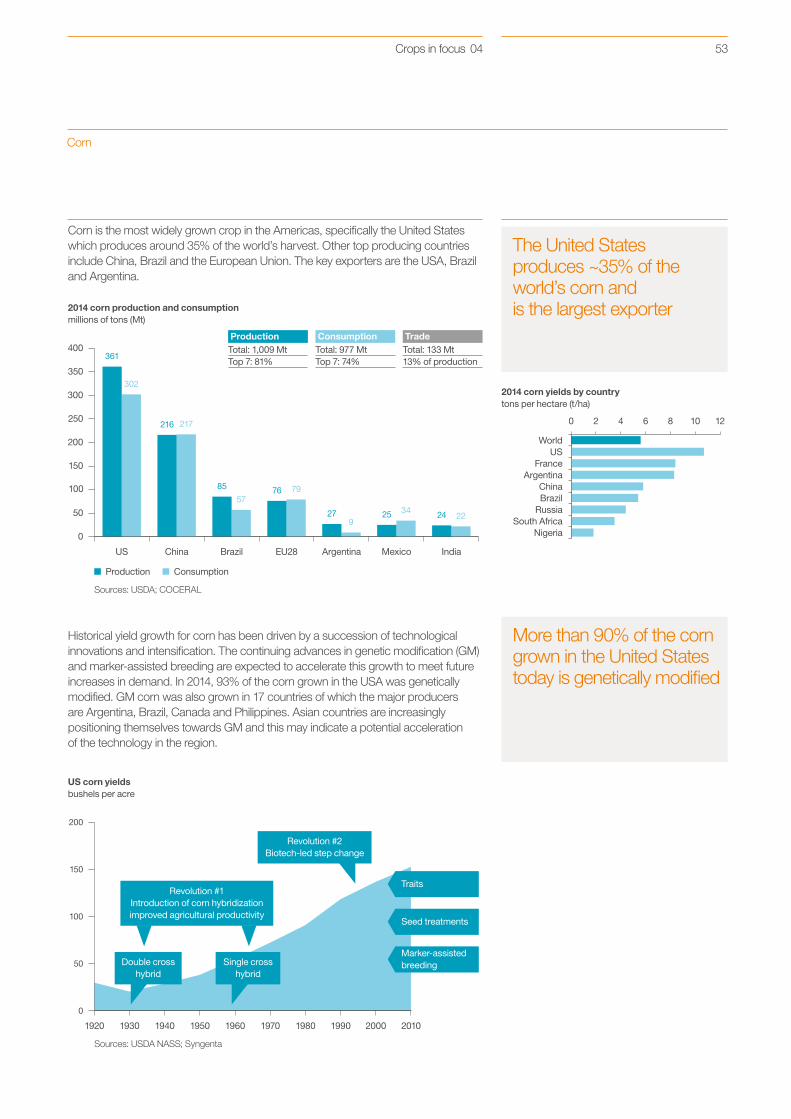
0
50
100
150
200
250
300
350
400
216
85 76
934 24
361
ProductionTotal: 1,009 MtTop 7: 81%
ConsumptionTotal: 977 MtTop 7: 74%
TradeTotal: 133 Mt13% of production
IndiaMexicoArgentinaEU28BrazilChinaUS
302
217
5779
27 25 22
Production Consumption
0 2 4 6 8 10 12
USWorld
Brazil
Argentina
RussiaSouth Africa
Nigeria
France
China
0
50
100
150
200
1920 1930 1940 1950 1960 1970 1980 1990 2000 2010
Revolution #1Introduction of corn hybridizationimproved agricultural productivity
Revolution #2Biotech-led step change
Double crosshybrid
Single crosshybrid
Marker-assisted breeding
Seed treatments
Traits
Corn
The United States produces ~35% of the world’s corn and is the largest exporter
More than 90% of the corn grown in the United States today is genetically modified
Corn is the most widely grown crop in the Americas, specifically the United States which produces around 35% of the world’s harvest. Other top producing countries include China, Brazil and the European Union. The key exporters are the USA, Brazil and Argentina.
Historical yield growth for corn has been driven by a succession of technological innovations and intensification. The continuing advances in genetic modification (GM) and marker-assisted breeding are expected to accelerate this growth to meet future increases in demand. In 2014, 93% of the corn grown in the USA was genetically modified. GM corn was also grown in 17 countries of which the major producers are Argentina, Brazil, Canada and Philippines. Asian countries are increasingly positioning themselves towards GM and this may indicate a potential acceleration of the technology in the region.
2014 corn production and consumptionmillions of tons (Mt)
Sources: USDA; COCERAL
Sources: USDA NASS; Syngenta
2014 corn yields by countrytons per hectare (t/ha)
US corn yieldsbushels per acre
53Crops in focus 04

10
15
20
25
30
35
0
100
200
300
400
500
12 13 14 15E1110090807060504030201
Cereals
80% of wheat production is used for food
Wheat is grown in over 120 countries worldwide on ~230 million hectares, producing around ~700 million tons of grain
There is no GM trait in wheat today
Wheat is the principal cereal cultivated worldwide accounting for about 68% of global cereals production. In 2014, world production of wheat was 725 million tons, making it the second most produced grain after corn. With around 80% of the crop being used for food, wheat consumption is driven primarily by population growth. Feed use at ~20% is the next largest outlet, and this has been growing recently as wheat has been competitive with alternative crops such as corn and sorghum. A new and additional use is biofuels which, while growing, still represents only a minor portion of consumption.
Wheat is grown on more hectares worldwide than any other crop and likewise is distributed over a wider range of countries, China being the major individual producer. The major exporters are the CIS, United States, Canada and the European Union. Currently, there is no genetic modification in wheat due to strong public opposition. Recently, however, Canadian, US and Australian wheat industry groups have voiced their support of GM technology.
* Current prices, stocks estimated by end of marketing seasonPrices: last update April 2016
Source: WASDE, Bloomberg and Syngenta analysis
Stocks-to-use ratio*%
Crop price indexMay 2001 = 100
54 Crops in focus04
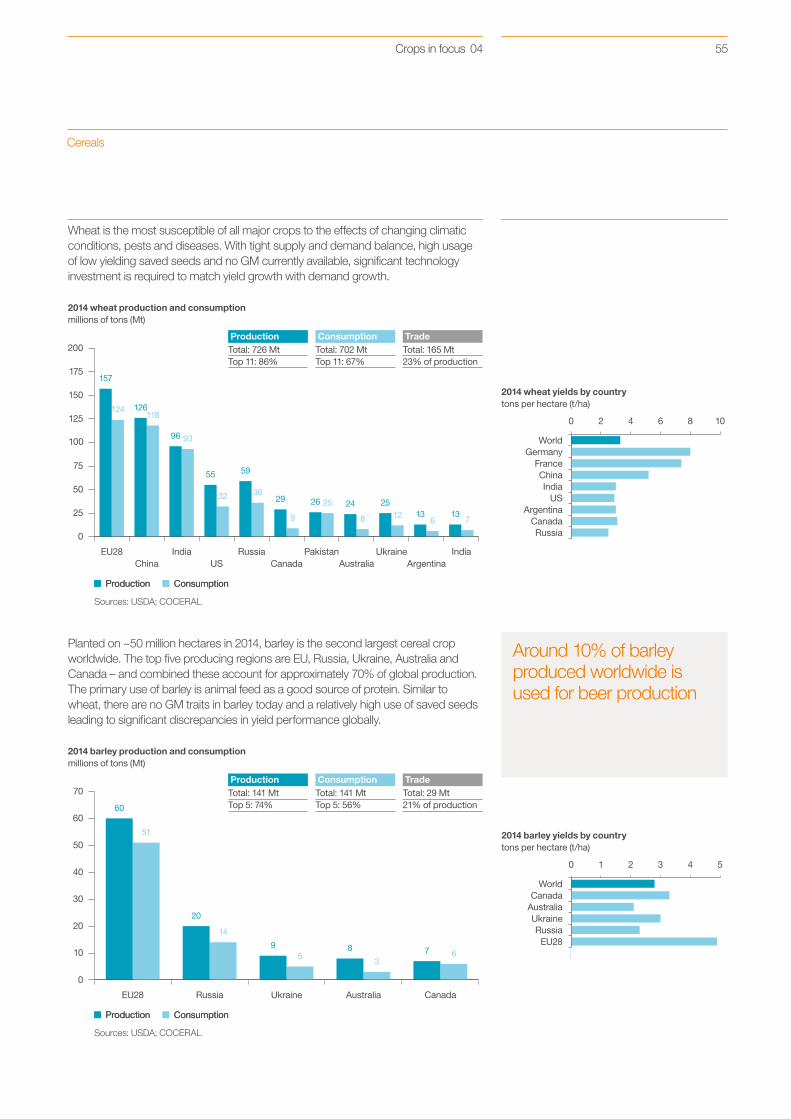
0
25
50
75
100
125
150
175
200
96
126
55 59
25
9 8 13 1325
157
Production ConsumptionProduction Consumption
ProductionTotal: 726 MtTop 11: 86%
ConsumptionTotal: 702 MtTop 11: 67%
TradeTotal: 165 Mt23% of production
ArgentinaUkraine
AustraliaPakistan India
CanadaRussiaEU28 India
China US
124
93
118
32 362629 24
7612
0 2 4 6 8 10
GermanyWorld
US
China
ArgentinaCanadaRussia
France
India
0
10
20
30
40
50
60
70
20
9 8 7
60
Production ConsumptionProduction Consumption
ProductionTotal: 141 MtTop 5: 74%
ConsumptionTotal: 141 MtTop 5: 56%
TradeTotal: 29 Mt21% of production
CanadaUkraine AustraliaRussiaEU28
51
14
53
6
0 1 2 3 4 5
CanadaWorld
EU28
UkraineAustralia
Russia
Cereals
Around 10% of barley produced worldwide is used for beer production
Wheat is the most susceptible of all major crops to the effects of changing climatic conditions, pests and diseases. With tight supply and demand balance, high usage of low yielding saved seeds and no GM currently available, significant technology investment is required to match yield growth with demand growth.
Planted on ~50 million hectares in 2014, barley is the second largest cereal crop worldwide. The top five producing regions are EU, Russia, Ukraine, Australia and Canada – and combined these account for approximately 70% of global production. The primary use of barley is animal feed as a good source of protein. Similar to wheat, there are no GM traits in barley today and a relatively high use of saved seeds leading to significant discrepancies in yield performance globally.
2014 wheat yields by countrytons per hectare (t/ha)
2014 barley production and consumptionmillions of tons (Mt)
2014 barley yields by countrytons per hectare (t/ha)
Sources: USDA; COCERAL
Sources: USDA; COCERAL
2014 wheat production and consumptionmillions of tons (Mt)
55Crops in focus 04

0
50
100
150
200
250
300
350
201020001990198019701960
Harvested area (Mha)Production (Mt)
+383%
+1,017%
10
15
20
25
30
35
0
100
200
300
400
500
12 13 14 15E1110090807060504030201
Soybean
Soybeans can produce twice as much protein per hectare as any other crop
~80% of the soybean crop is used for animal feed
Soybean is an important global crop, providing protein and oil; ~80% of the soybean crop is used as meal for animal feed, with the remainder used either directly for food or in a wide range of industrial products.
Population growth and increasing meat consumption per capita will continue to drive demand for soybean production in the future. China is continuing to increase its imports in the medium term, and Latin America is expected to be the main supplier of this growth. The US is expected to remain a strong exporter.
Stocks-to-use ratio*%
Global production
Crop price indexMay 2001 = 100
* Current prices, stocks estimated by end of marketing seasonPrices: last update April 2016
Source: WASDE, Bloomberg and Syngenta analysis
Source: USDA
56 Crops in focus04
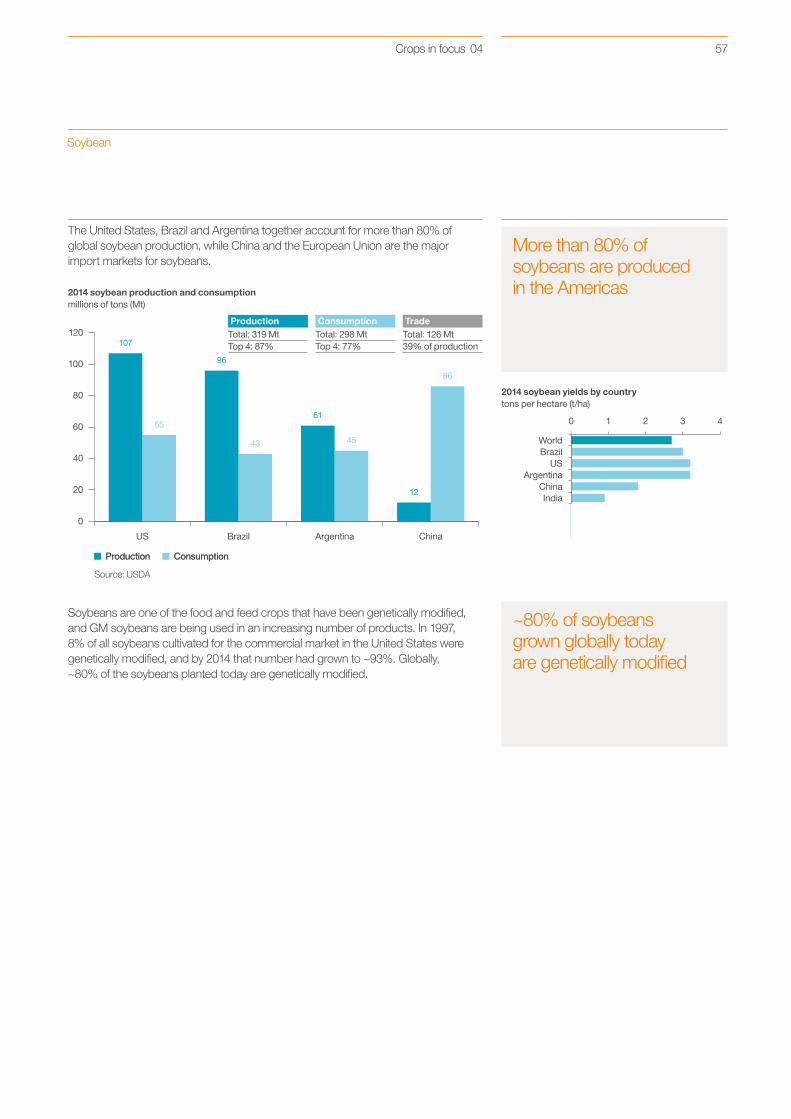
0 1 2 3 4
BrazilWorld
India
ArgentinaUS
China
0
20
40
60
80
100
120
96
61
12
107
Production ConsumptionProduction Consumption
ProductionTotal: 319 MtTop 4: 87%
ConsumptionTotal: 298 MtTop 4: 77%
TradeTotal: 126 Mt39% of production
ChinaArgentinaBrazilUS
55
43 45
86
Soybean
More than 80% of soybeans are produced in the Americas
~80% of soybeans grown globally today are genetically modified
The United States, Brazil and Argentina together account for more than 80% of global soybean production, while China and the European Union are the major import markets for soybeans.
Soybeans are one of the food and feed crops that have been genetically modified, and GM soybeans are being used in an increasing number of products. In 1997, 8% of all soybeans cultivated for the commercial market in the United States were genetically modified, and by 2014 that number had grown to ~93%. Globally, ~80% of the soybeans planted today are genetically modified.
2014 soybean production and consumptionmillions of tons (Mt)
Source: USDA
2014 soybean yields by countrytons per hectare (t/ha)
57Crops in focus 04

0
20
40
60
80
100
120
140
160
105
36 3528
1912 11 7
145
Production ConsumptionProduction Consumption
ProductionTotal: 479 MtAPAC: 82%
ConsumptionTotal: 482 MtAPAC: 78%
TradeTotal: 43 Mt9% of production
USPhillippinesVietnamIndonesiaMyanmarThailandBangladeshIndia
China
148
99
39 35
2212 13 10
4
0 2 4 6 8 10
USWorld
Bangladesh
Vietnam
PhilippinesIndia
Thailand
China
Indonesia
10
15
20
25
30
35
0
100
200
300
400
500
600
12 13 14 15E1110090807060504030201
Rice
Around 80% of rice is grown and consumed in Asia
More than one billion people depend on rice cultivation for their livelihood
Annual per capita rice consumption in Asia is 85 kg, seven times that of the United States
Rice is the most important staple food for a large part of the world’s human population. The growth in demand for rice is correlated to population growth and is expected to be around 1% per annum.
There are three main challenges surrounding the largest global food crop. The first is to accelerate the yield productivity growth trend, highlighted by the biggest producing regions, South and South East Asia, delivering inconsistent yields at 60% below their estimated potential. Secondly, the current growing methods have a substantial reliance on labor that must be reduced. More than 80% of rice is planted by hand and with labor availability increasingly scarce, labor costs continue to escalate. Finally, excessive losses during and after harvest can reach up to 40%. To solve these challenges a more comprehensive approach to rice planting is required, with substantial up-scaling of agricultural input quality and intensification, complemented by agronomic education and infrastructure improvement.
2014 rice yields (unmilled) by countrytons per hectare (t/ha)
2014 rice production (milled) and consumptionmillions of tons (Mt)
Stocks-to-use ratio*%
Crop price indexMay 2001 = 100
* Current prices, stocks estimated by end of marketing seasonPrices: last update April 2014
Source: WASDE, Bloomberg and Syngenta analysis
Source: USDA
58 Crops in focus04

Fresh 70%Processed 30%
US$~600 billion
China 52%India 11%Rest of Asia 16%Europe 8%Africa 6%United States 3%Central & South America 4%
~1.3 billiontons
Solonaceae 43%Cucurbit 17%Root & Bulb 19%Brassica 9%Leafy 4%Large seed vegetables 8%
US$4.7 bn
Vegetables
Input value ~US$ 16 billion, production value ~US$ 600 billion
The cost of seeds for some high value tomato varieties can be more than double the cost of the equivalent weight in gold
Around 75% of the 1 billion tons of global vegetable production takes place in Asia and over 60% of global production is consumed by 3 countries: China, India and the United States.
The vegetables market is divided into 6 main crop groupings and 17 major crops:
Solanaceae Tomato, pepper, eggplant
CucurbitMelon, watermelon, cucumber, squash
Root & bulb Onion, carrot
Brassica Cabbage, cauliflower, broccoli
Leafy Lettuce, spinach
Large seedvegetables
Beans, peas, sweet corn
The input value (crop protection, seeds, fertilizer) to the crop represents around 3% of the ~US$ 600 billion production value of which around US$ 4.5 billion relates to seeds.
Key demand drivers for vegetables are population growth, GDP evolution, evolving customer preference for fresh produce and a willingness in developed markets to pay a premium for different appearance, taste or color. Given these drivers, the largest future growth market is expected to be Asia.
There is a significant difference both in tastes and production methods in the emerging and developed markets. Emerging markets tend to be dominated by small growers focusing on individual products and supplying small, local market places. On the opposite side are the developed markets where vegetables production is well established and reliable suppliers and growers are essential, as are efficient supply chains. Consumer and retailer needs play an important part in shaping the product offerings in the developed markets.
Understanding customer needs is critical, and the value chain and customer requirements are complex. Customers from a grower’s perspective include traders, retailers and end consumers, each having their own requirements all of which ultimately must be delivered by the grower.
Production value Global production volume
Source: FAO, 2013
Global vegetables seeds marketby crop group
Source: Syngenta analysis
59Crops in focus 04

0
2
4
6
8
10
12
8.9 8.9
3.22.4
1.0 1.2
10.2
Production ConsumptionProduction Consumption
ProductionTotal: 40 MtTop 4: 81%
ConsumptionTotal: 40 MtTop 4: 74%
TradeTotal: 2 Mt5% of production
TurkeyUSChinaArgentinaEU28RussiaUkraine
10.3
9.28.6
2.92.2
0.91.7
0.0 0.5 1.0 1.5 2.0 2.5 3.0
ArgentinaWorld
Ukraine
US
Australia
Turkey
EU28
0
50
100
150
200
250
Corn Oil
Coconut Oil
Groundnut Oil
Cottonseed Oil
Palm Kernal Oil
Palm Oil
Sun�ower Oil
Rapeseed Oil
Soybean Oil
2020E 2025E2015E201020052000
Demand 2014
Diverse field crops
Demand for vegetable oils has increased at > 3% per annum since 2000
Russia and Ukraine account for around 53% of global sunflower production; Ukraine is the biggest sunflower oil exporter
Diverse field crops include sunflower, oilseed rape (canola) and sugar beet. Sunflower and oilseed rape both produce high value vegetable oils, characterized by their healthy composition with a larger proportion of unsaturated fats which are critical to today’s diets. As such they are the most valuable vegetable oils and particularly targeted for food uses. With demand for vegetable oils increasing at more than 3% per annum, these crops play an extremely important role in meeting future demand.
Sunflower is widely grown in the emerging markets of Russia, Ukraine and Argentina where it is an important crop due to its stable growing patterns even under adverse climatic conditions. In addition low input costs make it particularly attractive in these markets. With a drive towards higher yielding varieties and native trait adoption, the market has seen a substantial shift from local genetics to high value hybrids. This market evolution is expected to continue, and will be an important driver in meeting the increase in demand.
Sources: USDA; COCERAL
2014 sunflower yields by countrytons per hectare (t/ha)
2014 sunflower production and consumptionmillions of tons (Mt)
Global vegetable oil productionmillions of tons 2000-2025 (Mt)
Source: LMC
60 Crops in focus04

0 1 2 3 4
EU28World
Australia
Canada
UkraineUS
China
India
0
5
10
15
20
25
30
1516
6
32
1
24
Production ConsumptionProduction Consumption
ProductionTotal: 72 MtTop 4: 85%
ConsumptionTotal: 71 MtTop 4: 83%
TradeTotal: 15 Mt21% of production
UkraineAustraliaIndiaCanada USChinaEU28
26
19
86
1 12
Diverse field crops
United States sugar beet has already reached 97% GM adoption
Over 50% of Canada’s rapeseed is exported
Oilseed rape dominates the productive farm lands of northern countries such as Canada, Germany, France and UK where it is grown by sophisticated farmers. China is also an important oilseed rape growing country with production representing over 22% of the world’s harvest, all of which is consumed locally.
Oilseed rape and sunflower are frequently grown in crop rotation with other field crops such as wheat or corn and farmed in an environmentally sustainable way. Both crops are highly adapted to their respective environments, provide good returns to growers and positively contribute to environmentally sustainable farming.
Sugar beet is responsible for around 20% of the global sugar production worldwide. Sugar beet is a root crop which grows in temperate zones with a very intense and demanding cultivation. It is therefore mainly concentrated in the Northern Hemisphere, where it is an important rotational crop, specifically in Europe. France is the biggest worldwide producer of sugar beet followed by US, Germany, Russia and Ukraine. France is also the biggest European producer of sugar.
Sugar beet growers have quickly adopted GM technology. The glyphosate tolerant trait, launched in 2007, today covers 97% of the area planted in the USA, having already reached 60% adoption in the second year of launch.
2014 winter oilseed rape production and consumptionmillions of tons (Mt)
Sources: USDA; COCERAL
2014 winter oilseed rape yields by countrytons per hectare (t/ha)
61Crops in focus 04
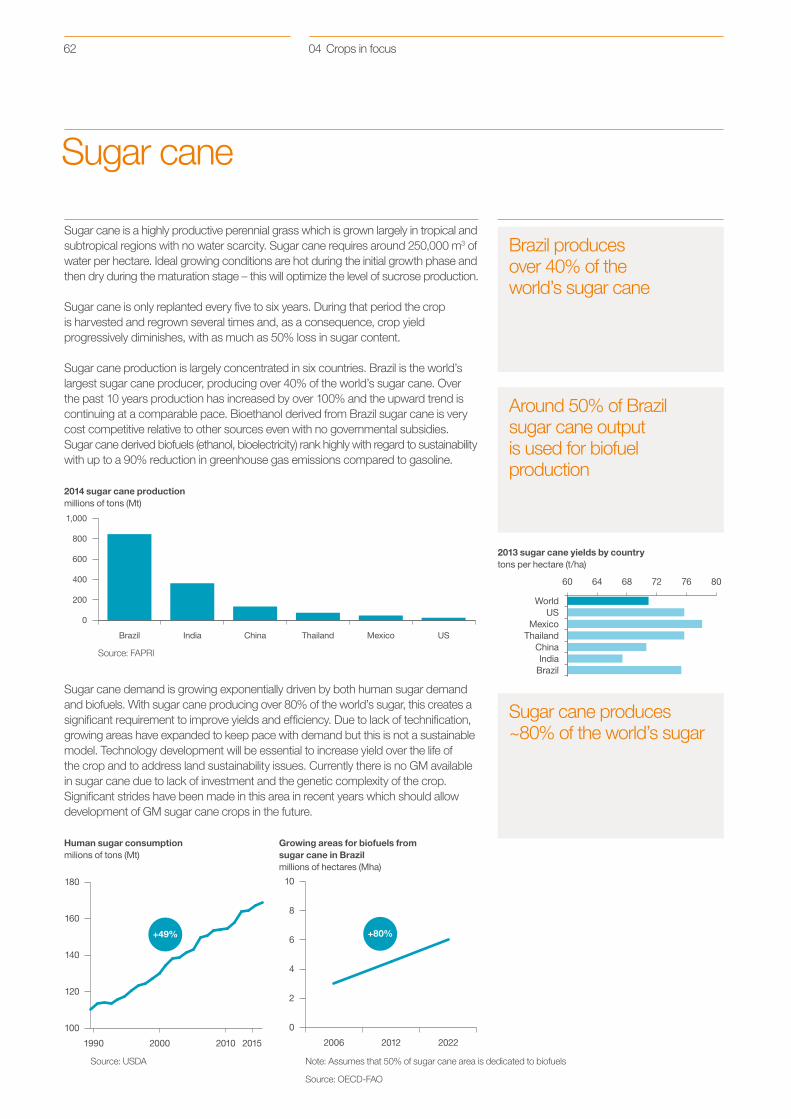
60 64 68 72 76 80
USWorld
India
Thailand
Brazil
Mexico
China
0
200
400
600
800
1,000
USMexicoThailandChinaIndiaBrazil
100
120
140
160
180
2015201020001990
+49%
0
2
4
6
8
10
202220122006
+80%
Source: FAPRI
Sugar cane
Brazil produces over 40% of the world’s sugar cane
Around 50% of Brazil sugar cane output is used for biofuel production
Sugar cane produces ~80% of the world’s sugar
Sugar cane is a highly productive perennial grass which is grown largely in tropical and subtropical regions with no water scarcity. Sugar cane requires around 250,000 m3 of water per hectare. Ideal growing conditions are hot during the initial growth phase and then dry during the maturation stage – this will optimize the level of sucrose production.
Sugar cane is only replanted every five to six years. During that period the crop is harvested and regrown several times and, as a consequence, crop yield progressively diminishes, with as much as 50% loss in sugar content.
Sugar cane production is largely concentrated in six countries. Brazil is the world’s largest sugar cane producer, producing over 40% of the world’s sugar cane. Over the past 10 years production has increased by over 100% and the upward trend is continuing at a comparable pace. Bioethanol derived from Brazil sugar cane is very cost competitive relative to other sources even with no governmental subsidies. Sugar cane derived biofuels (ethanol, bioelectricity) rank highly with regard to sustainability with up to a 90% reduction in greenhouse gas emissions compared to gasoline.
Sugar cane demand is growing exponentially driven by both human sugar demand and biofuels. With sugar cane producing over 80% of the world’s sugar, this creates a significant requirement to improve yields and efficiency. Due to lack of technification, growing areas have expanded to keep pace with demand but this is not a sustainable model. Technology development will be essential to increase yield over the life of the crop and to address land sustainability issues. Currently there is no GM available in sugar cane due to lack of investment and the genetic complexity of the crop. Significant strides have been made in this area in recent years which should allow development of GM sugar cane crops in the future.
Source: USDA Note: Assumes that 50% of sugar cane area is dedicated to biofuels
Source: OECD-FAO
Human sugar consumptionmilions of tons (Mt)
Growing areas for biofuels from sugar cane in Brazilmillions of hectares (Mha)
2013 sugar cane yields by countrytons per hectare (t/ha)
2014 sugar cane productionmillions of tons (Mt)
62 Crops in focus04

Citrus and pome US$70bnPotato US$55bnGrape US$40bnPlantation US$40bnCotton US$30bnOther crops US$270bn
US$~500billion
Specialty crops
Five major crops represent ~45% of the total farmgate value
China is the largest producer of cotton, most of it used domestically. The United States is the largest exporter
Potatoes are the third largest food crop after rice and wheat
Potatoes produce two times more calories per liter of water than rice
Specialty crops represent a collection of more than 40 diverse crops spanning the major fruit crops, potatoes and cotton, as well as plantation crops such as coffee and cocoa. Specialty crops are grown throughout the year in all regions and have a total farmgate value in excess of US$ 500 billion. There are significant yield differences in many of these crops, depending on where and how they are grown, agronomic practices and degree of technification.
All regions have a diverse range of specialty crops specific to the agronomic conditions within that region:
Europe Grape, potato, citrus, pome
North America Potato, cotton, citrus, pome
Latin America Cotton, citrus, banana, coffee
Asia Pacific Potato, cotton, pome
Specialty crops encompass a multitude of end uses, from high value niche segment consumables such as chocolate and wine, through to broader segment end uses including textiles, tires and cooking oil.
The key food crops within specialty crops have many similar characteristics to vegetables in terms of demand drivers and grower challenges. Like vegetables, a significant proportion of the market exists in Asia Pacific and as such many crops will experience above-average demand growth linked to GDP advancement and the subsequent increased desire for more variety of fresh produce. In developed markets the need for shelf life, quality and convenience means consumers are willing to pay significant premia for high-quality produce.
One of the largest challenges facing specialty crops is the availability of labor. With high levels of production taking place in emerging markets, increasing levels of urbanization make it hard to attract labor into this sector thereby accelerating the need for technology advancement in crop management programs.
Speciality crops farmgate value
Source: Syngenta analysis
63Crops in focus 04

Technology in agriculture
05
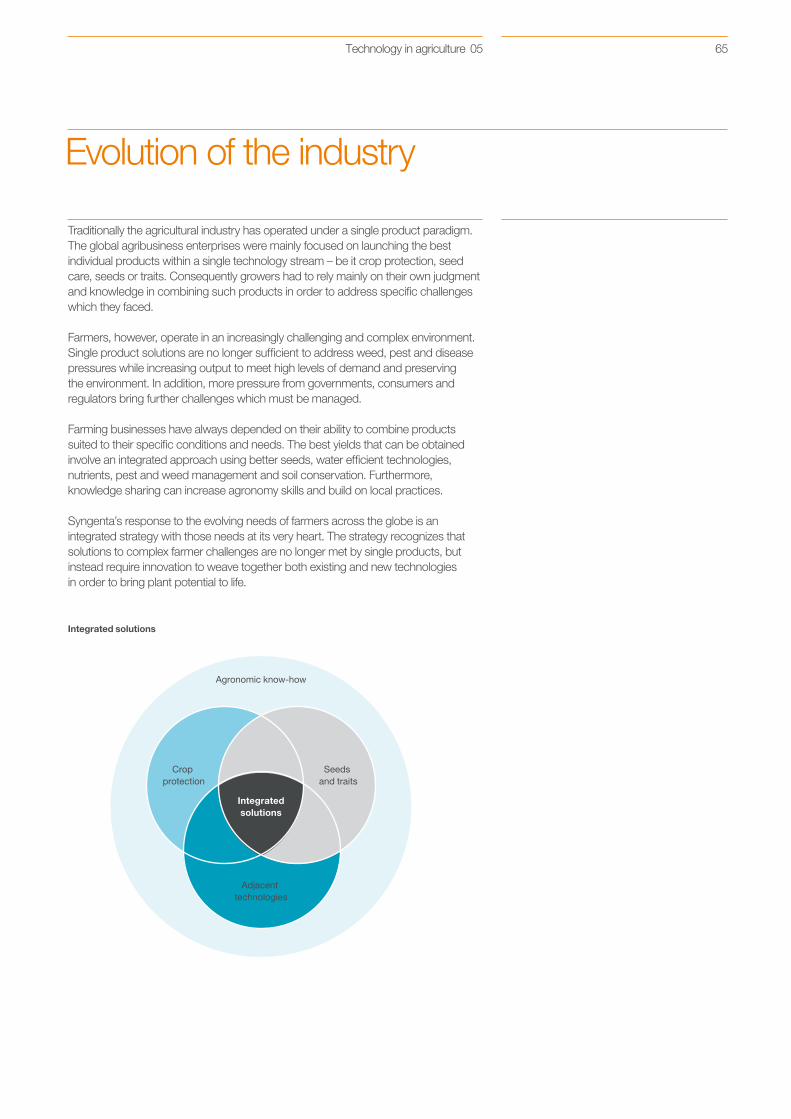
Agronomic know-how
Crop protection
Seeds and traits
Integratedsolutions
Adjacent technologies
Evolution of the industry
Traditionally the agricultural industry has operated under a single product paradigm. The global agribusiness enterprises were mainly focused on launching the best individual products within a single technology stream – be it crop protection, seed care, seeds or traits. Consequently growers had to rely mainly on their own judgment and knowledge in combining such products in order to address specific challenges which they faced.
Farmers, however, operate in an increasingly challenging and complex environment. Single product solutions are no longer sufficient to address weed, pest and disease pressures while increasing output to meet high levels of demand and preserving the environment. In addition, more pressure from governments, consumers and regulators bring further challenges which must be managed.
Farming businesses have always depended on their ability to combine products suited to their specific conditions and needs. The best yields that can be obtained involve an integrated approach using better seeds, water efficient technologies, nutrients, pest and weed management and soil conservation. Furthermore, knowledge sharing can increase agronomy skills and build on local practices.
Syngenta’s response to the evolving needs of farmers across the globe is an integrated strategy with those needs at its very heart. The strategy recognizes that solutions to complex farmer challenges are no longer met by single products, but instead require innovation to weave together both existing and new technologies in order to bring plant potential to life.
Integrated solutions
65Technology in agriculture 05

0
20
40
60
80
100
Remaining potentialExtra yield from crop protection todayYield with no crop protection
Rice Wheat Corn Soybean Cotton Potato
The role of crop protection
Without crop protection, ~40% of the world’s food would not exist
Crop protection products protect crops from damage by controlling weeds, disease and insect pressure. The widespread use of newer and more effective products since the middle of the twentieth century has increased food security and improved standards of living around the world. Crop protection products also help to safeguard public health by controlling pests that spread disease to people and livestock or cause damage to homes and property.
Weeds, insects and disease have attacked food supplies throughout human history. Only very recently, however, has modern science discovered effective ways of controlling these threats to crop yield. After 30 years of rapid growth in agricultural production, the world can currently produce enough food to provide every person with more than 2,700 kilocalories per day; this level would ensure adequate food for all if distribution distortions did not exist.
Since 1975, when the population was four billion people, crop protection products have been essential in order to produce enough to feed the global population.
Crop productivity improvements since 1961 have forestalled habitat conversion to farmland of some 980 million hectares globally; an area roughly the size of the total land area of the United States. Crop protection products are absolutely essential for raising yields and keeping pace with rising demand without encroaching on the environment.
Theoretical maximum yield on key crops%
66 Technology in agriculture05
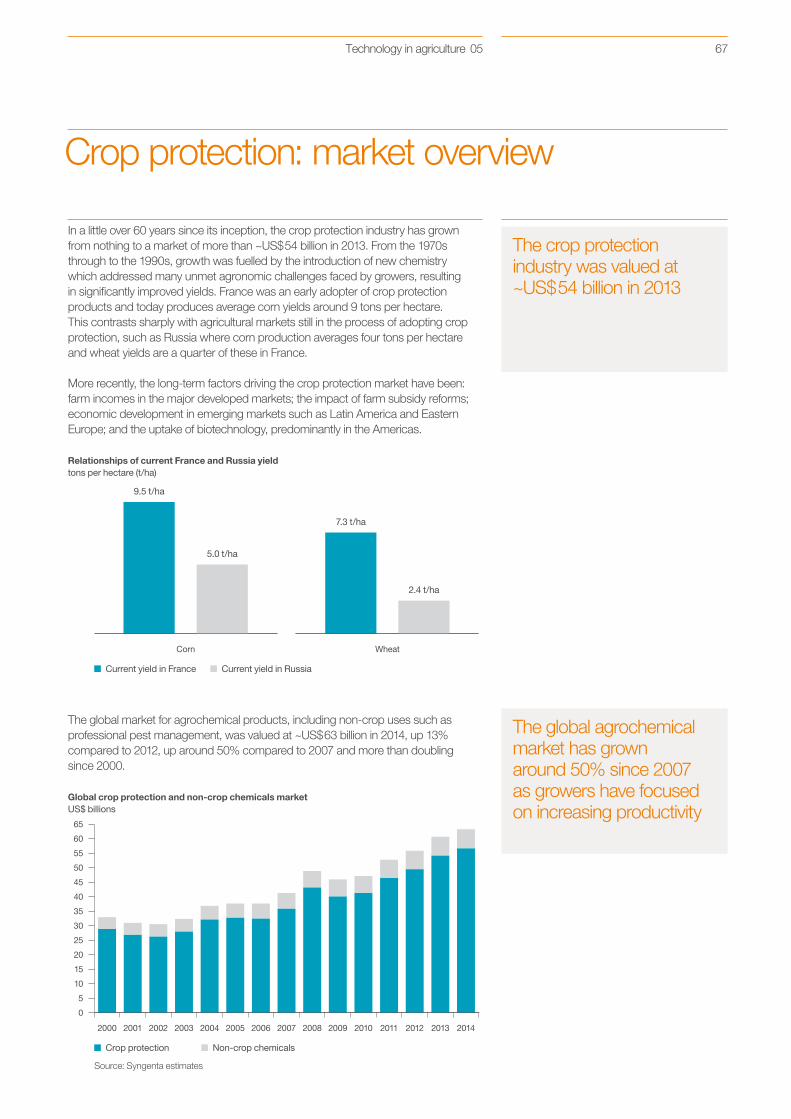
Current yield in France Current yield in Russia
Corn
9.5 t/ha
5.0 t/ha
Wheat
7.3 t/ha
2.4 t/ha
0
5
10
15
20
25
30
35
40
45
50
55
60
65
Crop protection Non-crop chemicals
2012 2013 2014201120102009200820072006200520042003200220012000
Crop protection: market overview
The crop protection industry was valued at ~US$ 54 billion in 2013
The global agrochemical market has grown around 50% since 2007 as growers have focused on increasing productivity
In a little over 60 years since its inception, the crop protection industry has grown from nothing to a market of more than ~US$ 54 billion in 2013. From the 1970s through to the 1990s, growth was fuelled by the introduction of new chemistry which addressed many unmet agronomic challenges faced by growers, resulting in significantly improved yields. France was an early adopter of crop protection products and today produces average corn yields around 9 tons per hectare. This contrasts sharply with agricultural markets still in the process of adopting crop protection, such as Russia where corn production averages four tons per hectare and wheat yields are a quarter of these in France.
More recently, the long-term factors driving the crop protection market have been: farm incomes in the major developed markets; the impact of farm subsidy reforms; economic development in emerging markets such as Latin America and Eastern Europe; and the uptake of biotechnology, predominantly in the Americas.
The global market for agrochemical products, including non-crop uses such as professional pest management, was valued at ~US$ 63 billion in 2014, up 13% compared to 2012, up around 50% compared to 2007 and more than doubling since 2000.
Relationships of current France and Russia yieldtons per hectare (t/ha)
Global crop protection and non-crop chemicals marketUS$ billions
Source: Syngenta estimates
67Technology in agriculture 05

Selective herbicides 28%Fungicides 23%Insecticides 24%Non-selective herbicides 16%Seed treatment 6%Others 3%
~US$57
billion
Crop protection products
Without fungicides, yields of most fruits and vegetables would fall by 50–90%, making fresh produce unaffordable to many
HerbicidesHerbicides control weeds that compete with crops for light and nutrients. Without weed control, crop yield can be significantly reduced. Weeds can also cause further problems by harboring pests and diseases, interfering with harvest operations, and increasing costs of cleaning and drying the crop produce. Herbicides reduce the need for cultivation and can also prevent soil erosion and water loss. Herbicides can be divided in two categories:■■ Selective herbicides: can be directly applied on specific crops to control particular
weeds without damaging the crop.■■ Non-selective herbicides (NSH): eliminate all plants (if absorbed by green tissue).
Some NSHs can now be used in the same way as selective herbicides on crops that are genetically modified in order to make them tolerant to specific herbicides. Growers also use non-selective herbicides when preparing fields for new plantings, thus avoiding the need to plough the land. “No-till agriculture” of this sort maintains soil structure and thus prevents erosion, as well as reducing emissions from ploughing tractors.
FungicidesFungicides prevent and cure fungal diseases which can have severe adverse effects on crop yield and quality. The main markets today are fruits and vegetables, cereals and rice. Plant diseases are caused by a great variety of pathogens. Accordingly, this requires many products used in combination or series to control the full range of problems in ways that minimize the chance of resistance building up.
Insecticides Insects such as caterpillars and aphids can significantly reduce crop yield and quality through their feeding. Insecticides help minimize this damage by controlling insect pests. The largest insecticide markets are in fruits and vegetables, cotton, rice and corn. In addition to their use in agriculture, insecticides play an important role in public health programs to control insect-transmitted diseases like malaria.
Seed treatmentSeed treatments are chemical or biological substances or physical processes applied to seeds or seedlings. They help to protect the seeds and assure optimum emergence of the crop. Application of a chemical to seeds is a very well-targeted method of reducing pest and disease attacks on the growing plant.
Source: Syngenta
2014 global crop protection market by product
68 Technology in agriculture05

Beyond traditional crop protection
Abiotic stress reduces agricultural potential by at least US$ 100 billion per year
With the need for food security and sustainability becoming ever greater, the science of crop protection is opening up new and exciting possibilities that will enhance the tools available to growers. These tools offer the potential to help us reduce the environmental footprint of agriculture. They can be classed into four broad groups.
BiologicalsBiologicals include naturally occurring organisms (e.g. insects, bacteria, fungi or viruses) that can be harnessed into effective crop protection or stimulant products. They offer growers new modes of action which are instrumental in helping to combat insect or disease resistance and are complementary tools to traditional agricultural chemicals. Some biologicals are also able to address problems not fully resolved by chemical products available today (e.g. soybean cyst nematodes).
Crop enhancement Simply put, crop enhancement seeks to address environmental stress through development of new technologies to enable plants to realize their full potential. Abiotic stresses such as drought, heat, cold and other local stresses reduce agricultural potential for growers by at least US$ 100 billion per year.
Over the years, growers and scientists observed and discovered the benefits of chemical products as well as biostimulants to help plants withstand difficult growing conditions and to deliver better yield, improved quality or greater stress tolerance. For example, the chemical active ingredient azoxystrobin (traditionally used as a fungicide to control diseases) when used in many crops leads to enhanced root and/or leaf growth, giving an additional yield improvement over the disease control benefit.
Nutrient efficiencyNutrient availability in soils can be variable, resulting in plants not fulfilling their full potential. Innovative products designed to boost nutrient solubility in soils and nutrient availability in crops are becoming more available. Such products can help optimize the amount of fertilizers that need to be added to soils, increase yields and improve sustainability of crop production.
Crop farming practiceToday, modern farming benefits from a wealth of analysis and data – e.g. field topography, soil analytics, microclimate weather analytics and production history. Compiling and converting this data into meaningful information specific to a particular grower environment is now becoming possible. Such information can then be further developed into integrated and actionable grower advice – such as product recommendations and application instructions.
69Technology in agriculture 05

305,000140,000 1–3 1 1 1 1 1 1
~US$70
~US$ 25
~US$80
~US$85
~US$ 260
Estimated costUS$ millions*
Year
Toxicology
Environment
Registration
Compounds
Chemistry– synthesis– formulation of product
Biology– research– trials– �eld development
Research optimization
Early development
Late development
0 1 2 3 4 5 6 7 8 9
R&D in crop protection
The crop protection industry is one of the most highly regulated industries in the world
Approximately 30% of the cost of a new active ingredient is spent on product safety
Crop protection products are vital to the production of a safe, affordable and abundant supply of crops.
The crop protection industry is one of the most highly regulated industries in the world. The registration of a product requires demonstration of safety for workers, for all aspects of the environment, for the crops that are being protected and for the food that is eaten. Sophisticated risk assessments are made based on data from hundreds of safety studies and an understanding of Good Agricultural Practice.
All aspects of production, manufacturing and distribution are regulated. National and EU agencies monitor food safety on a continual basis. Most food contains no detectable pesticide residues. When residues do occur they must be below a Maximum Residue Level (MRL), which is a legal standard showing that approved agricultural practices have been followed. MRLs are set following risk assessments ensuring that the exposure levels to consumers will be well below the levels at which any harm could occur. The acceptable daily intake (ADI) and acute reference dose (ARfD) are set based on safety testing to determine the “no observable adverse effect levels” (NOAEL), with additional safety factors of 100 or 1,000 built in. Whole diet studies show that any possible health risks from pesticide residues are so small as to be insignificant (“notional zero risk”).
A significant amount of time and money must be invested into the registration of a crop protection product. The chance of a discovery compound passing all the many safety and efficacy tests on the way to market is about 1 or 2 in 100,000 and, on average, it can take 8–10 years and around US$ 260 million before commercial launch.
* Estimate excludes cost of failures
Sources: CropLife International; Syngenta
Discovery and development of a crop protection product
70 Technology in agriculture05

0
10
20
30
40
50
60
Conventional seeds Genetically modi�ed seeds
2012 2013 201420112010200920082007200620052004200320022001
NAFTA 33%US$17 billion
EAME 22%US$11 billion
APAC 29%US$15 billion
LATAM 16%US$8 billion
Seeds: market overview
North America and Europe: over 50% of the global seeds market
Since 2000, the global seeds market has grown almost 90% reaching more than US$ 50 billion in 2014
The seeds industry has changed dramatically over the past century, with farmers increasing the amount of purchased seed instead of using seed saved from the previous harvest. Advances in seed technology have accelerated through marker-assisted breeding. Since 1996 the industry has been further shaped by the introduction of genetically modified (GM) crops. Since 2000, the global seeds market has almost tripled, reaching approximately US$ 51 billion in 2014. Growth has occurred in both conventional and genetically modified seeds over that period, with cumulative growth rates of ~100% and ~600%, respectively.
In the future, growth will come from a range of crops. The market is expected to continue to grow to over US$ 60 billion by 2020, primarily due to the continuing improvement of seed quality and hybridization as well as further penetration of GM globally. The seeds industry is concentrated in more industrialized and developed economies, with North America and Europe accounting for over 50% of the total seeds industry in 2014.
2014 global seeds market by regionUS$ billions
Source: Syngenta
* All crops, commercial and public seeds, Excludes flowers
Source: Context; Syngenta estimates
Global seeds market*US$ billions
71Technology in agriculture 05
Plant breeding history
The first hybridized crops were introduced in the 1920s
Since the practice of agriculture began 10,000 years ago, farmers have been conducting ‘plant breeding’. Initially farmers simply selected food plants with particular desirable characteristics, and used these as a seed source for subsequent generations, resulting in an accumulation of characteristics over time. However, over time experiments began with deliberate hybridization.The science of plant breeding made huge progress based on the work of Gregor Mendel toward the end of the 19th century.
By the 1920s, the first hybridized crops were introduced, bringing tremendous yield improvements to some crops. In 1953 Watson and Crick discovered the structure of DNA. This would soon lead to the advent of marker assisted breeding and to a revolution in the science of crop improvement.
Until the 1980s, breeding science consisted of crossing plants within the same or related species. But in 1983 the first genetically modified plant was produced, opening the possibility to improve crops with completely novel characteristics: biotechnology became an additional technology in the breeder’s toolbox. Today breeding has become an information science utilizing teams of computational biologists empowered by the processing power of supercomputer and advanced modeling techniques.
You can find more information about some of the modern breeding technologies mentioned in the following section.
72 Technology in agriculture05

High tech**Low tech*Global
8.4
4.0
5.6
High tech**Low tech*Global
4.8
2.43.1
High tech**Low tech*Global
2.91.7
2.7
High tech**Low tech*Global
4.3
2.73.3
Benefits of hybridization
Yield generally correlates with the quality of the seeds grown
The introduction of hybrid seeds led to one of the biggest science-based jumps in crop productivity. Hybridization is a traditional breeding process in which two inbred lines from diverse backgrounds are crossed to create seed varieties with greater yield potential and stronger biological characteristics than exhibited by either parent – a phenomenon called hybrid vigor or heterosis. From the farmer’s perspective, hybrid seed has many advantages, including higher yield potential, uniformity, improved plant vigor, improved resistance to stress and disease, and a better return on investment. Crops in which breeders have achieved high levels of hybrid vigor (typically 15% or more) are dominated by hybrid varieties, which are continuously improved and adapted to current needs by the seed producer.
Hybrid seeds were first introduced in the US commercial corn market in the 1920s and have contributed significantly to the increase in crop yield since then. In 2009, more than 70% of the corn grown globally (and virtually all grown in the US, Western Europe, China and other developed countries) consisted of hybrid varieties. In the other key global crops – due to current challenges with hybrid seed production and limited levels of heterosis – the percentage is much lower, with ~14% of rice being hybridized and virtually no hybridized seed in either wheat or soybean. However, in several vegetable crops where heterosis levels remain low, hybrids have become commonplace due to their potential to rapidly deploy improved fruit quality and agronomic traits such as disease and insect tolerance.
* Corn: BR, China, CIS, RoW; Soybean: RoW; Wheat: CIS, India; Rice: SEA, India** Corn: US, AR, EU; Soybean: US, AR, BR; Wheat: US, EU, China; Rice: China, Japan, US
Source: Syngenta, based on planted area
Wheattons per hectare (t/ha)
Corntons per hectare (t/ha)
Ricetons per hectare (t/ha)
Soybeantons per hectare (t/ha)
Yield generally correlating with quality of seeds 2014
73Technology in agriculture 05

Donor plant Commercial cultivar Breeding intermediate Improved commercial cultivar
Undesirable gene
Desired gene2–3 fewer backcrosses
= Molecular markers that distinguish the DNA of a donor parent from the DNA of the commercial cultivar
Benefits of hybridization
Marker-assisted breeding accelerates the breeding process while reducing costs
Marker-assisted breedingMarker-assisted (or molecular-assisted) breeding can provide a dramatic improvement in the efficiency with which breeders can select plants with desirable combinations of genes. It is used in advancing research both in native (non-GM) traits and biotech (GM) traits.
A molecular marker is a “genetic tag” that identifies a particular location within a plant’s DNA sequences. Plant breeders use genetic markers to identify the versions of specific genes associated with a desirable trait; this allows them to predict and guide performance at early stages of development. Genetic markers, when tied to enhanced genetics knowledge, create a roadmap of the genes and genetic effects in the plant. Markers allow the breeder to predict the presence of specific characteristics even before the plant is fully grown. Therefore, the efficiency and leverage of costly and time-consuming breeding trials in the field or in greenhouses can be leveraged.
Marker-assisted breeding enables the outcome of the breeding process to be optimized at the gene level, allowing for the development of plants with new properties that are beneficial to the consumer, such as improved taste, without incorporating undesirable foreign genes.
Towards predictive breedingMost of the molecular markers used by breeders today are like road signs along the highway. They are associated with a specific location on the genome, but they do not reveal much about the location (the variant gene causing the trait) itself. Advances in biology and genome sequencing are rapidly changing this. Genome sequencing cost has come down exponentially over recent years, and now allows the determination of the specific version of the gene that causes the trait variant, rather than a number of markers loosely associated with the trait. This in turn provides insights in the mode of action of the gene variant that causes the trait of interest.
This type of know-how is being developed and deployed at a fast pace. It is made possible by super-computer and computational scientists that can analyze and interpret the staggering amount of data produced in breeding programs by the combinations of traits. Breeding is quickly becoming an information science, where the performance of a hybrid variety in a farmer’s field may soon be predicted to a large extent just by looking at its DNA sequence. This new science, referred to as predictive breeding, increases the selective power of breeding programs and accelerates seed improvement.
Source: Syngenta
Marker-assisted breeding process
74 Technology in agriculture05

0
20
40
60
80
100
GM adoption in percent of global crop area
CanolaCorn CottonSoybean
30%
82%
68%
25%
Biotechnology
Biotechnology is the most rapidly accepted technology by farmers ever; plantings are increasing each year
GM exists primarily in five crops today: corn, soybean, cotton, canola and sugar beat
Biotechnology is defined as the use of living organisms to develop useful products and includes the technique of genetic modification, also known as “gene technology” or “genetic engineering”. This refers to the process of adding a specific gene or genes to an organism or of knocking out a gene to produce a desirable (and often novel) characteristic. The ability to create genetically modified (GM) organisms has been used to develop new drugs and vaccines in medicine. In agriculture, it allows the production of food and feed crops with improved characteristics such as higher yield, improved nutritional qualities, resistance against insects and diseases and enhanced food-processing qualities.
In order to successfully develop a product through biotechnology, two key elements are needed: trait development and commercial plant biotechnology. Trait development is widespread, but the number of organizations involved in commercial plant biotechnology is relatively small due to the associated high costs of R&D, intellectual property protection of the technology and the level of regulatory testing.
In many countries, GM crops have been adopted rapidly, and the market for genetically modified seeds containing herbicide tolerant and/or insect resistant crop traits has been one of the fastest growing sectors in the agricultural industry over the last decade. This trend continued strongly in 2014 with a further significant increase in the utilization of GM crops globally. The market value increased to US$ 15 billion.
Crop yield has increased dramatically in the United States with the introduction of biotechnology contributing to these increases. Since 1995, the last year before GM varieties were planted in the United States, corn yield has increased ~40% reaching almost 159 bushels per acre in 2013 (~10 t/ha). Of the total corn acres in the United States, 88% are GM. Similarly, ~97% of all soybeans in the United States are GM varieties, with yields increasing ~30% since 1995.
2014 GM adoption by cropmillions of hectares (Mha)
Source: ISAAA
75Technology in agriculture 05

0
20
40
60
80
100
EAMEAPACLATAMNAFTA
Pakistan: 2.9Other APAC: 1.7
Other LATAM: ~6.6
China: 3.9India: 11.6
Argentina: 24.3
Brazil: 42.2
Canada: 11.6
US: 73.1
Africa: ~3.3
Europe: <1.0
Yield gains 70%Decrease in production costs 30%
US$133
billion
0
50
100
150
200
US Argentina Brazil
20121999
20002013
20142011
201019982009
20082007
20061997
Canada India China Rest of world
20052004
20032002
20011996
2014 highlights+4% to 181.5 Mha
~11% of global crop area
Biotechnology
GM adoption: Americas dominate, followed by Asia
In 2014, over 18 million farmers in 28 countries around the world grew biotech crops on 175 million hectares of land. Another 31 countries have approved the import of biotech products for food and feed use, for a total of 59 approving countries globally.
In the EU, the use of biotechnology in crops for cultivation has still not been accepted widely despite several biotech products receiving a positive risk assessment from the European Food Safety Authority. In a world where food security affects everyone, it is critical that farmers across the globe have access to the technology that will help them produce more food in a sustainable manner.
Adoption of GM crops by countrymillions of hectares (Mha)
Source: ISAAA
Economic benefit of GM cropssince 1996
GM adoptionmillions of hectares (Mha)
Sources: ISAAA; Syngenta
Source: ISAAA
76 Technology in agriculture05

Research, development and regulatory environment for biotech crops
It takes on average 13 years to develop a new GM trait
Agricultural biotech products are the most stringently tested food products on the market
The process involved in the development of a new biotechnology trait is extremely complex and time consuming. The overall time required is more than that for the discovery and development of a crop protection chemical and reflects the complexity of new trait discovery and development.
The complete process takes around 13 years from the point of discovery of a new genetic sequence, which demonstrates changes in the plant metabolism or biological activity, through to the lengthy registration process that must satisfy both the regulatory bodies in the cultivating country as well as those in the major import markets.
Following the discovery of a new genetic sequence, this must then be combined with other sequences in order to develop the most suitable genetic construct. From here several events will be selected for introgression into elite germplasm. This will result in high quality hybrids or varieties that can then be further tested and evaluated under field trial conditions. Alongside the ongoing commercial evaluation of the trait, all biotech crops are thoroughly assessed for their safety to humans, animals and the environment before receiving final regulatory approval. Rigorous laboratory and field studies are conducted to identify and assess potential toxic, allergenic or other unintended effects that may raise safety concerns. Agricultural biotech products are among the most stringently tested food products available on the market, and regulatory agencies have concluded that approved biotech products are as safe as their conventional counterparts.
Over the years, thanks to progress made in genetic screening and evaluation, biotech companies have been able to significantly increase efficiency in the process. There are significantly more genes evaluated within the discovery phase and those which progress through to the commercial event production and selection phase are far more focused.
The stringent regulatory processes are the most time-consuming area of product development. An average nine years of regulatory work is required, much of it running in parallel to the early development stages. The time taken today is almost 20% more than that of new traits introduced prior to 2002.
77Technology in agriculture 05
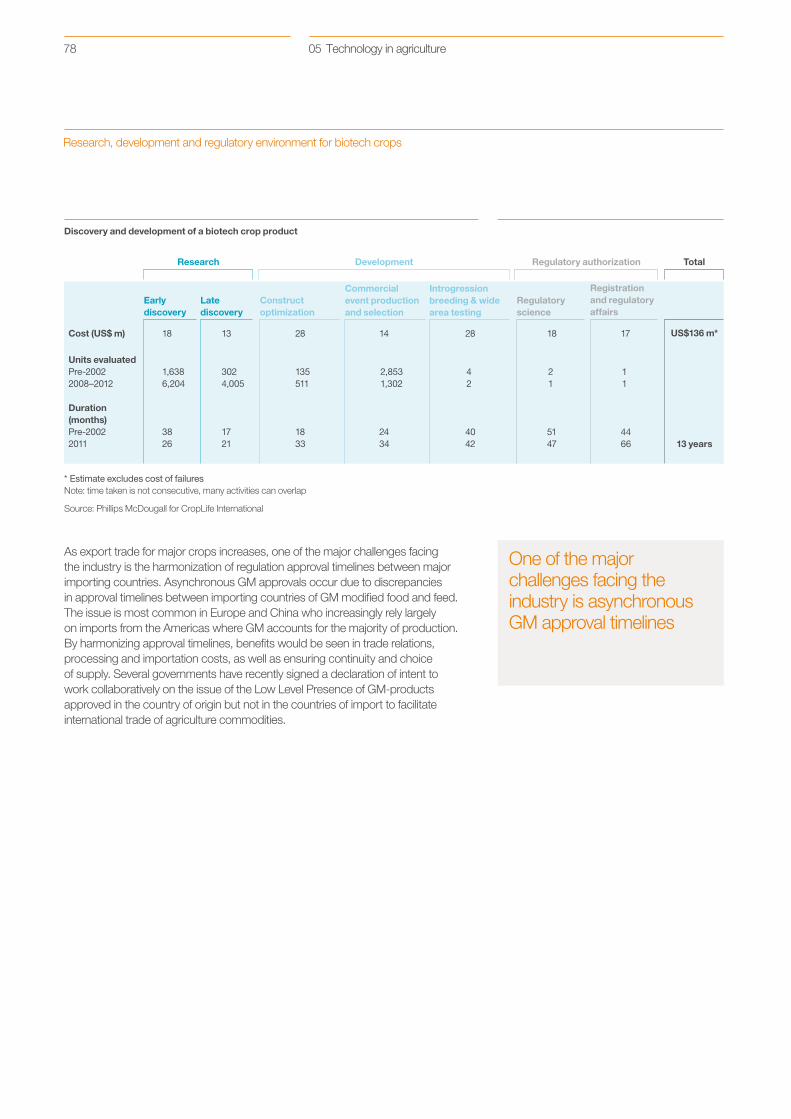
Research
Early discovery
Construct optimization
Regulatory science
Registration and regulatory affairs
Commercial event production and selection
Introgression breeding & wide area testing
Late discovery
Development Regulatory authorization Total
Cost (US$ m)
Units evaluatedPre-20022008–2012
Duration (months)Pre-20022011
18
1,6386,204
3826
13
3024,005
1721
28
135511
1833
14
2,8531,302
2434
28
42
4042
18
21
5147
17 US$136 m*
13 years
11
4466
Research, development and regulatory environment for biotech crops
One of the major challenges facing the industry is asynchronous GM approval timelines
As export trade for major crops increases, one of the major challenges facing the industry is the harmonization of regulation approval timelines between major importing countries. Asynchronous GM approvals occur due to discrepancies in approval timelines between importing countries of GM modified food and feed. The issue is most common in Europe and China who increasingly rely largely on imports from the Americas where GM accounts for the majority of production. By harmonizing approval timelines, benefits would be seen in trade relations, processing and importation costs, as well as ensuring continuity and choice of supply. Several governments have recently signed a declaration of intent to work collaboratively on the issue of the Low Level Presence of GM-products approved in the country of origin but not in the countries of import to facilitate international trade of agriculture commodities.
* Estimate excludes cost of failuresNote: time taken is not consecutive, many activities can overlap
Source: Phillips McDougall for CropLife International
Discovery and development of a biotech crop product
78 Technology in agriculture05

Innovation and intellectual property
Two IP systems protect plant research and innovation – PVP and patents
Intellectual property (IP) rights – such as patents and plant breeder’s rights – are established legal instruments that provide incentives for innovation in agriculture: innovations such as improved crop protection chemistries and new plant varieties that help farmers grow more while using fewer natural resources.
Agricultural companies invest in research and development (R&D) to bring forward new agricultural innovations that drive long-term agricultural productivity, rural development and environmental sustainability. They do this with the belief that such innovation needs to be encouraged, supported, and protected. As is the case for any industry, the maintenance of IP rights is an essential basis for innovation and progress. When it comes to an issue as fundamental as food security, IP systems must be progressive and balanced in order to stimulate continued innovation and to encourage the broad dissemination and use of beneficial technologies.
Patents and other forms of IP protection provide incentives to invest in R&D processes, which are increasingly more resource intensive, lengthy and risky, and which require continuous technological innovation. R&D investment typically is around 10% of company sales, which make agriculture one of the most R&D intensive industries.
The breeding industry continues to undergo a rapid technification to develop new plant varieties faster and more efficiently. Modern technologies and innovative processes are now used at every step of the breeding cycle. These include gene banks to access genetic diversity; marker-assisted genotyping to help in combining the best characteristics; information technology to help understand critical correlations between genes; metabolomics to support the characterization of interesting traits. The outcome of the R&D process can easily be copied by competitors and growers, which is why IP protection is important. Without some form of enforceable commercial protection, there would be little incentive to make such large and risky investments.
Two different and complementary IP systems – Plant Variety Protection (PVP) and patents – are used to protect plant innovations. PVP protects a new plant variety on the basis of its phenotypical characteristics, and is suitable for varieties developed by empirical (traditional) breeding efforts. The term of a PVP differs between countries and depends on plant species, but is generally between 15 and 25 years. While the PVP rights prevent unauthorized commercial copying of the variety, the laws contain a statutory breeders’ exemption that allows a variety to be used for further breeding. This recognizes that new plant varieties are always “created” from existing plants.
For new traits derived from highly technical processes such as genetic modification or complex marker assisted breeding, patents are a better form of IP protection because they provide more robust means to recoup huge research investments. Patents are also used to protect crop protection innovations. The prerequisites for grant of a patent are: ■■ novelty ■■ inventive step or non-obviousness ■■ industrial applicability
79Technology in agriculture 05
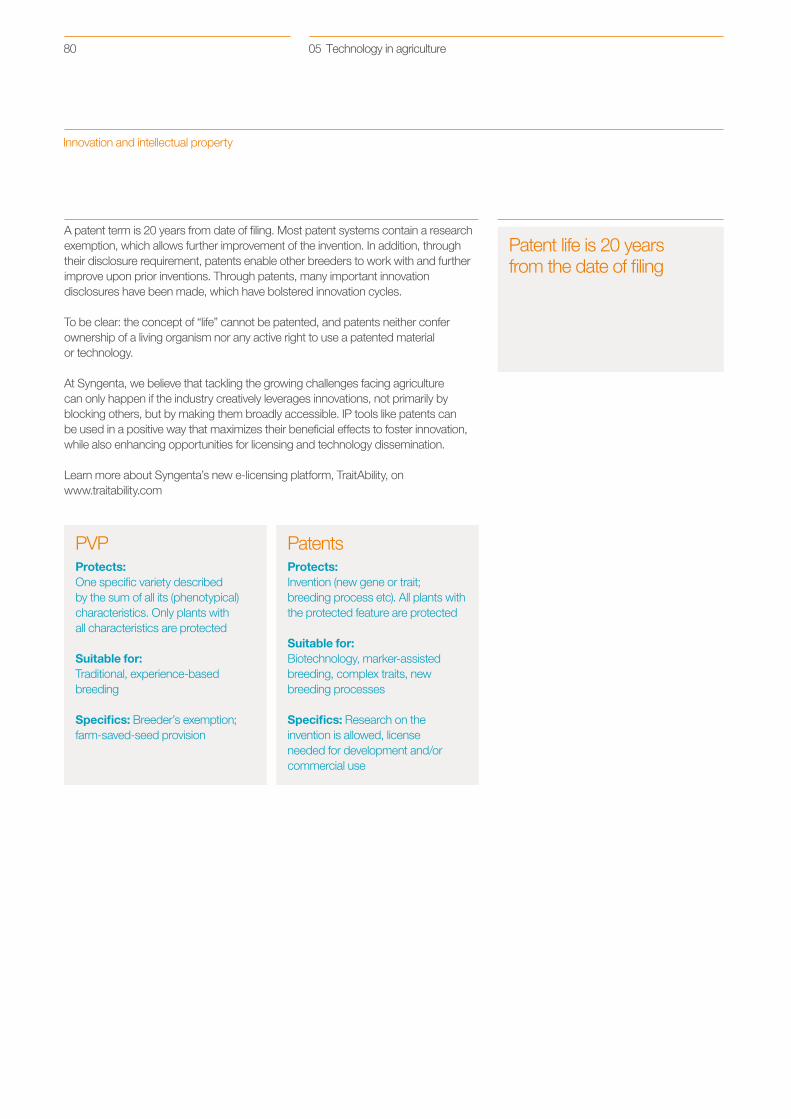
Innovation and intellectual property
Patent life is 20 years from the date of filing
A patent term is 20 years from date of filing. Most patent systems contain a research exemption, which allows further improvement of the invention. In addition, through their disclosure requirement, patents enable other breeders to work with and further improve upon prior inventions. Through patents, many important innovation disclosures have been made, which have bolstered innovation cycles.
To be clear: the concept of “life” cannot be patented, and patents neither confer ownership of a living organism nor any active right to use a patented material or technology.
At Syngenta, we believe that tackling the growing challenges facing agriculture can only happen if the industry creatively leverages innovations, not primarily by blocking others, but by making them broadly accessible. IP tools like patents can be used in a positive way that maximizes their beneficial effects to foster innovation, while also enhancing opportunities for licensing and technology dissemination.
Learn more about Syngenta’s new e-licensing platform, TraitAbility, on www.traitability.com
PVPProtects: One specific variety described by the sum of all its (phenotypical) characteristics. Only plants with all characteristics are protected
Suitable for: Traditional, experience-based breeding
Specifics: Breeder’s exemption; farm-saved-seed provision
PatentsProtects: Invention (new gene or trait; breeding process etc). All plants with the protected feature are protected
Suitable for: Biotechnology, marker-assisted breeding, complex traits, new breeding processes
Specifics: Research on the invention is allowed, license needed for development and/or commercial use
80 Technology in agriculture05

Lawn and Garden
06

Consumer US$ 63bnProfessional US$ 4.6bn
US$billion
Genetics* 68%Controls, Growing media 32%(incl. fertilizer)
Consumer
US$63
billion
Controls 13%Turf and Landscape 73%Genetics** 14%
Professional
US$4.6
billion
Market overview
It is estimated that the average United States consumer spends around US$ 350 per year on lawn and garden supplies
The lawn and garden industry consists of three main agronomic sectors: genetics, controls and growing media. The market is divided between two major customer groups: professionals and consumers.
The consumer lawn and garden market consists of end-user consumable products for growing gardens and protecting homes and gardens from pests. The market size of US$ 63 billion is larger than some common retail industries such as laundry or hair care. Gardening products are used to decorate, maintain or protect lawns, gardens, patios, pathways and other outside areas. Among the offerings are plants and seeds, plant protection and nutrition products as well as growing media. More than 80% of gardening products are sold through garden centers and hardware/home-improvement stores. Home pest products are used to protect homes from insects and rodents. Over 60% of home pest products are sold through grocery retailers.
The professional market can be characterized by three main segments – ornamental growers, turf and landscape and professional pest management businesses. Consumer spending is the overall driver of market size. Substantial consolidation and professionalization of professional ornamental growers is affecting the market structure and is mainly being driven by the big box flower retailers. Similar structural changes have also been seen in the golf course industry where multi-course organizations now manage multiple golf courses worldwide. Professional pest management is a growing market segment driven by consumer desire to control pests in urban and rural spaces.
Flowers, home and garden solutions
Professional market and products
Lawn and Garden market 2015
* Genetics includes cut flowers, garden flowers and shrubs** Includes bedding, indoor plants (excluding trees, shrubs, seeds, bulbs and cut flowers)
Source: Euromonitor
82 Lawn and Garden06

Professional market and products
Subterranean termites cause over US$ 2 billion in damage each year in the United States and up to € 1 billion across Europe
There are more than 34,000 golf facilities worldwide. 45% are in the United States
200 million poinsettias are delivered on time for Christmas, and 500 million pelargonium are delivered on time for Easter
Professional ornamental growersThe professional ornamental segment consists of vegetative and seed genetics, controls, fertilizers and growing media. The largest use segment in controls is cut flowers where longer shelf and vase life are key targets of solutions that go beyond controlling pests and diseases.
Products such as seeds, cuttings and young plants are distributed through a value chain including distributors, growers, and retailers that must be finely tuned in order to manage the complexities that the short shelf life demands. Continued industry consolidation across all segments of the professional value chain contributes to the market’s ability to provide high quality, just-in-time products to the end consumer.
Genetics are developed not only to meet the desired aesthetics and tastes of consumers, but also to perform optimally under multiple growing conditions. This can mean developing traits to protect plants from drought, heat stress and/or disease as well as expressing traits such as flower color or size. Controls are developed to be compatible with integrated pest management in order to provide solutions that have favorable environmental profiles as well as improved characteristics such as ease of use and application.
Turf and landscape businessThe turf and landscape segment encompasses three main components: golf, landscape management and professional pest management. The golf segment, which is currently the largest and most mature of this business, is primarily concentrated in the USA, Europe and Japan. Landscape management, including tree injection to control pests and disease and pest management are also concentred in developed markets, but are becoming increasingly important in emerging markets.
In the golf and turf market, key priorities are high quality playability, aesthetics and environmental sustainability. Due to the challenging economic environment and the increased pressure from regulators as well as their customers to utilize leisure spaces more sustainably and productively, golf course managers are increasingly looking for holistic, integrated solutions to satisfy the changing needs.
In the landscape management and pest management markets, operators aim for technologies which will not only control different pests, diseases and weeds, but also conform to high regulatory and environmental standards and ultimately contribute to their business productivity. The demand for professional pest management products is being driven by factors such as economic growth, urbanization and emergence of new pests and diseases. Customers are increasingly looking for targeted and effective solutions with minimal environmental impact.
83Lawn and Garden 06

07
Syngenta key financial information and ratios

13.41
13.27
15.13
14.6914.20
15
11
141312
17.78
19.03
19.42
19.3022.03
15
11
141312
0.80
1.54
1.08
0.390.27
15
11
141312
11.00
8.00
11.00
10.009.50
15
11
141312
11
19
89
140654
15
11
141312
Syngenta 5-year financial summary
Comparative amounts for the years 2011 and 2012 have been restated to reflect the revised IAS 191 Before restructuring and impairment2 Earnings before interest, tax, non-controlling interests, depreciation and amortization excluding
restructuring and impairment3 Earnings after restructuring and impairment, attributable to Syngenta AG shareholders4 Cash flow from operating and investing activities, excluding marketable securities and foreign
exchange movements and related hedges on inter-company loans, but including acquisitions of non-controlling interests
5 Period end trade working capital as a percentage of twelve-month sales6 Total debt net of related hedging derivatives, cash and cash equivalents and marketable securities.
The definition of net debt was revised in 2015 7 Fully diluted excluding restructuring and impairment
More information at: http://www.syngenta.com/ir
Sales
US$ 13.4bn -11%
Earnings per share7
US$ 17.78 -8%
Free cash flow4
US$ 0.8bn -27%
Dividend per share, 2015 proposed
CHF 11.00
Acquisition spend
US$ 11m
US$ millions except EPS, DPS 2011 2012 CAGR
Sales 13,268 14,202 0%YoY sales growth 14% 7%YoY growth at CER 12% 10%
Gross profit margin1 48.9% 49.2%
EBITDA2 2,863 3,114 -1%YoY EBITDA growth 16% 9%
EBITDA margin2 21.6% 21.9%
Net income3 1,569 1,847 -4%YoY net income growth 14% 18%
R&D 1,194 1,257 3%R&D as % of sales 9.0% 8.9%
Basic EPS1 19.14 22.14 -2%YoY EPS growth 18% 16%
Fully diluted EPS7 19.03 22.03 -2%YoY EPS growth 18% 16%
Tax rate on results1 16% 15%
Free cash flow4
YoY growth 1,537 27036% -82%
Trade workingcapital to sales5 30% 32%
Debt/Equity gearing 15% 19%
Net debt6 1,135 1,706
Dividendsper share (CHF) 8.00 9.50YoY dividend growth 14% 19%
2013 2014
14,6883%5%
45.6%
2,895-7%
19.7%
1,644-11%
1,3769.4%
19.41-12%
19.30-12%
15%
38543%
35%
24%
2,265
10.005%
15,1343%5%
46.0%
2,9261%
19.3%
1,619-2%
1,4309.4%
19.490%
19.421%
15%
1,083181%
34%
27%
2,423
11.0010%
2015
13,411-11%
1%
47.5%
2,777-5%
20.7%
1,339-17%
1,36210.2%
17.83-9%
17.78-8%
17%
795-27%
38%
31%
2,586
11.000%
85Syngenta key financial information and ratios 07
Financial highlights 2015

0
1
2
3
4
5
20152014201320122011
Seeds Crop protection
0
1
2
3
4
5
20152014201320122011
Seeds Crop protection
0
1
2
3
4
5
20152014201320122011
Seeds Crop protection
0
1
2
3
4
5
20152014201320122011
Seeds Crop protection
Regional 5-year financial summary1
Excluding restructuring and impairment
Sales: Crop Protection and SeedsUS$ millions
Sales: Crop Protection and SeedsUS$ millions
Sales: Crop Protection and SeedsUS$ millions
Sales: Crop Protection and SeedsUS$ millions
US$ millions 2014 CAGR
North America
Sales 1%YoY sales growthYoY growth at CERGross profit 0%YoY GP growthOperating IncomeYoY operating income growth –Operating Income margin
US$ millions CAGR
Latin America
Sales 2%YoY sales growthYoY growth at CERGross profit 0%YoY GP growthOperating IncomeYoY operating income growthOperating Income margin
US$ millions CAGR
Asia Pacific
Sales -1%YoY sales growthYoY growth at CERGross profit -2%YoY GP growthOperating IncomeYoY operating Income growth –Operating Income margin
US$ millions CAGR
Europe, Africa and Middle East
Sales -1%YoY sales growthYoY growth at CERGross profit -2%YoY GP growthOperating IncomeYoY operating income growthOperating Income margin
20112
3,27310%9%
1,631–
960
29.3%
20112
3,30520%20%
1,492–
873–
26.4%
20112
1,88711%6%903
–565
29.9%
20112
3,98216%12%
2,184–
1,333–
33.5%
2012
3,93120%21%
2,12630%
1,36642%
34.8%
2012
3,71312%13%
1,65611%
1,00715%
27.1%
2012
1,827-3%0%854-5%505
-11%27.6%
2012
3,9740%6%
2,115-3%
1,305-2%
32.8%
2013
3,848-2%-2%
1,679-21%1,074-21%
27.9%
3,9917%
10%1,701
3%1,020
1%25.6%
2013
2013
1,9356%
11%8945%5407%
27.9%
2013
4,2236%7%
2,2657%
1,44811%
34.3%
2014
2014
2014
3,582-7%-6%
1,579-6%923
-14%25.8%
4,2797%9%
1,7875%
1,0957%
25.6%
2,0335%
10%9264%5645%
27.8%
4,5478%
11%2,380
5%1,499
4%33.0%
2015
2015
2015
2015
3,410-5%-4%
1,6313%
1,0109%
29.6%
3,632-15%-5%
1,514-15%
918-16%
25.3%
1,837-10%-3%825
-11%504
-11%27.5%
3,884-15%10%
1,995-16%1,283-14%
33.1%
1 Excluding non-regional segment2 2010 not restated, therefore YoY growth not available
86 Syngenta key financial information and ratios07
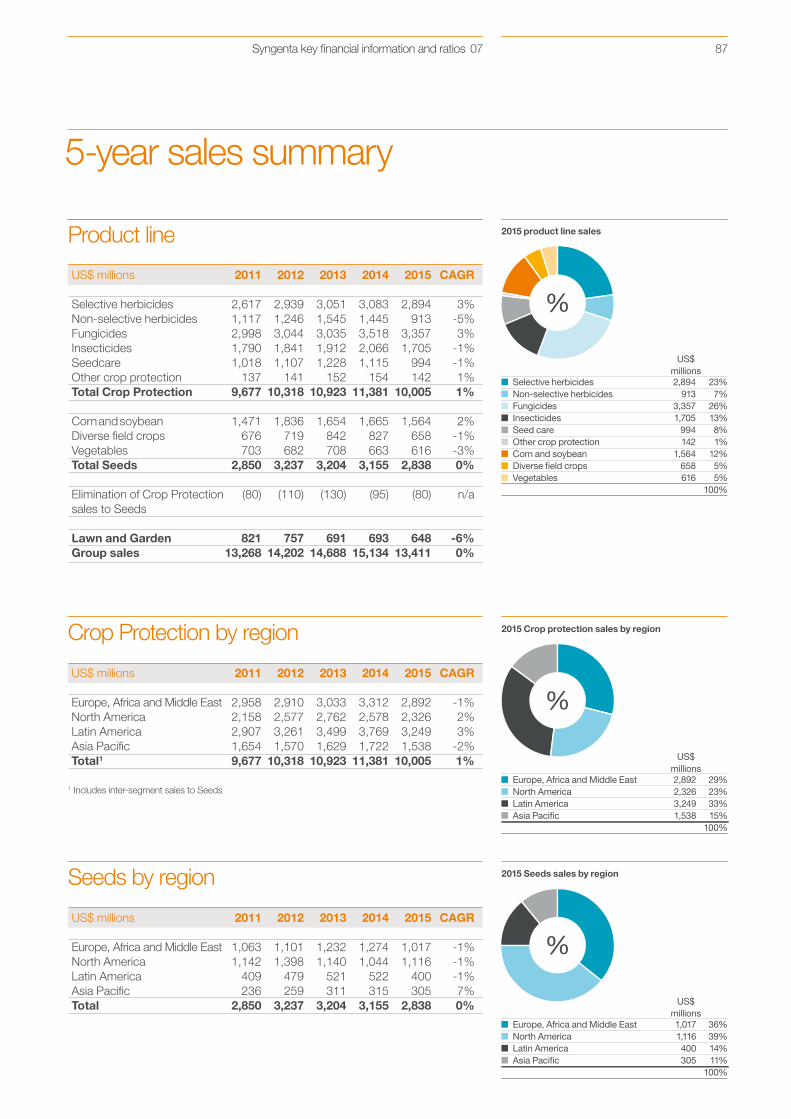
Europe, Africa and Middle East 2,892 29%North America 2,326 23%Latin America 3,249 33%Asia Paci�c 1,538 15% 100%
US$millions
Selective herbicides 2,894 23%Non-selective herbicides 913 7%Fungicides 3,357 26%Insecticides 1,705 13%Seed care 994 8%Other crop protection 142 1%Corn and soybean 1,564 12%Diverse �eld crops 658 5%Vegetables 616 5% 100%
US$millions
Europe, Africa and Middle East 1,017 36%North America 1,116 39%Latin America 400 14%Asia Paci�c 305 11% 100%
US$millions
5-year sales summary
Product line
Crop Protection by region
Seeds by region 2015 Seeds sales by region
2015 Crop protection sales by region
2015 product line salesProduct line
Crop Protection by region
Seeds by region
1 Includes inter-segment sales to Seeds
US$ millions CAGR
Selective herbicides 3%Non-selective herbicides -5%Fungicides 3%Insecticides -1%Seedcare -1%Other crop protection 1%Total Crop Protection 1%
Cornandsoybean 2%Diverse field crops -1%Vegetables -3%Total Seeds 0%
Elimination of Crop Protection n/asales to Seeds
Lawn and Garden -6%Group sales 0%
US$ millions CAGR
Europe, Africa and Middle East -1%North America 2%Latin America 3%Asia Pacific -2%Total1 1%
US$ millions CAGR
Europe, Africa and Middle East -1%North America -1%Latin America -1%Asia Pacific 7%Total
2011
2,6171,1172,9981,7901,018
1379,677
1,471676703
2,850
(80)
82113,268
2011
2,9582,1582,9071,6549,677
2011
1,0631,142
409236
2,850
2012
2,9391,2463,0441,8411,107
14110,318
1,836719682
3,237
(110)
75714,202
2012
2,9102,5773,2611,570
10,318
2012
1,1011,398
479259
3,237
2013
3,0511,5453,0351,9121,228
15210,923
1,654842708
3,204
(130)
69114,688
2013
3,0332,7623,4991,629
10,923
2013
1,2321,140
521311
3,204
2014
2014
2014
3,0831,4453,5182,0661,115
15411,381
1,665827663
3,155
(95)
69315,134
3,3122,5783,7691,722
11,381
1,2741,044
522315
3,155
2015
2015
2015
2,894913
3,3571,705
994142
10,005
1,564658616
2,838
(80)
64813,411
2,8922,3263,2491,538
10,005
1,0171,116
400305
2,838 0%
Product line
Crop Protection by region
Seeds by region
1 Includes inter-segment sales to Seeds
US$ millions CAGR
Selective herbicides 3%Non-selective herbicides -5%Fungicides 3%Insecticides -1%Seedcare -1%Other crop protection 1%Total Crop Protection 1%
Cornandsoybean 2%Diverse field crops -1%Vegetables -3%Total Seeds 0%
Elimination of Crop Protection n/asales to Seeds
Lawn and Garden -6%Group sales 0%
US$ millions CAGR
Europe, Africa and Middle East -1%North America 2%Latin America 3%Asia Pacific -2%Total1 1%
US$ millions CAGR
Europe, Africa and Middle East -1%North America -1%Latin America -1%Asia Pacific 7%Total
2011
2,6171,1172,9981,7901,018
1379,677
1,471676703
2,850
(80)
82113,268
2011
2,9582,1582,9071,6549,677
2011
1,0631,142
409236
2,850
2012
2,9391,2463,0441,8411,107
14110,318
1,836719682
3,237
(110)
75714,202
2012
2,9102,5773,2611,570
10,318
2012
1,1011,398
479259
3,237
2013
3,0511,5453,0351,9121,228
15210,923
1,654842708
3,204
(130)
69114,688
2013
3,0332,7623,4991,629
10,923
2013
1,2321,140
521311
3,204
2014
2014
2014
3,0831,4453,5182,0661,115
15411,381
1,665827663
3,155
(95)
69315,134
3,3122,5783,7691,722
11,381
1,2741,044
522315
3,155
2015
2015
2015
2,894913
3,3571,705
994142
10,005
1,564658616
2,838
(80)
64813,411
2,8922,3263,2491,538
10,005
1,0171,116
400305
2,838 0%
87Syngenta key financial information and ratios 07

Specialty crops 1,882 14%Rice 588 5%Diverse �eld crops 1,105 9%Cereals 1,686 13%Corn 3,161 25%Sugar cane 271 2%Soybean 2,515 20%Vegetables 1,540 12% 100%
US$millions
US$ billion-9%
+4%
+10%
-1% +1%
+10%
+3%
-2%
2015 sales1 by crop
2015 sales1: US$ 12.8bn (flat) Sales by crop
1 Excluding Lawn and Garden and Materials Protection products. Growth at constant exchange rates
88 Syngenta key financial information and ratios07

20
30
40
10
15
20
2011 2012 2013 2014 2015
Balance sheet
As at December 31US$ millions 2011 2012 2013 2014
AssetsProperty, plant and equipmentCash and cash equivalents 1,666 1,599 902Trade receivables, net 2,736 3,191 3,445Inventories 4,190 4,734 5,576Other current assets 1,158 1,440 1,423Total current assets 9,750 10,964 11,346Non-current assetsProperty, plant and equipment 3,025 3,193 3,506Intangible assets 2,869 3,501 3,381Other non-current assets 1,597 1,780 1,983Total non-current assets 7,491 8,474 8,870
Total assets 17,241 19,438 20,216
Liabilities and equityCurrent liabilitiesTrade accounts payable (2,881) (3,409) (3,817)Current financial debts and otherfinancial liabilities (955) (1,048) (1,591)Income taxes payable (547) (574) (687)Other current liabilities andprovisions (1,260) (1,396) (1,261)Total current liabilities (5,643) (6,427) (7,356)Non-current liabilitiesFinancial debt and othernon-current liabilities (2,374) (2,514) (1,796)Deferred tax liabilities (761) (871) (794)Provisions (928) (841) (766)Total non-current liabilities (4,063) (4,226) (3,356)
Total liabilities (9,706)(10,653)(10,712)
Shareholders’ equity (7,526) (8,774) (9,491)Non-controlling interests (9) (11) (13)Total equity (7,535) (8,785) (9,504)Total liabilities and equity (17,241)(19,438)(20,216)
1,6383,6984,8611,368
11,565
3,5623,1861,6168,364
19,929
(3,472)
(1,329)(706)
(1,200)(6,707)
(2,976)(665)(676)
(4,317)(11,024)
(8,889)(16)
(8,905)(19,929)
2015
1,1414,1284,3451,584
11,198
3,3833,0401,3567,779
18,977
(3,311)
(730)(444)
(1,176)(5,661)
(3,501)(668)(727)
(4,896)(10,557)
(8,401)(19)
(8,420)(18,977)
Period end trade working capital versus CFROI
Period end trade working capital%
CFROI%
89Syngenta key financial information and ratios 07

Cash flow
US$ millions 2011 2012 2013 2014
Cash flow before working capital change 1,921 2,218 2,098Changes in working capital (50) (859) (884)Cash flow from operating activities 1,871 1,359 1,214
Additions to property, plant and equipment (479) (508) (625)Acquisitions and divestments 50 (582) (90)Other investing activities (43) (128) (57)Cash flow used for investing activities (472) (1,218) (772)
Changes in interest bearing debt (601) 535 (61)(Purchases)/sales of treasury shares (377) 24 (93)Dividends paid to shareholders (705) (791) (921)Dividends paid to non-controllinginterests (1) – –Acquisitions of non-controlling interest – – (39)Cash flow used forfinancing activities (1,684) (232) (1,114)Currency translation impact (16) 24 (25)Net change (301) (67) (697)Opening cash and cash equivalents 1,967 1,666 1,599Closing cash and cash equivalents 1,666 1,599 902
1,88744
1,931
(600)(87)(42)
(729)
716(104)
(1032)
––
(420)(46)736902
1,638
2015
1,801(611)
1,190
(453)(10)
1(462)
(76)(34)
(1078)
––
(1,188)(37)
(497)1,6381,141
90 Syngenta key financial information and ratios07

Significant acquisitions1
Acquiree1st date ofconsolidation
Cash2 Other (US$ (US$ millions) millions) Description
German and Polish winter wheat and winter oilseed rape breeding and business operations of Lantmännen
July 2014 not disclosed The acquired business consists of 100% of the shares of Lantmännen SW Seed Hadmersleben GmbH, Lantmännen SW Seed GmbH, SW Winter Oilseed AB and certain sites in Germany. The primary reasons for the acquisition were to give Syngenta access to high-quality germplasm, a seeds pipeline and commercial varieties which complement Syngenta’s portfolio and will support the continued development of hybrid cereals for growers worldwide.
Società Produttori Sementi S.p.A.
April 2014 not disclosed PSB is one of Italy’s oldest seed companies and a leader in durum wheat breeding and production. Its durum wheat breeding expertise and its links to the food industry will be complemented by Syngenta’s cereals research and development and global presence.
MRI Seed Zambia Ltd.MRI Agro Zambia Ltd.
Oct. 2013 84 – A leading developer, producer and distributor of white corn seed in Zambia. MRI’s corn germplasm is among Africa’s most comprehensive and diverse, incorporating temperate, tropical and sub-tropical material
Devgen Dec. 2012 493 – (94% acquired)
The acquiree is a biotechnology company in Belgium. Devgen uses advanced biotechnology and molecular breeding technology to develop hybrid rice seeds and crop protection solutions with a superior environmental profile
Sunfield Seeds, Inc. Dec. 2012 not disclosed A US-based provider of sunflower seeds production and processing services.The acquisition represents an important step in the implementation of Syngenta’s sunflower strategy by strengthening supply chain capabilities to enable future growth
Pasteuria Bioscience, Inc. Nov. 2012 52 – (remaining
63% acquired)
The acquiree is a US-based biotechnology company.Since 2011 Syngenta and Pasteuria have had an exclusive global technology partnership to develop and commercialize biological products to control plant-parasitic nematodes, using the naturally occurring soil bacteria Pasteuria spp
Dupont Professional Products insecticide business
Oct. 2012 125 – The acquired business is a leading supplier of innovative products for the professional turf, ornamentals and home pest control markets
Agrosan S.A March 2011 32 – Purchased 100% of Agrosan S.A, an agricultural distributor in Paraguay, together with the trademarks related to its business
Greenleaf Genetics Nov. 2010 not disclosed Acquired the remaining 50% stake in Greenleaf Genetics from DuPont. The transaction dissolved a joint venture between Syngenta and Pioneer
Maribo Seeds International ApS
Oct. 2010 61 – Acquired the sugar beets business of Maribo International
Synergene Seed & Technology, Inc.
Dec. 2009 not disclosed Acquired US lettuce seed company based in Salinas, California, a company known for its diverse and proprietary lettuce gene pool
Pybas Vegetable Seed Co., Inc. Dec. 2009 not disclosed Acquired US lettuce seed company based in Santa Maria, California, well-known for its quality seed production and processing as well as its germplasm
Monsanto hybrid sunflower seed activities
Sept. 2009 160 – Acquired the assets of Monsanto’s sunflower business including all germplasm and the development and breeding activities of hybrid sunflower seeds
Circle One Global Inc. June 2009 not disclosed Acquired US-based Circle One Global Inc. to add an antitoxin crop protection technology to portfolio. Toxins can develop in crops such as corn and peanuts, particularly during heat and drought stress
Purchase price consisting of:
1 Significant acquisitions in the last 6 years2 Amounts include closing adjustments
91Syngenta key financial information and ratios 07

Reference sources
■■ “Adoption of Genetically Engineered Crops in the US in 2008”, USDA Economic Research Service Report
■■ “Agribusiness and hunger”, Deutsche Bank Research■■ “Agricultural Productivity in changing rural worlds”. Center for Strategic and
International Studies. February 2010 ■■ American Coalition for Ethanol■■ “A Baffling Global Economy”, The Washington Post, July 16, 2008■■ “Buying farmland abroad: The scramble for land in Africa and Asia”,
The Economist, May 21, 2009■■ Chicago Mercantile Exchange■■ Council for Biotechnology Information■■ CropLife International■■ “Crop Losses to Pests”, E-C Oerke, Journal of Agricultural Science (2006)■■ Directorate-General for Agriculture■■ EurObserv’ER■■ “The Expanding Middle: The Exploding World Middle Class and Falling Global
Inequality”, Goldman Sachs, July 7, 2008■■ Food and Agricultural Policy Research Institute (FAPRI)■■ Food and Agriculture Organization (FAO) of the United Nations■■ Genetic Resources Action International (GRAIN)■■ Greenhouse gas mitigation by agricultural intensification■■ IIED: “Land grab or development opportunity?”■■ “Improvements in Life Cycle Energy Efficiency and Greenhouse Gas
Emissions of Corn-Ethanol”, Journal of Industrial Ecology, 2009■■ The International Food Policy Research Institute (IFPRI)■■ The International Fund for Agricultural Development■■ The International Institute for Applied Systems Analysis■■ International Labour Organization■■ The International Service for the Acquisition of Agri-biotech Applications (ISAAA)■■ International Water Management Institute■■ KPMG research study on lawn and garden business■■ National Biodiesel Board■■ National Gardening Association■■ National Golf Foundation■■ “The New Global Middle Class”, Knowledge@Wharton, July 9, 2008■■ NZFSA 2009■■ Organisation for Economic Co-operation and Development (OECD)■■ PG Economics Ltd.■■ Ravallion and Chen 2004■■ Renewable Fuels Association■■ “Stanford University study: Greenhouse gas mitigation by agricultural
intensification”, Burneya, J.A., Davis, S.J., Lobella, D.B. (2009)■■ Tollefson, J. (2010) The global farm. Nature, 466, 554-556■■ United States Congressional Budget Office■■ United Nations Department of Economic and Social Affairs■■ United States Department of Energy■■ United States Department of Agriculture (USDA)■■ USDA National Agricultural Statistics Service (USDA NASS)■■ “The Vital Ingredient”, Royal Society of Chemistry. (2008) ■■ The Washington Post■■ The World Agricultural Supply and Demand Estimates (WASDE)■■ The World Bank■■ World Business Council for Sustainable Development■■ World Health Organization Fact Sheet Health in water resources development■■ The World Wildlife Fund (WWF)
92 Syngenta key financial information and ratios07
Cautionary statement
Cautionary statement regarding forward-looking statementsThis document contains forward-looking statements, which can be identified by terminology such as ‘expect’, ‘would’, ‘will’, ‘potential’, ‘plans’, ‘prospects’, ‘estimated’, ‘aiming’, ‘on track’ and similar expressions. Such statements may be subject to risks and uncertainties that could cause the actual results to differ materially from these statements. We refer you to Syngenta’s publicly available filings with the U.S. Securities and Exchange Commission for information about these and other risks and uncertainties. Syngenta assumes no obligation to update forward-looking statements to reflect actual results, hanged assumptions or other factors. This document does not constitute, or form part of, any offer or invitation to sell or issue, or any solicitation of any offer, to purchase or subscribe for any ordinary shares in Syngenta AG, or Syngenta ADSs, nor shall it form the basis of, or be relied on in connection with, any contract therefor.
93Syngenta key financial information and ratios 07
Syngenta International AG Corporate Affairs P.O. Box CH-4002 Basel Switzerland
www.syngenta.com
© 2016 Syngenta Crop Protection AG, Corporate Affairs, Basel, Switzerland. All rights reserved. The SYNGENTA Wordmark and the PURPOSE ICON graphic are registered trademarks of a Syngenta Group Company. Trademarks indicated by TM or ® are the property of a Syngenta Group Company. Article number 017280.040