OUR FIRST QUARTER - Gerresheimer · 4 QUARTERLY STATEMENT AS OF FEBRUARY 29, 2020 Gerresheimer AG...
14
OUR FIRST QUARTER QUARTERLY STATEMENT DECEMBER 2019 – FEBRUARY 2020
Transcript of OUR FIRST QUARTER - Gerresheimer · 4 QUARTERLY STATEMENT AS OF FEBRUARY 29, 2020 Gerresheimer AG...

OUR FIRST QUARTER
QUARTERLY STATEMENT
DECEMBER 2019 – FEBRUARY 2020

2
GROUP KEY FIGURES
Financial Year ended November 30 Q1 2020 Q1 2019 Change in %7)
Results of Operations during Reporting Period in EUR m
Revenues 303.9 308.5 -1.5
Adjusted EBITDA1) 51.1 145.9 -65.0
in % of revenues 16.8 47.3 -
Adjusted EBITA2) 23.8 122.7 -80.6
in % of revenues 7.8 39.8 -
Results of operations 11.8 109.0 -89.1
Adjusted net income3) 13.6 109.6 -87.7
Net Assets as of Reporting Date in EUR m
Total assets 2,650.3 2,688.6 -1.4
Equity 940.3 993.3 -5.3
Equity ratio in % 35.5 36.9 -
Net working capital 272.2 252.7 7.7
in % of revenues of the last twelve months 19.6 18.3 -
Capital expenditure 25.7 16.7 53.4
Net financial debt 1,053.1 939.1 12.1
Adjusted EBITDA leverage4) 3.4 2.4 -
Financial and Liquidity Position during Reporting Period in EUR m
Cash flow from operating activities -45.1 -16.7 >100.0
Cash flow from investing activities -32.8 -37.2 -11.7
Free cash flow before financing activities -77.9 -53.9 44.6
Employees
Employees as of the reporting date 9,899 9,867 0.3
Stock Data
Number of shares at reporting date in million 31.4 31.4 -
Share price5) at reporting date in EUR 65.30 67.50 -3.3
Market capitalization at reporting date in EUR m 2,050.4 2,119.5 -3.3
Share price high5) during reporting period in EUR 74.00 69.10 7.1
Share price low5) during reporting period in EUR 64.00 51.80 23.6
Earnings per share in EUR 0.13 3.15 -95.9
Adjusted earnings per share6) in EUR 0.43 3.48 -87.6
1) Adjusted EBITDA: Net income before income taxes, net finance expense, amortization/impairment losses of fair value adjustments, depreciation and amortization, impairment losses,
restructuring expenses, and one-off income and expenses. 2) Adjusted EBITA: Net income before income taxes, net finance expense, amortization/impairment losses of fair value adjustments, impairment losses, restructuring expenses, and one-off
income and expenses. 3) Adjusted net income: Net income before amortization/impairment losses of fair value adjustments, restructuring expenses, portfolio adjustments, the balance of one-off income and
expenses, and related tax effects. 4) Adjusted EBITDA leverage: The relation of net financial debt to adjusted EBITDA of the last twelve months according to the credit agreement currently in place. 5) Xetra closing price. 6) Adjusted earnings per share after non-controlling interests divided by 31.4m shares. 7) The change has been calculated on a EUR k basis.
3
CONTENTS
4 QUARTERLY STATEMENT AS OF FEBRUARY 29, 2020
4 Revenue performance
4 Results of operations
5 Balance sheet
6 Financial liabilities and credit facilities
6 Direct Cash Flow
6 Outlook
7 TABULARLY FINANCIAL INFORMATION AS OF FEBRUARY 29, 2020
7 Consolidated income statement
8 Consolidated statement of comprehensive income
9 Consolidated balance sheet
10 Consolidated statement of changes in equity
11 Consolidated cash flow statement
12 Segment data by division
13 FURTHER INFORMATION
13 Financial calendar
13 Imprint

4 QUART ERL Y ST ATEM ENT AS OF F EBRUARY 29, 2020 Gerresheimer AG QUART ERL Y ST ATEM ENT DECEMBER 2019 – F EBRUAR Y 2020
QUARTERLY STATEMENT AS OF FEBRUARY 29, 2020
REVENUE PERFORMANCE
Gerresheimer Group revenues were EUR 303.9m in the first quarter
of 2020, compared to EUR 308.5m in the prior-year quarter.
in EUR m Q1 2020 Q1 2019
Change
in %1)
Revenues
Plastics & Devices 158.0 160.7 -1.7
Primary Packaging Glass 146.5 141.9 3.2
Advanced Technologies 0.8 6.6 -87.1
Subtotal 305.3 309.2 -1.2
Intra-Group revenues -1.4 -0.7 >100.0
Total revenues 303.9 308.5 -1.5
1) The change has been calculated on a EUR k basis.
In the Plastics & Devices Division, revenues went down by 1.7% from
EUR 160.7m in the prior-year quarter to EUR 158.0m in the first
quarter of 2020. On an organic basis—meaning without exchange rate
effects and without the Argentine subsidiary which was
deconsolidated as of November 30, 2019—the decrease over the
period was 1.3%. Growth in the engineering and tooling business as
well as in the syringe business was not able to offset a temporary drop
in demand for plastic vials for prescription drugs in the US as
customers reduced inventories. In the Primary Packaging Glass
Division, revenues rose by 3.2% or EUR 4.6m from EUR 141.9m in
the prior-year quarter to EUR 146.5m. Organic growth in the same
period was 2.2%. Within this, the Tubular Glass Business Unit
delivered very positive growth rates, notably driven by the North
America and Europe regions. Revenues in the Advanced
Technologies Division came to EUR 0.8m in the first quarter of 2020,
compared to EUR 6.6m in the prior-year quarter.
RESULTS OF OPERATIONS
The Gerresheimer Group generated adjusted EBITDA of EUR 51.1m
in the first quarter of 2020, compared to EUR 53.6m in the prior-year
quarter excluding other operating income of EUR 92.3m due to the
derecognition of contingent purchase price components from the
acquisition of Sensile Medical.
In the Plastics & Devices Division, we generated adjusted EBITDA of
EUR 31.4m in the first quarter of 2020, compared to EUR 34.2m in the
same quarter of the prior year. On an organic basis—meaning without
exchange rate effects and without the earnings from the Argentine
subsidiary which was deconsolidated as of November 30, 2019 as well
as without the transition effect from financial reporting standard IFRS 16
Leases, which we were required to apply for the first time from
December 1, 2019—the decrease over the period was 11.8%. The
decrease is mainly due to the temporary development of business with
plastic vials for prescription drugs in the US. Furthermore, our syringe
business in particular continued to grow. The transition to IFRS 16 had
a positive impact of EUR 1.3m in the Plastics & Devices Division in the
first quarter of 2020.
In the Primary Packaging Glass Division, we succeeded in increasing
adjusted EBITDA by 16.9% or EUR 4.3m from EUR 25.2m in the prior-
year quarter to EUR 29.5m in the first quarter of 2020. On an organic
basis—meaning without exchange rate effects and without the IFRS 16
transition effect—the increase over the period was 14.4%. This growth
is mainly attributable to the Moulded Glass Business Unit and, in that
context, to a very good performance in India. The transition to IFRS 16
had a positive impact of EUR 0.5m in the Primary Packaging Glass
Division in the first quarter of 2020.
Adjusted EBITDA in our Advanced Technologies Division marked a loss
of EUR 4.2m in the first quarter of 2020, compared to a positive EUR
1.0m in the prior-year quarter. In this division, the transition to IFRS 16
had a positive impact of EUR 0.2m.
The head office expenses and consolidation item came to EUR 5.6m in
the first quarter of 2020, compared to EUR 6.8m in the prior-year quarter
excluding the other operating income of EUR 92.3m due to the
derecognition of contingent purchase price components from the
acquisition of Sensile Medical. Here, the transition to IFRS 16 had a
positive impact of EUR 0.3m.
Margin in %
in EUR m Q1 2020 Q1 2019 Change in %1) Q1 2020 Q1 2019
Adjusted EBITDA
Plastics & Devices 31.4 34.2 -8.1 19.9 21.3
Primary Packaging Glass 29.5 25.2 16.9 20.1 17.8
Advanced Technologies -4.2 1.0 >-100.0 - 15.5
Subtotal 56.7 60.4 -6.2 - -
Head office/consolidation -5.6 85.5 >-100.0 - -
Total adjusted EBITDA 51.1 145.9 -65.0 16.8 47.3
1) The change has been calculated on a EUR k basis.

QUART ERL Y ST ATEM ENT AS OF F EBRUARY 29, 2020 5
The following table shows the reconciliation of adjusted EBITDA to net
income and to adjusted net income after non-controlling interests:
in EUR m Q1 2020 Q1 2019 Change
Adjusted EBITDA 51.1 145.9 -94.8
Depreciation/Amortization -27.3 -23.2 -4.1
Adjusted EBITA 23.8 122.7 -98.9
Portfolio optimization -1.1 0.7 -1.8
One-off income and expenses1) - -0.6 0.6
Total of one-off effects -1.1 0.1 -1.2
Amortization of fair value
adjustments2) -10.9 -13.8 2.9
Results of operations 11.8 109.0 -97.2
Net finance expense -4.9 -7.0 2.1
Income taxes -2.7 -2.7 -
Net income 4.2 99.3 -95.1
Total of one-off effects 1.1 -0.1 1.2
Amortization of fair value
adjustments2) 10.9 13.8 -2.9
Related tax effect -2.6 -3.4 0.8
Adjusted net income 13.6 109.6 -96.0
Adjusted net income attributable
to non-controlling interests 0.1 0.4 -0.3
Adjusted net income after non-
controlling interests 13.5 109.2 -95.7
Adjusted earnings per share in EUR
after non-controlling interests 0.43 3.48 -3.05
1) The one-off income/expenses item consists of one-off items that cannot be taken as an
indicator of ongoing business. These include, for example, various reorganization and
structure changes that are not reportable as restructuring expenses in accordance with IFRS. 2) Amortization of fair value adjustments relates to the intangible assets identified at fair value
in connection with the acquisitions of Gerresheimer Zaragoza in January 2008; Vedat in
March 2011; Neutral Glass in April 2012; Triveni in December 2012; Centor in September
2015; and Sensile Medical in July 2018.
One-off effects amounted to a negative EUR 1.1m, compared to a
positive EUR 0.1m in the prior-year quarter, and relate in their entirety
to portfolio optimization, among other things in connection with the
previously announced reorganization of the Primary Packaging Glass
Division.
Net finance expense, at EUR 4.9m in the first quarter of 2020, was
EUR 2.1m lower than the EUR 7.0m recorded in the prior-year quarter.
Interest income in the amount of EUR 0.4m (Q1 2019: EUR 0.6m) was
countered by interest expenses of EUR 4.8m (Q1 2019: EUR 6.4m).
The decrease in interest expenses is mostly due to drawings on the
revolving credit facility being made almost entirely in euros, which incurs
a lower expense than US dollar drawings because of the difference in
the interest rate. Other financial expenses came to EUR 0.5m, down
from EUR 1.2m in the prior-year quarter.
The income taxes item for the first three months of the financial year
2020 shows a tax expense of EUR 2.7m, which is the same as in the
prior-year quarter. This results in a tax rate of 39.4% for the first quarter
of 2020, compared to 27.9% in the prior-year quarter excluding the
EUR 92.3m in non-taxable other operating income due to the
derecognition of contingent purchase price components from the
Sensile Medical acquisition. The tax rate was significantly higher than
the rate in the prior-year quarter due to the relatively low earnings
contribution from subsidiaries domiciled in low-tax jurisdictions. We
anticipate that this will normalize again over the course of the financial
year.
BALANCE SHEET
Total assets in the Gerresheimer Group increased relative to November
30, 2019 by EUR 9.1m to EUR 2,650.3m as of February 29, 2020. There
were no significant changes in balance sheet structure.
Intangible assets, property, plant and equipment and investment
property amounted to EUR 2,081.1m as of the reporting date
(November 30, 2019: EUR 2,068.3m) and thus increased by
EUR 12.8m. Intangible assets went down relative to November 30, 2019
by EUR 10.4m to EUR 1,346.8m as of February 29, 2020. The decrease
mainly relates to amortization in the amount of EUR 12.2m in the first
quarter of 2020. Our consolidated balance sheet as of February 29,
2020 includes EUR 670.9m in goodwill (November 30, 2019:
EUR 672.2m) and EUR 630.3m in customer relationships, brand names,
technologies and similar assets (November 30, 2019: EUR 641.3m).
Property, plant and equipment amounted to EUR 725.1m as of
February 29, 2020, compared to EUR 701.9m as of November 30, 2019.
The increase is primarily due to the initial application of IFRS 16, which
resulted in the recognition of right-of-use assets in the amount of
EUR 29.0m at the December 1, 2019 transition date. Alongside this,
there was EUR 22.5m in capital expenditure on property, plant and
equipment and EUR 25.8m in depreciation.
The Gerresheimer Group’s equity, including non-controlling interests,
stood at EUR 940.3m as of February 29, 2020 and was thus only
marginally down on the figure as of November 30, 2019 (EUR 941.6m).
This made for an equity ratio of 35.5%.
Non-current liabilities were EUR 821.5m as of February 29, 2020, an
increase of EUR 12.6m compared to the EUR 808.9m at the end of
November 2019. This is mainly due to the increase in lease liabilities in
connection with the transition to IFRS 16. Current liabilities decreased
by EUR 2.1m, from EUR 890.7m as of November 30, 2019 to
EUR 888.6m as of February 29, 2020. This reflects opposing factors:
On the one hand, there was a significant decrease in trade payables
and, on the other, a significant increase in current other financial
liabilities, mainly due to larger drawings on the revolving credit facility.
6 QUART ERL Y ST ATEM ENT AS OF F EBRUARY 29, 2020 Gerresheimer AG QUART ERL Y ST ATEM ENT DECEMBER 2019 – F EBRUAR Y 2020
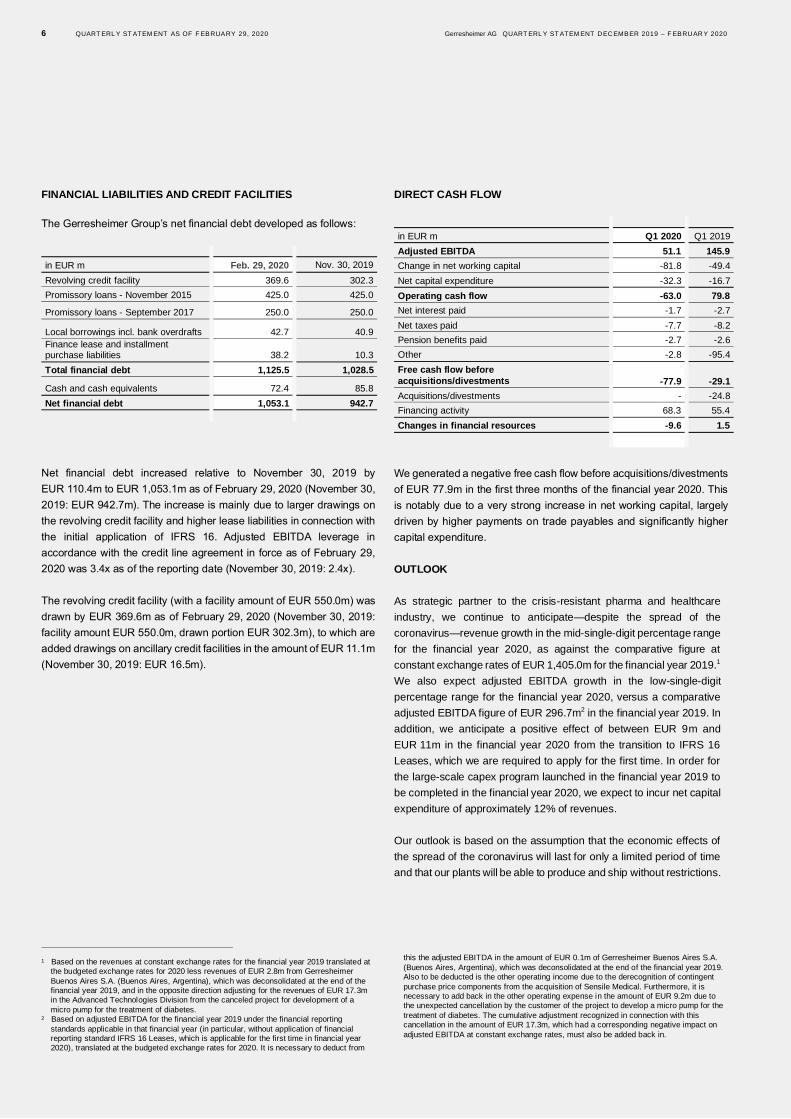
FINANCIAL LIABILITIES AND CREDIT FACILITIES
The Gerresheimer Group’s net financial debt developed as follows:
in EUR m Feb. 29, 2020 Nov. 30, 2019
Revolving credit facility 369.6 302.3
Promissory loans - November 2015 425.0 425.0
Promissory loans - September 2017 250.0 250.0
Local borrowings incl. bank overdrafts 42.7 40.9
Finance lease and installment purchase liabilities 38.2 10.3
Total financial debt 1,125.5 1,028.5
Cash and cash equivalents 72.4 85.8
Net financial debt 1,053.1 942.7
Net financial debt increased relative to November 30, 2019 by
EUR 110.4m to EUR 1,053.1m as of February 29, 2020 (November 30,
2019: EUR 942.7m). The increase is mainly due to larger drawings on
the revolving credit facility and higher lease liabilities in connection with
the initial application of IFRS 16. Adjusted EBITDA leverage in
accordance with the credit line agreement in force as of February 29,
2020 was 3.4x as of the reporting date (November 30, 2019: 2.4x).
The revolving credit facility (with a facility amount of EUR 550.0m) was
drawn by EUR 369.6m as of February 29, 2020 (November 30, 2019:
facility amount EUR 550.0m, drawn portion EUR 302.3m), to which are
added drawings on ancillary credit facilities in the amount of EUR 11.1m
(November 30, 2019: EUR 16.5m).
1 Based on the revenues at constant exchange rates for the financial year 2019 translated at
the budgeted exchange rates for 2020 less revenues of EUR 2.8m from Gerresheimer
Buenos Aires S.A. (Buenos Aires, Argentina), which was deconsolidated at the end of the
financial year 2019, and in the opposite direction adjusting for the revenues of EUR 17.3m
in the Advanced Technologies Division from the canceled project for development of a
micro pump for the treatment of diabetes. 2 Based on adjusted EBITDA for the financial year 2019 under the financial reporting
standards applicable in that financial year (in particular, without application of financial
reporting standard IFRS 16 Leases, which is applicable for the first time in financial year
2020), translated at the budgeted exchange rates for 2020. It is necessary to deduct from
DIRECT CASH FLOW
in EUR m Q1 2020 Q1 2019
Adjusted EBITDA 51.1 145.9
Change in net working capital -81.8 -49.4
Net capital expenditure -32.3 -16.7
Operating cash flow -63.0 79.8
Net interest paid -1.7 -2.7
Net taxes paid -7.7 -8.2
Pension benefits paid -2.7 -2.6
Other -2.8 -95.4
Free cash flow before
acquisitions/divestments -77.9 -29.1
Acquisitions/divestments - -24.8
Financing activity 68.3 55.4
Changes in financial resources -9.6 1.5
We generated a negative free cash flow before acquisitions/divestments
of EUR 77.9m in the first three months of the financial year 2020. This
is notably due to a very strong increase in net working capital, largely
driven by higher payments on trade payables and significantly higher
capital expenditure.
OUTLOOK
As strategic partner to the crisis-resistant pharma and healthcare
industry, we continue to anticipate—despite the spread of the
coronavirus—revenue growth in the mid-single-digit percentage range
for the financial year 2020, as against the comparative figure at
constant exchange rates of EUR 1,405.0m for the financial year 2019.1
We also expect adjusted EBITDA growth in the low-single-digit
percentage range for the financial year 2020, versus a comparative
adjusted EBITDA figure of EUR 296.7m2 in the financial year 2019. In
addition, we anticipate a positive effect of between EUR 9m and
EUR 11m in the financial year 2020 from the transition to IFRS 16
Leases, which we are required to apply for the first time. In order for
the large-scale capex program launched in the financial year 2019 to
be completed in the financial year 2020, we expect to incur net capital
expenditure of approximately 12% of revenues.
Our outlook is based on the assumption that the economic effects of
the spread of the coronavirus will last for only a limited period of time
and that our plants will be able to produce and ship without restrictions.
this the adjusted EBITDA in the amount of EUR 0.1m of Gerresheimer Buenos Aires S.A.
(Buenos Aires, Argentina), which was deconsolidated at the end of the financial year 2019.
Also to be deducted is the other operating income due to the derecognition of contingent
purchase price components from the acquisition of Sensile Medical. Furthermore, it is
necessary to add back in the other operating expense in the amount of EUR 9.2m due to
the unexpected cancellation by the customer of the project to develop a micro pump for the
treatment of diabetes. The cumulative adjustment recognized in connection with this
cancellation in the amount of EUR 17.3m, which had a corresponding negative impact on
adjusted EBITDA at constant exchange rates, must also be added back in.

TABUL ARL Y FINAN CIAL I NFORM ATION AS OF F EBRUARY 29, 2020 7
CONSOLIDATED INCOME STATEMENT
for the Period from December 1, 2019 to February 29, 2020
in EUR k Q1 2020 Q1 2019
Revenues 303,865 308,540
Cost of sales -224,212 -225,580
Gross profit 79,653 82,960
Selling and administrative expenses -67,553 -67,378
Other operating income 5,144 98,319
Restructuring expenses - 62
Other operating expenses -5,381 -4,944
Results of operations 11,863 109,019
Interest income 421 637
Interest expense -4,778 -6,389
Other financial expenses -544 -1,236
Net finance expense -4,901 -6,988
Net income before income taxes 6,962 102,031
Income taxes -2,746 -2,703
Net income 4,216 99,328
Attributable to equity holders of the parent 4,139 98,932
Attributable to non-controlling interests 77 396
Diluted and non-diluted earnings per share (in EUR) 0.13 3.15

8 TABUL ARL Y FINANCIAL I NFORM ATION AS OF F EBRUARY 29, 2020 Gerresheimer AG QUART ERL Y ST ATEM ENT DECEMBER 2019 – F EBRUAR Y 2020
CONSOLIDATED STATEMENT OF COMPREHENSIVE INCOME
for the Period from December 1, 2019 to February 29, 2020
in EUR k Q1 2020 Q1 2019
Net income 4,216 99,328
Results from the revaluation of defined benefit plans - -
Results from the revaluation of equity instruments - -
Income taxes - -
Other comprehensive income that will not be reclassified subsequently to profit or loss - -
Changes in the fair value of available-for-sale financial assets - -
Currency translation -3,813 1,253
Other comprehensive income that will be reclassified to profit or loss when specific conditions are met -3,813 1,253
Other comprehensive income -3,813 1,253
Total comprehensive income 403 100,581
Attributable to equity holders of the parent 230 99,733
Attributable to non-controlling interests 173 848
TABUL ARL Y FINANCIAL I NFORM ATION AS OF F EBRUARY 29, 2020 9
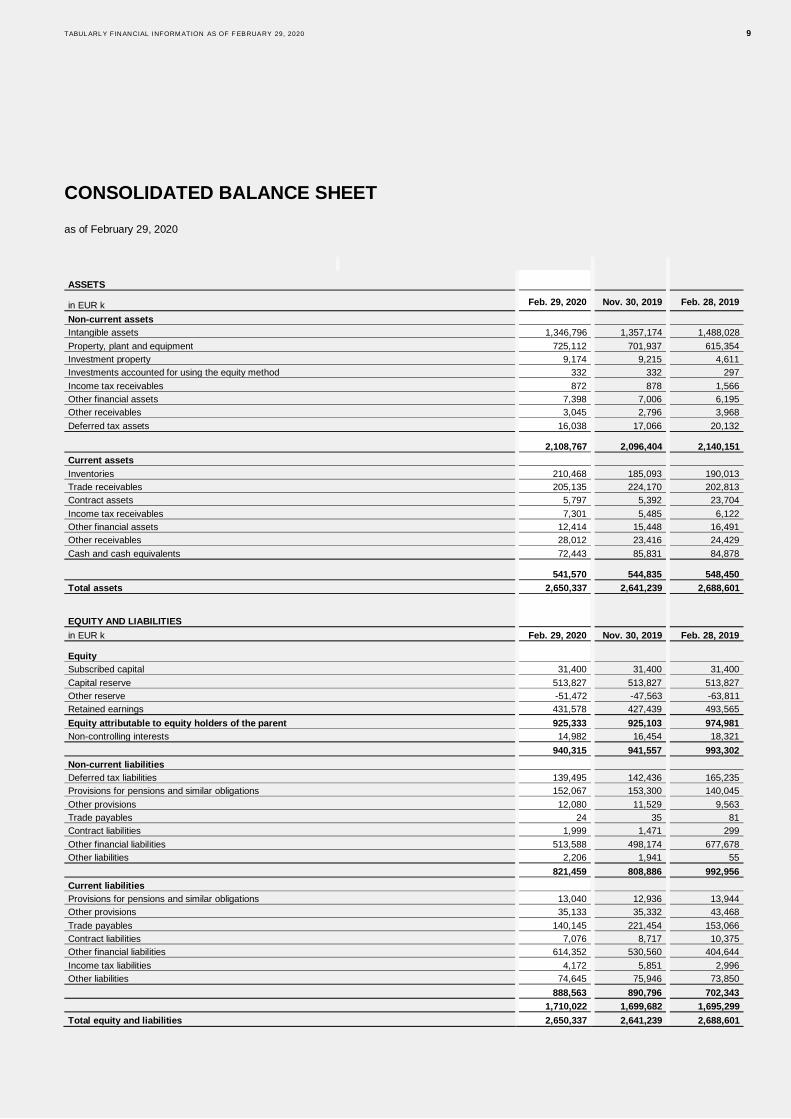
CONSOLIDATED BALANCE SHEET
as of February 29, 2020
ASSETS
in EUR k Feb. 29, 2020 Nov. 30, 2019 Feb. 28, 2019
Non-current assets
Intangible assets 1,346,796 1,357,174 1,488,028
Property, plant and equipment 725,112 701,937 615,354
Investment property 9,174 9,215 4,611
Investments accounted for using the equity method 332 332 297
Income tax receivables 872 878 1,566
Other financial assets 7,398 7,006 6,195
Other receivables 3,045 2,796 3,968
Deferred tax assets 16,038 17,066 20,132
2,108,767 2,096,404 2,140,151
Current assets
Inventories 210,468 185,093 190,013
Trade receivables 205,135 224,170 202,813
Contract assets 5,797 5,392 23,704
Income tax receivables 7,301 5,485 6,122
Other financial assets 12,414 15,448 16,491
Other receivables 28,012 23,416 24,429
Cash and cash equivalents 72,443 85,831 84,878
541,570 544,835 548,450
Total assets 2,650,337 2,641,239 2,688,601
EQUITY AND LIABILITIES
in EUR k Feb. 29, 2020 Nov. 30, 2019 Feb. 28, 2019
Equity
Subscribed capital 31,400 31,400 31,400
Capital reserve 513,827 513,827 513,827
Other reserve -51,472 -47,563 -63,811
Retained earnings 431,578 427,439 493,565
Equity attributable to equity holders of the parent 925,333 925,103 974,981
Non-controlling interests 14,982 16,454 18,321
940,315 941,557 993,302
Non-current liabilities
Deferred tax liabilities 139,495 142,436 165,235
Provisions for pensions and similar obligations 152,067 153,300 140,045
Other provisions 12,080 11,529 9,563
Trade payables 24 35 81
Contract liabilities 1,999 1,471 299
Other financial liabilities 513,588 498,174 677,678
Other liabilities 2,206 1,941 55
821,459 808,886 992,956
Current liabilities
Provisions for pensions and similar obligations 13,040 12,936 13,944
Other provisions 35,133 35,332 43,468
Trade payables 140,145 221,454 153,066
Contract liabilities 7,076 8,717 10,375
Other financial liabilities 614,352 530,560 404,644
Income tax liabilities 4,172 5,851 2,996
Other liabilities 74,645 75,946 73,850
888,563 890,796 702,343
1,710,022 1,699,682 1,695,299
Total equity and liabilities 2,650,337 2,641,239 2,688,601

10 TABUL ARL Y FINANCIAL I NFORM ATION AS OF F EBRUARY 29, 2020 Gerresheimer AG QUART ERL Y ST ATEM ENT DECEMBER 2019 – F EBRUAR Y 2020
CONSOLIDATED STATEMENT OF CHANGES IN EQUITY
for the Period from December 1, 2019 to February 29, 2020
Other comprehensive
income
in EUR k
Sub-
scribed
capital
Capital
reserve
IFRS 9-/
IAS 39-
reserve
Currency
translation
reserve Retained earnings
Equity
attributable to
equity holders
of the parent
Non
control-
ling
interests Total
equity
As of November 30/December 1, 2018 31,400 513,827 -6 -67,139 394,578 872,660 17,473 890,133
Conversion effect first-time adoption IFRS 15 - - - - 55 55 - 55
Conversion effect first-time adoption IFRS 9 - - 2,533 - - 2,533 - 2,533
Adjusted total as of December 1, 2018 31,400 513,827 2,527 -67,139 394,633 875,248 17,473 892,721
Net income - - - - 98,932 98,932 396 99,328
Other comprehensive income - - - 801 - 801 452 1,253
Total comprehensive income - - - 801 98,932 99,733 848 100,581
As of February 28, 2019 31,400 513,827 2,527 -66,338 493,565 974,981 18,321 993,302
As of November 30, 2019 31,400 513,827 3,094 -50,657 427,439 925,103 16,454 941,557
Net income - - - - 4,139 4,139 77 4,216
Other comprehensive income - - - -3,909 - -3,909 96 -3,813
Total comprehensive income - - - -3,909 4,139 230 173 403
Distribution - - - - - - -1,645 -1,645
As of February 29, 2020 31,400 513,827 3,094 -54,566 431,578 925,333 14,982 940,315
TABUL ARL Y FINANCIAL I NFORM ATION AS OF F EBRUARY 29, 2020 11
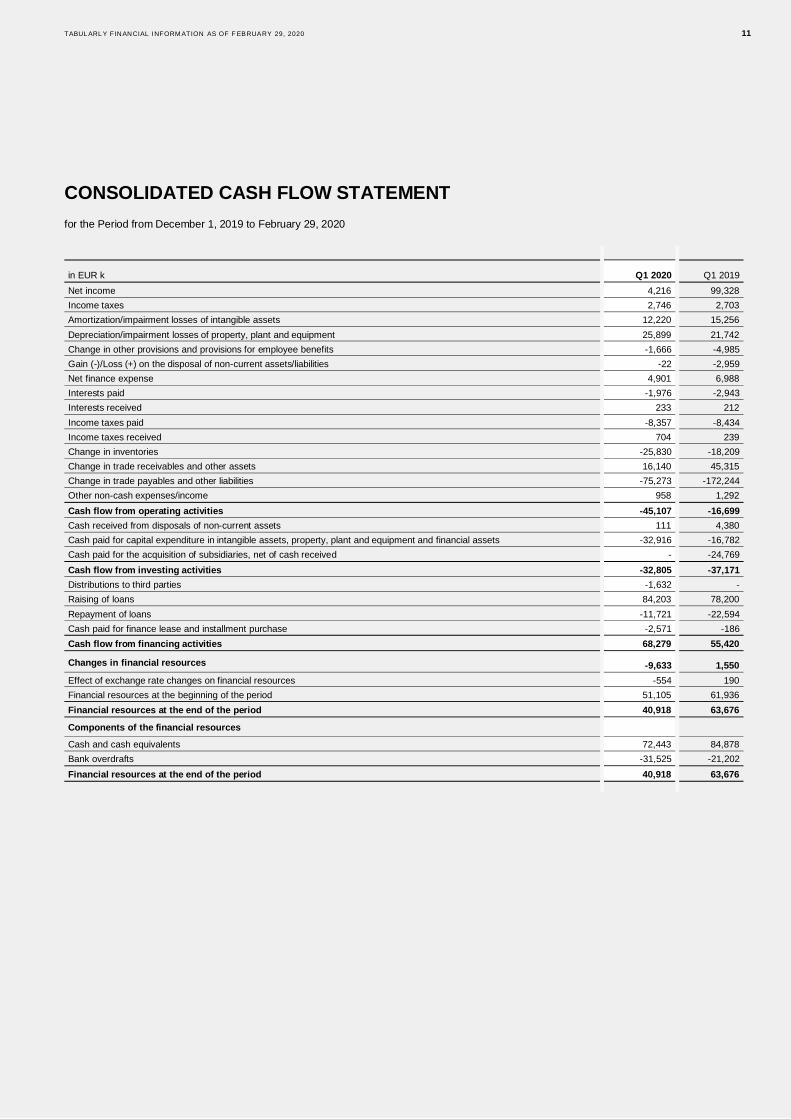
CONSOLIDATED CASH FLOW STATEMENT
for the Period from December 1, 2019 to February 29, 2020
in EUR k Q1 2020 Q1 2019
Net income 4,216 99,328
Income taxes 2,746 2,703
Amortization/impairment losses of intangible assets 12,220 15,256
Depreciation/impairment losses of property, plant and equipment 25,899 21,742
Change in other provisions and provisions for employee benefits -1,666 -4,985
Gain (-)/Loss (+) on the disposal of non-current assets/liabilities -22 -2,959
Net finance expense 4,901 6,988
Interests paid -1,976 -2,943
Interests received 233 212
Income taxes paid -8,357 -8,434
Income taxes received 704 239
Change in inventories -25,830 -18,209
Change in trade receivables and other assets 16,140 45,315
Change in trade payables and other liabilities -75,273 -172,244
Other non-cash expenses/income 958 1,292
Cash flow from operating activities -45,107 -16,699
Cash received from disposals of non-current assets 111 4,380
Cash paid for capital expenditure in intangible assets, property, plant and equipment and financial assets -32,916 -16,782
Cash paid for the acquisition of subsidiaries, net of cash received - -24,769
Cash flow from investing activities -32,805 -37,171
Distributions to third parties -1,632 -
Raising of loans 84,203 78,200
Repayment of loans -11,721 -22,594
Cash paid for finance lease and installment purchase -2,571 -186
Cash flow from financing activities 68,279 55,420
Changes in financial resources -9,633 1,550
Effect of exchange rate changes on financial resources -554 190
Financial resources at the beginning of the period 51,105 61,936
Financial resources at the end of the period 40,918 63,676
Components of the financial resources
Cash and cash equivalents 72,443 84,878
Bank overdrafts -31,525 -21,202
Financial resources at the end of the period 40,918 63,676
12 TABUL ARL Y FINANCIAL I NFORM ATION AS OF F EBRUARY 29, 2020 Gerresheimer AG QUART ERL Y ST ATEM ENT DECEMBER 2019 – F EBRUARY 2020
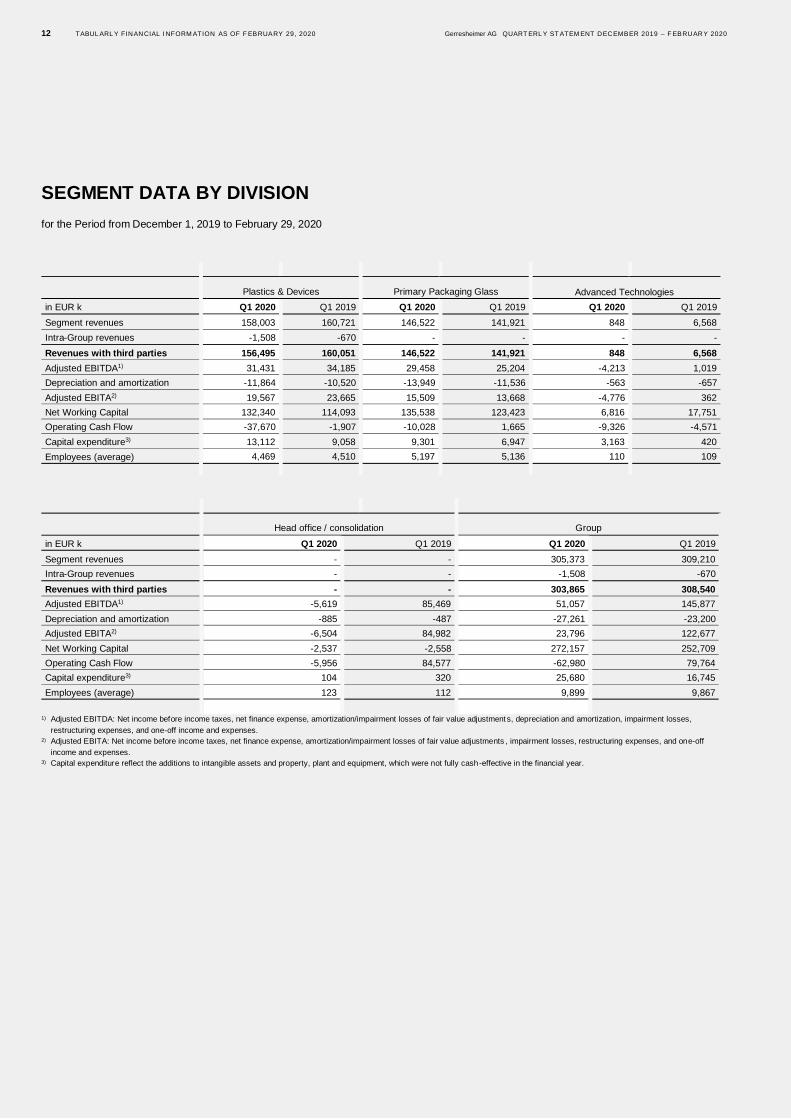
SEGMENT DATA BY DIVISION
for the Period from December 1, 2019 to February 29, 2020
Plastics & Devices Primary Packaging Glass Advanced Technologies
in EUR k Q1 2020 Q1 2019 Q1 2020 Q1 2019 Q1 2020 Q1 2019
Segment revenues 158,003 160,721 146,522 141,921 848 6,568
Intra-Group revenues -1,508 -670 - - - -
Revenues with third parties 156,495 160,051 146,522 141,921 848 6,568
Adjusted EBITDA1) 31,431 34,185 29,458 25,204 -4,213 1,019
Depreciation and amortization -11,864 -10,520 -13,949 -11,536 -563 -657
Adjusted EBITA2) 19,567 23,665 15,509 13,668 -4,776 362
Net Working Capital 132,340 114,093 135,538 123,423 6,816 17,751
Operating Cash Flow -37,670 -1,907 -10,028 1,665 -9,326 -4,571
Capital expenditure3) 13,112 9,058 9,301 6,947 3,163 420
Employees (average) 4,469 4,510 5,197 5,136 110 109
Head office / consolidation Group
in EUR k Q1 2020 Q1 2019 Q1 2020 Q1 2019
Segment revenues - - 305,373 309,210
Intra-Group revenues - - -1,508 -670
Revenues with third parties - - 303,865 308,540
Adjusted EBITDA1) -5,619 85,469 51,057 145,877
Depreciation and amortization -885 -487 -27,261 -23,200
Adjusted EBITA2) -6,504 84,982 23,796 122,677
Net Working Capital -2,537 -2,558 272,157 252,709
Operating Cash Flow -5,956 84,577 -62,980 79,764
Capital expenditure3) 104 320 25,680 16,745
Employees (average) 123 112 9,899 9,867
1) Adjusted EBITDA: Net income before income taxes, net finance expense, amortization/impairment losses of fair value adjustment s, depreciation and amortization, impairment losses,
restructuring expenses, and one-off income and expenses. 2) Adjusted EBITA: Net income before income taxes, net finance expense, amortization/impairment losses of fair value adjustments , impairment losses, restructuring expenses, and one-off
income and expenses. 3) Capital expenditure reflect the additions to intangible assets and property, plant and equipment, which were not fully cash-effective in the financial year.

FURTHER INFORM ATION 13
FINANCIAL CALENDAR
June 24, 2020 Annual General Meeting 2020
July 14, 2020 Publication 2nd Quarter 2020
October 13, 2020 Publication 3rd Quarter 2020
IMPRINT
Publisher
Gerresheimer AG
Klaus-Bungert-Strasse 4
40468 Duesseldorf
Germany
Tel +49 211 61 81-00
Fax +49 211 61 81-295
E-mail [email protected]
www.gerresheimer.com
Note to the Quarterly Statement
This Quarterly Statement is the English translation of the original German version; in case of deviations between these two, the German version
prevails
Note regarding the rounding of figures
Due to the commercial rounding of figures and percentages, small deviations may occur.
Disclaimer
This Quarterly Statement contains certain future-oriented statements. Future-oriented statements include all statements which do not relate to
historical facts and events and contain future-oriented expressions such as “believe”, “estimate”, “assume”, “expect”, “forecast”, “intend”, “could” or
“should” or expressions of a similar kind. Such future-oriented statements are subject to risks and uncertainties since they relate to future events and
are based on the Company’s current assumptions, which may not in the future take place or be fulfilled as expected. The Company points out that
such future-oriented statements provide no guarantee for the future and that actual events including the financial position and profitability of the
Gerresheimer Group and developments in the economic and regulatory fundamentals may vary substantially (particularly on the down side) from
those explicitly or implicitly assumed or described in these statements. Even if the actual results for the Gerresheimer Group, including its financial
position and profitability and the economic and regulatory fundamentals, are in accordance with such future-oriented statements in this Quarterly
Statement, no guarantee can be given that this will continue to be the case in the future.

14 TABUL ARL Y FINANCIAL I NFORM ATION AS OF F EBRUARY 29, 2020 Gerresheimer AG QUART ERL Y ST ATEM ENT DECEMBER 2019 – F EBRUARY 2020
Gerresheimer AG
Klaus-Bungert-Strasse 4
40468 Duesseldorf
Deutschland
Tel. +49 211 61 81-00
Fax +49 211 61 81-295
E-Mail [email protected]
www.gerresheimer.com