Otter surveillance in SACs: testing the protocol
45
working today for nature tomorrow Otter surveillance in SACs: testing the protocol English Nature Research Reports Report Number 664
Transcript of Otter surveillance in SACs: testing the protocol
working today for nature tomorrow
Otter surveillance in SACs:testing the protocol
English Nature Research Reports
Report Number664

English Nature Research Reports
Number 664
Otter surveillance in SACs: testing the protocol
Paul Chanin North View Cottage
Union Road Crediton EX17 3AL
2005
You may reproduce as many additional copies of this report as you like, provided such copies stipulate that
copyright remains with English Nature, Northminster House, Peterborough PE1 1UA
ISSN 0967-876X © Copyright English Nature 2005

Summary Otter surveys were carried out on five SAC rivers where the species is a primary feature of interest: Camel, Cumbrian Derwent, Eden, Tweed and Wye. The protocol recommended in the report prepared for the Life in UK Rivers project (Chanin 2003) was found be practical and to record a high proportion of positive sites except on the river Derwent, shortly after a severe spate. Information on the time taken to do surveys and the distance travelled was recorded to simplify costing of future surveys. Recommendations are made for minor changes to the information recorded during preliminary surveys but no significant changes to the protocol will be necessary.


Contents Summary 1. Background and brief.....................................................................................................9 2. Methods..........................................................................................................................9
2.1 Identifying sites..................................................................................................9 2.2 Site naming and numbering .............................................................................10 2.3 Grid references.................................................................................................10 2.4 Surveying sites .................................................................................................11 2.5 Recording.........................................................................................................11
2.5.1 Site information ...................................................................................11 2.5.2 Times and distances .............................................................................11
3. Results ..........................................................................................................................12 3.1 Times and distances .........................................................................................12 3.2 Costs.................................................................................................................13 3.3 Site selection ....................................................................................................13
3.3.1 Size of waterway..................................................................................14 3.4 Information on the sites ...................................................................................15
3.4.1 Water levels .........................................................................................15 3.4.2 Need for artificial spraint sites.............................................................15 3.4.3 Access ..................................................................................................16
3.5 Otter signs ........................................................................................................17 3.6 Comparison with other surveys .......................................................................17
3.6.1 National surveys...................................................................................17 3.6.2 Regional and local surveys ..................................................................18 3.6.3 Spot checks in Wales ...........................................................................18
3.7 Factors influencing results ...............................................................................19 3.7.1 Time of year.........................................................................................19 3.7.2 Impact of tourism.................................................................................22
4. Recommendations........................................................................................................22 4.1 Changes to the protocol ...................................................................................22
4.1.1 Time of year.........................................................................................22 4.1.2 Survey distance ....................................................................................23 4.1.3 Recording form ....................................................................................24 4.1.4 Would less experienced surveyors take longer? ..................................26
4.2 Guidance for surveyors ....................................................................................26 4.2.1 Search pattern.......................................................................................26 4.2.2 Equipment ............................................................................................27
5. Conclusions..................................................................................................................27 6. References....................................................................................................................28 Appendices ..........................................................................................................................29 Appendix A. List of survey sites with results........................................................................29 Appendix B. Survey results...................................................................................................37 Appendix C. Artificial spraint site on Camel ........................................................................39 Appendix D. a) Otter monitoring form as used in the survey ...............................................41 b) Form recommended for future use. .............................................................41

9
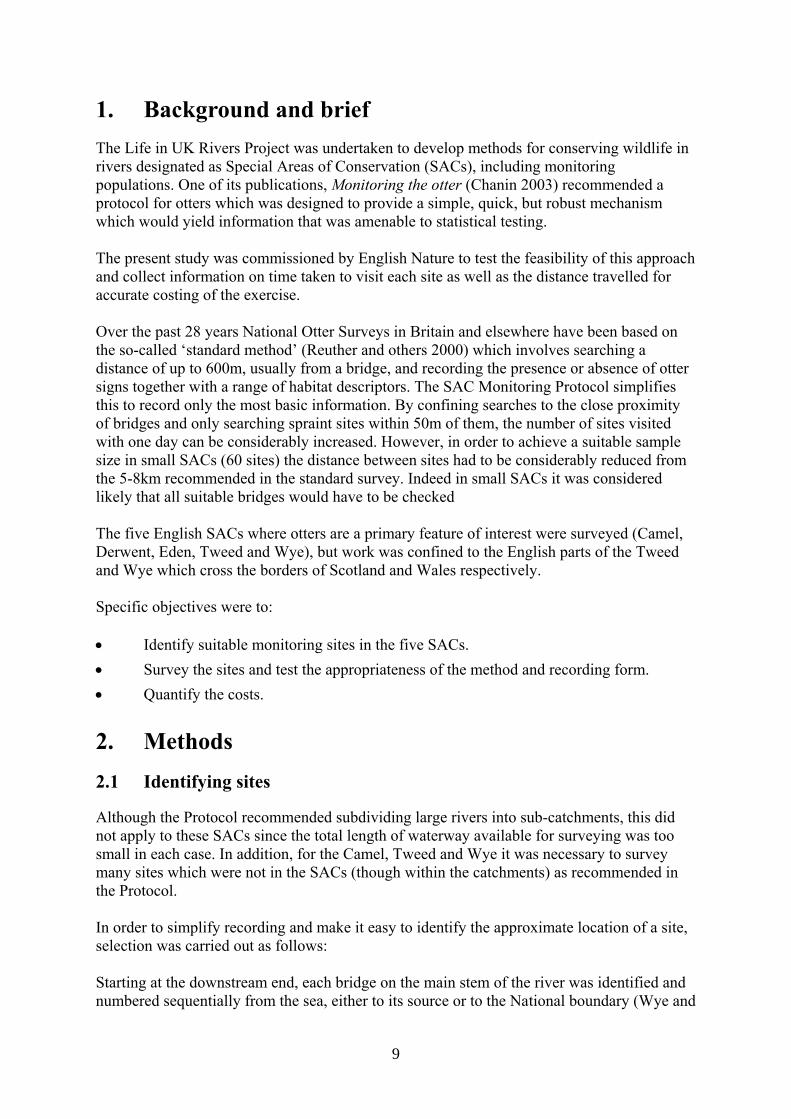
1. Background and brief The Life in UK Rivers Project was undertaken to develop methods for conserving wildlife in rivers designated as Special Areas of Conservation (SACs), including monitoring populations. One of its publications, Monitoring the otter (Chanin 2003) recommended a protocol for otters which was designed to provide a simple, quick, but robust mechanism which would yield information that was amenable to statistical testing. The present study was commissioned by English Nature to test the feasibility of this approach and collect information on time taken to visit each site as well as the distance travelled for accurate costing of the exercise. Over the past 28 years National Otter Surveys in Britain and elsewhere have been based on the so-called ‘standard method’ (Reuther and others 2000) which involves searching a distance of up to 600m, usually from a bridge, and recording the presence or absence of otter signs together with a range of habitat descriptors. The SAC Monitoring Protocol simplifies this to record only the most basic information. By confining searches to the close proximity of bridges and only searching spraint sites within 50m of them, the number of sites visited with one day can be considerably increased. However, in order to achieve a suitable sample size in small SACs (60 sites) the distance between sites had to be considerably reduced from the 5-8km recommended in the standard survey. Indeed in small SACs it was considered likely that all suitable bridges would have to be checked The five English SACs where otters are a primary feature of interest were surveyed (Camel, Derwent, Eden, Tweed and Wye), but work was confined to the English parts of the Tweed and Wye which cross the borders of Scotland and Wales respectively. Specific objectives were to: • Identify suitable monitoring sites in the five SACs. • Survey the sites and test the appropriateness of the method and recording form. • Quantify the costs. 2. Methods 2.1 Identifying sites
Although the Protocol recommended subdividing large rivers into sub-catchments, this did not apply to these SACs since the total length of waterway available for surveying was too small in each case. In addition, for the Camel, Tweed and Wye it was necessary to survey many sites which were not in the SACs (though within the catchments) as recommended in the Protocol. In order to simplify recording and make it easy to identify the approximate location of a site, selection was carried out as follows: Starting at the downstream end, each bridge on the main stem of the river was identified and numbered sequentially from the sea, either to its source or to the National boundary (Wye and
10
Tweed). This was repeated on tributaries, starting with the largest and progressively numbering smaller streams until 80 to 90 sites had been identified. On the Camel and Tweed, some second order tributaries were included in the selection. Only bridges on public roads, or those to which public roads led, were included and these were identified solely on the basis of information from Ordnance Survey 1:50,000 maps. Thus roads shown without colour (“other roads, drive or track”) were omitted. In a few cases ‘bridges’ turned out to be fords, though most had footbridges alongside. A small number of sites which did not fit these criteria proved to be suitable for survey, for example some weirs in Cumbria and Northumberland and a railway bridge in Penrith. An effort was made to avoid using large numbers of sites where streams were very small and likely to be culverted rather than bridged. Experience of surveys in Southwest England (Chanin, unpubl.) shows that spraints are less likely to be found at small piped culverts than at other types of road crossing. 2.2 Site naming and numbering
In addition to the sequential numbers referred to above, sites were given a four letter prefix identifying the SAC and tributary in question. Thus CaMn## was used for sites on the main stem of the Camel and DeGr## for sites on the Greta, a tributary of the Derwent. In some cases (on the Camel, Derwent and Tweed), one or two bridges at the lower end of a small tributary were included but not all the bridges on that tributary. This was done partly to increase sample size without including large number of sites where the streams were very small, but also to fill gaps (particularly along lake sides) where the distances between sites were large. In these cases, rather than add complexity by including a new tributary to the numbering system, the sites were included within the numbering sequence of the river into which they flowed. For example DeCo10 - 12 are on small streams flowing between Loweswater and Crummock Water while the Cocker itself flows out of Crummock Water. Where this has happened, the name of the actual tributary (if shown on the map) is recorded. When there was no name on the map (some of the smaller Camel tributaries) a local place-name was used to identify the stream. These are indicated in Appendix A by brackets around the name in the Tributary column of the table. Finally, a substantial tributary of the Eden, the Eamont only had three bridges along its length and two of these were considered unsuitable for surveying. Rather than include a tributary with only a single site, this was included in the Lowther sequence as EdLo01. Note that the sites which were excluded from the survey are not included in the final numbering sequence on the grounds that this would cause confusion. 2.3 Grid references
The locations of survey sites were first identified on a digitised version of the Ordnance Survey Landranger (1:50,000) maps supplied by Memory Map Inc. Sites were marked and numbered as ‘waypoints’ on-screen and their grid references exported as text files in the form SX 54321 09876. These were subsequently imported into MS Access and converted to the conventional ‘six-figure’ reference (SX 123456; see appendix A) and to XY co-ordinates (for export to GIS) to a precision of 10m.

11
There are obvious inherent inaccuracies of giving a location precise to 1m when the bridge could be several metres wide and several tens of metres long. In addition, Memory Map outputs values at 5m intervals - probably because of the screen resolution used. GIS references are therefore simply truncated to the 10m value below the exported value (similar to the convention for ‘six-figure’ grid references) in the spreadsheet accompanying this report. 2.4 Surveying sites
Sites were visited between 15 December 2004 and 14 April 2005. As recommended in the Protocol the area beneath and beside the bridge was searched first and if no signs were found there the survey was extended further, up to a distance of 50m on either side of the bridge, checking first the sites most likely to have spraints or footprints. The essential strategy being to determine quickly whether or not signs were present and then move on. It was not intended that the full 100m of stream would be searched at each site as this would substantially increase survey time with no benefit in terms of useful additional information collected. In many cases it was possible to do a direct search of suitable sites but at some the use of binoculars was essential. This was either because the river bank was inaccessible but spraints or footprints could be seen or because the spraint sites or mud-banks themselves could not be reached because of deep water. 2.5 Recording
2.5.1 Site information
The recording form illustrated in the Protocol was used with minor modifications (See Appendix D). In practice however it was found that there was scope for including far too much information - for example where potential spraint sites were numerous. Conversely at many sites the potential sprainting places were very few and very obvious, ledges under bridges, being a good example. These were present at a high proportion of bridges on the Wye and were the most frequently used spraint sites on that catchment. Subsequently, only the location of sites or footprints more than 5m from the bridge were noted. Another complicating factor was that, since this survey was carried out in winter when water levels are likely to be high, different spraint sites might be favoured by otters during the summer (when these surveys were originally recommended). Also, more patches of mud and sand are likely to be exposed during the summer. Detailed notes on access are only given where there may be some doubt as to the best way to get to the river bank. 2.5.2 Times and distances
One of the requirements for the project is to quantify costs for monitoring SACs using this method. In particular the project brief requires the recording of the time taken to visit each site, the number of sites visited within a day and the mileage between sites.
12
In order to provide information which can be used as flexibly as possible, the following information was recorded: • Start time and end time at a site, from which both time spent surveying at each site
and travel time between sites can be calculated. • Time travelling to the first site from a base within the catchment (when possible). • Time travelling to the catchment from the surveyor’s home in Devon. • Mileage reading at each site. • Mileage at the start of each day. • Distance between Devon and the catchment ‘Base’. 3. Results 3.1 Times and distances
Table 1 summarises the estimated time needed to carry out the surveys on each catchment as well as distances travelled. In each case the time within the catchment has been adjusted on the assumption that the surveyor will start from a significant sized town within the catchment - described as ‘Base’ in the table. Table 2 records the mean time spent surveying at a site together with the mean distance and travel times between sites on the catchment. Note that this excludes travel time and distance between one tributary and the next. Table 3 shows the additional travelling time and distances involved because surveys were carried out by a person based in Devon. Table 1. Time (hours) and distance travelled (miles) within the catchment SAC Base Time Distance Camel Bodmin 17 140 Derwent Keswick 18 100 Eden Penrith 24 330 Tweed Berwick 17 190 Wye Hereford 18 220 Table 2. Mean survey time (decimal minutes) at each site and time and distance (miles) between sites on the same tributary
SAC Survey time
Travel time
Total time
Distance
Camel 7.0 5.0 12.0 1.5 Derwent 7.7 5.3 13.0 1.9 Eden 9.1 7.9 17.0 2.9 Tweed 7.5 5.3 12.8 2.0 Wye 8.1 6.3 14.4 2.5
13
Table 3. Time and distance involved in getting to each SAC from Devon SAC Time Distance Camel 3 130 Derwent 12 680 Eden 12 660 Tweed 16 930 Wye 6 240 Total 49 2640 3.2 Costs
The actual costs of carrying out these will depend on the rate charged and this will vary considerably depending on whether independent contractors are used or not. Table 1 shows that it took approximately 6 hours longer to survey the Eden. This river is the largest (extreme points surveyed being ca 70km apart but it was also subject to a modest handicap following snowfall. Allowing for contingences and surveyors with a little less experience, a time of 3 - 3.5 days would seem adequate for fieldwork. Time would also be needed for the preparation of maps and recording forms and for producing results in a suitable format. Assuming that the work was done by a local person (no subsistence) paid at the rate of £300 per day and 40p per mile the Camel, Derwent, Tweed and Wye could be surveyed for approximately £1300 each. Based on similar assumptions, £1,650 should be allowed for the Eden. The additional cost of employing the same person to carry out all five surveys would be approximately £3,700 (£740 per SAC) if they were based in Devon. The cost would be less for someone living closer to the three northern SACs, ca 45% less for someone based in Penrith for example. 3.3 Site selection
During the survey, sites were classified into three categories: those which are clearly suitable; those which might be suitable and those which are definitely not suitable. Sites were rejected for three principle reasons: • Difficult or impossible to gain access to the riverside for surveying. NB sites which
could be adequately surveyed without gaining access to the riverside were not excluded.
• No suitable spraint sites and no scope for installing an artificial spraint site. • Very small, usually culverted, less than a metre wide and 10cm deep, often
surrounded by impenetrable hedges. Sites which were positive at the time of survey are, by definition, suitable as is any site where potential spraint sites are obvious.

14
Sites which were considered ‘possible’ included those where: • It was considered likely that lower water levels in the summer would probably expose
suitable places not visible at the time of survey, ledges or sand/mud banks beneath the bridge for example.
• Access to the bank was limited, either with ‘Private’ notices or because they were within gardens.
• An artificial spraint site could be installed to compensate for the lack of natural sites. These were reviewed after the survey was complete in order to determine whether or not they should be used. The first consideration was whether there were 60 suitable sites without including those in this category. This was the case on the Wye so none were included in the final list of sites. In other SACs there was a small shortfall which was made up by selecting the ‘next best’ sites from this list of ‘possibles’. A full list of sites together with grid references, physical data and survey results is included as Appendix A. Table 4. Number of sites surveyed and selected for each catchment SAC Surveyed Selected Camel 78 60 Derwent 74 60 Eden 69 62 Tweed 66 55 Wye 70 63
TOTAL 357 300
3.3.1 Size of waterway
The method used to identify sites for initial survey involved first selecting bridges on the main river, then the largest tributaries in order to include reasonable numbers of sites where the rivers were large or medium sized. Overall, in every catchment, the number of very small bridges or culverts is likely to greatly outnumber these. Further selection occurred during the survey process when sites where the streams were very small and culverted were rejected unless they had good spraint sites nearby. Despite this, on the Camel, the proportion of ‘large’ sites was very low compared to other SACs due to the small size of the river. Figure 1 shows the proportions of sites at different widths in each SAC and it is clear that the smaller catchments, Camel, Derwent and Tweed have the highest proportion of small streams. On the Camel, only three sites exceeded 15m in width.

15
0%
10%
20%
30%
40%
50%
60%
70%
Camel Derwent Eden Tweed Wye
< 5m5 - 15m15 - 30m>30m
Figure 1 Stream size as indicated by width at each site
3.4 Information on the sites
3.4.1 Water levels
The survey monitoring form includes the question “are water levels normal?” It was anticipated that the surveys would be carried out by people with local knowledge who would be able to make an assessment based on their knowledge of the area under normal circumstances. Coming from outside the catchment in each case, it was only possible to make an assessment of water levels based on the evidence of recent flooding and other indicators such as high turbidity. It would appear that at the time of survey, all of these rivers were at a level which is typical for the time of year. Based on experience with upland rivers in Devon, it seems likely that during the summer, water levels would normally be lower, exposing more spraint sites in the form of boulders, ledges under bridges etc and more mud/sand banks which would show up footprints. The only SAC where precipitation (rain and snow) had any discernible effect on the river during the survey itself was the Derwent. Water levels did not noticeably rise but the water was more turbid towards the end of the second day of surveying. In all SACs it was clear that there had been higher water levels at some time in the previous few weeks. On the Derwent there had been a major flood event only 10 days previously (see below) while on the Tweed there had been a less severe spate approximately two weeks previously. The severe flooding which had affected the Derwent had an even greater impact on the adjacent Eden, but this river was surveyed a month later. 3.4.2 Need for artificial spraint sites
Bridges which would only be suitable if an artificial spraint site could be installed were described as ‘possible sites’ during the preliminary survey. In reviewing these, preference was given those which were likely to be suitable under summer conditions or where
16
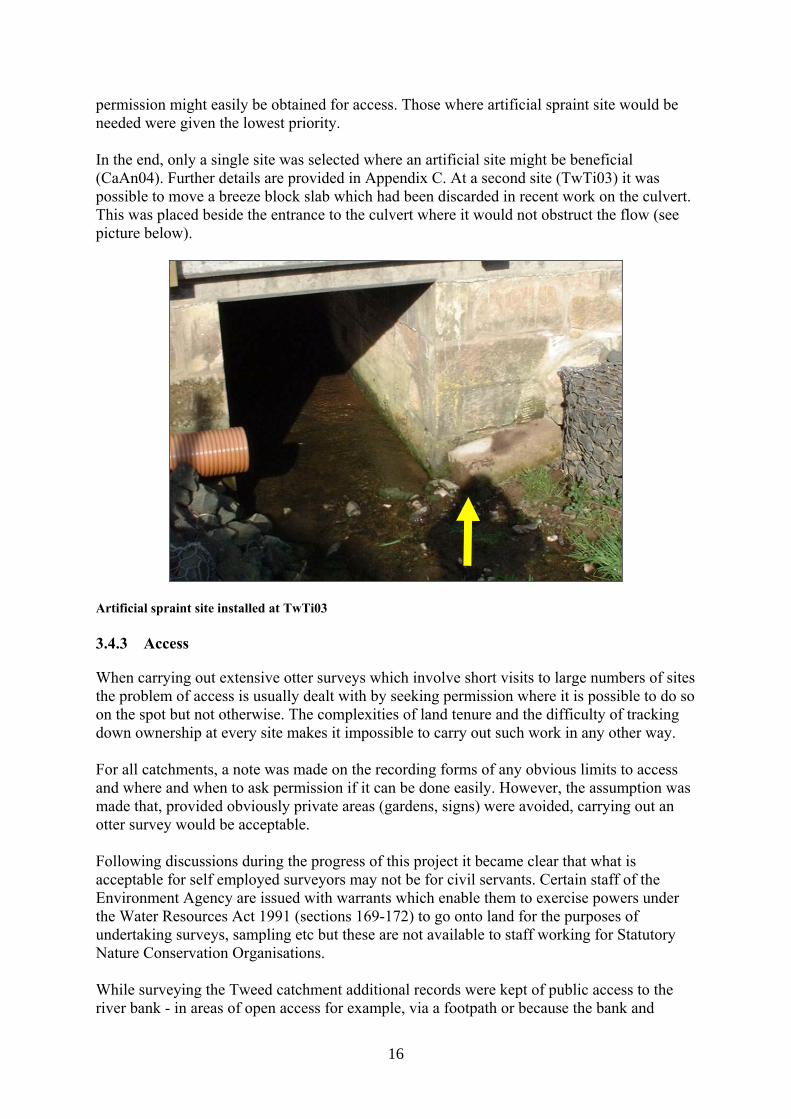
permission might easily be obtained for access. Those where artificial spraint site would be needed were given the lowest priority. In the end, only a single site was selected where an artificial site might be beneficial (CaAn04). Further details are provided in Appendix C. At a second site (TwTi03) it was possible to move a breeze block slab which had been discarded in recent work on the culvert. This was placed beside the entrance to the culvert where it would not obstruct the flow (see picture below).
Artificial spraint site installed at TwTi03 3.4.3 Access
When carrying out extensive otter surveys which involve short visits to large numbers of sites the problem of access is usually dealt with by seeking permission where it is possible to do so on the spot but not otherwise. The complexities of land tenure and the difficulty of tracking down ownership at every site makes it impossible to carry out such work in any other way. For all catchments, a note was made on the recording forms of any obvious limits to access and where and when to ask permission if it can be done easily. However, the assumption was made that, provided obviously private areas (gardens, signs) were avoided, carrying out an otter survey would be acceptable. Following discussions during the progress of this project it became clear that what is acceptable for self employed surveyors may not be for civil servants. Certain staff of the Environment Agency are issued with warrants which enable them to exercise powers under the Water Resources Act 1991 (sections 169-172) to go onto land for the purposes of undertaking surveys, sampling etc but these are not available to staff working for Statutory Nature Conservation Organisations. While surveying the Tweed catchment additional records were kept of public access to the river bank - in areas of open access for example, via a footpath or because the bank and

17
bridge were within the highway boundary. It was found that this was so at approximately 50% of sites. Under these circumstances it may be more effective for English Nature to sub-contract the surveys rather than use their own staff. The work could be done either by the Environment Agency, or by an individual who would take responsibility for dealing appropriately with circumstances. A further possibility may be collaboration with the Environment Agency if this would enable an independent surveyor to work under their supervision. 3.5 Otter signs
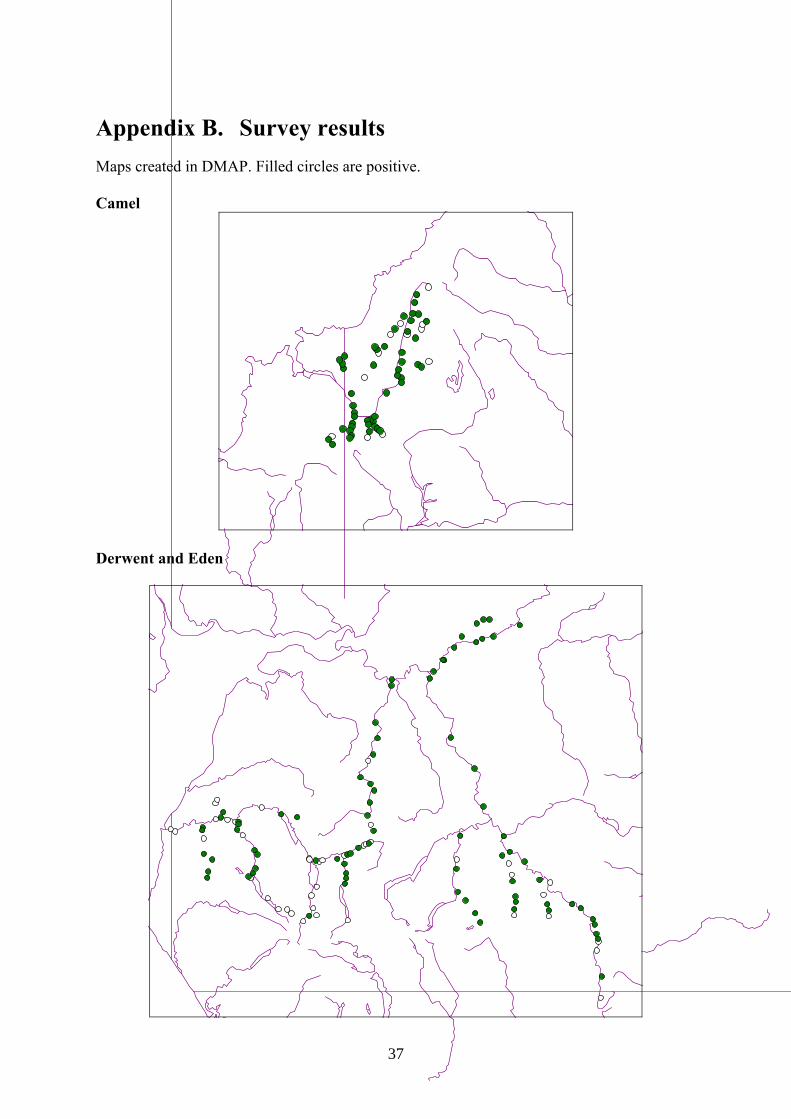
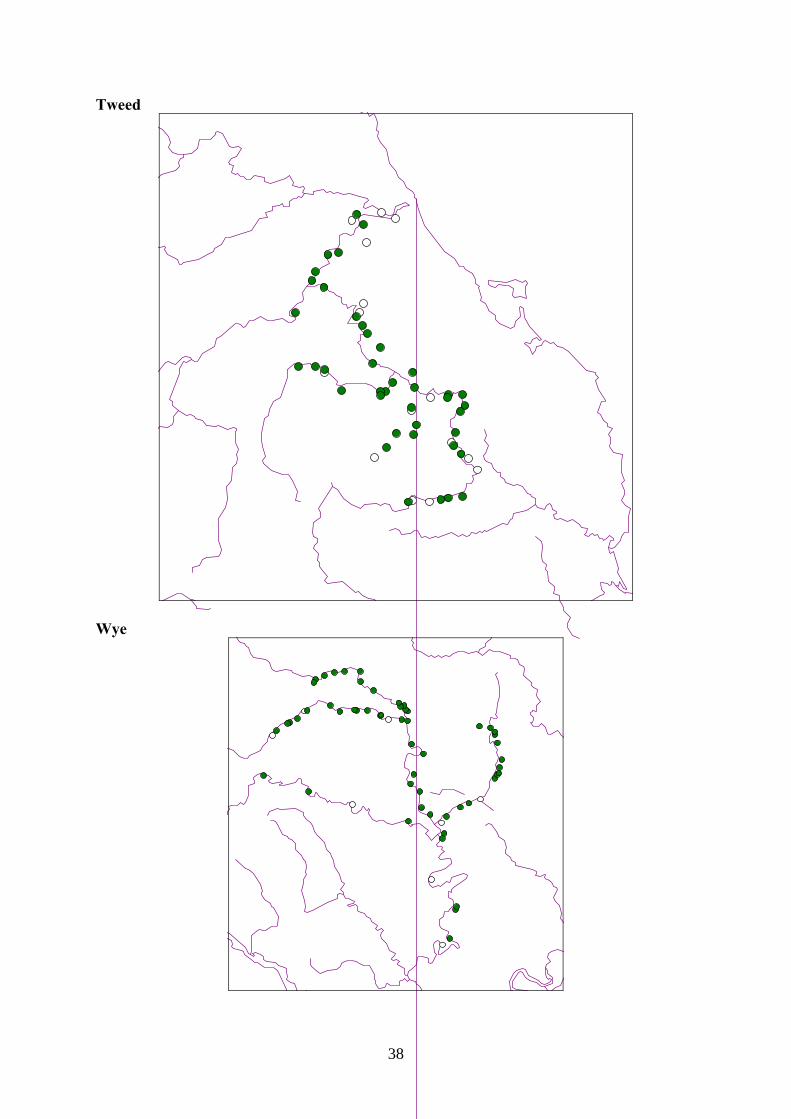
In most SACs signs of otters were found at between 74% and 90% of sites, a surprisingly high proportion (table 5). However the proportion of positive sites on the Derwent was noticeably lower (50%), probably as a result of the recent spate. Table 5. Proportion of positive sites SAC % Pos. Camel 80% Derwent 50% Eden 82% Tweed 74% Wye 87% Despite this, there was no apparent impact on the number of spraints per positive site on the Derwent which was slightly higher than on the Eden where there had been more time for recovery. However the Derwent had a higher proportion of fresh spraints than other sites which may reflect the relatively short time since the spate. Table 6. Proportion of spraints recorded that were fresh (‘not yet dry’) at each site and mean number of spraints per positive site. SAC % Fresh Mean No. Camel 40% 2.7 Derwent 60% 2.1 Eden 48% 1.8 Tweed 35% 2.7 Wye 36% 4.7 Maps showing the distribution of sites are in Appendix B. 3.6 Comparison with other surveys
3.6.1 National surveys
On those catchments where there were adequate numbers of sites for comparison, the results for the present survey were broadly comparable with the National Survey of 2000 - 2002 (Crawford 2003) though there was no consistent trend for SAC Survey results to be either higher or lower than National Surveys (Table 7).
18
Table 7. Comparison of SAC survey results with those from the most recent National Survey
Sites 4th National Survey
Present Survey
Camel 13 92% 80% Derwent 1 - 50% Eden 75 69% 82% Tweed 23 87% 74% Wye 70 83% 87% 3.6.2 Regional and local surveys
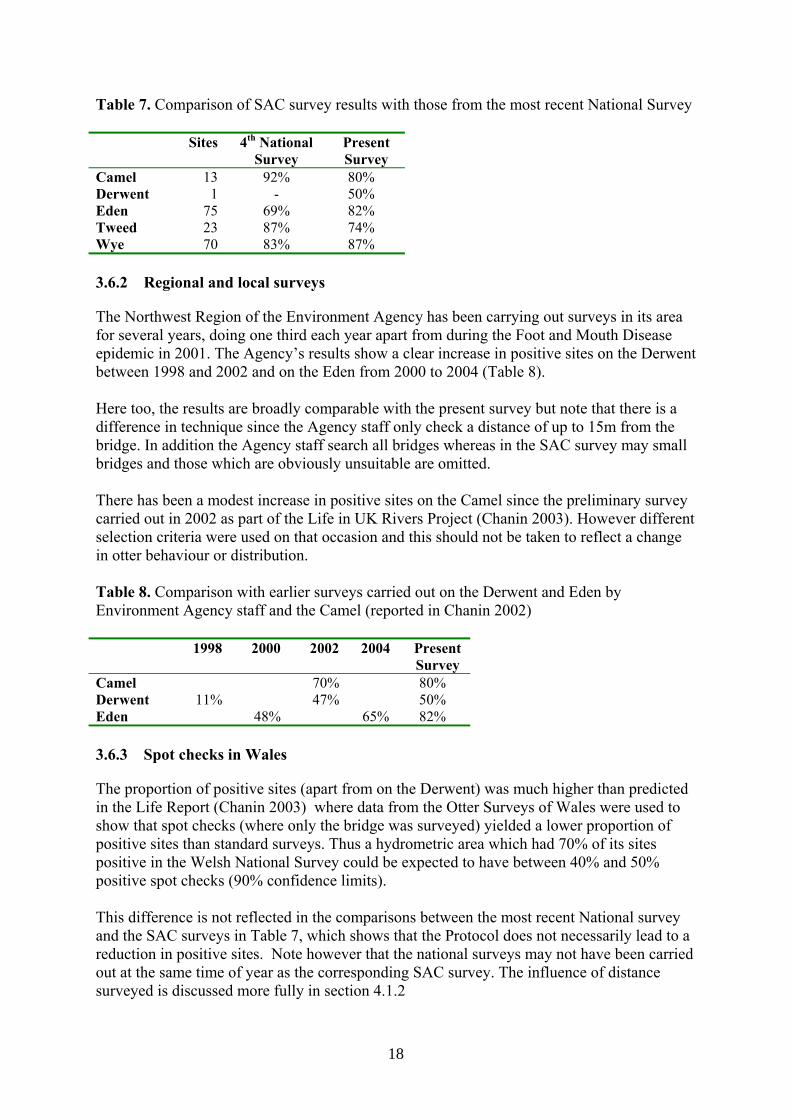
The Northwest Region of the Environment Agency has been carrying out surveys in its area for several years, doing one third each year apart from during the Foot and Mouth Disease epidemic in 2001. The Agency’s results show a clear increase in positive sites on the Derwent between 1998 and 2002 and on the Eden from 2000 to 2004 (Table 8). Here too, the results are broadly comparable with the present survey but note that there is a difference in technique since the Agency staff only check a distance of up to 15m from the bridge. In addition the Agency staff search all bridges whereas in the SAC survey may small bridges and those which are obviously unsuitable are omitted. There has been a modest increase in positive sites on the Camel since the preliminary survey carried out in 2002 as part of the Life in UK Rivers Project (Chanin 2003). However different selection criteria were used on that occasion and this should not be taken to reflect a change in otter behaviour or distribution. Table 8. Comparison with earlier surveys carried out on the Derwent and Eden by Environment Agency staff and the Camel (reported in Chanin 2002)
1998 2000 2002 2004 Present Survey
Camel 70% 80% Derwent 11% 47% 50% Eden 48% 65% 82% 3.6.3 Spot checks in Wales
The proportion of positive sites (apart from on the Derwent) was much higher than predicted in the Life Report (Chanin 2003) where data from the Otter Surveys of Wales were used to show that spot checks (where only the bridge was surveyed) yielded a lower proportion of positive sites than standard surveys. Thus a hydrometric area which had 70% of its sites positive in the Welsh National Survey could be expected to have between 40% and 50% positive spot checks (90% confidence limits). This difference is not reflected in the comparisons between the most recent National survey and the SAC surveys in Table 7, which shows that the Protocol does not necessarily lead to a reduction in positive sites. Note however that the national surveys may not have been carried out at the same time of year as the corresponding SAC survey. The influence of distance surveyed is discussed more fully in section 4.1.2

19
3.7 Factors influencing results
3.7.1 Time of year
Addressing the question of when to carry out surveys Chanin (2003) stated that:
“… there would be considerable benefit in carrying out surveys during the period May - September when water levels are less variable. This is also the period when water levels are lowest which has two significant advantages: a) sand and mud banks are most likely to be exposed and reveal footprints; b) working in rivers is safer.”
The present study had to be carried out from December to March which, on the above grounds would appear not to be ideal. In practice however, signs were found at a high proportion of sites in most SACs suggesting that winter surveying can provide useful data, even on upland rivers. However both snowfall and spates did have an impact on the survey. Impact of recent spates All rivers showed some signs of recent spates with trash lines on the Camel, Tweed and Wye indicating that, at some point during the preceding weeks, the rivers had been 1-2m higher than at the time of survey. However the most severe spates were recorded on the Eden and, to a lesser extent, the Derwent. These had suffered considerable damage including the washing away of sections of road and some foot bridges, together with extensive damage to abutments, walls and even foundations. In places the trash line was as much as 5m above water level.
Flood debris on the Eden

20
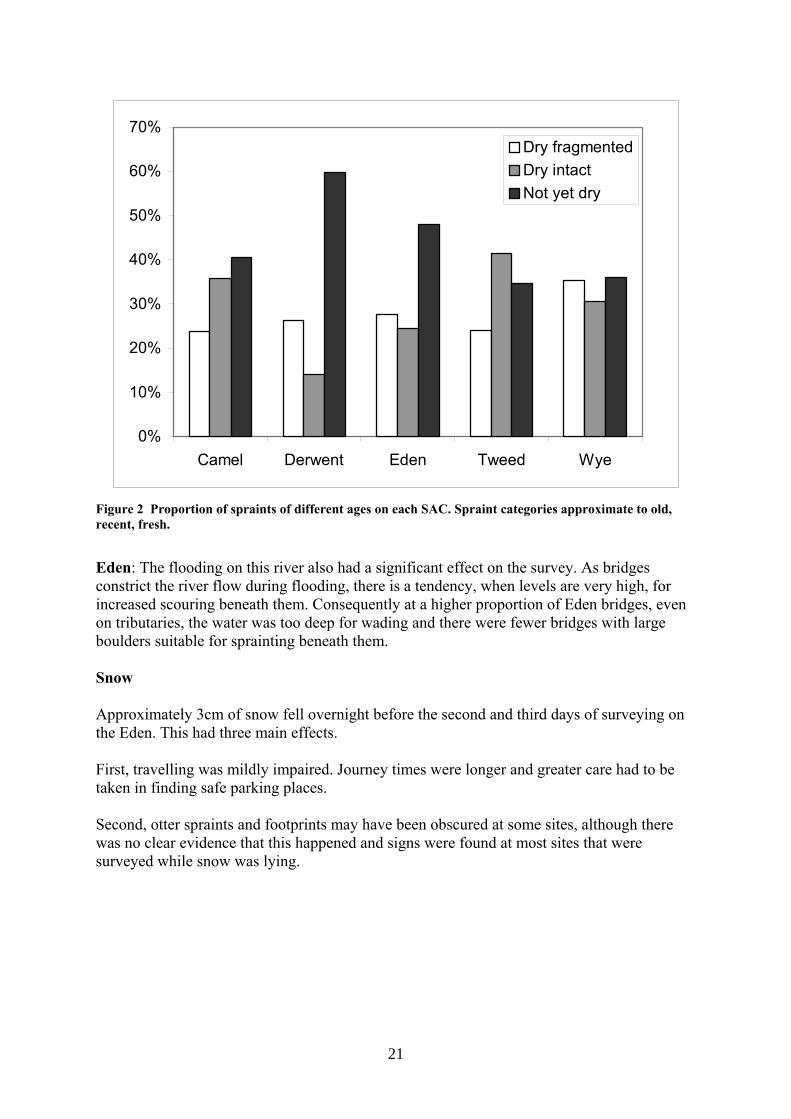
Damage on the Caldew Derwent: This river was surveyed on 17 to 19 January, ten days after the floods, whereas the Eden was done on 21 to 23 February, more than 6 weeks after the event. There was a marked difference in the proportion of positive sites on the two rivers, 82% on the Eden and 50% on the Derwent. This could be explained either by the proximity of the Derwent survey to the flood event or by the fact that the Derwent has been colonised more slowly than the Eden and otter populations continue to expand as illustrated by the Environment Agency data (table 8). Two sources of information provide some evidence to support the first hypothesis. First, the proportion of fresh spraints was higher on the Derwent than other SACs (figure 2) which would be predicted if the floods washed all spraints away. Second, the impact of a spates is likely to be greatest on the main rivers which, accumulating water from all tributaries, may be expected to rise the most and be subject to the greatest scouring. This was the case on the Derwent where only two of the twelve sites surveyed on the main river had signs of otters (17%) compared to 36% for the largest tributary (the Greta) and 65% for all other sites combined. These differences are significant (Chi2 = 9.42; 2df; p <0.01). No such effect was detected on other SACs
21
0%
10%
20%
30%
40%
50%
60%
70%
Camel Derwent Eden Tweed Wye
Dry fragmentedDry intactNot yet dry
Figure 2 Proportion of spraints of different ages on each SAC. Spraint categories approximate to old, recent, fresh.
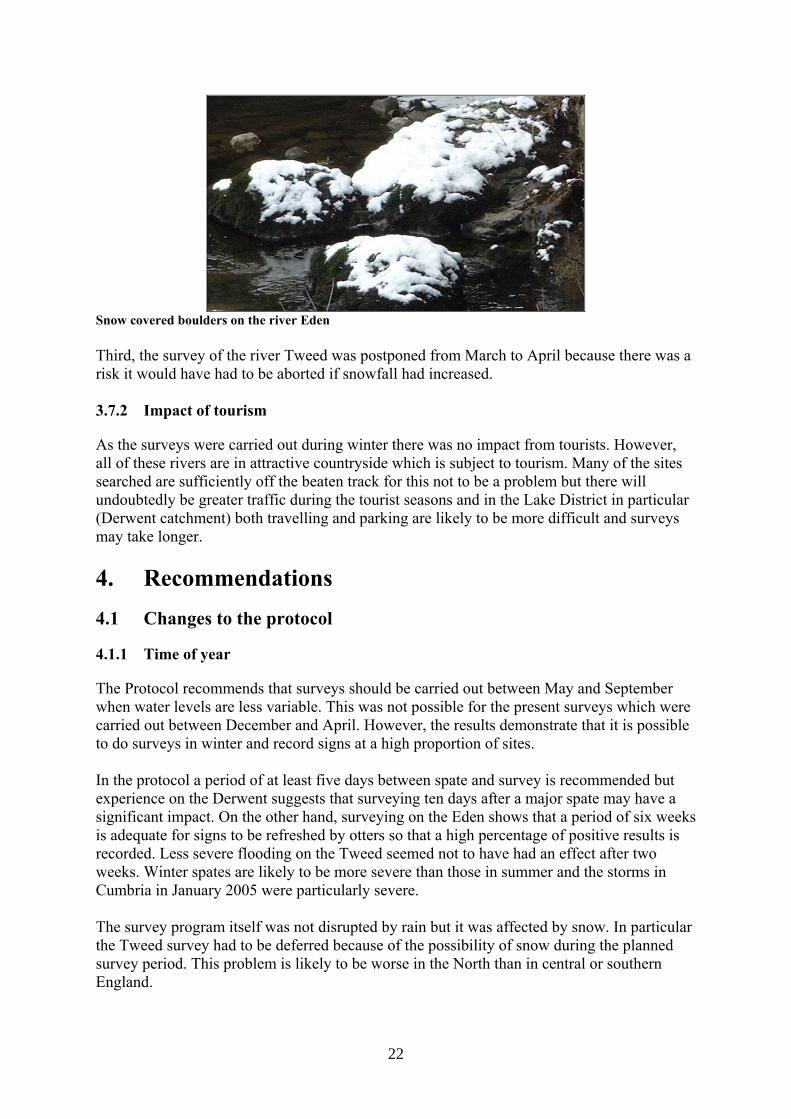
Eden: The flooding on this river also had a significant effect on the survey. As bridges constrict the river flow during flooding, there is a tendency, when levels are very high, for increased scouring beneath them. Consequently at a higher proportion of Eden bridges, even on tributaries, the water was too deep for wading and there were fewer bridges with large boulders suitable for sprainting beneath them. Snow Approximately 3cm of snow fell overnight before the second and third days of surveying on the Eden. This had three main effects. First, travelling was mildly impaired. Journey times were longer and greater care had to be taken in finding safe parking places. Second, otter spraints and footprints may have been obscured at some sites, although there was no clear evidence that this happened and signs were found at most sites that were surveyed while snow was lying.
22
Snow covered boulders on the river Eden Third, the survey of the river Tweed was postponed from March to April because there was a risk it would have had to be aborted if snowfall had increased. 3.7.2 Impact of tourism
As the surveys were carried out during winter there was no impact from tourists. However, all of these rivers are in attractive countryside which is subject to tourism. Many of the sites searched are sufficiently off the beaten track for this not to be a problem but there will undoubtedly be greater traffic during the tourist seasons and in the Lake District in particular (Derwent catchment) both travelling and parking are likely to be more difficult and surveys may take longer. 4. Recommendations 4.1 Changes to the protocol
4.1.1 Time of year
The Protocol recommends that surveys should be carried out between May and September when water levels are less variable. This was not possible for the present surveys which were carried out between December and April. However, the results demonstrate that it is possible to do surveys in winter and record signs at a high proportion of sites. In the protocol a period of at least five days between spate and survey is recommended but experience on the Derwent suggests that surveying ten days after a major spate may have a significant impact. On the other hand, surveying on the Eden shows that a period of six weeks is adequate for signs to be refreshed by otters so that a high percentage of positive results is recorded. Less severe flooding on the Tweed seemed not to have had an effect after two weeks. Winter spates are likely to be more severe than those in summer and the storms in Cumbria in January 2005 were particularly severe. The survey program itself was not disrupted by rain but it was affected by snow. In particular the Tweed survey had to be deferred because of the possibility of snow during the planned survey period. This problem is likely to be worse in the North than in central or southern England.

23
0%
10%
20%
30%
40%
50%
60%
70%
80%
90%
100%
Camel Derwent Eden Tweed Wye
50m15m0m
Taking all these factors into consideration, the requirement to carry out surveys in the summer can be seen to be sensible. However it would be possible to undertake surveys in the winter if there were strong reasons for doing so. Recommendation As far as possible, surveys should always be carried out at the same time of year on any one SAC, preferably during the period May - September. The gap between surveys and severe spates should be extended from five days to four weeks, though a period of two weeks would be adequate for smaller scale events. 4.1.2 Survey distance
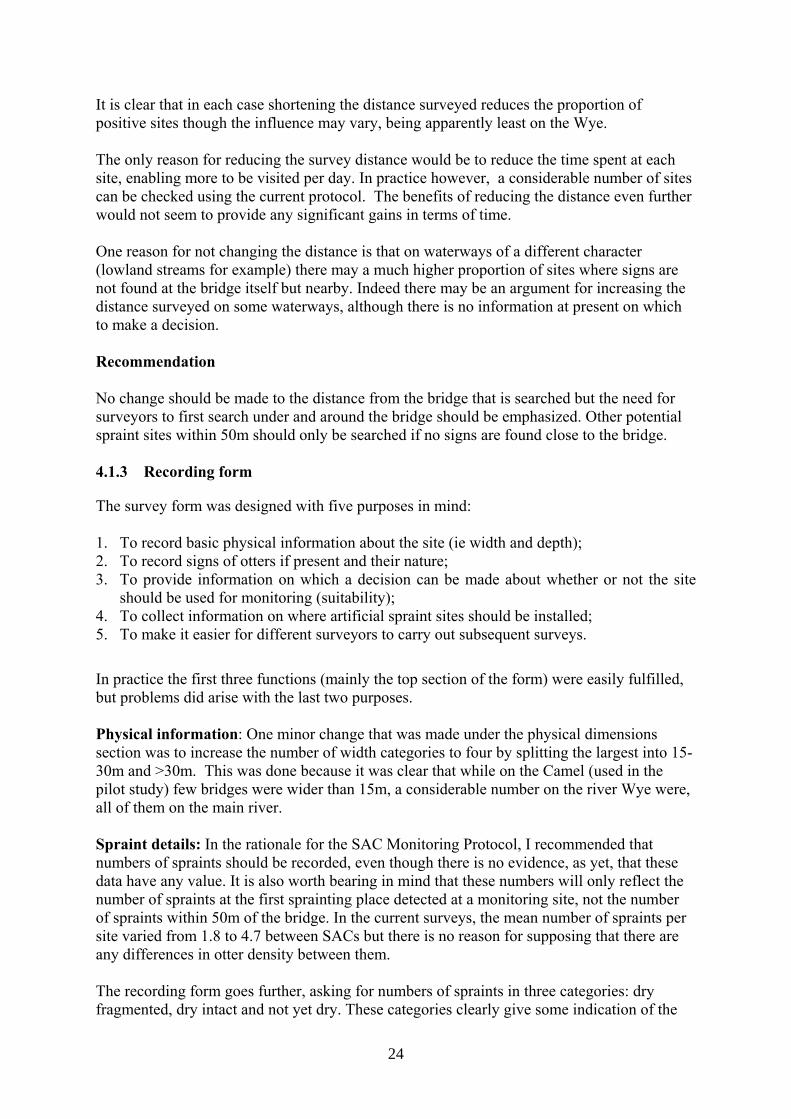
For the Environment Agency surveys in the North West, searching was restricted to within 15m of each bridge rather than the 50m recommended in the SAC monitoring protocol. Although the reasons are not explicitly stated, it seems likely that this is intended to achieve a satisfactory balance between the number of sites that can be searched and the time spent at each - the same principle operating in the SAC monitoring recommendations. In the first three Welsh National Otter Surveys sites which were checked using the standard survey method were supplemented by a large number of ‘spot checks’ where only the bridge and its immediate environs (within 10m) were searched. These data were used in the rationale for the SAC monitoring protocol as an argument for reducing the length of river surveyed. Using data from the recording forms it is possible to determine which sites would have been positive if surveys had been confined to the vicinity of the bridge itself or 15m from it, as in the Environment Agency surveys. Table 9 shows how these compare with the results for the full survey.
Figure 3 The proportion of sites that would have been positive had surveys been confined to the vicinity of the bridge (0m), within 15m of the bridge or the whole site.
The National Survey result (from table 7) is shown as a horizontal bar.
24
It is clear that in each case shortening the distance surveyed reduces the proportion of positive sites though the influence may vary, being apparently least on the Wye. The only reason for reducing the survey distance would be to reduce the time spent at each site, enabling more to be visited per day. In practice however, a considerable number of sites can be checked using the current protocol. The benefits of reducing the distance even further would not seem to provide any significant gains in terms of time. One reason for not changing the distance is that on waterways of a different character (lowland streams for example) there may a much higher proportion of sites where signs are not found at the bridge itself but nearby. Indeed there may be an argument for increasing the distance surveyed on some waterways, although there is no information at present on which to make a decision. Recommendation No change should be made to the distance from the bridge that is searched but the need for surveyors to first search under and around the bridge should be emphasized. Other potential spraint sites within 50m should only be searched if no signs are found close to the bridge. 4.1.3 Recording form
The survey form was designed with five purposes in mind: 1. To record basic physical information about the site (ie width and depth); 2. To record signs of otters if present and their nature; 3. To provide information on which a decision can be made about whether or not the site
should be used for monitoring (suitability); 4. To collect information on where artificial spraint sites should be installed; 5. To make it easier for different surveyors to carry out subsequent surveys.
In practice the first three functions (mainly the top section of the form) were easily fulfilled, but problems did arise with the last two purposes. Physical information: One minor change that was made under the physical dimensions section was to increase the number of width categories to four by splitting the largest into 15-30m and >30m. This was done because it was clear that while on the Camel (used in the pilot study) few bridges were wider than 15m, a considerable number on the river Wye were, all of them on the main river. Spraint details: In the rationale for the SAC Monitoring Protocol, I recommended that numbers of spraints should be recorded, even though there is no evidence, as yet, that these data have any value. It is also worth bearing in mind that these numbers will only reflect the number of spraints at the first sprainting place detected at a monitoring site, not the number of spraints within 50m of the bridge. In the current surveys, the mean number of spraints per site varied from 1.8 to 4.7 between SACs but there is no reason for supposing that there are any differences in otter density between them. The recording form goes further, asking for numbers of spraints in three categories: dry fragmented, dry intact and not yet dry. These categories clearly give some indication of the
25
age of the spraint and probably approximate to spraints that were deposited a few months, weeks or days before the survey. Again, the value of this in terms of the otter population is difficult to assess, although at an individual site, the presence of spraints of varying age is indicative of visits from otters over a period of time. The fact that there was a very high proportion of ‘not yet dry’ spraints on the Derwent shortly after a severe flood event lends support to the fact that the low number of positive sites in that SAC might be a result of the flooding However, the mean number of spraints per site on the Derwent is greater than the Eden and not a great deal less that the Camel and the Tweed. The conclusion must be that it may be worth collecting these data, since they cost virtually no time but their interpretation should be undertaken with considerable caution. Suitability: In most cases it was possible to make a decision on the spot as to whether or not a site was suitable for inclusion in the survey. Of the 357 sites visited, 50 were rejected as being unsuitable during surveys and only half a dozen were considered for selection after fieldwork had been completed. Some of these were also rejected out of hand, simply because enough clearly suitable sites were identified during fieldwork. In the end it was only on the Camel and the Tweed that decisions had to be made on the basis of field notes. For these few ‘possibly suitable’ sites, it is important to record as much information as possible. Four types of information were collected for the benefit of subsequent surveyors, potential spraint locations, access, parking and hazards and there are limitations to the value of all of these. Potential spraint and footprint sites: As these surveys were carried out in winter and spring, it is likely that, if future surveys are carried out at the preferred time of year, other sites where spraint or footprints could be found will be revealed at lower water levels. In addition, an experienced surveyor would immediately identify likely sites (most of which were around the bridges) and an inexperienced surveyor could be fairly quickly trained (though see section 4.1.4). In practice recording this information was only useful because it enabled a comparison to be made between the protocol used here, that adopted by the Environment Agency for its North West Region otter surveys and the spot checks carried out in early Welsh National Surveys. Access to the waterside: The problems surrounding access were described in 3.2.4. Brief notes of where to ask permission were recorded where appropriate, as well as the best route for gaining access to the river bank where that was not immediately obvious (46 sites). Parking: In most cases it was obvious that parking at the roadside, in a gateway or lay-by would be possible. Although notes were made at most sites, in practice it would be better to only make notes where the best parking place is not obvious. Hazards: Notes were made for 26 sites, mainly concerning the need for care on major roads, the presence of deep water and/or steep slopes and, in a few cases, the presence of giant hogweed.

26
Recommendations • The diagram for potential spraint sites, footprints etc can be omitted but surveyors
should be urged to concentrate note taking on the most important factors: hazards, parking places which are not obvious, the need to ask permission and the reasons why a site is considered ‘possibly suitable’.
• Information on spraint numbers should continue to be collected but surveyors warned not to interpret differences in these as reflecting changes in the otter population.
4.1.4 Would less experienced surveyors take longer?
Inexperienced surveyors might affect the results in a number of ways. They may miss signs that a more experienced surveyor would notice or misidentify signs. They are also likely to take longer because they have less experience at identifying likely spraint sites. On the other hand, surveyors with experience of otter surveys can also take longer than ‘necessary’, possibly because of a desire to maximise the number of positive sites. This problem could be over come either by setting a time limit per site, or by careful briefing. The Environment Agency North West Region used their otter surveys as part of an in-house training scheme so that experienced surveyors were accompanied by novices. They found that “15 -20 sites a day is easily achievable - more than this can be done if you are working alone” (Rachel Harding, pers. comm.). Chris Farmer, carrying out a BSc project on otters in the Midlands found that he could survey 25-30 sites in one day (pers. comm.). On the other hand, Rob Strachan (pers. comm.) found that surveyors he employed to carry out the Fourth Otter Survey of Scotland took considerably more time per site than he had anticipated, despite considerable experience. Setting a time limit for surveys has attractions but there are some sites where more time is needed, particularly large rivers where it may be necessary to go back to the bridge to cross from one site to the other, rather than wade. On balance it seems that the times achieved during the present surveys are comparable with other experienced surveyors. In order to ensure reasonable comparability between surveys it would be advisable to always use such people. However they need to be firmly briefed to ensure that they search in a consistent manner - see below. Recommendations • As far as possible monitoring should be carried out by surveyors with considerable
experience with otters. • No time limit should be set for surveying a site. 4.2 Guidance for surveyors
4.2.1 Search pattern
After visiting over 300 sites within a few weeks it is clear that one of the keys to effective surveying is to adopt an appropriate searching strategy. The majority of spraint sites and most footprints were found under or beside the bridges, fords or weirs which formed the focus of
27
survey sites. In most, though not all cases, other sites obviously had a high potential for footprints or spraints and rather than search every inch of the bank, it was most efficient to check these first. The recommended approach to surveying a site would be to search under the bridge first, then immediate its surroundings, then other obvious spraint sites (boulders, bases of trees, outfalls, confluences) or mud/sand banks where footprints might be found. Only search the banks and lines of trees or large numbers of boulders after this. 4.2.2 Equipment
Contrary to the statement in the monitoring protocol document, binoculars are essential for successful surveying. Where surveys are carried out by someone who is not a local, surveying, and particularly parking, within towns would be much easier with a suitable street map. I recommend obtaining a copy of (for example) the Ordnance Survey/Philip’s Street Atlas for the county in question. Parking in Cumbrian Towns would be much easier if a parking disc was obtained before the start of the survey. 5. Conclusions The results of these surveys show that the Protocol can provide a practical approach to monitoring otters in SACs, even those that are fairly small like the Camel. It is also clear that it would be possible to repeat surveys using the same protocol at intervals in order to compare results over a period of time. There are however three questions which cannot be answered on the basis of the information available so far: 1. Would the results be similar if the same survey protocol was used in the summer, the time
when the surveys should have been undertaken?
2. Are the results form the Derwent a consequence of surveying shortly after the ever spate in January 2005?
3. Will the method be equally effective on lowland streams where rocks and boulders are less numerous?
The first two questions could be answered by a limited repeat of the surveys - on the Eden and Derwent for example. The third by a pilot survey on a lowland SAC such as the River Itchen.

28
6. References CHANIN. 2003. Ecology of the European otter Lutra lutra. Conserving Natura 2000 Rivers Ecology Series, No 10. Peterborough: English Nature. CHANIN. 2003. Monitoring the Otter Lutra lutra. Conserving Natura 2000 Rivers Monitoring Series, No 10. Peterborough: English Nature. CRAWFORD, A. 2003. Fourth Otter Survey of England 2000-2002. Bristol: Environment Agency. REUTHER, C., and others. 2000. Surveying and monitoring distribution and population trends of the Eurasian otter Lutra lutra. Habitat, 12, 1-148.
29
Appendices
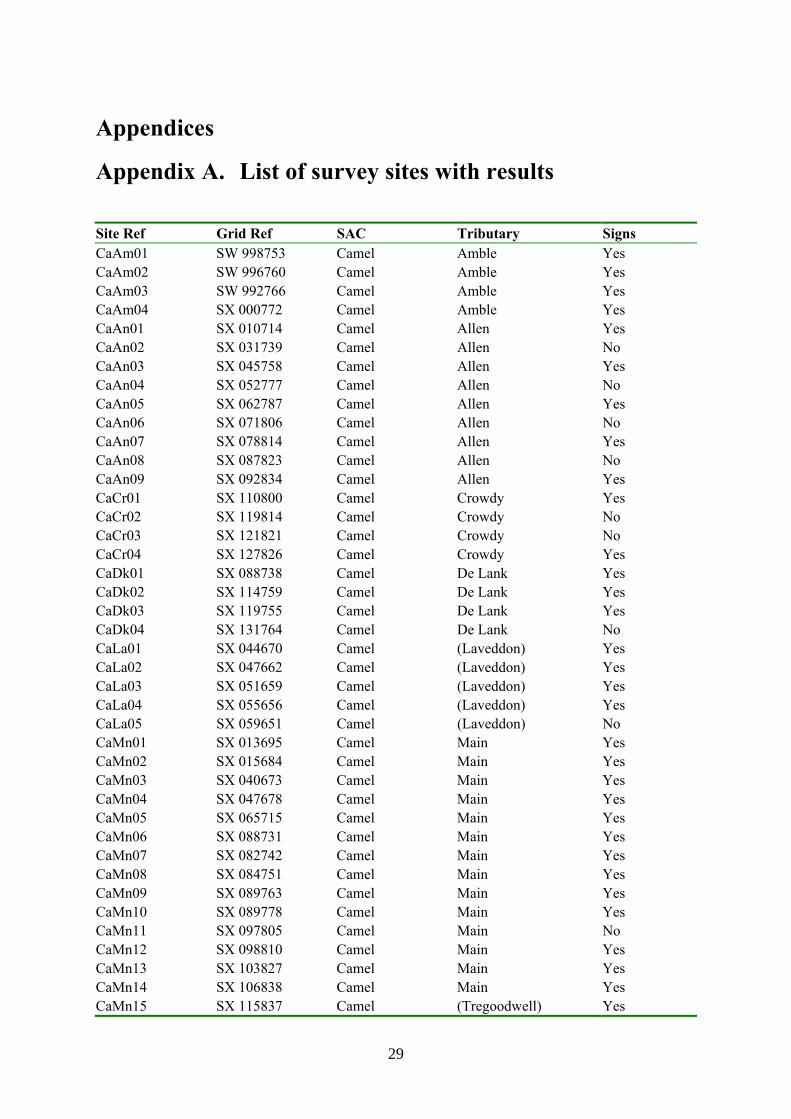
Appendix A. List of survey sites with results Site Ref Grid Ref SAC Tributary Signs CaAm01 SW 998753 Camel Amble Yes CaAm02 SW 996760 Camel Amble Yes CaAm03 SW 992766 Camel Amble Yes CaAm04 SX 000772 Camel Amble Yes CaAn01 SX 010714 Camel Allen Yes CaAn02 SX 031739 Camel Allen No CaAn03 SX 045758 Camel Allen Yes CaAn04 SX 052777 Camel Allen No CaAn05 SX 062787 Camel Allen Yes CaAn06 SX 071806 Camel Allen No CaAn07 SX 078814 Camel Allen Yes CaAn08 SX 087823 Camel Allen No CaAn09 SX 092834 Camel Allen Yes CaCr01 SX 110800 Camel Crowdy Yes CaCr02 SX 119814 Camel Crowdy No CaCr03 SX 121821 Camel Crowdy No CaCr04 SX 127826 Camel Crowdy Yes CaDk01 SX 088738 Camel De Lank Yes CaDk02 SX 114759 Camel De Lank Yes CaDk03 SX 119755 Camel De Lank Yes CaDk04 SX 131764 Camel De Lank No CaLa01 SX 044670 Camel (Laveddon) Yes CaLa02 SX 047662 Camel (Laveddon) Yes CaLa03 SX 051659 Camel (Laveddon) Yes CaLa04 SX 055656 Camel (Laveddon) Yes CaLa05 SX 059651 Camel (Laveddon) No CaMn01 SX 013695 Camel Main Yes CaMn02 SX 015684 Camel Main Yes CaMn03 SX 040673 Camel Main Yes CaMn04 SX 047678 Camel Main Yes CaMn05 SX 065715 Camel Main Yes CaMn06 SX 088731 Camel Main Yes CaMn07 SX 082742 Camel Main Yes CaMn08 SX 084751 Camel Main Yes CaMn09 SX 089763 Camel Main Yes CaMn10 SX 089778 Camel Main Yes CaMn11 SX 097805 Camel Main No CaMn12 SX 098810 Camel Main Yes CaMn13 SX 103827 Camel Main Yes CaMn14 SX 106838 Camel Main Yes CaMn15 SX 115837 Camel (Tregoodwell) Yes
30
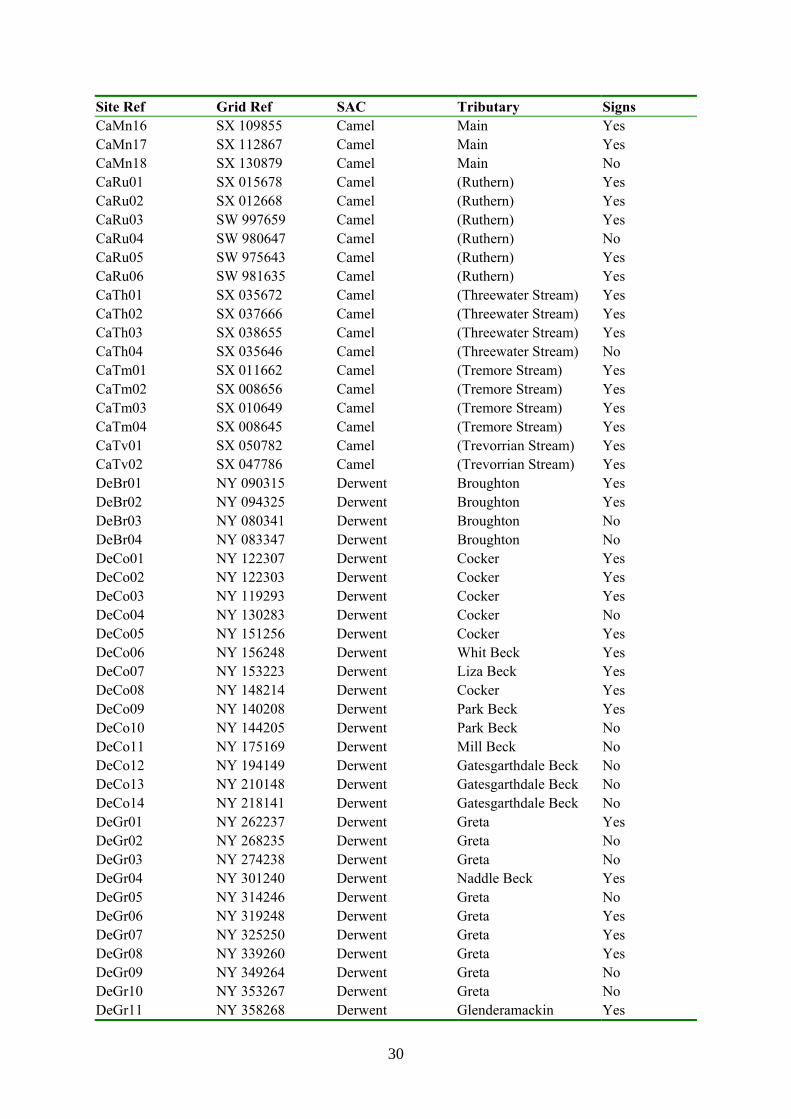
Site Ref Grid Ref SAC Tributary Signs CaMn16 SX 109855 Camel Main Yes CaMn17 SX 112867 Camel Main Yes CaMn18 SX 130879 Camel Main No CaRu01 SX 015678 Camel (Ruthern) Yes CaRu02 SX 012668 Camel (Ruthern) Yes CaRu03 SW 997659 Camel (Ruthern) Yes CaRu04 SW 980647 Camel (Ruthern) No CaRu05 SW 975643 Camel (Ruthern) Yes CaRu06 SW 981635 Camel (Ruthern) Yes CaTh01 SX 035672 Camel (Threewater Stream) Yes CaTh02 SX 037666 Camel (Threewater Stream) Yes CaTh03 SX 038655 Camel (Threewater Stream) Yes CaTh04 SX 035646 Camel (Threewater Stream) No CaTm01 SX 011662 Camel (Tremore Stream) Yes CaTm02 SX 008656 Camel (Tremore Stream) Yes CaTm03 SX 010649 Camel (Tremore Stream) Yes CaTm04 SX 008645 Camel (Tremore Stream) Yes CaTv01 SX 050782 Camel (Trevorrian Stream) Yes CaTv02 SX 047786 Camel (Trevorrian Stream) Yes DeBr01 NY 090315 Derwent Broughton Yes DeBr02 NY 094325 Derwent Broughton Yes DeBr03 NY 080341 Derwent Broughton No DeBr04 NY 083347 Derwent Broughton No DeCo01 NY 122307 Derwent Cocker Yes DeCo02 NY 122303 Derwent Cocker Yes DeCo03 NY 119293 Derwent Cocker Yes DeCo04 NY 130283 Derwent Cocker No DeCo05 NY 151256 Derwent Cocker Yes DeCo06 NY 156248 Derwent Whit Beck Yes DeCo07 NY 153223 Derwent Liza Beck Yes DeCo08 NY 148214 Derwent Cocker Yes DeCo09 NY 140208 Derwent Park Beck Yes DeCo10 NY 144205 Derwent Park Beck No DeCo11 NY 175169 Derwent Mill Beck No DeCo12 NY 194149 Derwent Gatesgarthdale Beck No DeCo13 NY 210148 Derwent Gatesgarthdale Beck No DeCo14 NY 218141 Derwent Gatesgarthdale Beck No DeGr01 NY 262237 Derwent Greta Yes DeGr02 NY 268235 Derwent Greta No DeGr03 NY 274238 Derwent Greta No DeGr04 NY 301240 Derwent Naddle Beck Yes DeGr05 NY 314246 Derwent Greta No DeGr06 NY 319248 Derwent Greta Yes DeGr07 NY 325250 Derwent Greta Yes DeGr08 NY 339260 Derwent Greta Yes DeGr09 NY 349264 Derwent Greta No DeGr10 NY 353267 Derwent Greta No DeGr11 NY 358268 Derwent Glenderamackin Yes

31
Site Ref Grid Ref SAC Tributary Signs DeGr12 NY 362271 Derwent Greta No DeGr13 NY 367291 Derwent Barrow Beck Yes DeGr14 NY 362302 Derwent Greta No DeMn01 NX 999294 Derwent Main No DeMn02 NY 007290 Derwent Main No DeMn03 NY 081312 Derwent Main No DeMn04 NY 102311 Derwent Main No DeMn05 NY 116307 Derwent Main No DeMn06 NY 164333 Derwent Main No DeMn07 NY 199321 Derwent Main Yes DeMn08 NY 228316 Derwent Chapel Beck Yes DeMn09 NY 250241 Derwent Main No DeMn10 NY 251239 Derwent Main No DeMn11 NY 264189 Derwent Watendlath Beck No DeMn12 NY 254174 Derwent Main No DeMn13 NY 257151 Derwent Stonethwaite Beck No DeMn14 NY 263138 Derwent Stonethwaite Beck No DeMn15 NY 250137 Derwent Main Yes DeMn16 NY 239127 Derwent Main No DeMr01 NY 057297 Derwent Marron Yes DeMr02 NY 056292 Derwent Marron Yes DeMr03 NY 059277 Derwent Marron No DeMr04 NY 059249 Derwent Marron Yes DeMr05 NY 074239 Derwent Marron Yes DeMr06 NY 067217 Derwent Marron Yes DeMr07 NY 065206 Derwent Colliersgate Beck Yes DeSJ01 NY 314231 Derwent St John's Beck Yes DeSJ02 NY 317214 Derwent St John's Beck Yes DeSJ03 NY 317205 Derwent St John's Beck Yes DeSJ04 NY 315195 Derwent St John's Beck Yes DeSJ05 NY 320129 Derwent Wyth Burn No EdCa01 NY 399554 Eden Caldew Yes EdCa02 NY 370487 Eden Caldew Yes EdCa03 NY 374459 Eden Caldew Yes EdCa04 NY 366429 Eden Caldew Yes EdCa05 NY 357418 Eden Caldew No EdCa06 NY 343388 Eden Caldew Yes EdCa07 NY 361376 Eden Caldew Yes EdCa08 NY 368364 Eden Caldew Yes EdCa09 NY 360342 Eden Caldew Yes EdCa10 NY 356319 Eden Caldew Yes EdHb01 NY 668202 Eden Hoff Beck Yes EdHb02 NY 675175 Eden Hoff Beck No EdHb03 NY 682158 Eden Hoff Beck Yes EdHb04 NY 685147 Eden Hoff Beck Yes EdHb05 NY 685136 Eden Hoff Beck No EdIr01 NY 476580 Eden Irthing Yes EdIr02 NY 495600 Eden Irthing Yes
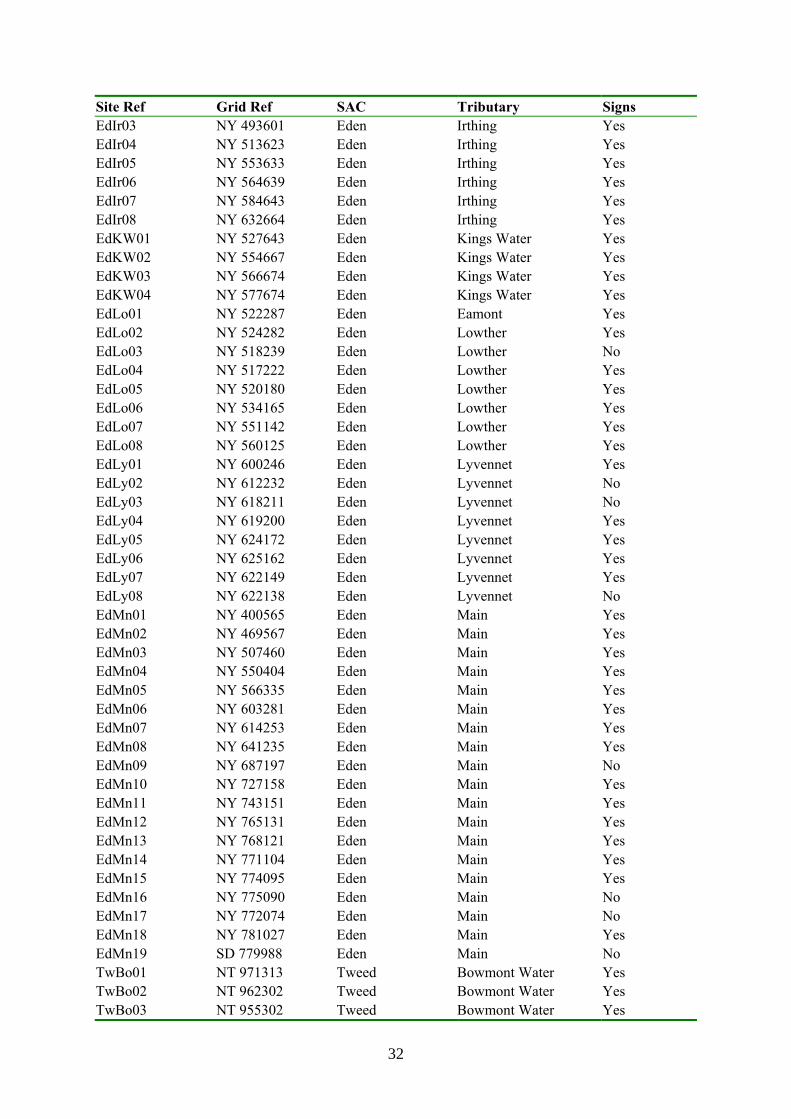
32
Site Ref Grid Ref SAC Tributary Signs EdIr03 NY 493601 Eden Irthing Yes EdIr04 NY 513623 Eden Irthing Yes EdIr05 NY 553633 Eden Irthing Yes EdIr06 NY 564639 Eden Irthing Yes EdIr07 NY 584643 Eden Irthing Yes EdIr08 NY 632664 Eden Irthing Yes EdKW01 NY 527643 Eden Kings Water Yes EdKW02 NY 554667 Eden Kings Water Yes EdKW03 NY 566674 Eden Kings Water Yes EdKW04 NY 577674 Eden Kings Water Yes EdLo01 NY 522287 Eden Eamont Yes EdLo02 NY 524282 Eden Lowther Yes EdLo03 NY 518239 Eden Lowther No EdLo04 NY 517222 Eden Lowther Yes EdLo05 NY 520180 Eden Lowther Yes EdLo06 NY 534165 Eden Lowther Yes EdLo07 NY 551142 Eden Lowther Yes EdLo08 NY 560125 Eden Lowther Yes EdLy01 NY 600246 Eden Lyvennet Yes EdLy02 NY 612232 Eden Lyvennet No EdLy03 NY 618211 Eden Lyvennet No EdLy04 NY 619200 Eden Lyvennet Yes EdLy05 NY 624172 Eden Lyvennet Yes EdLy06 NY 625162 Eden Lyvennet Yes EdLy07 NY 622149 Eden Lyvennet Yes EdLy08 NY 622138 Eden Lyvennet No EdMn01 NY 400565 Eden Main Yes EdMn02 NY 469567 Eden Main Yes EdMn03 NY 507460 Eden Main Yes EdMn04 NY 550404 Eden Main Yes EdMn05 NY 566335 Eden Main Yes EdMn06 NY 603281 Eden Main Yes EdMn07 NY 614253 Eden Main Yes EdMn08 NY 641235 Eden Main Yes EdMn09 NY 687197 Eden Main No EdMn10 NY 727158 Eden Main Yes EdMn11 NY 743151 Eden Main Yes EdMn12 NY 765131 Eden Main Yes EdMn13 NY 768121 Eden Main Yes EdMn14 NY 771104 Eden Main Yes EdMn15 NY 774095 Eden Main Yes EdMn16 NY 775090 Eden Main No EdMn17 NY 772074 Eden Main No EdMn18 NY 781027 Eden Main Yes EdMn19 SD 779988 Eden Main No TwBo01 NT 971313 Tweed Bowmont Water Yes TwBo02 NT 962302 Tweed Bowmont Water Yes TwBo03 NT 955302 Tweed Bowmont Water Yes

33
Site Ref Grid Ref SAC Tributary Signs TwBo04 NT 956297 Tweed Trib Yes TwBo05 NT 907303 Tweed College Burn Yes TwBo06 NT 886325 Tweed Trib No TwBo07 NT 886329 Tweed Bowmont Water Yes TwBo08 NT 874333 Tweed Bowmont Water Yes TwBo09 NT 853333 Tweed Bowmont Water Yes TwMn01 NT 974517 Tweed Main No TwMn02 NT 957525 Tweed Whiteadder No TwMn03 NT 926523 Tweed Trib Yes TwMn04 NT 920515 Tweed Trib No TwMn05 NT 934510 Tweed Main Yes TwMn06 NT 938488 Tweed Trib No TwMn07 NT 903475 Tweed Trib Yes TwMn08 NT 890472 Tweed Main Yes TwMn09 NT 874451 Tweed Simprim Burn Yes TwMn10 NT 870440 Tweed Trib Yes TwMn11 NT 849400 Tweed Main Yes TwTi01 NT 885432 Tweed Till Yes TwTi03 NT 929400 Tweed Trib No TwTi05 NT 933384 Tweed Till Yes TwTi06 NT 939374 Tweed Till Yes TwTi02 NT 934412 Tweed Trib No TwTi07 NT 955357 Tweed Trib Yes TwTi08 NT 946337 Tweed Till Yes TwTi09 NT 996326 Tweed Trib Yes TwTi10 NT 998307 Tweed Till Yes TwTi11 NU 018294 Tweed Till No TwTi12 NU 040298 Tweed Hetton Burn Yes TwTi13 NU 039294 Tweed Till Yes TwTi14 NU 058298 Tweed Till Yes TwTi15 NU 061284 Tweed Till Yes TwTi16 NU 055277 Tweed Till Yes TwTi17 NU 049251 Tweed Till Yes TwTi18 NU 044238 Tweed Liburn Burn No TwTi19 NU 047234 Tweed Trib Yes TwTi20 NU 056224 Tweed Breamish Yes TwTi21 NU 065218 Tweed Kirk Burn No TwTi22 NU 076204 Tweed Breamish No TwTi23 NU 058171 Tweed Breamish Yes TwTi25 NU 031167 Tweed Reavely Burn Yes TwTi26 NU 017164 Tweed Breamish No TwTi27 NT 996166 Tweed Breamish No TwTi28 NT 990164 Tweed Roddan Burn Yes TwWo01 NT 994282 Tweed Wooler Water Yes TwWo02 NT 994278 Tweed Wooler Water No TwWo03 NU 000260 Tweed Wooler Water Yes TwWo04 NT 997248 Tweed Wooler Water Yes TwWo05 NT 975250 Tweed Carey Burn Yes

34
Site Ref Grid Ref SAC Tributary Signs TwWo06 NT 963232 Tweed Wooler Water Yes TwWo07 NT 954224 Tweed Wooler Water No WyAr01 SO 507568 Wye Arrow Yes WyAr02 SO 497570 Wye Arrow Yes WyAr03 SO 474570 Wye Arrow No WyAr04 SO 460577 Wye Arrow Yes WyAr05 SO 461578 Wye Arrow Yes WyAr06 SO 437586 Wye Arrow Yes WyAr07 SO 419586 Wye Arrow Yes WyAr08 SO 415587 Wye Arrow Yes WyAr09 SO 390584 Wye Arrow Yes WyAr10 SO 373595 Wye Arrow Yes WyAr11 SO 333586 Wye Arrow Yes WyAr12 SO 328585 Wye Arrow No WyAr13 SO 316572 Wye Arrow Yes WyAr14 SO 303565 Wye Arrow Yes WyAr15 SO 299564 Wye Arrow Yes WyAr16 SO 280551 Wye Arrow Yes WyAr17 SO 273543 Wye Arrow No WyFr01 SO 565392 Wye Frome No WyFr02 SO 574403 Wye Frome Yes WyFr03 SO 598419 Wye Frome Yes WyFr04 SO 613426 Wye Frome Yes WyFr05 SO 633433 Wye Frome No WyFr06 SO 658469 Wye Frome Yes WyFr07 SO 662476 Wye Frome Yes WyFr08 SO 665478 Wye Frome Yes WyFr09 SO 666488 Wye Frome Yes WyFr10 SO 670501 Wye Frome Yes WyFr11 SO 662530 Wye Frome Yes WyFr12 SO 658544 Wye Frome Yes WyFr13 SO 658549 Wye Frome Yes WyFr14 SO 650556 Wye Frome Yes WyFr15 SO 631559 Wye Frome Yes WyLu01 SO 570374 Wye Lugg Yes WyLu02 SO 546406 Wye Lugg Yes WyLu03 SO 531418 Wye Lugg Yes WyLu04 SO 528446 Wye Lugg Yes WyLu05 SO 512459 Wye Lugg Yes WyLu06 SO 518476 Wye Lugg Yes WyLu07 SO 534511 Wye Lugg Yes WyLu08 SO 514528 Wye Lugg Yes WyLu09 SO 507585 Wye Lugg Yes WyLu10 SO 503588 Wye Lugg Yes WyLu11 SO 501595 Wye Lugg Yes WyLu12 SO 495593 Wye Lugg Yes WyLu13 SO 492599 Wye Lugg Yes WyLu14 SO 448621 Wye Lugg Yes
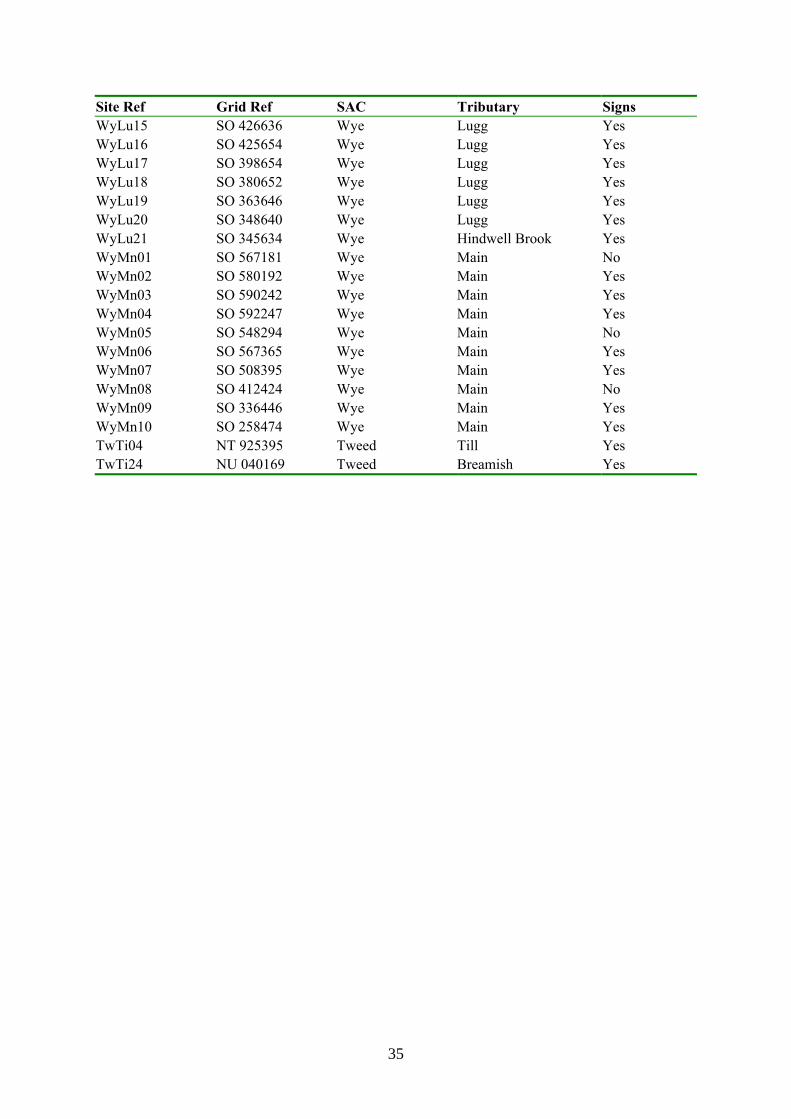
35
Site Ref Grid Ref SAC Tributary Signs WyLu15 SO 426636 Wye Lugg Yes WyLu16 SO 425654 Wye Lugg Yes WyLu17 SO 398654 Wye Lugg Yes WyLu18 SO 380652 Wye Lugg Yes WyLu19 SO 363646 Wye Lugg Yes WyLu20 SO 348640 Wye Lugg Yes WyLu21 SO 345634 Wye Hindwell Brook Yes WyMn01 SO 567181 Wye Main No WyMn02 SO 580192 Wye Main Yes WyMn03 SO 590242 Wye Main Yes WyMn04 SO 592247 Wye Main Yes WyMn05 SO 548294 Wye Main No WyMn06 SO 567365 Wye Main Yes WyMn07 SO 508395 Wye Main Yes WyMn08 SO 412424 Wye Main No WyMn09 SO 336446 Wye Main Yes WyMn10 SO 258474 Wye Main Yes TwTi04 NT 925395 Tweed Till Yes TwTi24 NU 040169 Tweed Breamish Yes

37
Appendix B. Survey results Maps created in DMAP. Filled circles are positive. Camel
Derwent and Eden
38
Tweed
Wye

39
Appendix C. Artificial spraint site on Camel Site Reference: CaAn04 Grid Reference: SX 052777
Clean up boulder or place another alongside, outside course of river.


41
Appendix D.
a) Otter monitoring form as used in the survey
b) Form recommended for future use.


43
a) Potential spraint monitoring sites River: Site ref number Sub catchment Grid Ref. Stream name Suitable for use? Yes/No/Possibly Width at bridge <5m / 5-15m / 15-30m/ >30m Needs Artif. Site? Yes/No/Possibly Max depth under bridge <25cm / 25-75cm / >75cm Permission needed? Yes/No Spraints recorded Dried Fragmented: Dried intact: Not fully dry: Footprints found? Yes/No Other sign: Mark: nature and position of potential spraint sites; location and type of signs found; parking place.
Notes on: Suitability: Need for artificial spraint site: Potential spraints sites (>5m from bridge): Parking: Access: Hazards: Post survey notes:
m mud or sandb boulder, stone etc c dry culvert/arch l ledge Spraint site
Spraint x footprints P parking
direction of flow
50m
50m
Photograph refs:

44
b) Potential spraint monitoring sites River: Site ref number Sub catchment Grid Ref. Stream name Suitable for use? Yes/No/Possibly Width at bridge <5m / 5-15m / 15-30m/ >30m Needs Artif. Site? Yes/No/Possibly Max depth under bridge <25cm / 25-75cm / >75cm Permission needed? Yes/No Spraints recorded Dried Fragmented: Dried intact: Not fully dry: Footprints found? Yes/No Other sign: Notes on:
Suitability: give details only if a ‘possible site’: Need for artificial spraint site (use diagram left to indicate location): Potential spraint sites (if not obvious and if more than 5m from bridge): Parking (if not obvious):
Access: restrictions, if not obvious; where to get permission: Hazards:
Notes:
Photograph refs:

English Nature is the Governmentagency that champions theconservation of wildlife andgeology throughout England.
This is one of a range ofpublications published by: External Relations Team English NatureNorthminster HousePeterborough PE1 1UA
www.english-nature.org.uk
© English Nature 2002/3
Cover printed on Character Express, post consumer waste paper, ECF.
ISSN 0967-876X
Cover designed and printed by Status Design & Advertising,2M,5M,5M.
You may reproduce as many copiesof this report as you like, providedsuch copies stipulate that copyrightremains with English Nature,Northminster House,Peterborough PE1 1UA
If this report contains any OrdnanceSurvey material, then you areresponsible for ensuring you have alicense from Ordnance Survey tocover such reproduction.
Front cover photographs:Top left: Using a home-made moth trap. Peter Wakely/English Nature 17,396Middle left: Co2 experiment at Roudsea Wood and Mosses NNR, Lancashire. Peter Wakely/English Nature 21,792Bottom left: Radio tracking a hare on Pawlett Hams,Somerset. Paul Glendell/English Nature 23,020Main: Identifying moths caught in a moth trap at Ham Wall NNR, Somerset. Paul Glendell/English Nature 24,888