OTOR EHICLE NSURANCE IN THE NITED TATES A … MOTOR VEHICLE INSURANCE IN THE UNITED STATES: A...
30
Transcript of OTOR EHICLE NSURANCE IN THE NITED TATES A … MOTOR VEHICLE INSURANCE IN THE UNITED STATES: A...


1. Report No. 2. Government Accession No. 3. Recipient’s Catalog No.
DOT HS 809 494
4. Title and Subtitle 5. Report Date
6. Performing Organization Code
7. Author(s) 8. Performing Organization Report No.
Ted R. Miller and Bruce A. Lawrence
9. Performing Organization Name and Address 10. Work Unit No. (TRAIS)
11. Contract or Grant No.
12. Sponsoring Agency Name and Address 13. Type of Report and Period Covered
14. Sponsoring Agency Code
15. Supplementary Notes
Joey W. Syner served as the NHTSA Contracting Officer’s Technical Representative for this project.
16. Abstract
Motor vehicle insurance information is critical to understanding highway crash costs and who pays them. To address this need, PIREobtained unpublished data from six insurers that specialize in motorcycle insurance, along with parallel data from the nation’s five largestmotor vehicle insurers.
Both insured motorcycles and other private passenger vehicles experienced $35.50 in crash-related claims per thousand miles traveled in1998-1999. Motorcycles, however, typically insure against fewer risks than autos. If they were as broadly insured as autos, their claims costs permile would have been almost 1.6 times average auto claims costs. Average property damage losses per claim were 65 percent larger formotorcycles than for other private passenger vehicles. Compared to other private passenger vehicles, motorcycles also had worse lossexperience on theft, vandalism, and other non-crash risks. Per thousand miles traveled, insurance coverage cost $87 for a motorcycle but just$61 for other private passenger vehicles. In aggregate, pricing for motorcycle coverage was commensurate with loss experience. Liabilitycoverage, however, might have been overpriced and property damage coverage underpriced. Profits on motorcycle liability coverage offsetlosses on property damage coverage.
Among insured motorcycles with coverage details known for 1999, 14 percent had 750-1000 cc engines, 43 percent had larger engines, and43 percent had smaller ones. The number of claims per policy, claim severity, losses per policy, and premiums all rose with engine size. Amongmotorcycles with large engines, sportbikes had especially bad loss records, experiencing losses per policy 1.5 to 2 times those of othermotorcycles with large engines.
This project yielded data that will enhance future NHTSA crash costing. These data are much different than those NHTSA collected in 1988.Increasing computerization and an improved data collection strategy make them more detailed, on point, and precise.
17. Key Words 18. Distribution Statement
Document is available through the National Technical Information ServiceSpringfield, VA 22161
19. Security Classif. (of this report) 20. Security Classif. (of this page) 21. No. of Pages 22. Price
MOTOR VEHICLE INSURANCE IN THE UNITED STATES: A 1998-1999 SNAPSHOT WITH EMPHASIS ON MOTORCYCLE COVERAGE
Motor Vehicle Insurance in the United States: A 1998-1999Snapshot with Emphasis on Motorcycle Coverage
March 2003
DTNH22-98-C-05167
Pacific Institute for Research and EvaluationCalverton Office Park11710 Beltsville Drive, Suite 300Calverton, Maryland 20705-3102
National Highway Traffic Safety AdministrationOffice of Program Development and DeliverySafety Countermeasures Division400 Seventh Street, S.W., Washington, D.C. 20590
Unclassified Unclassified

1
MOTOR VEHICLE INSURANCE IN THE UNITED STATES: A 1998-1999 SNAPSHOT WITH EMPHASIS ON MOTORCYCLE COVERAGE
their claims costs per mile traveled would havebeen almost 1.6 times average auto claims costs.Average property damage losses per claim were65 percent larger for motorcycles than otherprivate passenger vehicles. Compared to otherprivate passenger vehicles, motorcycles also hadworse loss experience on theft, vandalism, andother non-crash risks.
Per thousand miles traveled, insurance coveragecost $87 for a motorcycle but just $61 for otherprivate passenger vehicles. In aggregate, pricingfor motorcycle coverage was commensurate withloss experience. Liability coverage, however,might have been overpriced and property damagecoverage underpriced. Profits on motorcycleliability coverage offset losses on propertydamage coverage. In contrast, insurers lost moneydue to the underpricing of other auto policies in1998-1999. In interpreting these results, it isimportant to remember that liability insurancelargely pays for bodily injury to others injured bythe insured, not to the insured personally. Thus,for example, when a motorcyclist chooses againstwearing a helmet, any resulting rise in insuranceclaims primarily will be against the insurance ofother at-fault motorists.
Among insured motorcycles with coverage detailsknown for 1999, 14 percent had 750-1000 ccengines, 43 percent had larger engines, and 43percent had smaller ones. Insured motorcycleswith engines below 750 cc had fewer claims.Claim severity rose with engine size. Motorcyclesabove 1000 cc had especially high claim severity.
Losses per policy rose dramatically withmotorcycle engine size, with premiums risingproportionately. Touring bikes comprised 10
M otor vehicle insurance pays for many ofthe medical and work losses resulting fromhighway crashes. Insurance information is
critical to understanding crash costs and whopays them. No insurance industry sourcesprovide discrete information on motorcycleinsurance. Nor do they indicate what portion of a driver’s insurance premiums pay for losses incrashes caused by drivers of other vehicles. Theyalso do not provide factors for estimating howmuch insurance pays annually to compensatebodily injury versus property damage. NHTSAcollected some of this information in 1988.
To address the need for recent information, weobtained unpublished data collected by theMotorcycle Insurance Committee of the NationalAssociation of Independent Insurers (NAII) fromsix members that specialize in motorcycleinsurance. We supplemented their data withparallel data requested directly from the nation’sfive largest motor vehicle insurers. The data werecollected on spreadsheets. Data from individualfirms would be of considerable value to theircompetitors. Therefore, insurers required thattheir data be kept confidential and only releasedafter pooling with data from other respondingfirms. To further ensure confidentiality, the NAIIkindly received and pooled the data, thenprovided the study team with the aggregates.
Both insured motorcycles and other privatepassenger vehicles experienced $35.50 in crash-related claims per thousand miles traveled in1998-1999. Legal and lender mandates force mostmotorists to insure against a broad range of risks.Motorcycles, however, have less insurancemandates. They typically insure against fewerrisks. If they were as broadly insured as autos,
Executive Summary
2
MOTOR VEHICLE INSURANCE IN THE UNITED STATES: A 1998-1999 SNAPSHOT WITH EMPHASIS ON MOTORCYCLE COVERAGE
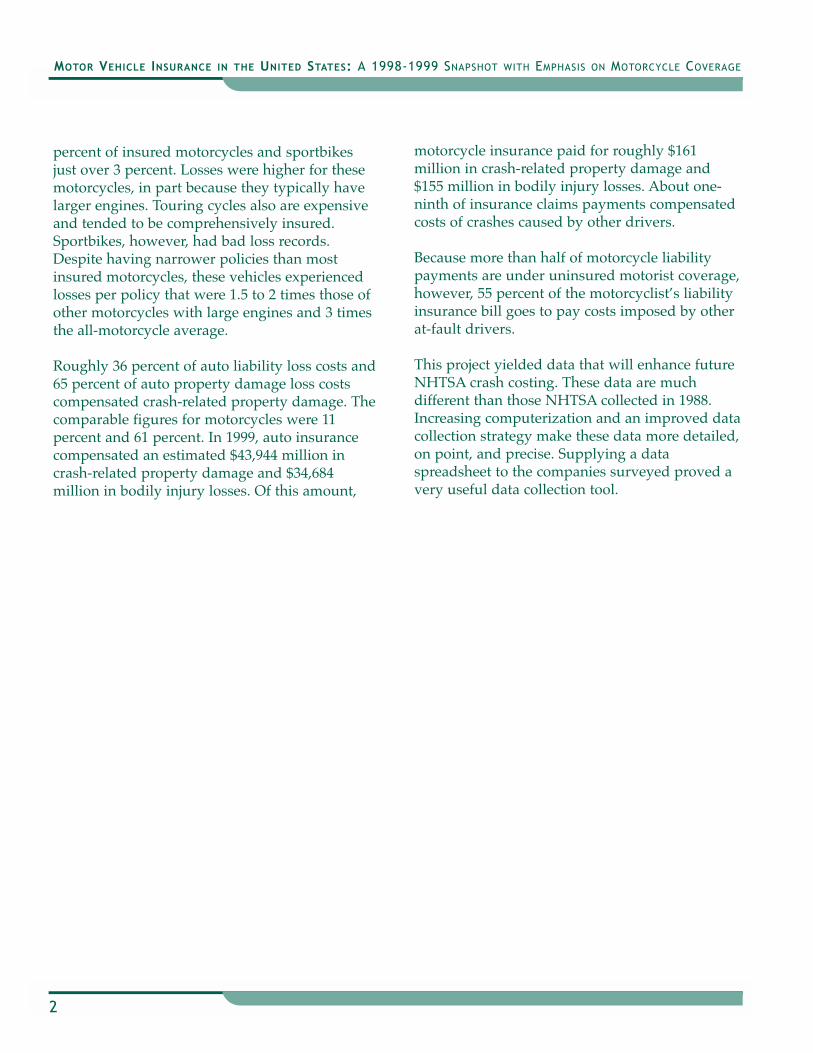
percent of insured motorcycles and sportbikesjust over 3 percent. Losses were higher for thesemotorcycles, in part because they typically havelarger engines. Touring cycles also are expensiveand tended to be comprehensively insured.Sportbikes, however, had bad loss records.Despite having narrower policies than mostinsured motorcycles, these vehicles experiencedlosses per policy that were 1.5 to 2 times those ofother motorcycles with large engines and 3 timesthe all-motorcycle average.
Roughly 36 percent of auto liability loss costs and65 percent of auto property damage loss costscompensated crash-related property damage. Thecomparable figures for motorcycles were 11percent and 61 percent. In 1999, auto insurancecompensated an estimated $43,944 million incrash-related property damage and $34,684million in bodily injury losses. Of this amount,
motorcycle insurance paid for roughly $161million in crash-related property damage and$155 million in bodily injury losses. About one-ninth of insurance claims payments compensatedcosts of crashes caused by other drivers.
Because more than half of motorcycle liabilitypayments are under uninsured motorist coverage,however, 55 percent of the motorcyclist’s liabilityinsurance bill goes to pay costs imposed by otherat-fault drivers.
This project yielded data that will enhance futureNHTSA crash costing. These data are muchdifferent than those NHTSA collected in 1988.Increasing computerization and an improved datacollection strategy make these data more detailed,on point, and precise. Supplying a dataspreadsheet to the companies surveyed proved avery useful data collection tool.

3
MOTOR VEHICLE INSURANCE IN THE UNITED STATES: A 1998-1999 SNAPSHOT WITH EMPHASIS ON MOTORCYCLE COVERAGE
insurance pays annually to compensate bodilyinjury versus property damage. Those factors lastwere estimated by Miller (1989) and Miller et al.(1991) using 1988 data collected for a Congress-ionally requested study (Miller 1988) and evenolder data from Blincoe and Luchter (1983). Theyare used in modeling the insurance claimsprocessing and administrative costs of highwaycrashes. Thus major gaps exist in recent autoinsurance data with relevance to Federal policy.
This report fills the gaps. It provides data onmotorcycle insurance and updated data on autoinsurance. Designed as a companion to a NHTSAliterature review on the costs of motorcyclistcrashes (Lawrence, Max, and Miller 2003), it wasproduced under the same contract. The data inthe present report can be used to understand andmore accurately cost motorcycle crashes andhighway crashes generally, and provide atemplate for building insurance related costs ofcommercial vehicle crashes (an interest of theNetwork of Employers for Traffic Safety and ofthe Federal Motor Carrier Safety Administration).
The report summarizes the methods used in thestudy and defines a number of insurance terms. Itthen presents findings about (1) motorcycleinsurance, (2) insurance for other privatepassenger vehicles, (3) similarities and differencesbetween motorcycle and other private passengerauto coverage, (4) commercial auto insurance,and (5) what losses auto insurance compensates.
M otor vehicle insurance compensates asubstantial portion of the medical andwork loss costs resulting from highway
crashes. Insurance information is critical tounderstanding crash costs and who pays them.A.M. Best Company annually publishes a verylimited amount of insurance data, separatingpersonal and commercial vehicles. The NationalAssociation of Insurance Commissioners annuallypublishes a richer compilation on auto insurance.The Insurance Research Council periodicallyanalyzes closed claim data or surveys crashvictims about losses and their reimbursement.Beyond this, a few states also occasionally studyaspects of their motor vehicle insurance markets.
The literature leaves many knowledge gaps.Discrete information on motorcycle insurance isvirtually unavailable. Nothing has been publishedabout how motorcycle insurance claims vary withmotorcycle type and engine size. Nor isinformation available that compares policy costsor claims experience between motorcycle andautomobile insurance. Again, the insurance dataneeded to estimate external insurance costs—adriver’s insurance premiums that pay losses incrashes caused by drivers of other vehicles—arelacking. High external costs are a critical reason toconsider highway safety interventions likemotorcycle helmet laws that restrict personalfreedom. Finally, existing sources do not providefactors for estimating how much motor vehicle
Background

4
MOTOR VEHICLE INSURANCE IN THE UNITED STATES: A 1998-1999 SNAPSHOT WITH EMPHASIS ON MOTORCYCLE COVERAGE
A side from some sparse information culledfrom Best’s Aggregates and Averages(2000), this report is based on data collected
from insurers. Much of the motorcycle data wascollected by the Motorcycle Insurance Committeeof the National Association of IndependentInsurers (NAII) from six members that specializein motorcycle insurance. We supplemented theirdata with parallel data requested directly fromthe nation’s five largest motor vehicle insurers.Some of them, however, could not readily providesome or all of the requested information. The data we collected from individual firms wouldbe of considerable value to their competitors.
Therefore, insurers required that their data bekept confidential and only released after poolingwith data from other responding firms. To furtherensure confidentiality, the NAII kindly receivedand pooled the data, then provided the studyteam with the aggregates. As a furtherconfidentiality protection, here we show estimates computed from the data collected butnone of the raw data aggregates.
We adapted an Excel data collection spreadsheetdeveloped by the NAII Committee. We requestedinformation by vehicle type (motorcycle; private passenger car, light truck, van, SUV; commercialfor-hire vehicle, other light commercial vehicle,bus/passenger van, medium/heavy truck) onseven categories of insurance coverage:
■ Bodily injury liability (coverage if thepolicyholder’s vehicle injures someone;mandatory in most states. In no-faultinsurance states, this coverage compensateslosses that exceed the no-fault threshold.).
For motorcycles, some companies separatedpassenger liability coverage from other bodily injury coverage.
■ Property damage liability (coverage if thepolicyholder’s vehicle damages or destroys someone else’s property;mandatory in many states)
■ Own medical payments (coverage for thepolicyholder’s own injury treatment costs upto a modest ceiling, typically $1,000; oftenmandatory in states without no-faultinsurance)
■ Personal injury protection (no-fault coveragefor the policyholder’s own losses up to a modest ceiling, typically$15,000-$25,000; mandatory in some states)
■ Collision (coverage for damage to thepolicyholder’s vehicle when the policyholder is at fault in the crash or no oneis; typically required by the lender if vehiclepurchase was financed)
■ Comprehensive (coverage for theft or non-crash damage to the policyholder’s vehicle;typically required by the lender if vehiclepurchase was financed)
■ Uninsured and underinsured motorist(coverage for injuries to the policyholder andother occupants of the policyholder’s vehicle,as well as the policyholder’s property damagewhen a driver without insurance is at fault orwhen the at-fault driver has too littleinsurance to fully compensate the policy-holder’s losses; mandatory in many states)
Methods

5
MOTOR VEHICLE INSURANCE IN THE UNITED STATES: A 1998-1999 SNAPSHOT WITH EMPHASIS ON MOTORCYCLE COVERAGE
premiums written (including funds that wouldlater be rebated to policyholders) rather thanpremiums earned. This company’s data weremultiplied by the ratio of earned premiums topremiums written for its aggregate automobileinsurance lines from Best’s Aggregates and Averages(A.M. Best and Company 2000).
We have not applied inflation adjusters to anydollar amounts in this report From the datacollected, by vehicle and coverage type, wecomputed:
■ Claims per 1000 covers (incurred claim countdivided by earned exposure, i.e., the numberof claims filed per 1000 policies that offer thespecific coverage)
■ Claim severity (incurred losses divided byincurred claim count, i.e., the averagepayments per claim paid)
■ Average loss cost (incurred losses divided byearned exposure, a measure influenced byboth the frequency of claims and claimseverity, i.e., losses per cover)
■ Percent of total losses (by vehicle type andyear, incurred losses for each coveragedivided by total incurred losses for allcoverages)
■ Loss ratio (the ratio of incurred losses toearned premiums, i.e., the percentage ofpremiums that is paid to settle claims)
■ ALAE ratio (the ratio of ALAE to earnedpremiums, i.e., the percentage of premiumsthat is spent to process and investigate claims.This ratio is sometimes called the DirectDefense and Cost Containment Expense orDDCCE ratio)
In addition, by vehicle type, we computed:
■ Premium per actual policy (the sum of earnedpremiums divided by policies written)
For each category, we requested five data itemsfor policies written in 1998 and (separately) in1999. Coverage in a policy is for a maximum ofone year:
■ Earned exposure (the number of vehiclescovered by insurance for this risk)
■ Earned premiums (how much policyholderspaid for this coverage, net of any dividends orrebates to policyholders)
■ Incurred losses (the amount paid or reservedfor future payment of claims against thepolicies, including amounts that will be paidby reinsurers)
■ Administrative loss adjustment expenses orALAE (the amount spent investigating andpaying the claims). ALAE is very narrowlydefined here and averages just 3 percent ofpremiums earned for liability coverage and 0.2 percent for collision and comprehensivecoverage. A.M. Best (2000) also reports abroader definition of loss adjustment expensesthat averages 14.8 percent of private passengerauto liability premiums earned and 10.5percent of private passenger auto propertydamage premiums earned in 1999. In addition,commissions and underwriting expensesrelated to these coverages averaged 24.4percent and 24.8 percent of premiums earnedrespectively. We did not study those expenses.
■ Incurred claim count (the number of damageclaims that the insurance paid for oranticipates paying for as lawsuits and otherdisputes are resolved)
In some cases, companies were unable to supply abreakdown between incurred losses and ALAEfor motorcycles. By coverage and engine size, weapplied data from companies that supplied abreakdown to decompose the remaining data intothese categories. One company supplied data on
6
MOTOR VEHICLE INSURANCE IN THE UNITED STATES: A 1998-1999 SNAPSHOT WITH EMPHASIS ON MOTORCYCLE COVERAGE
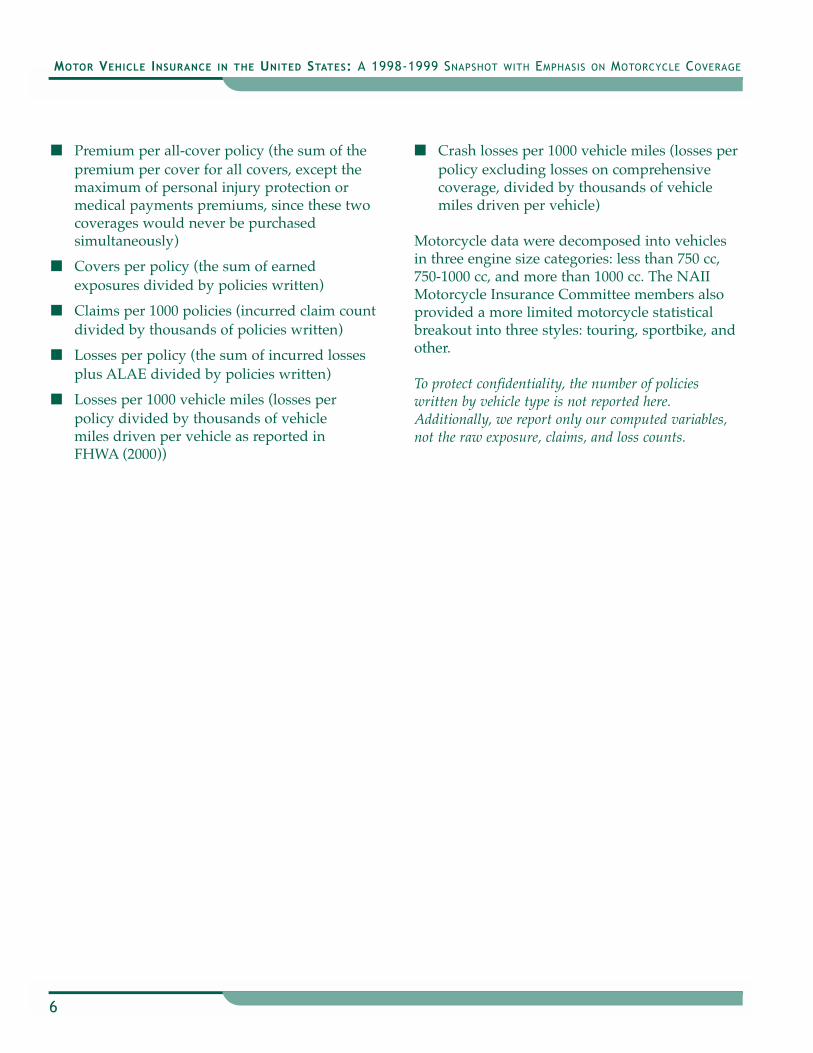
■ Premium per all-cover policy (the sum of thepremium per cover for all covers, except themaximum of personal injury protection ormedical payments premiums, since these twocoverages would never be purchasedsimultaneously)
■ Covers per policy (the sum of earnedexposures divided by policies written)
■ Claims per 1000 policies (incurred claim countdivided by thousands of policies written)
■ Losses per policy (the sum of incurred lossesplus ALAE divided by policies written)
■ Losses per 1000 vehicle miles (losses perpolicy divided by thousands of vehicle miles driven per vehicle as reported in FHWA (2000))
■ Crash losses per 1000 vehicle miles (losses perpolicy excluding losses on comprehensivecoverage, divided by thousands of vehiclemiles driven per vehicle)
Motorcycle data were decomposed into vehiclesin three engine size categories: less than 750 cc,750-1000 cc, and more than 1000 cc. The NAIIMotorcycle Insurance Committee members alsoprovided a more limited motorcycle statisticalbreakout into three styles: touring, sportbike, andother.
To protect confidentiality, the number of policieswritten by vehicle type is not reported here.Additionally, we report only our computed variables,not the raw exposure, claims, and loss counts.

7
MOTOR VEHICLE INSURANCE IN THE UNITED STATES: A 1998-1999 SNAPSHOT WITH EMPHASIS ON MOTORCYCLE COVERAGE
and uninsured motorist coverage another 20percent. Liability payments were quite modest,only 17 percent of the total. This pattern wasquite different from the pattern for personalpassenger autos (shown in Table 2), whereliability coverage accounted for 41 percent oflosses, collision and comprehensive another 41percent, and uninsured motorist protection only6.5 percent.
Loss Adjustment Expense (LAE) proved aconfusing category. Best’s Review (Goch 2000) nowreports only what they label DDCCE but formerlycalled ALAE, a very constricted subset ofexpenses related directly to claims adjustment.This subset excludes the costs of maintaining andquality-controlling a claims processing capability,as well as related overheads. These indirect costsdo not result directly from the individual claim.Best’s Aggregates and Averages reports a moreexpansive version of LAE that appears to includethe indirect costs. Both versions are based onvoluntary but virtually complete reporting byinsurers. The more expansive version seems moreappropriate for crash costing, although one coulduse the constricted version and separately modeldefense legal costs. Our intent was to collect anexpansive version of LAE but our data requestyielded a constricted version. The importantinformation about ALAE in Tables 1 and 2,therefore, is that it varies little between types ofcoverage or types of vehicles. Thus it isreasonable to apply the annual numbers in Best’spublications to subgroups.
Table 3 reproduces Best’s data for 1998-1999 autoinsurance nationally. For the four major classes ofcoverage, it shows premiums earned, thepercentage of premiums earned that goes to coverLAE by constricted and expansive definitions, the
W e obtained data on 1.1 million motorcyclepolicies written in 1998 and 1.2 millionwritten in 1999. This represented
coverage for 28.5 percent of the motorcyclesregistered each year and an unknown but muchhigher percentage of insured motorcycles. (InHawaii, for example, 39 percent of motorcycles areuninsured (Kim et al. 2002).) Table 1 summarizesthe estimates computed from the data collectedabout this coverage. In viewing these estimates, itis important to remember that some companiesdid not differentiate passenger liability coveragefrom other bodily injury liability coverage,instead offering a single coverage for both.
Among insured motorcycles with coverage detailsknown for 1999, 14 percent had 750-1000 ccengines, 43 percent had larger engines, and 43percent had smaller ones. As Table 1 shows,motorcycles with engines below 750 cc had fewerclaims per 1000 covers. Claim severity rose withengine size overall and for passenger liability,comprehensive, uninsured motorist, and to alesser extent, medical payments/personal injuryprotection and collision coverages. Motorcyclesabove 1000 cc had especially high claim severityfor several coverage categories and overall.
Motorcycle property/casualty liability insurancecovers the costs of injury and property damagethat motorcycle riders inflict on auto occupants,pedestrians, and passengers. Because motorcyclestypically are over-matched in crashes, occupantsof other vehicles rarely are injured by an at-faultmotorcyclist. Motorcycle liability insurance,therefore, generally is inexpensive. Average losscosts dramatically illustrate this point. Most lossesresulted from compensating the motorcyclist’sown losses, with comprehensive and collisioncoverages accounting for 60 percent of total losses
Motorcycle Insurance Results

8
MOTOR VEHICLE INSURANCE IN THE UNITED STATES: A 1998-1999 SNAPSHOT WITH EMPHASIS ON MOTORCYCLE COVERAGE
percentage spent on commissions and brokeragefees, and the percentage devoted to otherunderwriting expenses. Overall, about 40 percentof premium dollars earned were used to coverthese sales and administrative expenses. Claimsadjustment costs were higher for liability thanproperty damage claims. Commercial autopolicies were sold on a tighter margin thanprivate passenger policies, sometimes as a lossleader or accommodation required to captureother more profitable business. Commissions andbrokerage also were larger for commercialpolicies. In general, auto insurance expensesexceeded premiums earned. In most years, theprivate passenger line achieved marginalprofitability through investment gains during theperiod between when premiums were collectedand when claims were paid.
Accounting for loss adjustment and underwritingexpenses (about 37 percent of earned premiumsaccording to A.M. Best (2000)), the loss ratios inTable 1 suggest insurers lost money on optionalmotorcycle collision and comprehensive and onlegally mandated uninsured motorist andpersonal injury protection coverage. Theyrecouped their losses through profits on legallymandated liability coverage. Overall, the lossratio for motorcycle insurance ranged from 53.4percent in 1998 to 56.5 percent in 1999. That wasbetter than the 65 percent loss ratio for privatepassenger auto among survey respondents and inthe auto industry as a whole (as reported by A.M.Best, 2000).
In part the adverse experience on somemotorcycle coverages and offsetting profitabilityon others resulted from the bifurcated nature ofthis market. A small group of writers specializedin motorcycle coverage. Their loss ratios were
balanced between covers, reflecting theirexpertise in this market. The second group werecompanies that wrote motorcycle coverage toaccommodate purchasers of other insurance whowanted a comprehensive source for theirproperty/casualty or auto insurance needs. These companies did not actively pursuemotorcycle business or cultivate expertise in themarket. Their underwriting and loss adjustmentwas less refined, their policies were priced abovethe specialty writers, their profitability was lower, and their results were more variablebetween coverages.
Losses per policy rose dramatically withmotorcycle engine size, with premiums risingproportionately. Touring bikes comprised 10percent of insured motorcycles and sportbikesjust over 3 percent. Losses were higher for thesemotorcycles, in part because they typically havelarger engines. Touring cycles are expensive andtended to be comprehensively insured, with anaverage of one additional cover per policyincreasing their insurance costs. In contrast,sportbikes had bad loss records. Despite havingfewer coverages per policy than mostmotorcycles, these vehicles experienced losses per policy that were 1.5 to 2 times those of othermotorcycles with large engines and 3 times theall-motorcycle average.
Between 1998 and 1999, claims per cover rose by 8 percent, driving up total claims paymentsdespite a stable cost per claim. This rise wasobserved for all engine sizes and all coveragesexcept medical and comprehensive. It occurreddespite a drop in miles ridden per motorcycle. It may result from an influx of novice riders;motorcycle registrations grew by 8 percentbetween 1998 and 1999.

Table 1. Motorcycle Insurance Statistics by Engine Size, Selected Companies, 1998-1999
Claims Average Percent Per 1000 Claim Loss of Total Loss ALAECovers Severity Cost Losses Ratio Ratio
Bodily Injury Less than 750 cc 1998 0.7 $14,367 $9 10.4% 19.5% 1.8%Liability 1999 0.8 $14,385 $10 10.3% 23.7% 3.1%
750-1000 cc 1998 1.2 $15,653 $17 11.8% 26.8% 1.7%1999 1.3 $13,651 $17 10.1% 26.4% 1.6%
More than 1000 cc 1998 1.3 $15,105 $18 10.8% 27.6% 2.5%1999 1.4 $14,392 $18 9.8% 28.0% 2.8%
Total 1998 1.0 $14,971 $14 10.8% 24.5% 2.1%1999 1.1 $14,271 $14 10.0% 26.3% 2.7%
Passenger Less than 750 cc 1998 0.3 $9,556 $3 1.0% 19.8% 1.8%Liability 1999 0.4 $4,268 $1 0.4% 10.9% 1.4%
750-1000 cc 1998 0.5 $16,799 $8 1.6% 37.2% 2.3%1999 0.6 $7,792 $5 0.8% 21.4% 1.3%
More than 1000 cc 1998 0.8 $13,642 $10 1.4% 41.0% 3.8%1999 1.0 $15,878 $14 1.7% 54.0% 5.3%
Total 1998 0.5 $12,832 $6 1.3% 32.4% 2.8%1999 0.6 $11,193 $6 1.2% 33.5% 3.3%
Property Less than 750 cc 1998 3.1 $1,592 $5 5.6% 15.5% 0.0%Damage 1999 3.4 $1,629 $6 5.7% 17.3% 0.2%Liability 750-1000 cc 1998 3.7 $1,597 $6 3.8% 13.1% 0.1%
1999 4.5 $1,806 $8 4.9% 17.3% 0.0%More than 1000 cc 1998 3.3 $1,497 $5 2.8% 10.7% 0.1%
1999 3.8 $1,787 $7 3.6% 14.0% 0.1%Total 1998 3.3 $1,553 $5 3.8% 12.8% 0.1%
1999 3.7 $1,726 $6 4.4% 15.7% 0.1%Own Medical Less than 750 cc 1998 11.7 $859 $10 1.4% 22.6% 0.3%
Payments 1999 12.2 $1,094 $13 1.7% 32.5% 0.5%750-1000 cc 1998 15.6 $957 $15 1.2% 29.1% 0.5%
1999 15.5 $1,015 $15 1.2% 30.9% 0.5%More than 1000 cc 1998 14.7 $1,017 $15 1.1% 28.3% 0.3%
1999 12.1 $1,256 $15 1.2% 28.8% 0.5%Total 1998 13.5 $949 $13 1.2% 26.2% 0.3%
1999 12.6 $1,151 $14 1.3% 30.4% 0.5%
9
MOTOR VEHICLE INSURANCE IN THE UNITED STATES: A 1998-1999 SNAPSHOT WITH EMPHASIS ON MOTORCYCLE COVERAGE

Table 1. (cont.) Motorcycle Insurance Statistics by Engine Size, Selected Companies, 1998-1999
Claims Average Percent Per 1000 Claim Loss of Total Loss ALAECovers Severity Cost Losses Ratio Ratio
Personal Less than 750 cc 1998 8.8 $2,382 $21 0.8% 61.7% 1.4%Injury 1999 6.4 $1,994 $12 0.5% 31.0% 2.5%
Protection 750-1000 cc 1998 8.4 $3,147 $25 0.6% 71.0% 2.2%1999 11.6 $2,300 $26 0.7% 70.9% 1.2%
More than 1000 cc 1998 8.2 $3,099 $24 0.6% 69.2% 2.8%1999 9.2 $3,577 $32 0.8% 86.2% 2.3%
Total 1998 8.5 $2,791 $23 0.6% 66.4% 2.1%1999 8.3 $2,779 $22 0.7% 58.5% 2.2%
Collision Less than 750 cc 1998 31.8 $2,529 $80 39.0% 137.6% 0.6%1999 34.4 $2,509 $86 40.2% 142.3% 0.4%
750-1000 cc 1998 34.1 $3,435 $117 42.0% 127.0% 0.1%1999 37.6 $3,399 $128 43.9% 129.8% 0.2%
More than 1000 cc 1998 22.4 $3,469 $78 34.4% 70.0% 0.1%1999 24.0 $3,504 $84 35.8% 72.5% 0.1%
Total 1998 27.0 $3,098 $84 37.0% 91.8% 0.2%1999 29.1 $3,105 $90 38.4% 94.5% 0.2%
Comprehensive Less than 750 cc 1998 15.2 $2,988 $44 24.5% 114.5% 3.1%1999 14.3 $2,882 $41 21.7% 101.3% 0.8%
750-1000 cc 1998 13.3 $4,055 $54 21.3% 79.7% 0.5%1999 13.3 $4,327 $57 21.4% 81.8% 0.7%
More than 1000 cc 1998 9.2 $6,346 $58 27.1% 68.2% 0.6%1999 9.0 $5,972 $53 23.8% 60.9% 0.6%
Total 1998 11.8 $4,518 $53 25.4% 79.1% 1.1%1999 11.3 $4,399 $49 22.8% 71.6% 0.7%
Uninsured Less than 750 cc 1998 1.0 $16,275 $15 17.5% 47.1% 3.0%Motorist & 1999 1.2 $16,374 $18 19.5% 57.4% 1.8%Uninsured/ 750-1000 cc 1998 1.7 $16,129 $26 17.7% 67.8% 2.4%
Underinsured 1999 1.7 $16,874 $27 17.0% 74.1% 4.0%Combined More than 1000 cc 1998 1.5 $24,637 $35 21.7% 84.5% 3.9%
1999 1.8 $22,975 $39 23.3% 96.8% 2.8%Total 1998 1.3 $20,315 $25 19.8% 67.7% 3.4%
1999 1.5 $19,856 $29 21.2% 78.9% 2.6%
10
MOTOR VEHICLE INSURANCE IN THE UNITED STATES: A 1998-1999 SNAPSHOT WITH EMPHASIS ON MOTORCYCLE COVERAGE

Table 1. (cont.) Motorcycle Insurance Statistics by Engine Size, Selected Companies, 1998-1999
Claims Average Percent Per 1000 Claim Loss of Total Loss ALAECovers Severity Cost Losses Ratio Ratio
Total Less than 750 cc 1998 6.2 $3,290 $20 100.0% 52.3% 1.7%1999 6.7 $3,291 $21 100.0% 57.0% 1.5%
750-1000 cc 1998 7.6 $4,341 $32 100.0% 58.9% 1.0%1999 8.5 $4,224 $35 100.0% 62.8% 1.2%
More than 1000 cc 1998 6.6 $5,317 $34 100.0% 52.7% 1.3%1999 7.0 $5,279 $36 100.0% 54.6% 1.2%
All Motorcycles 1998 6.6 $4,351 $28 100.0% 53.4% 1.4%1999 7.1 $4,331 $30 100.0% 56.5% 1.3%
11
MOTOR VEHICLE INSURANCE IN THE UNITED STATES: A 1998-1999 SNAPSHOT WITH EMPHASIS ON MOTORCYCLE COVERAGE

12
MOTOR VEHICLE INSURANCE IN THE UNITED STATES: A 1998-1999 SNAPSHOT WITH EMPHASIS ON MOTORCYCLE COVERAGE
Table 2.Personal Auto Insurance Statistics by Vehicle Type, Selected Companies, 1998-1999
Claims Average Percent Per 1000 Claim Loss of Total Loss ALAECovers Severity Cost Losses Ratio Ratio
Bodily Injury Car 1998 15.6 $8,056 $125 24.8% 61.9% 5.2%Liability 1999 15.0 $6,979 $105 21.5% 55.7% 5.1%
Light Truck 1998 13.9 $8,154 $114 26.1% 63.2% 4.3%1999 13.4 $7,383 $99 23.0% 59.4% 4.0%
Van 1998 12.5 $8,200 $102 23.8% 56.7% 4.5%1999 11.9 $7,344 $88 21.2% 52.5% 4.5%
SUV 1998 14.8 $8,382 $124 24.8% 62.9% 4.3%1999 14.2 $7,454 $106 21.6% 57.9% 4.0%
Total 1998 14.9 $8,124 $121 25.0% 61.8% 4.9%1999 14.3 $7,140 $102 21.7% 56.3% 4.7%
Property Car 1998 58.2 $1,464 $85 16.3% 71.9% 0.2%Damage 1999 59.5 $1,460 $87 17.2% 74.2% 0.2%Liability Light Truck 1998 59.1 $1,607 $95 20.8% 85.2% 0.2%
1999 59.2 $1,652 $98 21.7% 88.9% 0.2%Van 1998 53.5 $1,418 $76 17.1% 72.7% 0.2%
1999 54.3 $1,436 $78 18.2% 76.1% 0.2%SUV 1998 61.5 $1,583 $97 18.9% 87.7% 0.3%
1999 62.2 $1,597 $99 19.8% 91.0% 0.2%Total 1998 58.4 $1,502 $88 17.4% 76.2% 0.2%
1999 59.3 $1,513 $90 18.4% 79.2% 0.2%Own Medical Car 1998 16.3 $1,897 $31 3.7% 81.9% 1.2%
Payments 1999 16.5 $1,959 $32 4.1% 90.9% 1.2%Light Truck 1998 10.0 $1,986 $20 2.7% 52.0% 1.0%
1999 10.1 $2,100 $21 2.9% 58.8% 1.0%Van 1998 12.0 $2,165 $26 3.7% 73.5% 1.0%
1999 12.0 $2,146 $26 3.9% 78.2% 1.1%SUV 1998 11.8 $2,069 $24 2.8% 63.7% 0.9%
1999 12.0 $2,136 $26 3.1% 72.2% 0.8%Total 1998 14.2 $1,946 $28 3.4% 73.5% 1.1%
1999 14.3 $2,011 $29 3.7% 81.4% 1.1%

Table 2. (cont.)Personal Auto Insurance Statistics by Vehicle Type, Selected Companies, 1998-1999
Claims Average Percent Per 1000 Claim Loss of Total Loss ALAECovers Severity Cost Losses Ratio Ratio
Personal Car 1998 23.8 $4,546 $108 8.3% 98.2% 4.4%Injury 1999 25.2 $3,776 $95 7.6% 91.7% 4.8%
Protection Light Truck 1998 14.9 $4,112 $61 4.9% 63.6% 2.3%1999 15.4 $3,541 $55 4.4% 60.9% 2.3%
Van 1998 17.5 $5,235 $92 8.3% 89.9% 3.5%1999 18.4 $4,159 $77 7.1% 80.5% 4.0%
SUV 1998 17.9 $5,032 $90 7.3% 80.9% 3.2%1999 19.2 $4,637 $89 7.2% 86.3% 3.1%
Total 1998 21.0 $4,602 $96 7.6% 90.0% 3.8%1999 22.1 $3,882 $86 7.0% 85.3% 4.1%
Collision Car 1998 87.3 $1,788 $156 26.3% 65.6% 0.2%1999 90.9 $1,848 $168 29.7% 71.0% 0.1%
Light Truck 1998 64.3 $1,819 $117 22.3% 56.4% 0.1%1999 66.0 $1,952 $129 25.3% 61.9% 0.1%
Van 1998 71.2 $1,595 $114 23.5% 55.5% 0.1%1999 74.1 $1,656 $123 26.5% 60.0% 0.1%
SUV 1998 68.3 $2,026 $138 24.4% 51.2% 0.1%1999 70.6 $2,153 $152 28.0% 56.5% 0.1%
Total 1998 79.3 $1,802 $143 25.2% 61.2% 0.1%1999 82.0 $1,884 $154 28.4% 66.3% 0.1%
Comprehensive Car 1998 89.4 $836 $75 13.4% 60.5% 0.3%1999 87.0 $814 $71 13.2% 58.1% 0.2%
Light Truck 1998 119.1 $718 $86 17.3% 73.5% 0.3%1999 117.0 $713 $83 17.3% 71.2% 0.2%
Van 1998 101.5 $731 $74 16.1% 71.6% 0.2%1999 99.1 $723 $72 16.2% 69.1% 0.2%
SUV 1998 115.3 $754 $87 16.0% 56.3% 0.2%1999 111.5 $716 $80 15.3% 52.8% 0.2%
Total 1998 99.2 $788 $78 14.6% 62.9% 0.2%1999 96.9 $767 $74 14.4% 60.3% 0.2%
13
MOTOR VEHICLE INSURANCE IN THE UNITED STATES: A 1998-1999 SNAPSHOT WITH EMPHASIS ON MOTORCYCLE COVERAGE

Table 2. (cont.)Personal Auto Insurance Statistics by Vehicle Type, Selected Companies, 1998-1999
Claims Average Percent Per 1000 Claim Loss of Total Loss ALAECovers Severity Cost Losses Ratio Ratio
Uninsured Car 1998 6.4 $5,635 $36 7.2% 59.6% 3.5%Motorist & 1999 6.4 $5,129 $33 6.8% 57.3% 3.4%Uninsured/ Light Truck 1998 4.6 $5,554 $25 6.0% 46.6% 2.2%
Underinsured 1999 4.5 $4,995 $23 5.4% 43.6% 2.1%Combined Van 1998 4.7 $6,957 $33 7.6% 55.8% 3.0%
1999 4.7 $6,057 $29 6.9% 51.2% 2.9%SUV 1998 4.5 $6,410 $29 5.7% 46.9% 2.3%
1999 4.5 $5,482 $25 5.0% 42.4% 2.3%Total 1998 5.7 $5,796 $33 6.8% 55.4% 3.1%
1999 5.7 $5,216 $30 6.3% 52.3% 3.0%Total Car 1998 44.1 $2,001 $88 100.0% 66.7% 2.1%
1999 44.7 $1,903 $85 100.0% 66.3% 2.0%Light Truck 1998 43.4 $1,782 $77 100.0% 64.8% 1.6%
1999 43.5 $1,749 $76 100.0% 65.4% 1.4%Van 1998 41.6 $1,784 $74 100.0% 63.2% 1.8%
1999 41.8 $1,705 $71 100.0% 62.8% 1.7%SUV 1998 45.2 $1,926 $87 100.0% 61.4% 1.5%
1999 45.3 $1,867 $84 100.0% 61.7% 1.4%Total 1998 43.9 $1,933 $85 100.0% 65.4% 1.9%
1999 44.3 $1,853 $82 100.0% 65.2% 1.8%
14
MOTOR VEHICLE INSURANCE IN THE UNITED STATES: A 1998-1999 SNAPSHOT WITH EMPHASIS ON MOTORCYCLE COVERAGE

Table 3.Losses and Loss and Expense Ratios by Kind of Auto Insurance, Nationwide, 1998-1999
Com- Total LAE LAE mission Other LAE &
Kind of Vehicle Premiums Loss (Narrowly (Broadly & Under- Under-Insurance Type Year Earned Ratio Defined) Defined) Brokerage writing writingLiability Private 1998 70,488,746 61.6% NA 14.7% 9.0% 14.5% 38.3%
Passenger 1999 69,541,977 66.5% 4.6% 14.8% 8.9% 15.5% 39.2%Commercial 1998 12,736,277 72.1% NA 13.6% 13.0% 17.2% 43.9%
1999 12,565,725 72.3% 7.7% 15.8% 14.5% 17.5% 47.9%Physical Private 1998 45,375,351 63.7% NA 10.2% 9.7% 14.7% 34.6%Damage Passenger 1999 47,981,924 63.4% 0.7% 10.5% 9.1% 15.7% 35.3%
Commercial 1998 5,127,653 69.4% NA 8.8% 14.2% 16.1% 39.1%1999 5,191,970 69.8% 0.9% 10.0% 15.5% 17.3% 42.8%
All numbers are percentages of premiums earned.NA = not availableSource: Quoted or computed from Best’s Aggregates and Averages - Property Casualty, 2000 Edition
15
MOTOR VEHICLE INSURANCE IN THE UNITED STATES: A 1998-1999 SNAPSHOT WITH EMPHASIS ON MOTORCYCLE COVERAGE

Table 4.Percentage Distribution of Personal Passenger Auto Insurance Policies by VehicleType and Year, for Selected Companies, Excluding Motorcycle
Vehicle Type 1998 1999Car 59.95% 58.71%
Light Truck 18.82% 18.94%Van 8.95% 9.04%SUV 12.28% 13.31%Total 100.00% 100.00%
16
MOTOR VEHICLE INSURANCE IN THE UNITED STATES: A 1998-1999 SNAPSHOT WITH EMPHASIS ON MOTORCYCLE COVERAGE
Insurance for Other Private Passenger Vehicles
The survey responses described more than 25 percent but less than 50 percent of allprivate passenger insurance premiums.
These responses appeared to be highlyrepresentative of the industry as a whole. The loss ratio for the responding companies averaged65.2 percent, essentially the same as the 66.3percent for the industry (A.M. Best 2000). ALAEfor liability coverage averaged 3 percent, identicalto the all-industry percentage (Goch, 2000).
Table 4 shows the percentage distribution ofpolicies between vehicle types. Passenger carscomprised almost 60 percent of the coveredvehicles. Sport utility vehicles (SUVs) were risingin popularity, reaching 13 percent of coveredvehicles in 1999. Light trucks were 19 percent ofcovered vehicles and vans were 9 percent.
Table 2 presents insurance statistics by coveragefor personal passenger auto other thanmotorcycles. Property damage liability andcollision claims each are four to five times asfrequent as bodily injury liability claims. Claimsunder PIP and own medical also are more
common than under bodily injury liability. Inpart, that is because bodily injury liability claimsin no-fault states only are filed for losses abovethe PIP limit, typically $15,000-$25,000. In statesthat do not adhere to a no-fault regime, coveragefor own medical payments is designed to assurethat no one hesitates to treat an injured driverbecause (s)he might be unable to pay the bill.Policy limits for this coverage are establishedlegislatively and low, perhaps $500 to $5,000depending on the state. Predictably, bodily injuryclaims are much more severe than PIP or ownmedical payments claims and account for doublethe total losses. Claims under uninsured motoristcoverage also tend to be severe.
Intriguingly, bodily injury liability, PIP, uninsuredmotorist, and total claim severity fell from 1998 to 1999. It is possible that this fall resulted fromtighter medical cost management or decliningcrash severity. Judging by loss ratios, own medical payments and PIP coverage were lessprofitable than most coverages. ALAE wassubstantially lower for property damage claimsthan for other claims.

17
MOTOR VEHICLE INSURANCE IN THE UNITED STATES: A 1998-1999 SNAPSHOT WITH EMPHASIS ON MOTORCYCLE COVERAGE
successfully argued it is unfair to shift costs fromauto drivers to motorcyclists. Consequently,legislatures typically have exemptedmotorcyclists from no-fault laws and not requiredthem to purchase no-fault personal injuryprotection (PIP) coverage or even own medicalpayments coverage. In Kentucky and Texas,however, recent laws require that motorcyclistscarry coverage for their medical costs, regardlessof who is at fault, if they wish to rideunhelmeted. Our survey revealed that some
Bodily injury liability, property damage liabilityand uninsured motorist coverage were includedin 85 percent to 90 percent of motorcycleinsurance policies. Personal injury protection orown medical expense coverage was extremelyuncommon in the motorcycle market. DavidLarge, an executive in GuideOne Insurance’smotorcycle program, reports (personalcommunication with Ted Miller, July 27, 1998)that other drivers are at fault in more than 75percent of motorcycle crashes. Motorcyclists have
A Further Comparison of Motorcycle and Other PrivatePassenger Auto Insurance
T able 5 compares the coverages included intypical motorcycle and auto insurancepolicies. They differ radically. Motorcycles
were covered by much less comprehensiveinsurance than other vehicles.
Policies on other vehicles virtually all includedcoverage for bodily injury liability, propertydamage liability, uninsured motorist, and one ofPIP or own medical expenses. This broad range
of coverage was not entirely due to legislativemandates since some states (e.g., Mississippi) did not require drivers to carry insurance.Furthermore, 90.8 percent of policies includedcomprehensive coverage and 86.1 percentincluded collision coverage. Our survey, however,did not include insurers that primarily coverhigh-risk drivers, so collision coverage may beless common in the overall insurance pool.
Table 5.Percentage of Policyholders with Different Coverages, Motorcyclists versus OtherMotorists, Selected Companies, 1999
Coverage Motorcycles Other VehiclesBodily Injury Liability 87.1% 99.6%Passenger Liability 24.1% 99.6% *Property Damage Liability 85.4% 96.0%Own Medical Expenses 11.5% 60.3%Personal Injury Protection 3.8% 37.9%Collision 52.3% 86.1%Comprehensive 56.8% 90.8%Uninsured Motorist 90.6% 99.9%
* = Included in bodily injury liability.

18
MOTOR VEHICLE INSURANCE IN THE UNITED STATES: A 1998-1999 SNAPSHOT WITH EMPHASIS ON MOTORCYCLE COVERAGE
insurers responded to this requirement byoffering optional PIP coverage for motorcyclists inthese states. Just over half of motorcycle policiesinclude collision and comprehensive coverage.
Comparing Tables 1 and 2 reveals that theaverage severity of medical payment and PIPclaims was substantially lower for motorcyclesthan for other personal passenger vehicles.Conversely, the average bodily injury claimagainst a motorcycle was almost twice as severeas one against other personal passenger vehicles.This finding is especially surprising since policieson other vehicles were much more likely toinclude no-fault PIP coverage that shifted low-severity claims away from bodily injury coverage.The reasons for the observed differences areunknown. One probable contributor is a heavierconcentration of pedestrians and motorcyclepassengers among bodily injury claims againstmotorcycles. Indeed, Mr. Large reports that many states only require motorcyclists topurchase bodily injury liability protectioncovering those groups.
Average collision claim severity (losses per claim)for motorcycles was 1.65 times the averageseverity for other private passenger vehicles($3,105 versus $1,884 in 1999, from Tables 1 and2). This differential is especially notable sinceautos typically cost more than motorcycles. Claimseverity varied minimally between other types ofprivate passenger vehicles.
When comparing claims frequencies and averageloss costs between motorcycles and otherpersonal passenger vehicles, it is important toremember that other passenger vehicles travel 4.6times as many miles (FHWA 2000). If these twovehicle types were equally safe, claims per 1000covers would be 4.6 times greater for the othervehicles than for motorcycles. With thisadjustment, for bodily injury liability claims(including passenger injury liability claims in themotorcycle total), the motorcycles experiencedslightly fewer liability claims per 1000 covers thanother vehicles. They experienced far fewerproperty damage liability claims, many moremedical payments claims, modestly more PIPclaims, and comparable numbers of uninsuredmotorist claims.
Table 6 presents comparative statistics at thepolicy level rather than the individual cover level.As Table 5 illustrated, motorcycle insurancepolicies were narrow, averaging fewer coversthan other policies. Motorcycle insurance policiesalso had lower premiums; they cost much lessthan other private passenger insurance policies.The premium difference arose not only becausemotorcycle policies included less covers butbecause motorcycles traveled an average of 2,600miles annually while other vehicles traveled11,700 miles.

Table 6.Statistics About Private Passenger Auto Insurance Policies by Vehicle Type,Selected Companies, 1998-1999
Premium Premium Crash Covers per per All- Claims Losses Losses Losses*
per Actual Cover per 1000 per per 1000 per 1000 Policy Policy Policy Policies Policy Miles Miles
Less than 750 cc 1998 3.9 $150 $273 23.9 $79 NA NAMotorcycle 1999 3.9 $152 $270 26.3 $87 NA NA750-1000 cc 1998 4.0 $222 $387 30.2 $131 NA NAMotorcycle 1999 4.0 $231 $395 34.4 $145 NA NAMore than 1000 cc 1998 4.3 $284 $440 28.2 $150 NA NAMotorcycle 1999 4.3 $291 $446 30.2 $159 NA NAAll Motorcycles 1998 4.1 $216 $368 26.5 $116 $44 $33
1999 4.1 $223 $372 29.1 $126 $49 $38Car 1998 5.7 $757 $853 252.2 $520 $44 $38
1999 5.7 $735 $825 255.8 $501 $42 $37Light Truck 1998 5.5 $657 $765 239.1 $437 $36 $30
1999 5.5 $644 $744 240.8 $430 $36 $30Van 1998 5.8 $680 $754 240.8 $442 $36 $31
1999 5.8 $658 $728 242.3 $425 $36 $30SUV 1998 5.8 $816 $906 260.3 $514 $42 $36
1999 5.8 $792 $873 261.8 $499 $42 $35Subtotal 1998 5.7 $738 $835 249.7 $497 $42 $36
1999 5.7 $718 $808 252.5 $481 $40 $35All Private 1998 5.6 $724 NA 244.0 $487 $41 $36Passenger Auto 1999 5.6 $704 NA 246.4 $471 $40 $35
* = Excludes comprehensive
19
MOTOR VEHICLE INSURANCE IN THE UNITED STATES: A 1998-1999 SNAPSHOT WITH EMPHASIS ON MOTORCYCLE COVERAGE
Thus, this coverage is relatively less costly formotorcycles than other vehicles.
Motorcycle insurance premiums for crash-relatedcoverage averaged $180 per policy comparedwith $620 per policy for other private passengervehicles. Motorcyclists tend to buy policies thatcover less risks than other drivers. Premiums fora policy that included all the crash-relatedcoverages available (with the more costly ofmedical payments or personal injury protection)would average $300 for motorcycles and $700 for
Differences in miles traveled primarily affectcrash-related risk. Breaking down the premiumdata in more detail than Table 6, premiums forcomprehensive coverage against theft, vandalism,and other non-crash losses, across all policy-holders, averaged $40 for motorcycles and $110for other vehicles. Among purchasers, premiumsfor comprehensive coverage averaged $70 and$125 respectively. The 1.8 ratio of premiums forcomprehensive coverage of other vehicles versusmotorcycles (125/70) is greater than the 1.5 ratioof average loss costs (74/49, from Tables 1 and 2).

20
MOTOR VEHICLE INSURANCE IN THE UNITED STATES: A 1998-1999 SNAPSHOT WITH EMPHASIS ON MOTORCYCLE COVERAGE
other private passenger autos. Becausemotorcycles typically are driven less than otherprivate passenger vehicles, these lower premiumsfor motorcycles are misleading. Per 1000 vehiclemiles traveled, premiums earned in 1999averaged $87 for narrow motorcycle policies and$61 for broader policies for other vehicles. Thus,motorcycle coverage is expensive relative tocoverage on other private passenger vehicles.
The higher price of motorcycle policies did notresult from worse loss experience. Compensatedcrash-related losses per thousand miles driven in1998-1999 were comparable for motorcycles andother private passenger vehicles, with bothaveraging $35.50. Goch (2000) suggests autoinsurance premiums were untenably low in 1999.The auto insurers lost money. Our data indicatethat problem did not extend to the motorcyclemarket, which probably broke even or yielded amodest profit. As Tables 1 and 2 showed, the lossratio for motorcycles averaged 55 percent in 1998-1999, well below the 67 percent average for othervehicles. If auto insurance premium adjustmentsreturn this line to profitability, premiums mightrise into the range in the motorcycle insurancemarket. Over even a 20-year time horizon,however, auto liability insurance often has been a loss leader for property-casualty insurers.
The finding that motorcycles and other privatepassenger vehicles have comparable crash-relatedloss costs per thousand miles driven is strongly
influenced by the narrower coverage in a typicalmotorcycle policy. If all policies included broadcoverage, losses per thousand miles driven wouldhave been $59.50 for motorcycles and $37.50 forother vehicles. These estimates assume eachpolicy would include only one of own medicalpayments or PIP, with the actual percentage splitbetween these two coverages preserved. Eventhese estimates are not completely comparablebecause motorcyclists are more likely than othermotorists to have own medical paymentscoverage rather than more costly PIP coverage;PIP has a higher payment maximum for theinsured’s own injury losses. Policy limits on ownmedical also may be lower on motorcycle thanother private passenger vehicle policies, a distinctpossibility given that own medical payments perclaim average half as large for motorcyclists asother vehicle operators.
A final notable aspect of Table 5 is the variation inclaims experience between vehicle types. Lighttrucks and vans had 10 percent lower losses perpolicy (and proportionately lower premiums)than cars or SUVs. Vans sustained slightly lessproperty damage per claim (collision loss severityin Table 2) than other vehicles; SUVs sustainedslightly more damage than other vehicles. Lighttruck owners bought slightly less comprehensivecoverage than other vehicle owners. Their lossexperience per 1000 vehicle miles of travel wascomparable to vans but better than the lossexperience for cars and SUVs.

21
MOTOR VEHICLE INSURANCE IN THE UNITED STATES: A 1998-1999 SNAPSHOT WITH EMPHASIS ON MOTORCYCLE COVERAGE
these three vehicle types is crash-involved. Theaverage payments of $4,300 to heavy truckowners under their collision coverage were 2.15times average payments to owners of othercommercial vehicles. Payments under collisioncoverage for light commercial vehicles andbuses/vans averaged about $2,000 (comparable to or slightly above average payments percollision claim under personal passenger vehicleinsurance). Since deductibles on collisioncoverage probably were similar across all types of commercial vehicles, the property damage cost for a crash-involved medium/heavy truckprobably was about double the property damagecost for other crash-involved vehicles ($4,600versus $2,300 if we assume a $300 averagedeductible). Average property damage costs forcrash-involved buses, however, did not exceedpassenger vehicle property damage costs (afinding consistent with the suggestion byZaloshnja and Miller (2000) that low-cost,presumably low-speed bus crashes are reported to police more often than other low-cost crashes).These findings can be used to improve currentproperty damage cost estimates for medium/heavy trucks.
The companies surveyed for this study wereselected because they were the largestwriters of private passenger vehicle or
motorcycle insurance. They were not, however,among the largest writers of commercial vehicleinsurance. Indeed, the respondents collectivelyaccount for less than 5 percent of commercialvehicle premiums. The survey should be viewedas a pilot effort for this population. It proved thedata can be obtained and suggests ways toorganize it, but the information collected probablyis not representative. In particular, the for-hirevehicle category, intended to capture taxicabs andlimousines, proved unclear and difficult forrespondents, forcing us to aggregate informationon these vehicles with light personal commercialvehicles.
The most useful information from this segment ofthe survey was on the ratio of property damagepayments per collision claim between categoriesof vehicle types: light personal and for hirevehicles. buses/passenger vans, andmedium/heavy trucks. The ratios lend insightinto the relative vehicle damage when each of
Commercial Vehicle Insurance

22
MOTOR VEHICLE INSURANCE IN THE UNITED STATES: A 1998-1999 SNAPSHOT WITH EMPHASIS ON MOTORCYCLE COVERAGE
The insurance data yielded critical factors forestimating the breakdown between costcategories of crash costs compensated by
auto insurers. They allowed computation of fivemultipliers for use with data from the annualBest’s Aggregates and Averages. These multiplierswere computed separately for private passengerand commercial insurance. Following Best’s, theprivate passenger category includes motorcycles.We show motorcycle-specific percentages as well.The multipliers are:■ The percentage of motor vehicle liability loss
costs that compensate bodily injury. In thiscomputation, we applied the percentage splitbetween bodily injury and property damageliability to decompose uninsured motorist losscosts.
■ The percentage of motor vehicle liability losscosts that compensate property damage
■ The percentage of motor vehicle propertydamage loss costs that compensate collisiondamage (as opposed to theft-related damage,for example)
■ Internal costs, computed as the percentage ofmotor vehicle liability loss costs thatcompensate costs paid by the insurance of at-fault drivers (or by the driver’s own insurancein crashes where no one was at fault). Inseparating internal from external costs, weassumed that drivers were at fault for 50percent of multi-vehicle crash costs paid bypersonal injury protection and for all single
vehicle crashes. The split of costs betweensingle and multi-vehicle crashes by vehicletype came from Miller, Levy, et al. (1998).
■ External costs, computed as the percentage ofmotor vehicle liability loss costs thatcompensate costs paid by the driver’sinsurance when another driver was at fault
Table 7 shows average multipliers for 1998-1999.The multipliers to split out crash-related propertydamage are virtually identical for personal andcommercial lines. Roughly 36 percent of totalprivate passenger and commercial auto liabilityloss costs and 65 percent of total property damageloss costs compensated crash-related propertylosses. Crash-related property damagecompensated by private passenger andcommercial motor vehicle insurance totaled$39,777 million in 1998 and $43,944 million in1999. Bodily injury losses compensated by motorvehicle insurance totaled $34,135 million in 1998and $34,684 million in 1999.
Commercial insurance was more heavily orientedtoward internal cost compensation than privatepassenger insurance was (88.9 percent versus 84.7percent of loss costs). Internal crash costscompensated by private passenger andcommercial motor vehicle insurance totaled$65,698 million in 1998 and $70,157 million in1999, about eight times the compensated externalcosts of $8,213 million in 1998 and $8,471 millionin 1999.
Who Pays?

23
MOTOR VEHICLE INSURANCE IN THE UNITED STATES: A 1998-1999 SNAPSHOT WITH EMPHASIS ON MOTORCYCLE COVERAGE
Motorcycle insurance data contrasts markedlywith the pattern for other vehicles. Motorcyclescause less property damage than bodily injury,with 75 percent rather than 63 percent of liabilitycosts related to bodily injury. Because more thanhalf of motorcycle liability payments are underuninsured motorist coverage, much of themotorcyclist’s liability insurance bill goes to paycosts imposed by other at-fault drivers. Only anestimated 45 percent of motorcyclists’ liabilitypayments cover the costs of their at-fault crashes.In contrast 85percent to 89 percent of liabilitypayments for other vehicles cover the costs oftheir at-fault crashes.
Premiums earned per private passenger liabilitypolicy averaged $431 in 1998 and $409 in 1999.The comparable figures for private passenger autoproperty damage were $342 and $341. We dividedthese numbers into total premiums earned asreported in Best’s Aggregates and Averages toestimate the total number of insured privatepassenger vehicles. We followed a similarprocedure with the relatively sparse commercial
insurance data that we were able to collect. Wesummed the insured private passenger andcommercial vehicles, then divided by the totalnumber of registered vehicles from FHWA (2000).
Those calculations yield estimates that 87 percentof motor vehicles had liability insurance in 1998and 88 percent had it in 1999. Comparablepercentages for property damage coverage were71 percent and 72 percent. By comparison, theInsurance Research Council (2001) estimates thatinsured motorists caused 86 percent of crasheswhere an insured private passenger vehicleoccupant was injured; uninsured motorists causedthe remaining 14 percent. Their estimate wascomputed completely differently from ours. Thepercentage uninsured is the ratio of injury claimsunder uninsured motorist coverage to bodilyinjury liability claims.
If we assume motorcycles are insured at the samerate as other private passenger vehicles,motorcycle insurance claims paid would total$336 million in 1998 and $400 million in 1999. The
Table 7.Percentage Multipliers for Breaking Down Annual Insurance Loss Cost Data intoLosses by Cost Category and into Internal vs. External Costs
Private Passenger * Commercial Motorcycle
Percent liability = bodily injury 63.2% 64.7% 75.2%Percent liability = property damage 36.8% 35.3% 24.8%Percent property damage = collision damage 64.8% 64.0% 61.0%Percent liability = internal costs 84.7% 88.9% 45.0%Percent liability = external costs 15.3% 11.1% 55.0%
* = Includes motorcycles and other private passenger vehicles.Note: Computed from 1998 and 1999 data from selected insurers.

24
MOTOR VEHICLE INSURANCE IN THE UNITED STATES: A 1998-1999 SNAPSHOT WITH EMPHASIS ON MOTORCYCLE COVERAGE
estimated 19 percent growth between yearsresults primarily from an 8 percent rise in claimsper cover and an 8 percent growth in registeredmotorcycles, with inflation at just 2 percent andthe percentage of passenger vehicles insuredrising by 1 percent. These claims paymentestimates are extremely tenuous. Insuredmotorcyclists buy less comprehensive coveragethan other motorists, so they also may be lesslikely to buy insurance at all.
Roughly 11 percent of auto liability loss costs and61 percent of auto property damage loss costscompensated crash-related property damage. Thepercentage of liability costs that compensateproperty damage rather than bodily injury ismuch lower for motorcycles than for otherpassenger vehicles because motorcycles weighless and thus cause less property damage.Motorcycle insurance compensated about $155million in bodily injury losses, $161 million incrash-related property damage, and $84 million intheft, vandalism, and other non-crash losses in1999. The comparable figures for 1998 were $128million, $129 million, and $79 million.
25
MOTOR VEHICLE INSURANCE IN THE UNITED STATES: A 1998-1999 SNAPSHOT WITH EMPHASIS ON MOTORCYCLE COVERAGE
Among insured motorcycles with coverage detailsknown for 1999, 14 percent had 750-1000 ccengines, 43 percent had larger engines, and 43percent had smaller ones. Insured motorcycleswith engines below 750 cc had fewer claims.Claim severity rose with engine size. Motorcyclesabove 1000 cc had especially high claim severity.
Losses per policy rose dramatically withmotorcycle engine size, with premiums risingproportionately. Touring bikes comprised 10percent of insured motorcycles and sportbikesjust over 3 percent. Losses were higher for thesemotorcycles, in part because they typically havelarger engines. Touring cycles also are expensiveand tended to be comprehensively insured.Sportbikes, however, had bad loss records.Despite having fewer coverages per policy thanmost motorcycles, these vehicles experiencedlosses per policy that were 1.5 to 2 times those ofother motorcycles with large engines and 3 timesthe all-motorcycle average.
Roughly 36 percent of motor vehicle liability losscosts and 65 percent of motor vehicle propertydamage loss costs compensated crash-relatedproperty damage. The comparable figures formotorcycles were 11 percent and 61 percent. In1999, motor vehicle insurance compensated anestimated $43,944 million in crash-relatedproperty damage and $34,684 million in bodilyinjury losses. Of this amount, motorcycleinsurance paid for roughly $161 million in crash-related property damage and $155 million inbodily injury losses.
B oth insured motorcycles and other privatepassenger vehicles experienced $35.50 incrash-related claims per thousand miles
traveled in 1998-1999. Legal and lender mandatesforce most motorists to insure against a broadrange of risks. Motorcycles, however, have lessinsurance mandates. They typically insure againstfewer risks. If they were as broadly insured asautos, their claims costs per mile traveled wouldhave been almost 1.6 times average auto claimscosts. Average collision losses per claim variedlittle between vehicle types, except that medium/heavy truck claims were twice as large as claimsfor other vehicles and motorcycle claims were 65percent larger. Compared to other privatepassenger vehicles, motorcycles also had worseloss experience on theft, vandalism, and othernon-crash risks.
Per thousand miles traveled, insurance coveragecost $87 for a motorcycle but just $61 for otherprivate passenger vehicles. In aggregate, pricingfor motorcycle coverage was commensurate withloss experience. Liability coverage, however,might have been overpriced and propertydamage coverage underpriced. Profits onmotorcycle liability coverage offset propertydamage coverage losses. In contrast, insurers lostmoney due to the underpricing of other autopolicies in 1998-1999. In interpreting these results,it is important to remember that liabilityinsurance largely pays for bodily injury to othersinjured by the insured, not to the insuredpersonally. Thus, for example, when amotorcyclist chooses against wearing a helmet,any resulting rise in insurance claims primarilywill be against the insurance of other at-faultmotorists.
Conclusion

26
MOTOR VEHICLE INSURANCE IN THE UNITED STATES: A 1998-1999 SNAPSHOT WITH EMPHASIS ON MOTORCYCLE COVERAGE
Because more than half of motorcycle liabilitypayments are under uninsured motorist coverage,much of the motorcyclist’s liability insurance billgoes to pay costs imposed by other at-faultdrivers. Internal crash costs compensated byinsurance totaled $70,157 million in 1999, abouteight times the compensated external costs of$8,471 million. Only an estimated 45 percent ofmotorcyclists’ liability payments cover theinternal costs of their at-fault crashes. In contrast85 percent to 89 percent of liability payments forother vehicles cover their internal costs.
This project yielded data that will greatly enhancefuture NHTSA crash costing. These data are muchdifferent than those collected in 1988. Increasingcomputerization and an improved data collectionstrategy make them more detailed, on point, andprecise. Supplying a data spreadsheet to thecompanies surveyed proved a very useful data
collection tool. NAII’s involvement as anintermediary also increased the comfort of at least one company with releasing data. At thesame time, some changes would be appropriatewhen similar data next are collected. First, we donot recommend collecting ALAE; Best’s dataappear to be adequate. Second, more consultationwith major writers is needed to refine thecommercial vehicle types. Third, it currentlywould be desirable to gather further data oncommercial coverage and on auto insurancecoverage offered by assigned risk plans and otherlarge writers of insurance for high-risk drivers.Fourth, in the future, simply breaking personalauto into car, light truck/van/SUV, andmotorcycle may adequately differentiate vehicletypes. Finally, a simpler data request thatcollapsed some covers might improve theresponse rate. Some insurers could not producesome of the detailed data we desired.

27
MOTOR VEHICLE INSURANCE IN THE UNITED STATES: A 1998-1999 SNAPSHOT WITH EMPHASIS ON MOTORCYCLE COVERAGE
Blincoe, L.J., and Luchter, S. (1983). The EconomicCost to Society of Motor Vehicle Accidents,Washington, DC: National Highway Traffic SafetyAdministration, DOT HS 806 342.
Miller, T.R. (1988). Safety Belt Use and AutoInsurance Prices: A Report to Congress, Washington,DC: National Highway Traffic SafetyAdministration.
Miller, T.R. (1989). 65 MPH: Does It Save Time?,33rd Proceedings of the Association for theAdvancement of Automotive Medicine, 73-90.
Miller, T.R., Viner, J.G., Rossman, S.B., Pindus,N.M., Gellert, W.A., Douglass, J.B., Dillingham,A.E., and Blomquist, G. (1991). The Costs ofHighway Crashes, Washington, DC: NationalTechnical Information Service, FHWARD91055.
Miller, T.R., Levy, D., Spicer, R., and Lestina, D.(1998). Allocating the Costs of Motor Vehicle CrashesBetween Vehicle Types, Transportation ResearchRecord 1635, 81-87.
Zaloshnja, E., Miller, T.R., and Spicer, R. (2000).Cost of Large Truck- and Bus-Involved Crashes,Report of Federal Motor Carrier SafetyAdministration, Washington, DC.
A.M. Best and Company. (2000). Best’s Aggregates and Averages, Oldwick NJ: A.M. Best and Company.
Goch, L. (2000). Car Wars, Best’s Review 101:6, 34-60.
FHWA. (2000). Highway Statistics 1999,Washington DC: Federal HighwayAdministration.
Insurance Research Council. (2001). UninsuredMotorists, 2000 Edition. Malvern PA: InsuranceResearch Council.
Kim, K.E., Boski, J., and Yamashita, E.Y. (2002).Typology of Motorcycle Crashes: Rider Characteristics,Environmental Factors, and Spatial Factors (02-2885), TRB 2002 presentation.
Lawrence, B.A., Max, W., and Miller, T.R. (2002).Cost of Injuries Resulting from Motorcycle Crashes: A Literature Review, Washington, DC: NationalHighway Traffic Safety Administration, DOT HS 809 242.
References

DOT HS 809 494March 2003