Osteoporosis in Chronic Liver Disease - DiVA Portal
60
Comprehensive Summaries of Uppsala Dissertations from the Faculty of Medicine 1037 _____________________________ _____________________________ Osteoporosis in Chronic Liver Disease BY SIF ORMARSDÓTTIR ACTA UNIVERSITATIS UPSALIENSIS UPPSALA 2001
Transcript of Osteoporosis in Chronic Liver Disease - DiVA Portal
Comprehensive Summaries of Uppsala Dissertationsfrom the Faculty of Medicine 1037
_____________________________ _____________________________
Osteoporosis in Chronic Liver Disease
BY
SIF ORMARSDÓTTIR
ACTA UNIVERSITATIS UPSALIENSISUPPSALA 2001
Dissertation for the Degree of Doctor of Philosophy (Faculty of Medicine) in Medicinepresented at Uppsala University in 2001
ABSTRACT
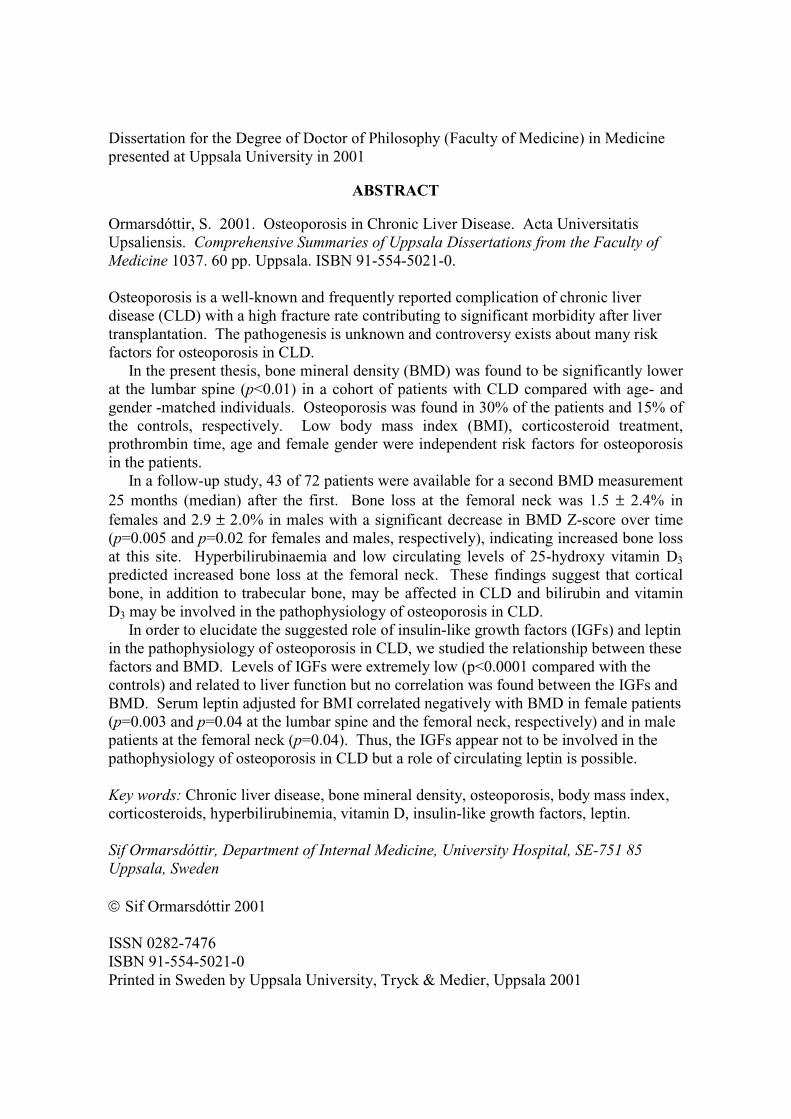
Ormarsdóttir, S. 2001. Osteoporosis in Chronic Liver Disease. Acta UniversitatisUpsaliensis. Comprehensive Summaries of Uppsala Dissertations from the Faculty ofMedicine 1037. 60 pp. Uppsala. ISBN 91-554-5021-0.
Osteoporosis is a well-known and frequently reported complication of chronic liverdisease (CLD) with a high fracture rate contributing to significant morbidity after livertransplantation. The pathogenesis is unknown and controversy exists about many riskfactors for osteoporosis in CLD. In the present thesis, bone mineral density (BMD) was found to be significantly lowerat the lumbar spine (p<0.01) in a cohort of patients with CLD compared with age- andgender -matched individuals. Osteoporosis was found in 30% of the patients and 15% ofthe controls, respectively. Low body mass index (BMI), corticosteroid treatment,prothrombin time, age and female gender were independent risk factors for osteoporosisin the patients. In a follow-up study, 43 of 72 patients were available for a second BMD measurement25 months (median) after the first. Bone loss at the femoral neck was 1.5 ± 2.4% infemales and 2.9 ± 2.0% in males with a significant decrease in BMD Z-score over time(p=0.005 and p=0.02 for females and males, respectively), indicating increased bone lossat this site. Hyperbilirubinaemia and low circulating levels of 25-hydroxy vitamin D3
predicted increased bone loss at the femoral neck. These findings suggest that corticalbone, in addition to trabecular bone, may be affected in CLD and bilirubin and vitaminD3 may be involved in the pathophysiology of osteoporosis in CLD. In order to elucidate the suggested role of insulin-like growth factors (IGFs) and leptinin the pathophysiology of osteoporosis in CLD, we studied the relationship between thesefactors and BMD. Levels of IGFs were extremely low (p<0.0001 compared with thecontrols) and related to liver function but no correlation was found between the IGFs andBMD. Serum leptin adjusted for BMI correlated negatively with BMD in female patients(p=0.003 and p=0.04 at the lumbar spine and the femoral neck, respectively) and in malepatients at the femoral neck (p=0.04). Thus, the IGFs appear not to be involved in thepathophysiology of osteoporosis in CLD but a role of circulating leptin is possible.
Key words: Chronic liver disease, bone mineral density, osteoporosis, body mass index,corticosteroids, hyperbilirubinemia, vitamin D, insulin-like growth factors, leptin.
Sif Ormarsdóttir, Department of Internal Medicine, University Hospital, SE-751 85Uppsala, Sweden
Sif Ormarsdóttir 2001
ISSN 0282-7476ISBN 91-554-5021-0Printed in Sweden by Uppsala University, Tryck & Medier, Uppsala 2001

SKALAT MAÐR RÚNAR RISTA
NEMA RÁÐA VEL KUNNI
EGILL SKALLAGRÍMSSON

PAPERS
The thesis is based on the following papers, which will be referred to in the text by their
Roman numerals:
I. Ormarsdóttir S, Ljunggren Ö, Mallmin H, Brahm H, Lööf L. Low body mass
index and use of corticosteroids, but not cholestasis, are risk factors for
osteoporosis in patients with chronic liver disease. Journal of Hepatology 1999;
31: 84-90.
II. Ormarsdóttir S, Ljunggren Ö, Mallmin H, Lööf L. Increased rate of bone loss at
the femoral neck in male patients with chronic liver disease. Submitted for
publication
III. Ormarsdóttir S, Ljunggren Ö, Mallmin H, Olofsson H, Blum WF, Lööf L.
Circulating levels of insulin-like growth factors and their binding proteins in
patients with chronic liver disease. Lack of correlation with bone mineral density.
In press, Liver
IV. Ormarsdóttir S, Ljunggren Ö, Mallmin H, Olofsson H, Blum WF, Lööf L.
Inverse relationship between circulating levels of leptin and bone mineral density
in chronic liver disease. Submitted for publication
Reprints were made with the permission of the publishers
CONTENTS
Abbreviations..................................................................................................................... 6
Introduction ....................................................................................................................... 7
A. Metabolic bone disease ............................................................................................ 7
Bone metabolism ...................................................................................................... 7
Osteoporosis and osteomalacia ............................................................................... 8
Measurements of bone mineral density .................................................................. 10
B. Metabolic bone disease in chronic liver disease .................................................... 11
Chronic liver disease.............................................................................................. 11
Liver failure and the Child-Pugh classification ..................................................... 12
“Hepatic osteodystrophy”...................................................................................... 12
C. Insulin-like growth factors ..................................................................................... 14
Insulin-like growth factors and insulin-like growth factor binding proteins ......... 14
Insulin-like growth factors in chronic liver disease............................................... 16
Insulin-like growth factors and bone ..................................................................... 16
D. Leptin ..................................................................................................................... 17
Aims of the study ............................................................................................................. 19
Subjects ............................................................................................................................ 20
Methods ............................................................................................................................ 22
Definition of chronic liver disease ........................................................................ 22
Body mass index .................................................................................................... 22
Measurements of bone mineral density................................................................. 22
X-ray of the thoracic and lumbar spine ................................................................ 23
Biochemical tests................................................................................................... 23
Statistics ................................................................................................................ 24
Ethics ................................................................................................................................ 24
Results .............................................................................................................................. 25
Discussion......................................................................................................................... 35
Conclusions ...................................................................................................................... 44
Acknowledgements.......................................................................................................... 45
References ........................................................................................................................ 47

6
ABBREVIATIONS
1,25(OH)2 D3 1,25-dihydroxy vitamin D3
25(OH) D3 25-hydroxy vitamin D3
ALT alanine transaminase
AST aspartate transaminase
auCAH autoimmune chronic active hepatitis
BMD bone mineral density
BMI body mass index
Ca calcium
CLD chronic liver disease
DXA dual-energy X-ray absorptiometry
ERT estrogen replacement therapy
FSH follicle stimulating hormone
GH growth hormone
IGF insulin-like growth factor
IGFBP insulin-like growth factor binding protein
PBC primary biliary cirrhosis
PSC primary sclerosing cholangitis
PTH parathyroid hormone
TGF-β transforming growth factor-β
7
INTRODUCTION
A. Metabolic bone disease
Bone metabolism
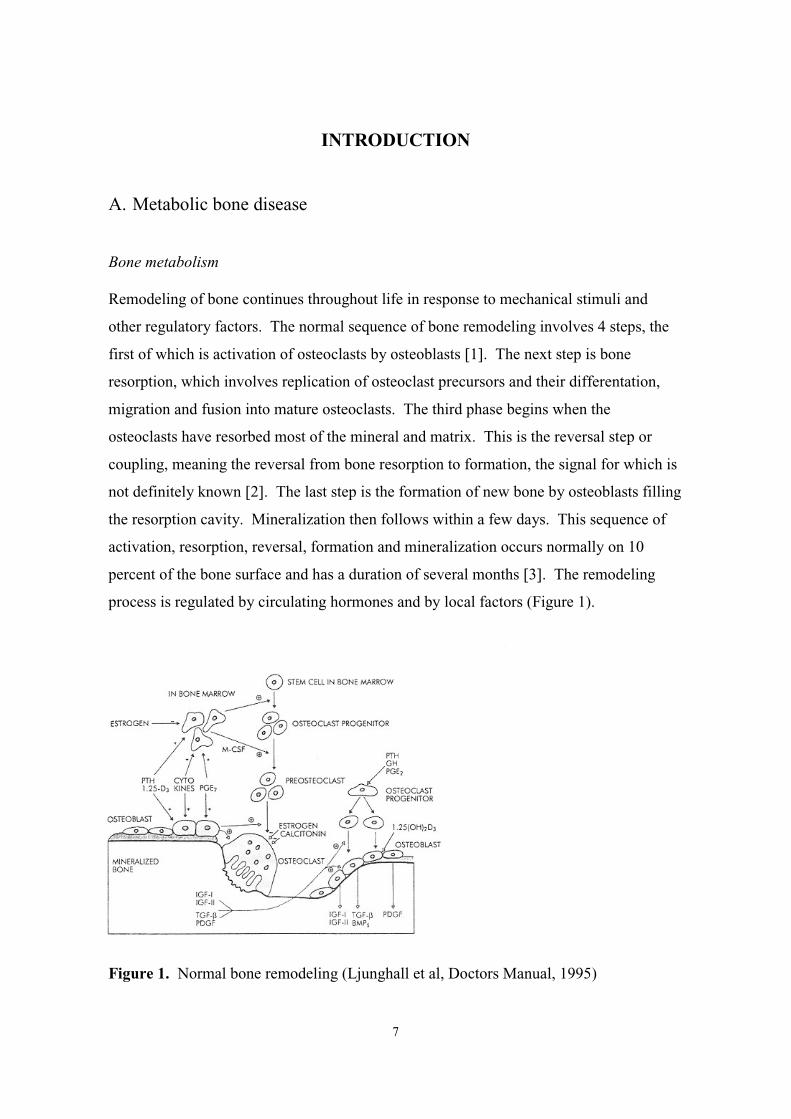
Remodeling of bone continues throughout life in response to mechanical stimuli and
other regulatory factors. The normal sequence of bone remodeling involves 4 steps, the
first of which is activation of osteoclasts by osteoblasts [1]. The next step is bone
resorption, which involves replication of osteoclast precursors and their differentation,
migration and fusion into mature osteoclasts. The third phase begins when the
osteoclasts have resorbed most of the mineral and matrix. This is the reversal step or
coupling, meaning the reversal from bone resorption to formation, the signal for which is
not definitely known [2]. The last step is the formation of new bone by osteoblasts filling
the resorption cavity. Mineralization then follows within a few days. This sequence of
activation, resorption, reversal, formation and mineralization occurs normally on 10
percent of the bone surface and has a duration of several months [3]. The remodeling
process is regulated by circulating hormones and by local factors (Figure 1).
Figure 1. Normal bone remodeling (Ljunghall et al, Doctors Manual, 1995)

8
Hormones that influence the rate of normal bone remodeling are most notably
parathyroid hormone (PTH), vitamin D and calcitonin. Increased PTH levels stimulate
bone remodeling by increasing resorption. Vitamin D, as its active metabolite 1,25-
dihydroxy vitamin D3 (1,25(OH)2 D3) (the 25 hydroxylation step taking place in the
liver), is essential for mineralization of new bone and is also a potent bone resorption
agent. The full role of vitamin D in normal bone metabolism is not clearly understood
[4-5]. Other important hormones in bone metabolism are growth hormone (GH), thyroid
hormone and sex steroids. Examples of other systemic and local factors affecting
osteoblast and/or osteoclast function are interleukin-1 and -6, transforming growth factor-
β (TGF-β), and insulin-like growth factors (IGF).
There are two types of bone tissue in adult life, trabecular and cortical bone. Trabecular
bone is concentrated in the spine and at the ends of long bones and constitutes about 25%
of the total bone mass. The annual turnover rate in trabecular bone is about 25% and in
cortical bone about 2-3% making trabecular bone more vulnerable to factors influencing
bone metabolism [3]. Bone mass is determined by the peak bone mass achieved around
the age of 20-30 and the subsequent gradual loss of bone by about 0.5-1% per year [6-8].
Bone mass is higher in men than in women throughout adult life, and in women there is
an accelerated bone loss the first years after menopause of about 2% per year [9-10].
During the course of their lifetime, women lose about 50% and men 30% of their
trabecular bone [11].
Osteoporosis and osteomalacia
Osteoporosis and osteomalacia are two forms of metabolic bone disease.
Osteoporosis is defined as a systemic disease of the skeleton, characterized by low bone
mass and altered micro-architecture of bone tissue, with a consequent increase in bone
fragility and susceptibility to fracture [12]. There is a disintegration of the bone matrix
with normal ratio of mineral to matrix [13]. Primary osteoporosis includes
postmenopausal osteoporosis (type l osteoporosis) and senile osteoporosis (type ll
osteoporosis) of elderly women and men. Postmenopausal osteoporosis is characterized
by increased bone resorption (high bone turnover) due to estrogen deficiency. There is
predominantly a loss of trabecular bone with resulting fractures mainly at the vertebrae.
9
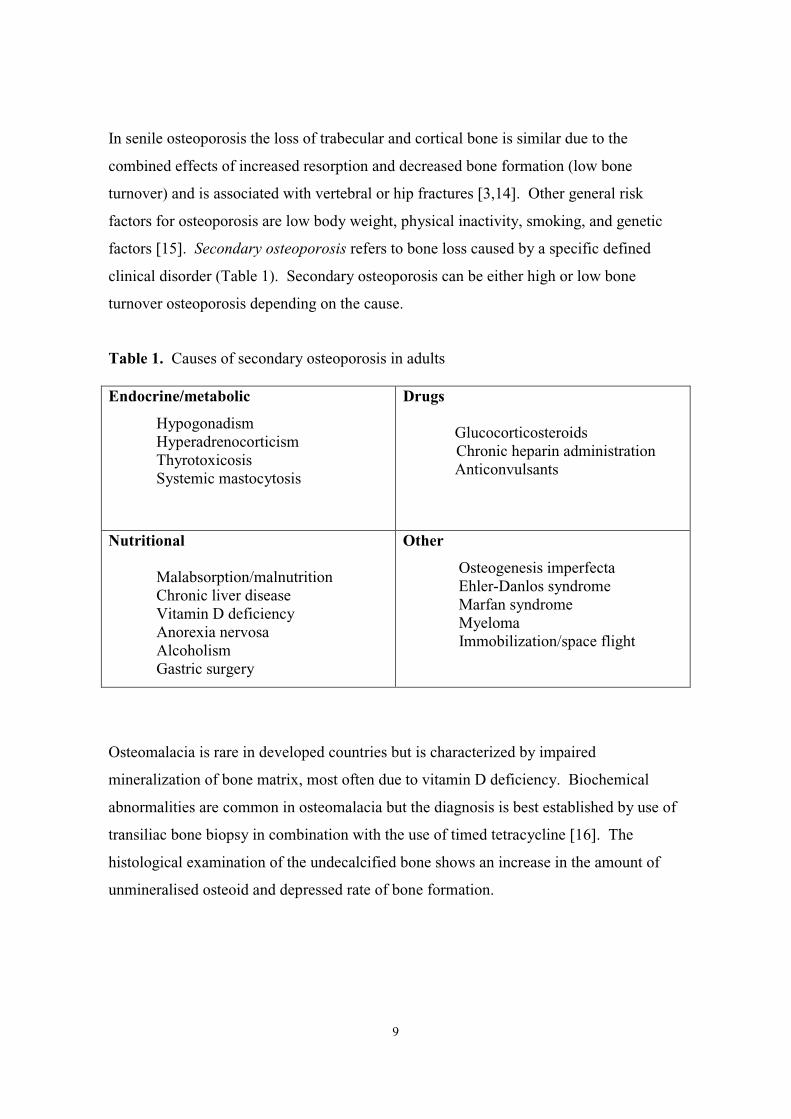
In senile osteoporosis the loss of trabecular and cortical bone is similar due to the
combined effects of increased resorption and decreased bone formation (low bone
turnover) and is associated with vertebral or hip fractures [3,14]. Other general risk
factors for osteoporosis are low body weight, physical inactivity, smoking, and genetic
factors [15]. Secondary osteoporosis refers to bone loss caused by a specific defined
clinical disorder (Table 1). Secondary osteoporosis can be either high or low bone
turnover osteoporosis depending on the cause.
Table 1. Causes of secondary osteoporosis in adults
Endocrine/metabolic
HypogonadismHyperadrenocorticismThyrotoxicosisSystemic mastocytosis
Drugs
Glucocorticosteroids Chronic heparin administration Anticonvulsants
Nutritional
Malabsorption/malnutritionChronic liver diseaseVitamin D deficiencyAnorexia nervosaAlcoholismGastric surgery
Other
Osteogenesis imperfecta Ehler-Danlos syndrome Marfan syndrome Myeloma Immobilization/space flight
Osteomalacia is rare in developed countries but is characterized by impaired
mineralization of bone matrix, most often due to vitamin D deficiency. Biochemical
abnormalities are common in osteomalacia but the diagnosis is best established by use of
transiliac bone biopsy in combination with the use of timed tetracycline [16]. The
histological examination of the undecalcified bone shows an increase in the amount of
unmineralised osteoid and depressed rate of bone formation.
10
Measurements of bone mineral density
Bone mineral density (BMD;g/cm2) is measured by non-invasive methods based on
radiology [17]. A specified amount of electromagnetic energy, in the form of a gamma-
or X-ray beam, is sent through a region of interest and the amount exiting is quantified by
a detector. Single photon absorptiometry (SPA), introduced in the 1960s measures BMD
reliably only at peripheral sites, having small amounts of surrounding tissue, such as the
heel and the wrist. Dual-energy X-ray absorptiometry (DXA) was introduced in the late
80-ies and is now the most widespread technique for evaluating BMD in patients at risk
of osteoporosis. With DXA, two distinct energy levels are used to resolve contributions
from soft tissue and bone making it possible to measure BMD at central sites such as the
spine and the proximal femur. The precision error for DXA is about 1-2% which is
important when estimating bone loss in longitudinal studies. If expected bone loss is of
the same order, i.e. 1-2% per year, measurements should be performed with not less than
1-2 years interval [18].
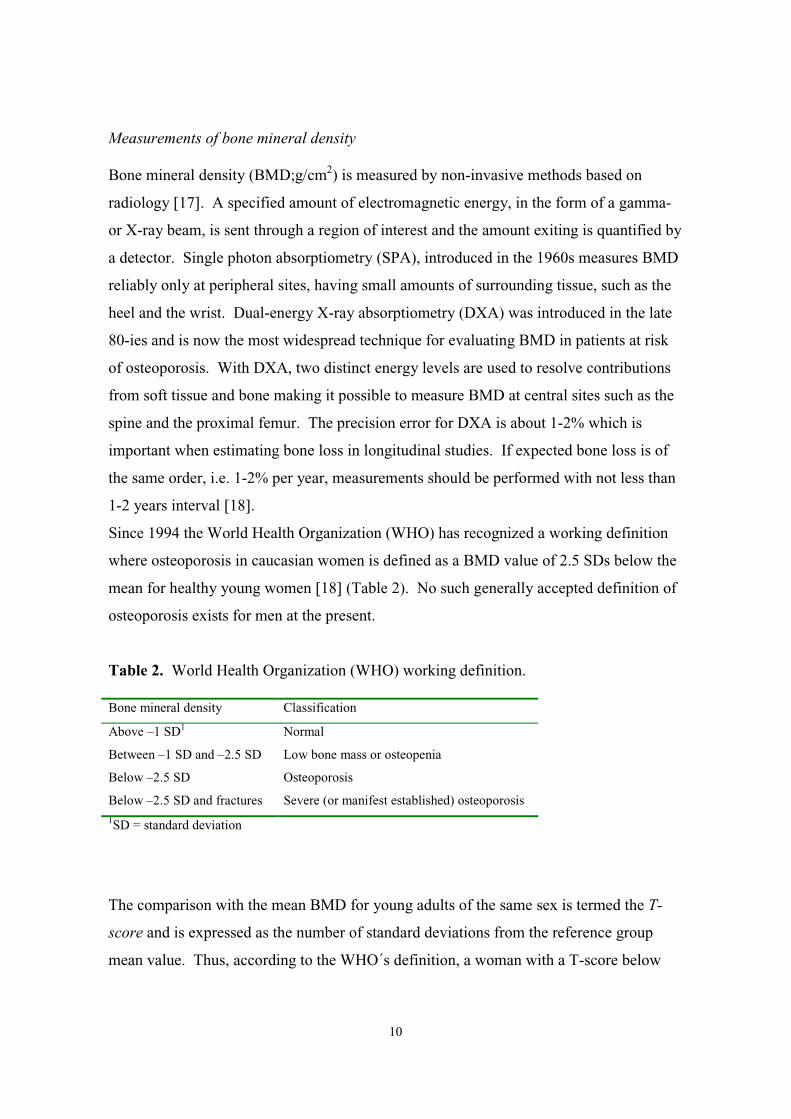
Since 1994 the World Health Organization (WHO) has recognized a working definition
where osteoporosis in caucasian women is defined as a BMD value of 2.5 SDs below the
mean for healthy young women [18] (Table 2). No such generally accepted definition of
osteoporosis exists for men at the present.
Table 2. World Health Organization (WHO) working definition.
Bone mineral density Classification
Above –1 SD1 Normal
Between –1 SD and –2.5 SD Low bone mass or osteopenia
Below –2.5 SD Osteoporosis
Below –2.5 SD and fractures Severe (or manifest established) osteoporosis1SD = standard deviation
The comparison with the mean BMD for young adults of the same sex is termed the T-
score and is expressed as the number of standard deviations from the reference group
mean value. Thus, according to the WHO´s definition, a woman with a T-score below
11
–2.5 has osteoporosis. In clinical practice the use of T-scores has also been adopted for
men. A Z-score is the number of standard deviations from age-matched and weight-
adjusted reference population of the same sex.
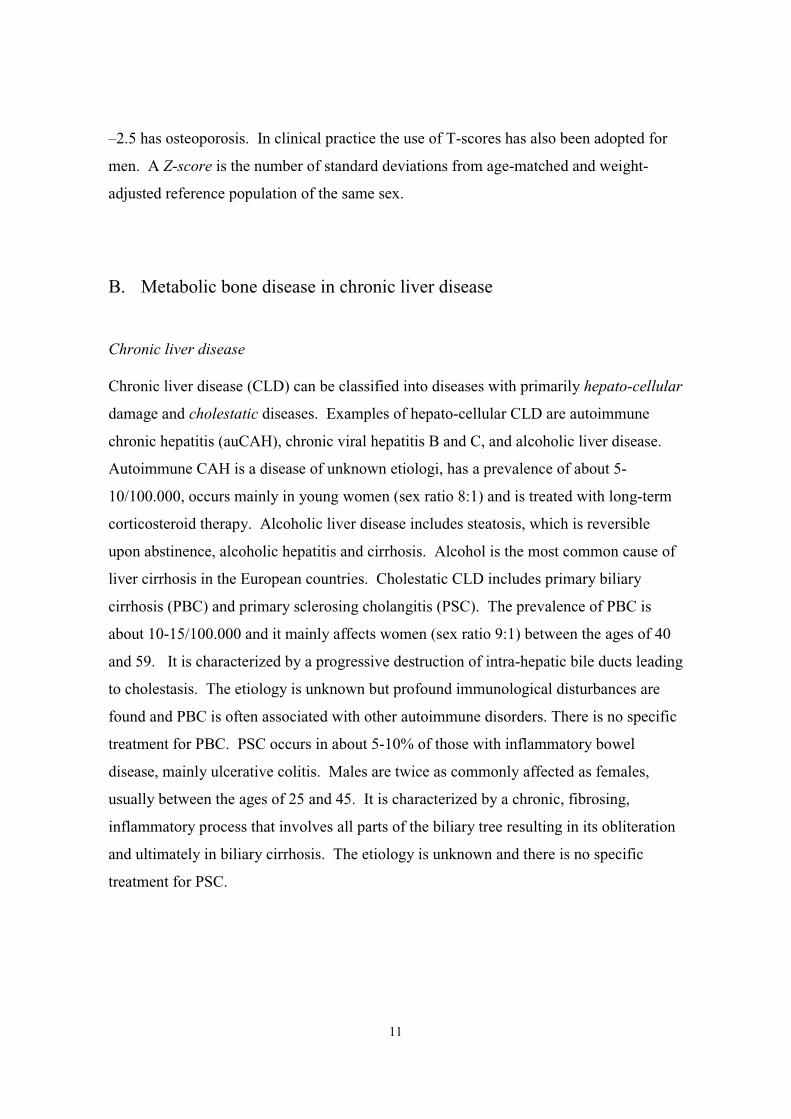
B. Metabolic bone disease in chronic liver disease
Chronic liver disease
Chronic liver disease (CLD) can be classified into diseases with primarily hepato-cellular
damage and cholestatic diseases. Examples of hepato-cellular CLD are autoimmune
chronic hepatitis (auCAH), chronic viral hepatitis B and C, and alcoholic liver disease.
Autoimmune CAH is a disease of unknown etiologi, has a prevalence of about 5-
10/100.000, occurs mainly in young women (sex ratio 8:1) and is treated with long-term
corticosteroid therapy. Alcoholic liver disease includes steatosis, which is reversible
upon abstinence, alcoholic hepatitis and cirrhosis. Alcohol is the most common cause of
liver cirrhosis in the European countries. Cholestatic CLD includes primary biliary
cirrhosis (PBC) and primary sclerosing cholangitis (PSC). The prevalence of PBC is
about 10-15/100.000 and it mainly affects women (sex ratio 9:1) between the ages of 40
and 59. It is characterized by a progressive destruction of intra-hepatic bile ducts leading
to cholestasis. The etiology is unknown but profound immunological disturbances are
found and PBC is often associated with other autoimmune disorders. There is no specific
treatment for PBC. PSC occurs in about 5-10% of those with inflammatory bowel
disease, mainly ulcerative colitis. Males are twice as commonly affected as females,
usually between the ages of 25 and 45. It is characterized by a chronic, fibrosing,
inflammatory process that involves all parts of the biliary tree resulting in its obliteration
and ultimately in biliary cirrhosis. The etiology is unknown and there is no specific
treatment for PSC.

12
Liver failure and the Child-Pugh classification
The final stage of chronic inflammation in the liver is cirrhosis. Liver cirrhosis gives rise
to portal hypertension and complications such as bleeding esophageal varices, ascites and
encephalopathy. Hepato-cellular failure results in hyperbilirubinemia, hypoalbuminemia
and prolonged prothrombin time. Child´s grade is used to assess hepato-cellular function
in cirrhosis based on these factors. The Child-Pugh classification is a modified grading
system shown to be reliable in predicting survival of patients presenting with variceal
bleedings but is also widely used as a method of assessing liver function [19] (Table 3).
Table 3. Child-Pugh classification of hepatic functional reserve in cirrhosis
Assessment criteria Points scored for abnormality
1 2 3
Grade Scores
Encephalopathy grade None 1-2 3-4 A 5-7
Ascites None Slight Moderate
Bilirubin (µmol/L) <35 35-50 >50 B 8-9
Albumin (g/L) >35 28-35 <28
Prothrombin index % >70 40-70 <40 C 10-15
”Hepatic osteodystrophy”
In 1939 a 69 year old woman with long-standing intrahepatic obstructive jaundice and
spinal osteoporosis with vertebral compressions was described [20]. Since then it has
been firmly established that chronic cholestasis, and also other forms of CLD, are
associated with metabolic bone disease [21-29]. In the era of liver transplantation,
metabolic bone disease complicating CLD has become a major clinical problem. After
liver transplantation the combination of high dose corticosteroids and immobilization
accelerates bone loss leading to a high post-transplant fracture rate ranging from 17-65%
[30-34]. Decreased BMD pre-transplant, however, is a major risk factor for the
development of post-transplant fracture [31].
13
The term “hepatic osteodystrophy” covers both osteomalacia and osteoporosis [35].
Steathorrhea with malabsorption of fat-soluble vitamins, including vitamin D,
accompanies symptomatic cholestatic liver disease. Therefore osteomalacia might be
expected to complicate CLD, as in fact was reported in earlier studies [36-37]. Over the
last two decades, better histomorphometric techniques (including double-tetracycline
labeling for diagnosing osteomalacia) have made it clear that the main bone abnormality
in CLD, cholestatic or hepato-cellular, is osteoporosis and that osteomalacia is very rare
[38-42]. Most histomorphometric studies have found osteoporosis in CLD to be of a low
bone turnover type with reduced osteoblast function, and measurements of biochemical
markers of bone metabolism, such as osteocalcin, have confirmed these findings [39-40,
43-46].
The pathogenesis of osteoporosis in CLD is unknown. Advanced liver disease and
cirrhosis are associated with an increased prevalence of osteoporosis [25, 31, 41, 46-47].
The way in which liver failure affects osteoblasts and contributes to the development of
osteoporosis is unclear. Numerous growth factors, some of which affect osteoblast
function, such as IGF-l and TGF-β, are synthesized by the liver. Toxic substances, such
as aluminium and copper, which accumulate in liver failure might also affect bone
metabolism. In haemochromatosis an increased iron burden might impair osteoblastic
activity [48-49]. Bilirubin has been shown to inhibit osteoblast proliferation in vitro [50-
51]. Whether cholestasis per se is a risk factor for osteoporosis in CLD is uncertain.
Cholestatic CLD has traditionally been considered to be associated with osteoporosis
more than other types of CLD and most studies of metabolic bone disease in CLD
involve women with PBC [24, 28]. In pre-transplant patients suffering from different
liver disorders, the highest prevalence of metabolic bone disease was found in patients
with PBC and PSC [31]. Other studies, however, have reported similar prevalence rates
for osteoporosis in patients with hepato-cellular CLD as in patients with cholestatic CLD,
ranging from 9 to 53% [23-24, 26, 52-55]. Low levels of serum vitamin D3 metabolites
and calcium (Ca) malabsorption are found in CLD [23, 38, 45, 56-58]. Whether vitamin
D deficiency is associated with metabolic bone disease in CLD is uncertain.
Hyperparathyroidism, despite vitamin D replacement, has been described in PBC [59].
Others have not found evidence of hyperparathyroidism in patients with CLD [60].
14
Treatment with corticosteroids and hypogonadism in men and women are reported by
some as risk factors for osteoporosis in CLD [24, 26, 58, 61]. Others have not found
treatment with corticosteroids to be associated with low BMD in CLD [62-63]. Other
general factors in patients with CLD such as alcohol consumption, low body weight and
physical inactivity have not been reported as independent risk factors for osteoporosis in
CLD but can be assumed to be important (Table 4).
Table 4. Potential pathophysiological factors in osteoporosis in chronic liver disease
Lack of growth factors produced by the liver
Accumulation of toxins
Cholestasis
Hyperbilirubinaemia
Vitamin D deficiency
Vitamin K deficiency
Calcium deficiency
Hypogonadism
Treatment with corticosteroids
Alcohol consumption
Low body weight
Physical inactivity
C. Insulin-like growth factors
Insulin-like growth factors and insulin-like growth factor binding proteins
Somatomedins or IGF-l and IGF-ll, are peptide hormones that play a pivotal role in the
regulation of proliferation, differentiation and specific functions of many cell types. IGF-l
is the main mediator of the effects of GH on growth and development. IGF-ll has more
insulin-like activity than IGF-l, but much less is known about its exact function [64]. The
15
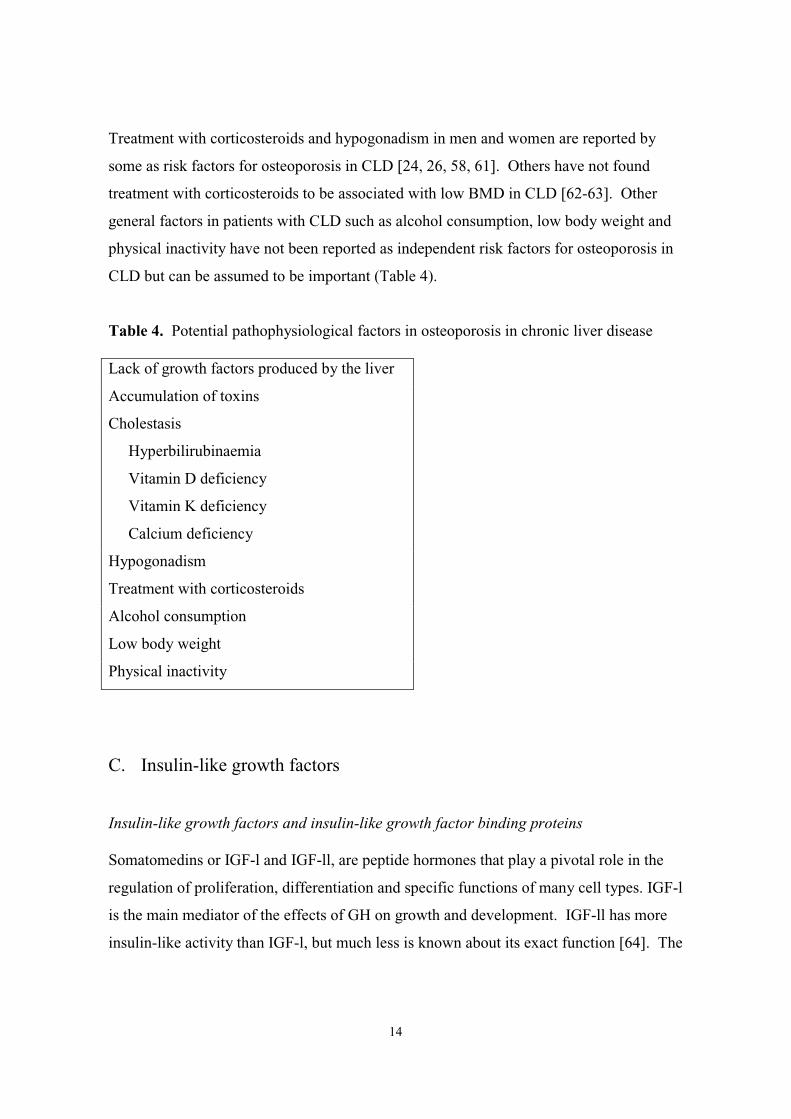
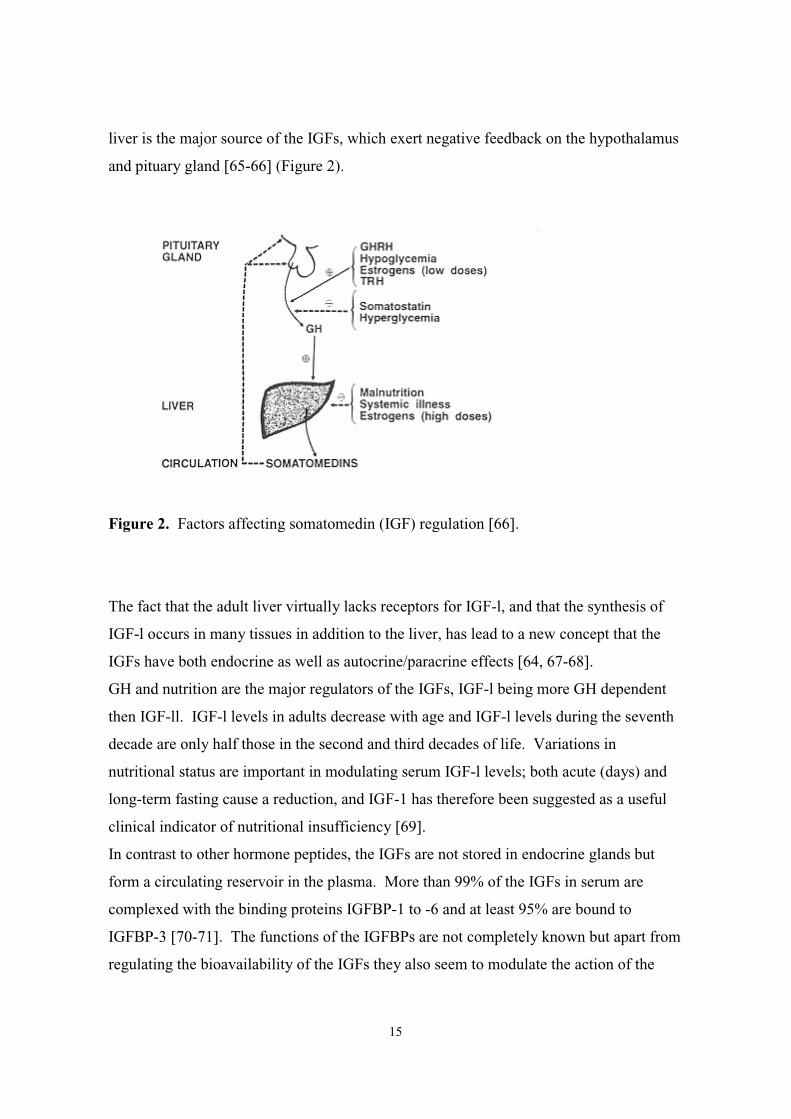
liver is the major source of the IGFs, which exert negative feedback on the hypothalamus
and pituary gland [65-66] (Figure 2).
Figure 2. Factors affecting somatomedin (IGF) regulation [66].
The fact that the adult liver virtually lacks receptors for IGF-l, and that the synthesis of
IGF-l occurs in many tissues in addition to the liver, has lead to a new concept that the
IGFs have both endocrine as well as autocrine/paracrine effects [64, 67-68].
GH and nutrition are the major regulators of the IGFs, IGF-l being more GH dependent
then IGF-ll. IGF-l levels in adults decrease with age and IGF-l levels during the seventh
decade are only half those in the second and third decades of life. Variations in
nutritional status are important in modulating serum IGF-l levels; both acute (days) and
long-term fasting cause a reduction, and IGF-1 has therefore been suggested as a useful
clinical indicator of nutritional insufficiency [69].
In contrast to other hormone peptides, the IGFs are not stored in endocrine glands but
form a circulating reservoir in the plasma. More than 99% of the IGFs in serum are
complexed with the binding proteins IGFBP-1 to -6 and at least 95% are bound to
IGFBP-3 [70-71]. The functions of the IGFBPs are not completely known but apart from
regulating the bioavailability of the IGFs they also seem to modulate the action of the
16
IGFs at cellular level [70]. The liver is the major source of IGFBP-1 and -3 and probably
also of IGFBP-2 [71]. The major regulators of circulating IGFBP-1 are insulin
(suppressive effect) and the intracellular glucose availability in the liver [73]. IGFBP-2
has a higher affinity for IGF-ll than for IGF-l but little is known about its regulation and
physiological role [74]. IGFBP-2 levels are generally increased in severe illnesses,
particularly malignant diseases. Principally, IGFBP-3 serum levels are regulated by the
same variables as IGF-l, especially by GH [73].
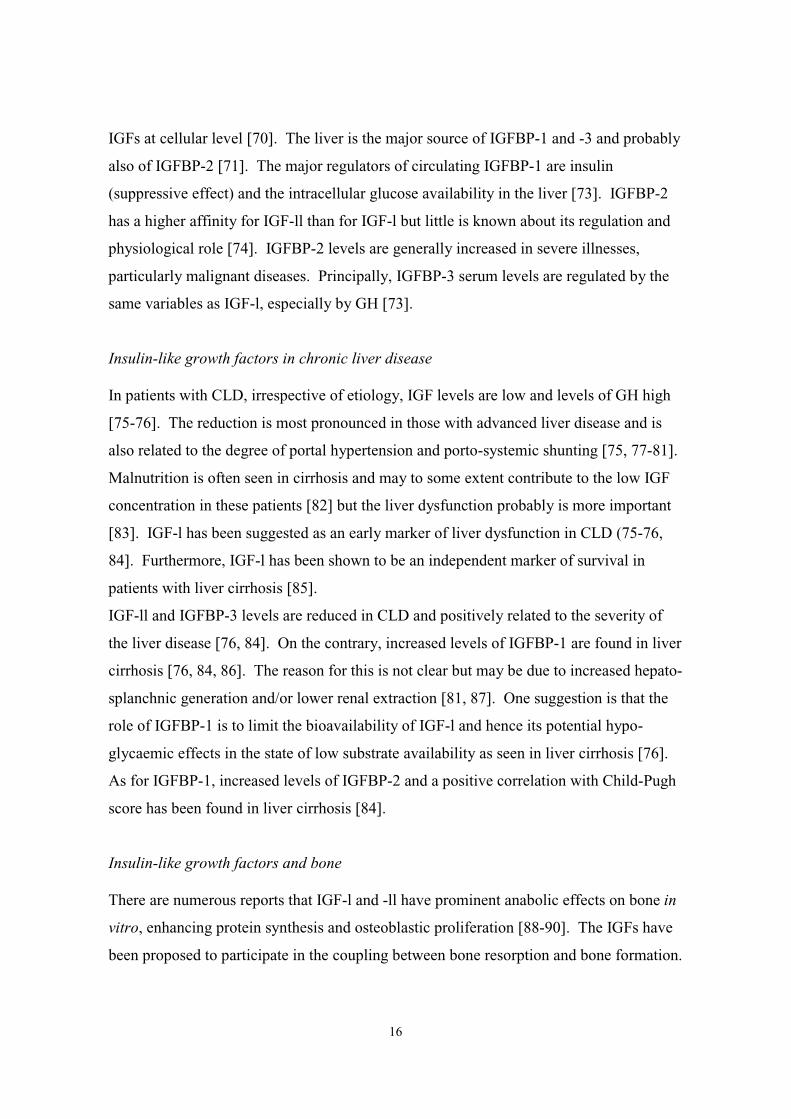
Insulin-like growth factors in chronic liver disease
In patients with CLD, irrespective of etiology, IGF levels are low and levels of GH high
[75-76]. The reduction is most pronounced in those with advanced liver disease and is
also related to the degree of portal hypertension and porto-systemic shunting [75, 77-81].
Malnutrition is often seen in cirrhosis and may to some extent contribute to the low IGF
concentration in these patients [82] but the liver dysfunction probably is more important
[83]. IGF-l has been suggested as an early marker of liver dysfunction in CLD (75-76,
84]. Furthermore, IGF-l has been shown to be an independent marker of survival in
patients with liver cirrhosis [85].
IGF-ll and IGFBP-3 levels are reduced in CLD and positively related to the severity of
the liver disease [76, 84]. On the contrary, increased levels of IGFBP-1 are found in liver
cirrhosis [76, 84, 86]. The reason for this is not clear but may be due to increased hepato-
splanchnic generation and/or lower renal extraction [81, 87]. One suggestion is that the
role of IGFBP-1 is to limit the bioavailability of IGF-l and hence its potential hypo-
glycaemic effects in the state of low substrate availability as seen in liver cirrhosis [76].
As for IGFBP-1, increased levels of IGFBP-2 and a positive correlation with Child-Pugh
score has been found in liver cirrhosis [84].
Insulin-like growth factors and bone
There are numerous reports that IGF-l and -ll have prominent anabolic effects on bone in
vitro, enhancing protein synthesis and osteoblastic proliferation [88-90]. The IGFs have
been proposed to participate in the coupling between bone resorption and bone formation.
17
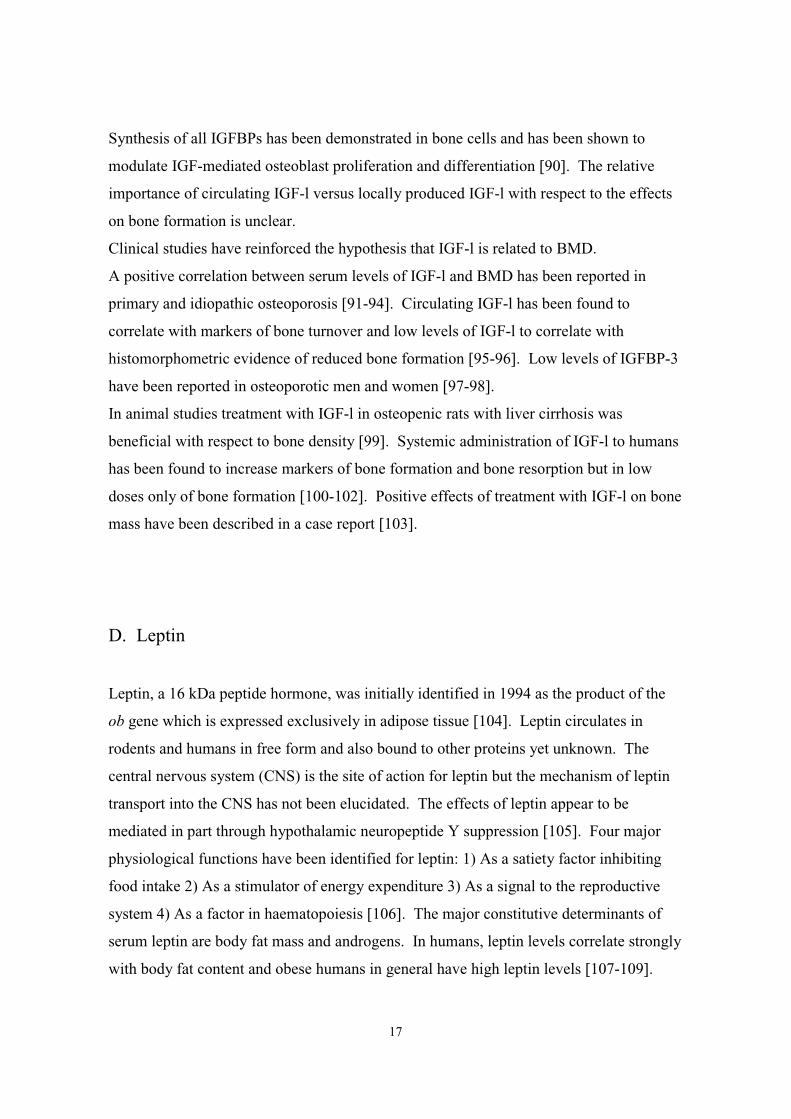
Synthesis of all IGFBPs has been demonstrated in bone cells and has been shown to
modulate IGF-mediated osteoblast proliferation and differentiation [90]. The relative
importance of circulating IGF-l versus locally produced IGF-l with respect to the effects
on bone formation is unclear.
Clinical studies have reinforced the hypothesis that IGF-l is related to BMD.
A positive correlation between serum levels of IGF-l and BMD has been reported in
primary and idiopathic osteoporosis [91-94]. Circulating IGF-l has been found to
correlate with markers of bone turnover and low levels of IGF-l to correlate with
histomorphometric evidence of reduced bone formation [95-96]. Low levels of IGFBP-3
have been reported in osteoporotic men and women [97-98].
In animal studies treatment with IGF-l in osteopenic rats with liver cirrhosis was
beneficial with respect to bone density [99]. Systemic administration of IGF-l to humans
has been found to increase markers of bone formation and bone resorption but in low
doses only of bone formation [100-102]. Positive effects of treatment with IGF-l on bone
mass have been described in a case report [103].
D. Leptin
Leptin, a 16 kDa peptide hormone, was initially identified in 1994 as the product of the
ob gene which is expressed exclusively in adipose tissue [104]. Leptin circulates in
rodents and humans in free form and also bound to other proteins yet unknown. The
central nervous system (CNS) is the site of action for leptin but the mechanism of leptin
transport into the CNS has not been elucidated. The effects of leptin appear to be
mediated in part through hypothalamic neuropeptide Y suppression [105]. Four major
physiological functions have been identified for leptin: 1) As a satiety factor inhibiting
food intake 2) As a stimulator of energy expenditure 3) As a signal to the reproductive
system 4) As a factor in haematopoiesis [106]. The major constitutive determinants of
serum leptin are body fat mass and androgens. In humans, leptin levels correlate strongly
with body fat content and obese humans in general have high leptin levels [107-109].
18
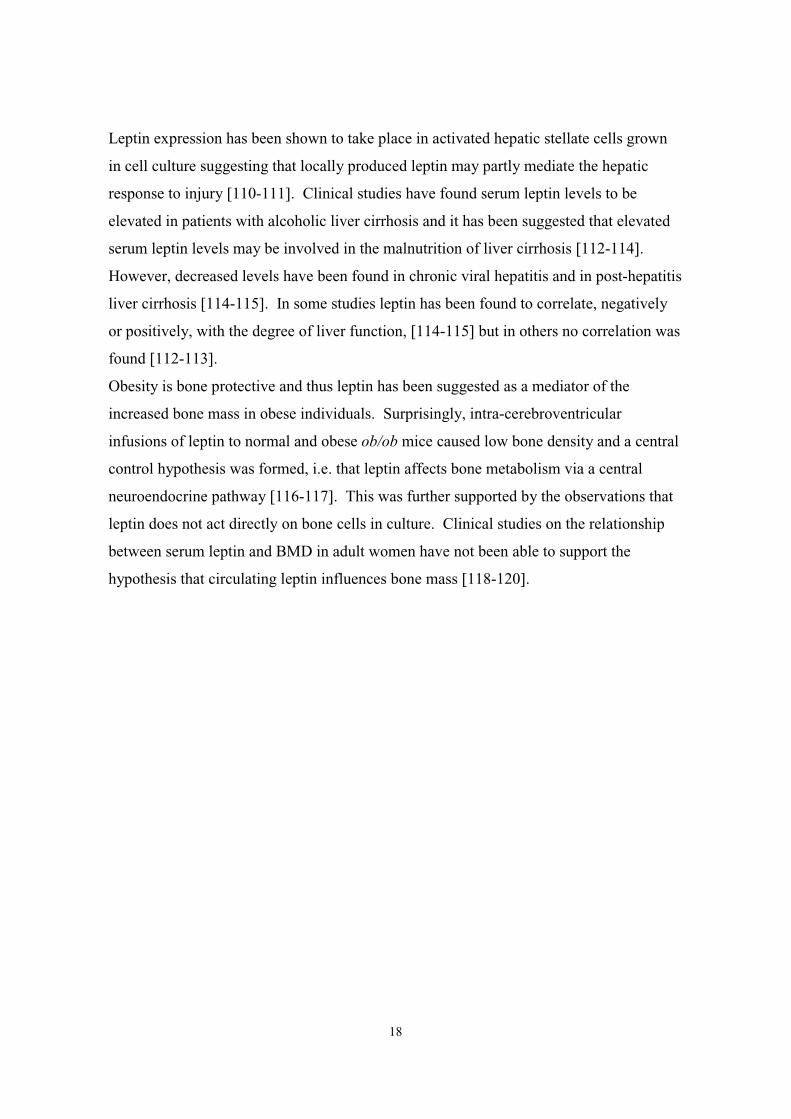
Leptin expression has been shown to take place in activated hepatic stellate cells grown
in cell culture suggesting that locally produced leptin may partly mediate the hepatic
response to injury [110-111]. Clinical studies have found serum leptin levels to be
elevated in patients with alcoholic liver cirrhosis and it has been suggested that elevated
serum leptin levels may be involved in the malnutrition of liver cirrhosis [112-114].
However, decreased levels have been found in chronic viral hepatitis and in post-hepatitis
liver cirrhosis [114-115]. In some studies leptin has been found to correlate, negatively
or positively, with the degree of liver function, [114-115] but in others no correlation was
found [112-113].
Obesity is bone protective and thus leptin has been suggested as a mediator of the
increased bone mass in obese individuals. Surprisingly, intra-cerebroventricular
infusions of leptin to normal and obese ob/ob mice caused low bone density and a central
control hypothesis was formed, i.e. that leptin affects bone metabolism via a central
neuroendocrine pathway [116-117]. This was further supported by the observations that
leptin does not act directly on bone cells in culture. Clinical studies on the relationship
between serum leptin and BMD in adult women have not been able to support the
hypothesis that circulating leptin influences bone mass [118-120].
19
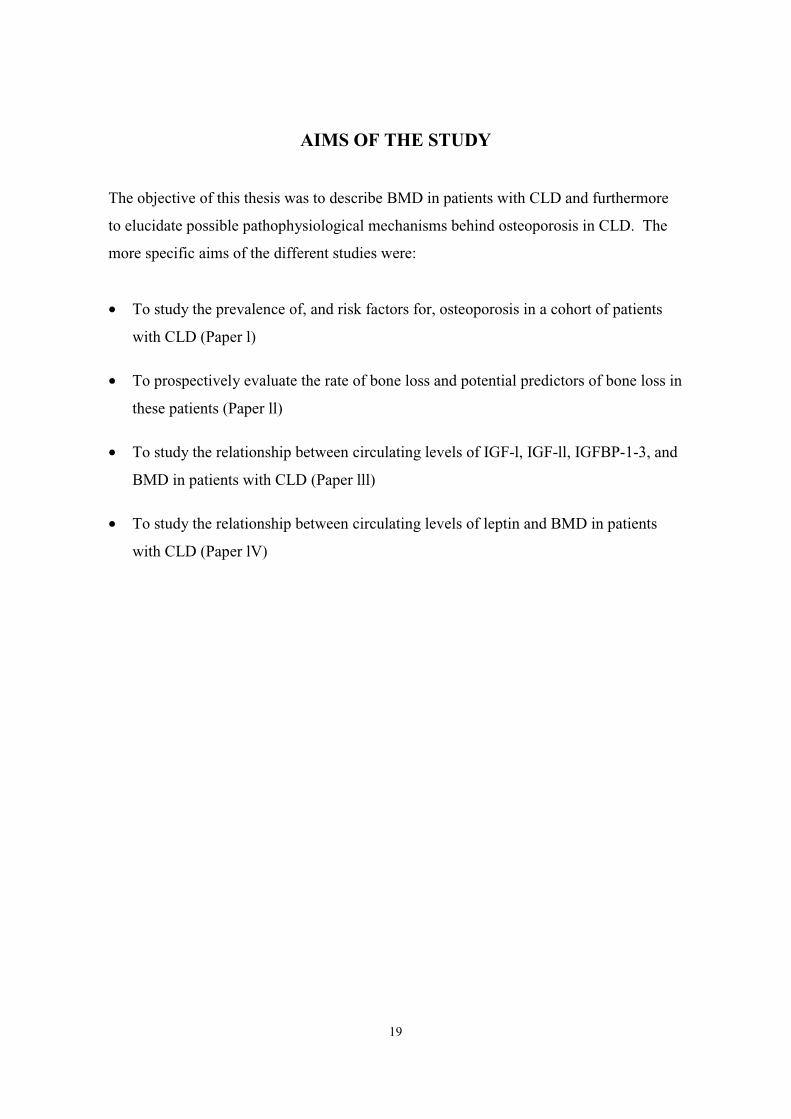
AIMS OF THE STUDY
The objective of this thesis was to describe BMD in patients with CLD and furthermore
to elucidate possible pathophysiological mechanisms behind osteoporosis in CLD. The
more specific aims of the different studies were:
• To study the prevalence of, and risk factors for, osteoporosis in a cohort of patients
with CLD (Paper l)
• To prospectively evaluate the rate of bone loss and potential predictors of bone loss in
these patients (Paper ll)
• To study the relationship between circulating levels of IGF-l, IGF-ll, IGFBP-1-3, and
BMD in patients with CLD (Paper lll)
• To study the relationship between circulating levels of leptin and BMD in patients
with CLD (Paper lV)
20
SUBJECTS
In Paper l, 78 patients with CLD hospitalised at the Department of Internal Medicine,
University Hospital, Uppsala, were recruited non-consecutively between September 1994
and April 1996. It was not possible to conduct bone densitometry in 6 of the patients (3
refused, 2 were too obese and 1 died before the densitometry was performed) leaving a
total of 72 patients for evaluation.
One man and 1 women for each year of birth between 1910 and 1970 were randomly
selected from the population register in Uppsala county, (total population of 290.000), to
serve as controls with respect to BMD (n=122) [121]. From this group, age- and gender-
matching was possible for 67 of the 72 patients.
Information about menopausal status and medication was derived from a questionnaire
used for patients and controls as well as from medical records. In those patients for
whom information from the questionnaire was lacking or uncertain, the menopausal
status was determined by measurements of serum follicle stimulating hormone (FSH) and
estradiol.
Seventy six percent of the female patients and 58% of the control females were post-
menopausal. Five of 23 male patients (22%) were classified as hypogonadic based on the
presence of subnormal serum testosterone levels.
Treatment with corticosteroids was defined as the use of corticosteroids for more than 6
weeks during some period of the patient´s life. The individual cumulative dose of
corticosteroids, standardised as milligrams of prednisolone, was expressed as the product
of the average maintenance dose per day multiplied by the number of treatment years.
Some individuals in the patient group were on current treatment with vitamin D + Ca
supplementation (n=3), Ca supplementation only (n=2), estrogen replacement therapy
(ERT) (n=3) or bisphosphonates (n=1), whereas none in the control group received any
of the afore-mentioned drugs aside from ERT (n=5).
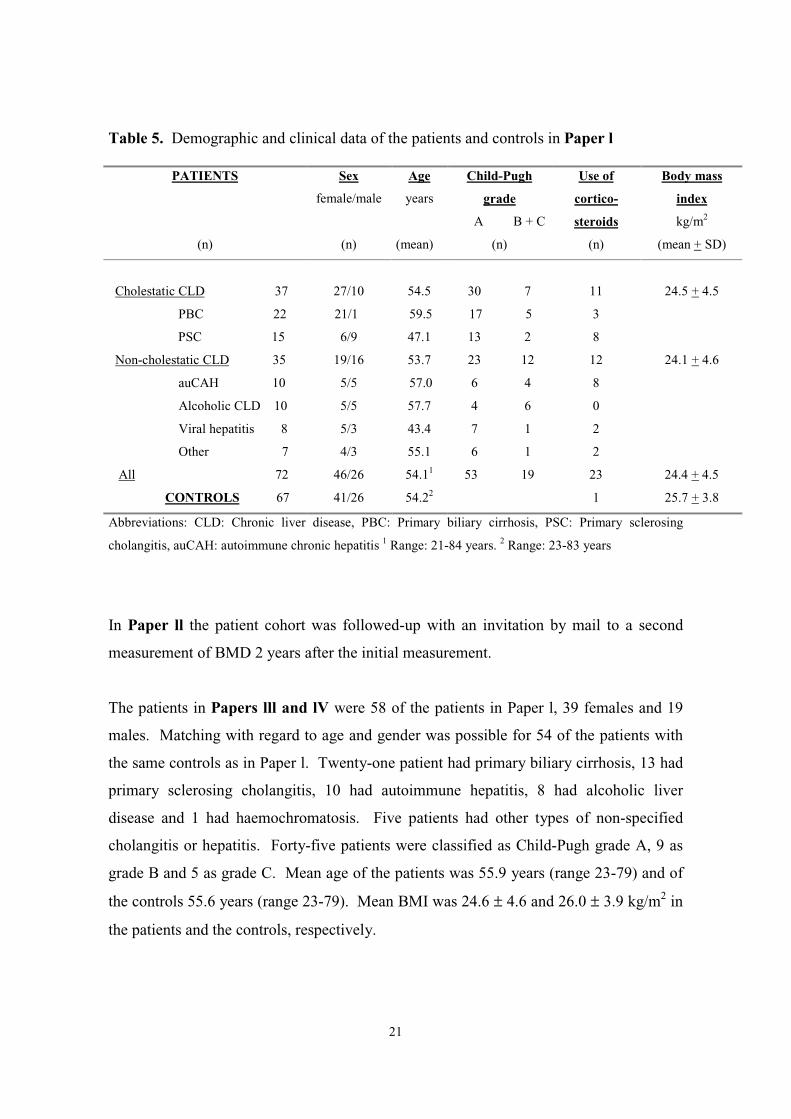
Demographic and clinical data of the patients and controls are shown in Table 5.
21
Table 5. Demographic and clinical data of the patients and controls in Paper l
PATIENTS
(n)
Sex
female/male
(n)
Age
years
(mean)
Child-Pugh
grade
A B + C
(n)
Use of
cortico-
steroids
(n)
Body mass
index
kg/m2
(mean + SD)
Cholestatic CLD 37
PBC 22
PSC 15
27/10
21/1
6/9
54.5
59.5
47.1
30 7
17 5
13 2
11
3
8
24.5 + 4.5
Non-cholestatic CLD 35
auCAH 10
Alcoholic CLD 10
Viral hepatitis 8
Other 7
19/16
5/5
5/5
5/3
4/3
53.7
57.0
57.7
43.4
55.1
23 12
6 4
4 6
7 1
6 1
12
8
0
2
2
24.1 + 4.6
All 72 46/26 54.11 53 19 23 24.4 + 4.5
CONTROLS 67 41/26 54.22 1 25.7 + 3.8
Abbreviations: CLD: Chronic liver disease, PBC: Primary biliary cirrhosis, PSC: Primary sclerosing
cholangitis, auCAH: autoimmune chronic hepatitis 1 Range: 21-84 years. 2 Range: 23-83 years
In Paper ll the patient cohort was followed-up with an invitation by mail to a second
measurement of BMD 2 years after the initial measurement.
The patients in Papers lll and lV were 58 of the patients in Paper l, 39 females and 19
males. Matching with regard to age and gender was possible for 54 of the patients with
the same controls as in Paper l. Twenty-one patient had primary biliary cirrhosis, 13 had
primary sclerosing cholangitis, 10 had autoimmune hepatitis, 8 had alcoholic liver
disease and 1 had haemochromatosis. Five patients had other types of non-specified
cholangitis or hepatitis. Forty-five patients were classified as Child-Pugh grade A, 9 as
grade B and 5 as grade C. Mean age of the patients was 55.9 years (range 23-79) and of
the controls 55.6 years (range 23-79). Mean BMI was 24.6 ± 4.6 and 26.0 ± 3.9 kg/m2 in
the patients and the controls, respectively.
22
METHODS
Definition of chronic liver disease
CLD was defined as liver disease with a duration of at least 6 months and with a
diagnosis based on biochemical, serological and histopathological investigations.
Patients with terminal liver disease and patients with only liver steatosis were excluded
from the study.
Body mass index
Body mass index (BMI; kg/m2) was determined by dividing body weight in kilograms by
the square of body height in meters. Reference ranges for BMI were set to 19-24 kg/m2
for women and 20-25 kg/m2 for men [122].
Measurements of bone mineral density
Bone mineral density (BMD; g/cm2) of the lumbar spine and the left proximal femur (if
unaffected by disease, otherwise the right proximal femur) was measured by dual energy
X-ray absorptiometry (DXA) with the use of a Lunar DPX-L™, Lunar Co, Madison, WI,
USA, at baseline (BMD1) and at follow-up (BMD2). The mean BMD value of the
second, third and fourth lumbar vertebrae (lumbar spine BMD) and of the femoral neck
of the proximal femur (femoral neck BMD) were used in the present analysis.
The long-term precision error (less than 1 %) for the DXA-equipment was evaluated by
the use of a spine phantom and expressed as the coefficient of variation.
BMD was expressed in absolute values or as Z-score. The WHO´s definition for
osteoporosis was applied to classify individuals as either osteoporotic or not.
Bone loss was expressed as annual change in BMD calculated as follows: ∆ BMD =
((BMD2-BMD1)/BMD1) x 100%/interval between measurements in years.
23
X-ray of the thoracic and lumbar spine
X-ray examinations of the thoracic and lumbar spine for the diagnosis of vertebral
compression were performed prospectively, in association with the BMD measurements
in 52 of the 72 patients in Paper l.
Biochemical tests
All blood samples were drawn after an overnight fast. Analyses of aspartate
aminotransferase (AST), alanine aminotransferase (ALT), alkaline phosphatase, bilirubin,
prothrombin time, albumin, Ca (corrected for serum albumin), ionised Ca, intact
parathyroid hormone (PTH), total testosterone, FSH, sex-hormone binding globulin
(SHBG) and estradiol were carried out as part of the clinical routine at the Department of
Clinical Chemistry, University Hospital, Uppsala.
Serum levels of 25-hydroxy vitamin D3 (25(OH) D3) and 1,25-dihydroxy vitamin D3
(1,25(OH)2 D3) were measured at MedScand Diagnostics AB, Malmö, Sweden, with a
method based on a high performance liquid chromatography for 25(OH) D3 (intra-and
interassay variation < 10%) and by a competitive radioreceptor assay (Incstar Corp,
Stillwater, Minnesota, USA) for 1,25(OH) 2 D3 (intra-and interassay variation< 10%).
IGF-l levels were measured by an IGFBP-blocked radioimmunoassay (RIA) in the
presence of an excess of IGF-ll as described previously [73]. Intra- and interassay
coefficients of variation were 3.1 and 7.3%, respectively. IGF-ll was measured in the
presence of excess IGF-l using a commercial RIA kit (Mediagnost, Tübingen, Germany).
IGFBP-1 and IGFBP-2 were determined by RIA as described previously [74, 123]. Intra-
and interassay coefficients of variation were 3.4 and 8.1% for IGFBP-1 and 3.7 and 9.6%
for IGFBP-2. IGFBP-3 levels were measured by RIA using a commercially available kit
(Diagnostic system Laboratories Inc., Webster, Texas, USA), with intra- and interassay
coefficients of variation 4.9 and 7.2%, respectively.
Leptin levels were measured by a sensitive RIA, detecting primarily total leptin levels as
described previously [108]. Adjustment of serum leptin for BMI and gender was
performed by calculation of standard deviation (SD) scores according to the equation
previously described [124].

24
Statistics
The StatView version 4.5 (Abacus Concepts, Berkeley, CA, USA) and the SAS software
(SAS Institute Inc., North Carolina, USA) were used for statistical calculations.
The comparative analyses between patients and controls were performed with the use of
Student’s paired t - test and Chi-square test with a Fishers exact test to adjust for small
numbers. The Mann-Whitney non-parametric test was used for comparison of unpaired
groups. Unmatched patients were excluded from all comparative analyses.
Simple regression analysis and Spearman correlation statistics were used for analysis of
correlations. For dichotomous outcomes, unconditional logistic regression analysis was
used. A logistic, stepwise multivariate analysis was used for the evaluation of risk factors
for osteoporosis and bone loss (Papers l and ll).
Multiple regression analysis was used to examine interactions between age, IGF-l levels
and BMD (Paper lll).
All results are given as mean values + SD if not otherwise stated. A p value < 0.05 was
considered statistically significant in all analyses.
ETHICS
The study was approved by the Ethics Committee of the Medical faculty at Uppsala
University in Uppsala. Patients and controls gave their informed consent to participation
in the study.
25
RESULTS
Prevalence and risk factors for osteoporosis in CLD (Paper l)
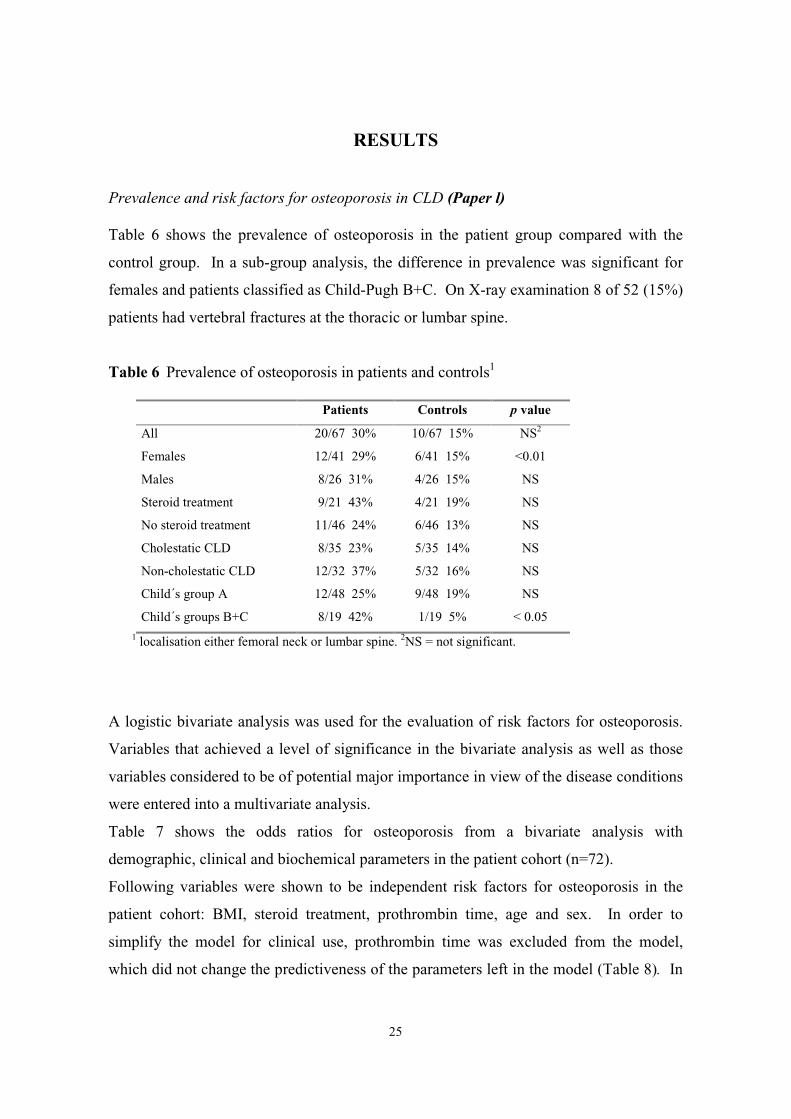
Table 6 shows the prevalence of osteoporosis in the patient group compared with the
control group. In a sub-group analysis, the difference in prevalence was significant for
females and patients classified as Child-Pugh B+C. On X-ray examination 8 of 52 (15%)
patients had vertebral fractures at the thoracic or lumbar spine.
Table 6 Prevalence of osteoporosis in patients and controls1
Patients Controls p value
All 20/67 30% 10/67 15% NS2
Females 12/41 29% 6/41 15% <0.01
Males 8/26 31% 4/26 15% NS
Steroid treatment 9/21 43% 4/21 19% NS
No steroid treatment 11/46 24% 6/46 13% NS
Cholestatic CLD 8/35 23% 5/35 14% NS
Non-cholestatic CLD 12/32 37% 5/32 16% NS
Child´s group A 12/48 25% 9/48 19% NS
Child´s groups B+C 8/19 42% 1/19 5% < 0.051 localisation either femoral neck or lumbar spine. 2NS = not significant.
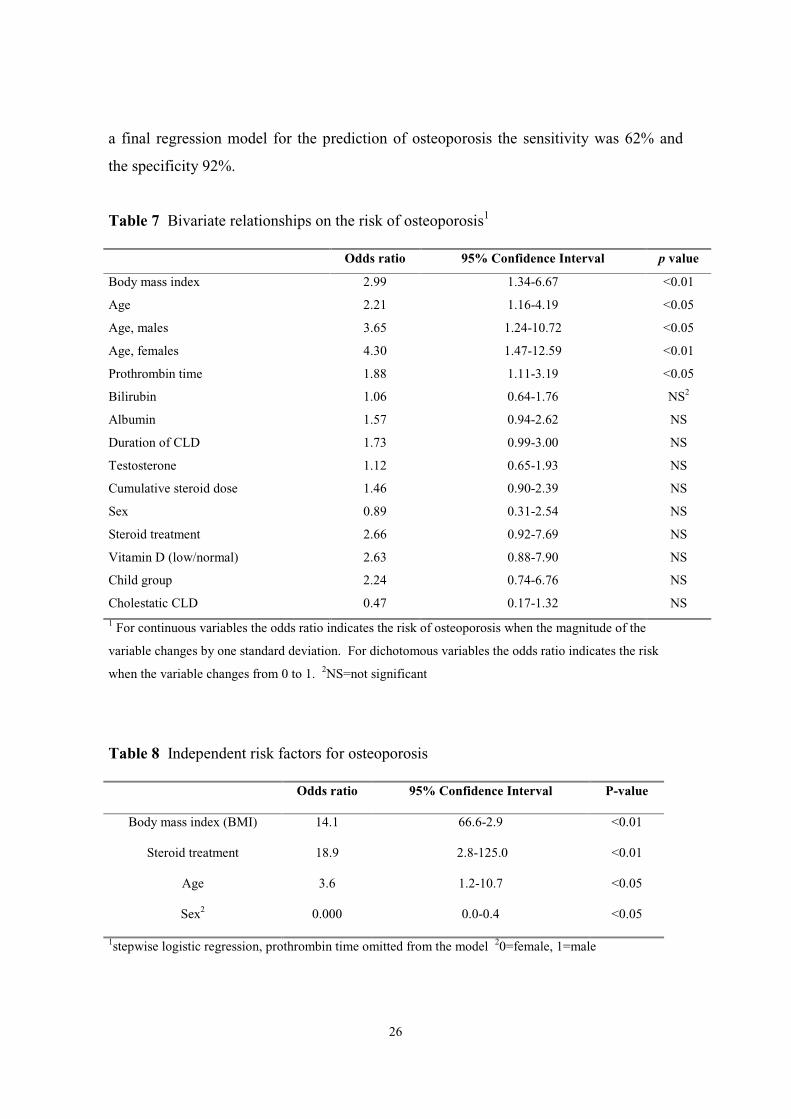
A logistic bivariate analysis was used for the evaluation of risk factors for osteoporosis.
Variables that achieved a level of significance in the bivariate analysis as well as those
variables considered to be of potential major importance in view of the disease conditions
were entered into a multivariate analysis.
Table 7 shows the odds ratios for osteoporosis from a bivariate analysis with
demographic, clinical and biochemical parameters in the patient cohort (n=72).
Following variables were shown to be independent risk factors for osteoporosis in the
patient cohort: BMI, steroid treatment, prothrombin time, age and sex. In order to
simplify the model for clinical use, prothrombin time was excluded from the model,
which did not change the predictiveness of the parameters left in the model (Table 8). In
26
a final regression model for the prediction of osteoporosis the sensitivity was 62% and
the specificity 92%.
Table 7 Bivariate relationships on the risk of osteoporosis1
Odds ratio 95% Confidence Interval p value
Body mass index 2.99 1.34-6.67 <0.01
Age 2.21 1.16-4.19 <0.05
Age, males 3.65 1.24-10.72 <0.05
Age, females 4.30 1.47-12.59 <0.01
Prothrombin time 1.88 1.11-3.19 <0.05
Bilirubin 1.06 0.64-1.76 NS2
Albumin 1.57 0.94-2.62 NS
Duration of CLD 1.73 0.99-3.00 NS
Testosterone 1.12 0.65-1.93 NS
Cumulative steroid dose 1.46 0.90-2.39 NS
Sex 0.89 0.31-2.54 NS
Steroid treatment 2.66 0.92-7.69 NS
Vitamin D (low/normal) 2.63 0.88-7.90 NS
Child group 2.24 0.74-6.76 NS
Cholestatic CLD 0.47 0.17-1.32 NS1 For continuous variables the odds ratio indicates the risk of osteoporosis when the magnitude of the
variable changes by one standard deviation. For dichotomous variables the odds ratio indicates the risk
when the variable changes from 0 to 1. 2NS=not significant
Table 8 Independent risk factors for osteoporosis
Odds ratio 95% Confidence Interval P-value
Body mass index (BMI) 14.1 66.6-2.9 <0.01
Steroid treatment 18.9 2.8-125.0 <0.01
Age 3.6 1.2-10.7 <0.05
Sex2 0.000 0.0-0.4 <0.05
1stepwise logistic regression, prothrombin time omitted from the model 20=female, 1=male
27
Vitamin D, calcium and PTH in patients with CLD (Paper l)
Serum 25(OH) D3 levels were subnormal in 8 of 64 patients (12%) (mean=36.8 + 18.7
ng/L; ref. 15-65 ng/L) and 1,25(OH)2 D3 levels were subnormal or undetectable in 19 of
66 patients (29%) (ref. 20-60 ng/L). Of those with subnormal 25(OH) D3 levels all
except two, also had subnormal 1,25(OH)2 D3 levels. A positive correlation was
demonstrated between the serum levels of albumin and 25(OH) D3 (r2=0.16; p=0.0009).
Serum Ca levels, adjusted for serum albumin and ionised Ca levels, were within the
normal range in all patients except 8 who had borderline increased levels (between 2.60-
2.70 mmol/L; ref. 2.20-2.60 mmol/L). None of these had increased PTH. Serum PTH
was outside the reference range in 6 patients (ref. 12-55 ng/L). Two had decreased
levels, 3 had borderline increased levels and 1 highly increased levels of PTH. This
patient had borderline reduced ionised serum Ca and vitamin D3 levels despite
supplementation with vitamin D and Ca.
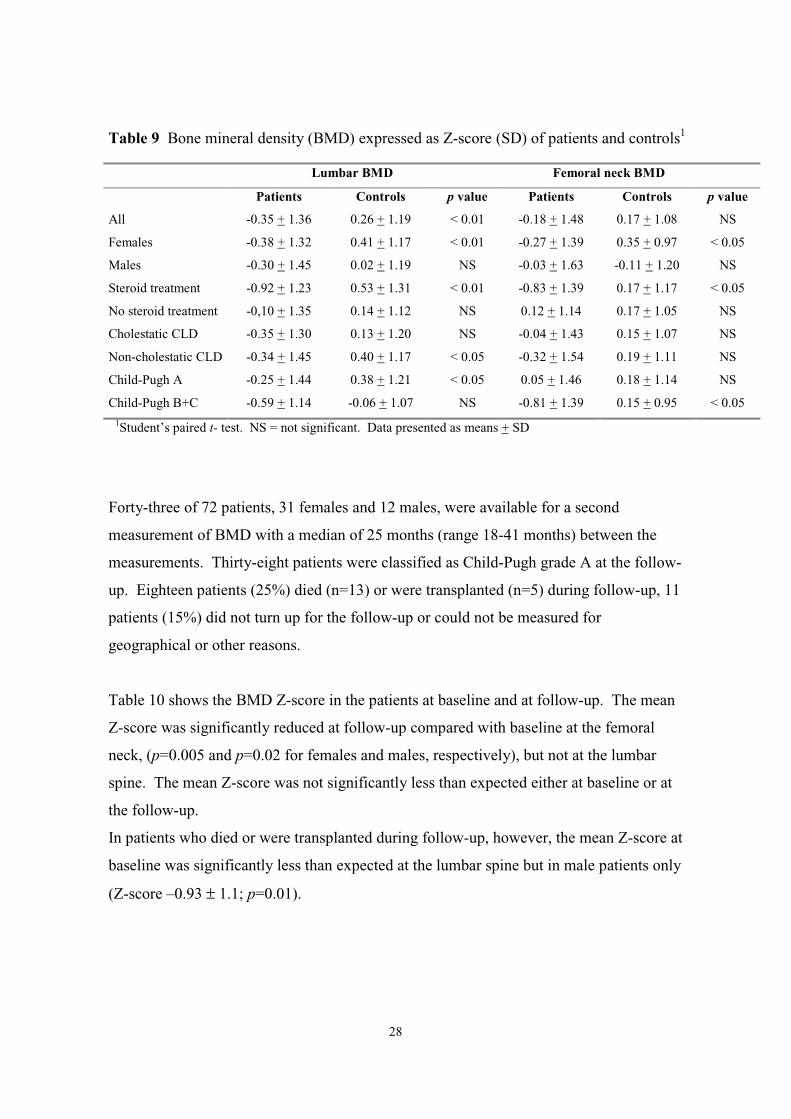
BMD and bone loss in patients with CLD (Papers l and ll)
The mean BMD expressed as Z-score was significantly reduced compared with the
controls at the lumbar spine but not at the femoral neck. A sub-group analysis found the
reduction to be most prominent in patients who had received treatment with
corticosteroids and in patients classified as Child-Pugh B+C. Mean lumbar spine and
femoral neck BMD were reduced to the same extent both in patients with cholestatic
CLD and with non-cholestatic liver disease.
The mean BMD at the lumbar spine and the femoral neck was reduced compared with the
controls in the two Child-Pugh classification groups (Child A and Child B+C). The
difference was statistically significant for the Child-Pugh A group of patients at the
lumbar spine and for the Child-Pugh B+C group at the femoral neck, (Table 9).
28
Table 9 Bone mineral density (BMD) expressed as Z-score (SD) of patients and controls1
Lumbar BMD Femoral neck BMD
Patients Controls p value Patients Controls p value
All -0.35 + 1.36 0.26 + 1.19 < 0.01 -0.18 + 1.48 0.17 + 1.08 NS
Females -0.38 + 1.32 0.41 + 1.17 < 0.01 -0.27 + 1.39 0.35 + 0.97 < 0.05
Males -0.30 + 1.45 0.02 + 1.19 NS -0.03 + 1.63 -0.11 + 1.20 NS
Steroid treatment -0.92 + 1.23 0.53 + 1.31 < 0.01 -0.83 + 1.39 0.17 + 1.17 < 0.05
No steroid treatment -0,10 + 1.35 0.14 + 1.12 NS 0.12 + 1.14 0.17 + 1.05 NS
Cholestatic CLD -0.35 + 1.30 0.13 + 1.20 NS -0.04 + 1.43 0.15 + 1.07 NS
Non-cholestatic CLD -0.34 + 1.45 0.40 + 1.17 < 0.05 -0.32 + 1.54 0.19 + 1.11 NS
Child-Pugh A -0.25 + 1.44 0.38 + 1.21 < 0.05 0.05 + 1.46 0.18 + 1.14 NS
Child-Pugh B+C -0.59 + 1.14 -0.06 + 1.07 NS -0.81 + 1.39 0.15 + 0.95 < 0.051Student’s paired t- test. NS = not significant. Data presented as means + SD
Forty-three of 72 patients, 31 females and 12 males, were available for a second
measurement of BMD with a median of 25 months (range 18-41 months) between the
measurements. Thirty-eight patients were classified as Child-Pugh grade A at the follow-
up. Eighteen patients (25%) died (n=13) or were transplanted (n=5) during follow-up, 11
patients (15%) did not turn up for the follow-up or could not be measured for
geographical or other reasons.
Table 10 shows the BMD Z-score in the patients at baseline and at follow-up. The mean
Z-score was significantly reduced at follow-up compared with baseline at the femoral
neck, (p=0.005 and p=0.02 for females and males, respectively), but not at the lumbar
spine. The mean Z-score was not significantly less than expected either at baseline or at
the follow-up.
In patients who died or were transplanted during follow-up, however, the mean Z-score at
baseline was significantly less than expected at the lumbar spine but in male patients only
(Z-score –0.93 ± 1.1; p=0.01).
29
Table 10 Bone mineral density expressed as Z-score (SD) at the lumbar spine (LS) and
at the femoral neck (FN) at baseline and at follow-up (n=38)1.
Baseline Follow-up
Z-score LS All
females
males
0.01 ± 1.4
-0.19 ± 1.3
0.67 ± 1.4
0.00 ± 1.4
-0.22 ± 1.4
0.53 ± 1.2
Z-score FN All
females
males
0.28 ± 1.1
0.22 ± 1.1
0.41 ± 1.1
-0.07 ± 1.02
-0.13 ± 1.02
0.07 ± 1.32
1Patients treated with oestrogen replacement therapy and/or bisphosphonates are excluded from the table. 2
p<0.01 when compared with baseline Z-score. Data presented as means ± SD.
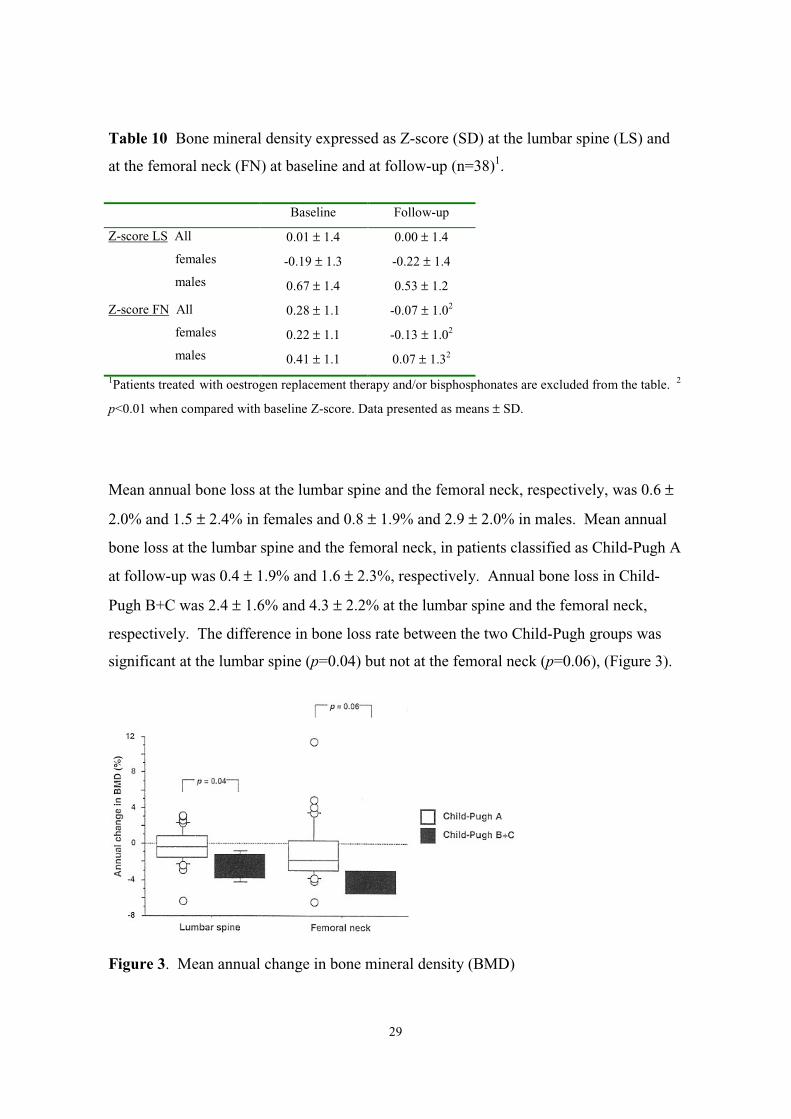
Mean annual bone loss at the lumbar spine and the femoral neck, respectively, was 0.6 ±
2.0% and 1.5 ± 2.4% in females and 0.8 ± 1.9% and 2.9 ± 2.0% in males. Mean annual
bone loss at the lumbar spine and the femoral neck, in patients classified as Child-Pugh A
at follow-up was 0.4 ± 1.9% and 1.6 ± 2.3%, respectively. Annual bone loss in Child-
Pugh B+C was 2.4 ± 1.6% and 4.3 ± 2.2% at the lumbar spine and the femoral neck,
respectively. The difference in bone loss rate between the two Child-Pugh groups was
significant at the lumbar spine (p=0.04) but not at the femoral neck (p=0.06), (Figure 3).
Figure 3. Mean annual change in bone mineral density (BMD)
30
Predictors of bone loss (Paper ll)
Out of 18 baseline variables, (age, gender, BMI, bilirubin, alkaline phosphatase, AST,
ALT, albumin, prothrombin time, testosterone, estradiol, SHBG, 25(OH) D3, 1,25(OH)2
D3, menopausal status, treatment with corticosteroids, femoral neck BMD and lumbar
spine BMD), prothrombin time, testosterone, 25(OH) D3 and bilirubin correlated with the
rate of bone loss at the femoral neck in the correlation analysis and were entered into the
stepwise multiple regression analysis. Serum bilirubin correlated independently and
positively (r2=0.27;p=0.003) and 25(OH) D3 negatively (r2=0.11;p=0.03) with the rate of
bone loss at the femoral neck. No variable correlated with the rate of bone loss at the
lumbar spine.
IGF-l, IGF-ll and IGFBP-1-3 in CLD (Paper lll)
Serum levels of IGF-l, IGF-ll and IGFBP-3 were significantly lower and IGFBP-1 and
IGFBP-2 levels higher in the patient group than in the control group (Table 11).
There was no significant correlation between the growth factors and BMI in either
patients or controls.
Table 11. Serum levels of insulin-like growth factors (IGF;ng/mL) and the IGF-binding
proteins (IGFBP;ng/mL) in patients and controls.
Patients
(n=54)
Controls
(n=54)
p value
IGF-l 54 ± 31 153 ± 55 < 0.0001
IGF-ll 388 ± 180 827 ± 137 < 0.0001
IGFBP-1 51 ± 23 36 ± 14 < 0.0001
IGFBP-2 664 ± 318 287 ± 188 < 0.0001
IGFBP-3 1945 ± 999 3003 ± 577 < 0.0001
Data presented as means ± SD.
IGF-l, IGF-ll, IGFBP-1 and IGFBP-3 all correlated with parameters of liver function
while IGFBP-2 did not correlate with any of the liver function parameters.
31
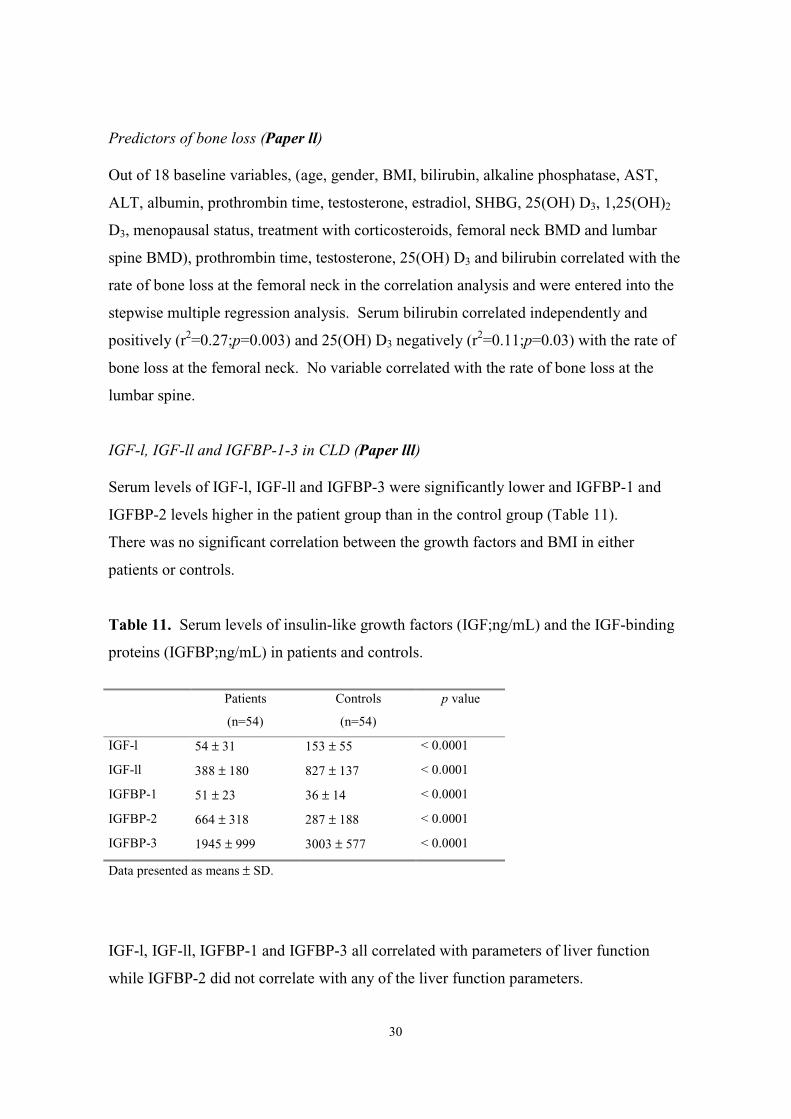
Patients classified as Child-Pugh B + C had significantly lower IGF-l (p<0.0001), IGF-ll
(p<0.0001) and IGFBP-3 levels (p<0.001) and higher IGFBP-1 levels (p<0.05) than
patients classified as Child-Pugh A (Figure 4).
Figure 4. Serum levels of insulin-like growth factors (IGF-l and-ll) and insulin-like
growth factor binding proteins (IGFBP-1 and-3) versus Child-Pugh grade.
Relationship between the growth factors and BMD in CLD (Paper lll)
No significant, independent correlation was found between age-adjusted IGF-l and BMD
in either patients or controls.
There were no correlations between IGF-ll or any of the binding proteins and BMD in
either patients or controls.
Patients classified as Child-Pugh A and B+C respectively did not differ with respect to
the relationship between the growth factors and BMD.
Excluding individuals from the analyses due to bone protective medication (6 patients
and 4 controls), and/or corticosteroid treatment, did not change the results.
32
Serum leptin in CLD (Paper lV)
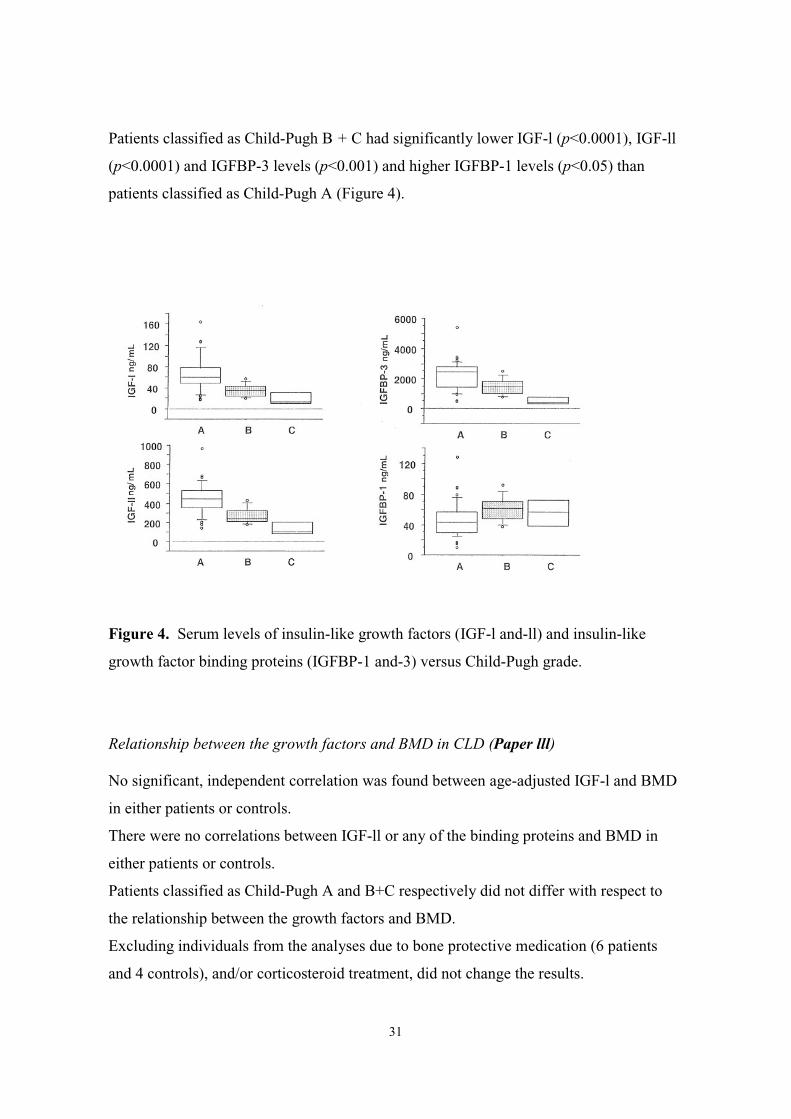
Serum leptin levels correlated with BMI in the patients and in controls (Figure 5). Serum
leptin and serum leptin adjusted for BMI did not differ significantly between patients and
controls (Table 12).
Patients Controls
Figure 5. Relationship between serum leptin and body mass index (BMI)
Table 12. Serum leptin and serum leptin adjusted for body mass index (BMI)1 in the
patients and controls 2
Patients Controls p value
Serum leptin (ng/mL)
All 10.4 ± 11.3 15.2 ± 17.9 0.1
Females 13.2 ± 12.8 20.7 ± 19.9 0.09
Males 5.1 ± 4.0 4.4 ± 2.4 0.6
Leptin adjusted for BMI (SD)
Females -0.41 ± 1.67 0.16 ± 1.15 0.1
Males -0.06 ± 1.93 -0.04 ± 1.11 1.0
1 Reference 124
Patients classified as Child-Pugh A did not differ with regard to serum leptin from
patients classified as Child-Pugh B+C (11.9 ±13.3 vs 9.2 ± 6.7 ng/mL; NS). Leptin
33
adjusted for BMI in male patients classified as Child-Pugh A, however, was significantly
lower when compared with males classified as Child-Pugh B+C (-0.34 ±1.84 vs 1.51 ±
0.98 SD; p=0.04). In female patients serum leptin levels adjusted for BMI were -0.44
±1.51 vs -0.02 ±1.94 SD (NS) in patients classified as Child-Pugh A and Child-Pugh
B+C, respectively. In the male patients only, serum leptin adjusted for BMI correlated
significantly with AST (r=0.53;p=0.03) but not with other parameters of liver function.
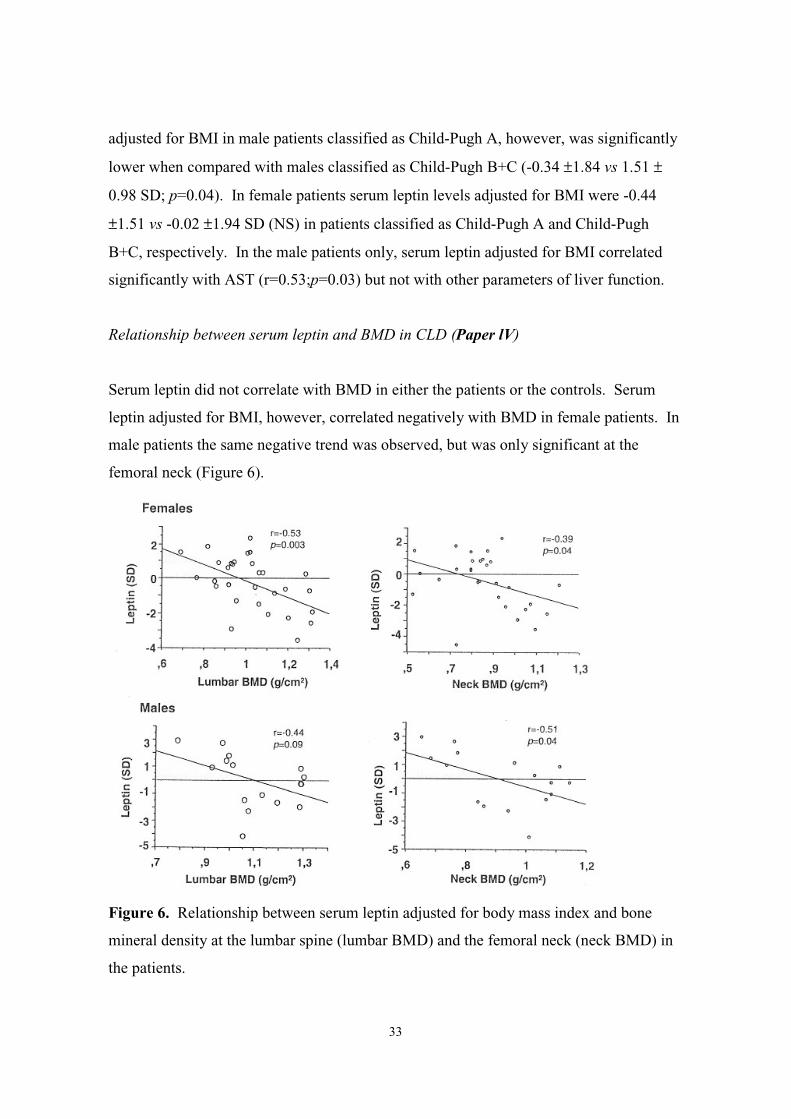
Relationship between serum leptin and BMD in CLD (Paper lV)
Serum leptin did not correlate with BMD in either the patients or the controls. Serum
leptin adjusted for BMI, however, correlated negatively with BMD in female patients. In
male patients the same negative trend was observed, but was only significant at the
femoral neck (Figure 6).
Figure 6. Relationship between serum leptin adjusted for body mass index and bone
mineral density at the lumbar spine (lumbar BMD) and the femoral neck (neck BMD) in
the patients.
34
In a sub-group analysis the relationship was only significant in patients classified as
Child B+C (r=-0.8;p=0.03 and r=-0.96;p=0.01 at the lumbar spine and r=-0.96;p=0.002
and r=-0.85;p=0.07 at the femoral neck in females and males, respectively). In the
control group there was no correlation between serum leptin adjusted for BMI and BMD
in either females or males.
Summary of the results (Papers l-lV)
• The prevalence of osteoporosis in our cohort of patients with CLD was twice that of a
normal population and the reduction in BMD was most pronounced at the lumbar
spine. In addition to age and female gender, low BMI, corticosteroid treatment, and
advanced liver disease, were independent risk factors for osteoporosis in these
patients.
• The patients had an increased rate of bone loss at the femoral neck, but not at the
lumbar spine, that was predicted by hyperbilirubinaemia and low vitamin D levels.
• The patients had low levels of IGF-l, IGF-ll and IGFBP-3 that correlated with liver
function. No relationship was found between low levels of growth factors and BMD.
• An inverse relationship between serum leptin and BMD was found.
35
DISCUSSION
Osteoporosis is a common condition and the highest incidence rates for osteoporotic
fractures are found in northern Europe. The prevalence of osteoporosis is highly
dependent upon age and gender. Thus, in order to evaluate whether metabolic bone
disease is more common in CLD than in the population it is necessary to compare the
patient cohort with an age- and gender- matched population. By doing this, we found
lower overall BMD in a cohort of patients with CLD when compared with the controls.
This reduction was statistically significant at the lumbar spine, which is in accordance
with previous reports on metabolic bone disease in CLD affecting mainly trabecular bone
[43, 46, 54]. The prevalence of osteoporosis in the cohort was 30%, or twice that in the
control group. This difference, however, was not significant possibly due to type ll error.
The size of our patient cohort was limited by several factors. The prevalence of CLD is
low in Scandinavia and our patient cohort was not a randomised sample from the
population. These limitations, however, can also be found in previously published
studies. The reported prevalence figures for osteoporosis in patients with CLD range
from 9 to 53% [23, 25-26, 52-54]. These differences in reported prevalence can probably
be explained by different patient selection factors, different techniques of bone mass
measurement and definition of osteoporosis.
We found a high prevalence rate, 42%, in patients classified as Child-Pugh B and C
compared with 25% in the Child-Pugh A group and increased prothrombin time (as a
marker of liver function) was an independent risk factor for osteoporosis. This is
supported by other studies that have found the highest prevalence of metabolic bone
disease in patients with advanced liver disease (25, 31, 41, 46, 54) whereas in earlier
stages of liver disease no evidence of bone disease has been found [41, 125].
Apart from belonging to Child-Pugh B+C, patients with steroid treatment had the most
pronounced reduction in BMD and 43% of these patients had osteoporosis. Furthermore,
in the multiple regression analysis, we found treatment with corticosteroids to be an
independent risk factor for osteoporosis. It is well known that treatment with
corticosteroids give rise to secondary osteoporosis predominantly at trabecular sites
36
positively correlated with the duration of treatment and the cumulative dose [44, 126-
127]. Treatment with corticosteroids in patients with CLD was in some reports
associated with decreased BMD [22, 26, 61, 128-129] in others not [25, 53, 62-63]. In
one of the studies, with no relationship between bone disease and treatment with
corticosteroids, the prevalence of metabolic bone disease, however, was very low, 9%,
which may have influenced the results [53].
Low BMI is a known risk factor for osteoporosis and increased rate of bone loss in the
normal population [130-135]. Our findings of decreased BMI as an independent risk
factor for osteoporosis in CLD has not been reported previously. In one previous study,
however, BMD correlated with urinary clearance of creatinine as an indirect measure of
muscle mass [23]. Malnutrition is common in CLD but the reported figures range from
15 to 100% in pre-transplant patients [136-139]. Reasons for low BMI in patients with
CLD are probably multi-factorial including malnutrition resulting from malabsorption
and anorexia, decreased physical activity and increased resting metabolic rate associated
with progression of the liver disease. Only 8 patients in our cohort were underweight
(data not shown) but by using only BMI as a measure of nutrition, we probably
underestimated the frequency of malnutrition. BMI is frequently used when evaluating
nutritional status in patients with CLD, but somewhat imprecise as it is influenced e.g. by
fluid retention in these patients.
It is unknown whether patients with CLD have an increased rate of bone loss and which
potential risk factors for increased rate of bone loss may be present. Since very little
longitudinal data exists we went ahead with a follow-up study of our patient cohort. Of
72 patients, 43 were available for a second measurement of BMD, mainly patients with
well preserved liver function. In these patients we found that the rate of bone loss was
increased at the femoral neck with a significant reduction in Z-score from baseline values
compared with the Z-score at follow-up. We did not include a follow-up of the controls,
but comparing our results with the published rate of annual bone loss in the normal
Swedish, and non-Swedish, population the rate of 2.9% at the femoral neck in the male
patients was 2-10 fold higher than expected [6-7, 140]. The rate of bone loss of 0.8% at
the lumbar spine was somewhat higher than expected. In the female patients the rate of
bone loss of 0.6% at the lumbar spine was not increased but a rate of 1.5% at the femoral
37
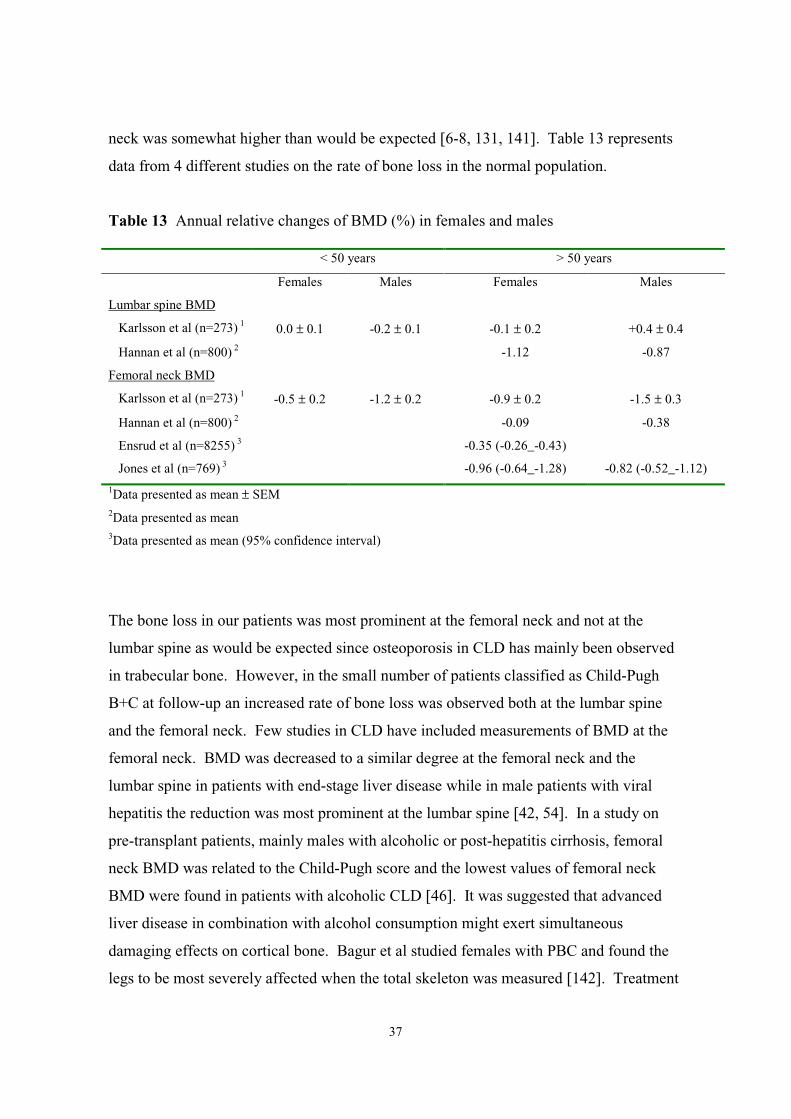
neck was somewhat higher than would be expected [6-8, 131, 141]. Table 13 represents
data from 4 different studies on the rate of bone loss in the normal population.
Table 13 Annual relative changes of BMD (%) in females and males
< 50 years > 50 years
Females Males Females Males
Lumbar spine BMD
Karlsson et al (n=273) 1 0.0 ± 0.1 -0.2 ± 0.1 -0.1 ± 0.2 +0.4 ± 0.4
Hannan et al (n=800) 2 -1.12 -0.87
Femoral neck BMD
Karlsson et al (n=273) 1 -0.5 ± 0.2 -1.2 ± 0.2 -0.9 ± 0.2 -1.5 ± 0.3
Hannan et al (n=800) 2 -0.09 -0.38
Ensrud et al (n=8255) 3 -0.35 (-0.26_-0.43)
Jones et al (n=769) 3 -0.96 (-0.64_-1.28) -0.82 (-0.52_-1.12)
1Data presented as mean ± SEM2Data presented as mean3Data presented as mean (95% confidence interval)
The bone loss in our patients was most prominent at the femoral neck and not at the
lumbar spine as would be expected since osteoporosis in CLD has mainly been observed
in trabecular bone. However, in the small number of patients classified as Child-Pugh
B+C at follow-up an increased rate of bone loss was observed both at the lumbar spine
and the femoral neck. Few studies in CLD have included measurements of BMD at the
femoral neck. BMD was decreased to a similar degree at the femoral neck and the
lumbar spine in patients with end-stage liver disease while in male patients with viral
hepatitis the reduction was most prominent at the lumbar spine [42, 54]. In a study on
pre-transplant patients, mainly males with alcoholic or post-hepatitis cirrhosis, femoral
neck BMD was related to the Child-Pugh score and the lowest values of femoral neck
BMD were found in patients with alcoholic CLD [46]. It was suggested that advanced
liver disease in combination with alcohol consumption might exert simultaneous
damaging effects on cortical bone. Bagur et al studied females with PBC and found the
legs to be most severely affected when the total skeleton was measured [142]. Treatment
38
studies with corticosteroids in females with PBC have reported an increased rate of bone
loss at both the femur and the lumbar spine [128-129]. Histomorphometric studies on
patients with auCAH treated with corticosteroids found that not only trabecular but also
cortical bone was affected [44]. No longitudinal study on the rate of bone loss at the
femoral neck in male patients with CLD has been published previously but in post-
transplant patients the rate of bone loss at the femoral neck in males was three-fold the
rate in female patients [55]. Thus, there is some evidence that in CLD even cortical bone
may be affected and most prominent in male patients and in advanced liver disease. It is
possible that changes at the lumbar spine dominate early in the disease process because of
the greater surface area available, but as trabeculae get thinner, the trabecular surface area
decreases with slowing of the rates of bone loss at the spine. Compression fractures, the
clinical end-point of osteoporosis, can be misinterpreted as an improvement in bone
density when evaluated with bone densitometry only. Since we did not include an X-ray
of the lumbar spine (in order to detect new compression fractures) at the follow-up it is
possible that some values of lumbar spine BMD were falsely high resulting in a false low
rate of bone loss. Other potential biases that could result in false high BMD values at the
lumbar spine are aortic calcifications and osteoarthritis but in the relative young
osteoporosis population as our cohort this is unlikely to be a problem.
Whereas vertebral fractures are a frequent complication during the first year after liver
transplantation, hip fractures are rare. However, there are no data available regarding the
long-term effects of liver transplantation on hip fracture rates. As the number of liver
recipients increases and with increased survival, the incidence of hip fractures can be
expected to emerge if bone loss is accelerated at this site.
In accordance with our results, others have found similar rates of bone loss at the lumbar
spine in male patients with CLD [53, 143]. In females with PBC, however, Eastell et al
reported a rate of 2% per year or twice that of normal controls [33]. Others, however,
could not confirm his findings of an increased rate of bone loss at the lumbar spine [53,
144-145]. It is possible that the overall better liver function in our study as well as those
others can explain the discrepancy. This is supported by data from an unpublished study
on post-menopausal females with PBC, all Child-Pugh grade A, where we have not found
an increased rate of bone loss at either the lumbar spine or the femoral neck.
39
Hyperbilirubinemia and decreased levels of the 25-hydroxy vitamin D3 metabolite
predicted increased bone loss in our study but were not related to baseline BMD or found
to be risk factors for osteoporosis. In previous studies the only factors associated with
increased bone loss in patients with CLD have been advanced liver disease and post-
menopausal status [33, 53, 128]. However, in cross-sectional studies an inverse
relationship between BMD and bilirubin has been found by some [33, 145] but not by
others [142]. In vitro studies have found unconjugated bilirubin to inhibit osteoblast
proliferation in a dose-dependent manner [50-51]. However, when sera from patients
was added to the cultures there was no difference between sera from cholestatic and non-
cholestatic CLD with regard to inhibition of osteoblast proliferation and no correlation
was found between serum levels of bilirubin and proliferation of osteoblasts [50]. Thus,
bilirubin may have a pathophysiological role for the metabolic bone disease in CLD but
other plasma components that regulate osteoblast activity, such as growth factors or
retention of other toxic substances, may also be involved.
Vitamin D deficiency is common in the elderly normal population and associated with
increased risk for fractures [146]. Previous reports on the relationship between vitamin
D3 and BMD in CLD have been conflicting. Subnormal levels of vitamin D3 metabolites
in patients with CLD have been reported in several studies and found to be related to
BMD by few [40, 52], but in most studies no correlation with BMD has been found [41-
42, 46-47, 54, 57, 60]. Treatment with vitamin D has been shown to be effective in
improving BMD in alcoholic CLD and viral hepatitis [143, 147], but not in PBC [60,
148]. It has been suggested that low vitamin D3 levels in CLD merely reflect the lack of
vitamin D binding protein associated with liver dysfunction [149]. We found a positive
correlation between serum albumin (as a marker of carrier protein status) and vitamin D3
metabolites supporting this. However, inexplicably low levels of free 1,25-dihydroxy
vitamin D3 have been found in patients with CLD suggesting reasons other than just low
vitamin D binding protein as the cause of low levels of vitamin D3 metabolites [149-150].
Impaired 25-hydroxylation has been reported in severe liver disease, but usually serum
levels can be normalised with adequate vitamin D substrate [38, 151-152]. Thus, it is
likely that a lack of substrate due to poor diet, lack of exposure to sunlight and
40
malabsorption of vitamin D due to cholestasis or drugs interfering with uptake also
contribute to the low levels.
Hyperbilirubinaemia and vitamin D deficiency are expected in cholestatic CLD rather
than hepato-cellular CLD. Whether cholestatic CLD is associated with osteoporosis
more than hepato-cellular CLD has been debated. Since the first description of
“spondylomalacie dans la cirrhose biliaire” [20] most studies on BMD in CLD represent
women with PBC. With few exceptions, however, metabolic bone disease has affected
patients with cholestatic and hepato-cellular CLD equally (23, 25, 32, 55). This is
supported by our findings, i.e. that cholestatic CLD was not a risk factor for osteoporosis
and that patients with cholestatic CLD did not have an increased rate of bone loss when
compared with non-cholestatic CLD (data not shown). It is likely that osteoporosis in
CLD is related to the jaundice itself and is not a specific hallmark of cholestatic CLD.
Osteomalacia as a result of vitamin D deficiency is rare in CLD. Since we did not
perform any bone biopsies the possibility that some of our patients had osteomalacia can
not be excluded.
In accordance with many others we found no signs of hyperparathyroidism in our cohort
of patients [23, 41, 43].
As the IGFs are known to have prominent anabolic effects on bone we raised the question
whether low levels of IGFs in CLD could be associated with decreased BMD in these
patients. No relationship was found between IGF-l or any of the other growth factors and
BMD in either the patient group or the control group. Previous reports on the
relationship between circulating IGF-l and BMD have been conflicting. Several studies
have reported a positive association between serum levels of IGF-l and/or IGFBP-3 and
BMD in primary osteoporosis and in idiopathic osteoporosis in men [91-94, 98]. Only
one study has examined the relationship between IGF-l and BMD in patients with CLD.
In men with viral hepatitis a positive association between serum levels of IGF-l and BMD
at the lumbar spine was found [54]. However, in several of the studies only weak
associations have been found that have been attenuated when adjusting for confounding
factors such as age and in some of these studies no adjustment for age was made, which
is essential since both BMD and IGF-l are strongly influenced by age [73]. In fact, we
found a positive association between IGF-l and BMD at both the lumbar spine and the
41
femoral neck in the control group but when adjusted for age no significant independent
correlation between IGF-l and BMD was found. Others have failed to demonstrate a
positive association between IGF-l and/or IGFBP-3 and BMD or have found a positive
relationship in males or females only when analysed separately [93, 96, 153-154].
Studies on the relationship between IGF-l or IGFBP-3 and biochemical markers of bone
turnover or histomorphometric parameters in bone biopsies have been conflicting [95-96,
155]. Thus, evidence for the importance of circulating IGF-l or IGFBP-3 with respect to
bone metabolism is weak, and locally produced growth factors may be of more
importance. The relative importance of circulating IGF-l towards locally produced IGF-l
in bone has been a matter of debate. In a recent study on knock-out animals where the
liver production of IGF-l was eliminated, no negative effect on longitudinal growth of
bone was found, supporting the concept that IGF-l acts in a paracrine/autocrine fashion
rather than an endocrine one [156]. The results of our study support this since we found
no relationship between circulating levels of IGFs and BMD despite extremely low levels
of the growth factors.
The liver produces IGF-l, IGF-ll and IGFBP-3 and in accordance with our findings, low
levels have been reported in up to 90% of patients with liver cirrhosis with significant
associations to liver failure [54, 77, 84, 85]. In alcoholic and viral CLD, IGF-l and
IGFBP-3 are good predictors of survival as well as early markers of liver dysfunction
[83, 85]. The liver also produces IGFBP-1 and in liver failure levels are elevated and
correlate inversely with liver function as in our study [76, 84, 86]. The reason for this is
unknown but may be related to the role of IGFBP-1 in glucose homeostasis [76, 86].
Less is known about the origin and regulation of IGFBP-2 [74, 81, 84]. Serum levels of
IGFBP-2 are increased whenever the organism is severely ill and there is evidence that
the major regulator of IGFBP-2 is IGF-ll [74]. We found elevated levels of IGFBP-2 in
our patients compared with the controls, however, no relationship was found between
IGFBP-2 and parameters of liver function. Others have reported normal or moderately
elevated levels in liver cirrhosis (81, 84).
We did not find a correlation between IGF-l and BMI or weight in either the controls or
the patients. In malnourished patients IGF-l was found to be a sensitive marker of
malnutrition [157]. IGF-l in patients with CLD, however, is more strongly related to

42
liver function than to nutritional status [83]. A weak association between IGF-l and
anthropometric indices, such as BMI, has also been reported in normal individuals [158-
159].
In order to elucidate the pathophysiology of osteoporosis in CLD further, we studied the
relationship between serum leptin and BMD. Since serum leptin is highly dependent on
BMI and gender, (this physiological correlation between serum leptin, BMI and gender
was maintained in our patients with CLD as well), calculations to adjust for BMI were
made separately for males and females and used in the analyses [108]. We found that
serum leptin adjusted for BMI correlated significantly and inversely with BMD at the
lumbar spine and the femoral neck in female patients and the femoral neck in male
patients when analysed as a whole group, while no relationship was found in the controls.
In a sub-group analysis this inverse relationship in the patients was only significant in
patients with advanced liver disease (Child-Pugh B+C) even if the same trend could be
observed in Child-Pugh A group of patients (data not shown). Serum leptin is reported
high in patients with liver cirrhosis, and since BMD is known to decrease with advanced
liver disease it is possible that this relationship is indirect. However, the possibility of a
pathophysiological role of serum leptin in the osteoporosis of CLD can not be excluded.
In a study in ob/ob mice, leptin was found to be a potent inhibitor of bone formation
when given intracerebrally [116]. Treatment of bone cells in culture with leptin,
however, did not influence bone formation and a central, neuroendocrine pathway for the
effect of leptin on bone mass was suggested. Clinical studies in adult females have not
given support to the hypothesis that circulating leptin influences bone metabolism [118-
120]. Thus, there are no current data, apart from ours, suggesting that elevated levels of
leptin in the circulation can inhibit bone formation.
Serum leptin and serum leptin levels adjusted for BMI did not differ between the patients
and the controls. Liver function, however, seemed to influence leptin levels since male
patients classified as Child-Pugh B+C had significantly higher levels of leptin adjusted
for BMI than males classified as Child-Pugh A, and a positive association between AST
and serum leptin was found. In female patients the same trend was observed but was not
significant. Both high and low serum leptin levels have been reported in patients with
CLD [112-115]. One explanation for these discrepancies could be that no adjustments
43
for BMI was made and that the results are confounded by various combinations of
malnutrition in these patients (resulting in low serum leptin) and liver dysfunction
(resulting in high serum leptin). In one study, however, serum levels of leptin expressed
per kilogram of fat mass were elevated in 28 patients with alcoholic liver cirrhosis
compared with a control group [112]. The cause of high levels of serum leptin in CLD is
unknown but could be a result of impaired renal clearance or stimulation of leptin
secretion [113]. Androgens have suppressive effects on leptin expression and high levels
are found in hypogonadic men [108, 160]. Clinical and sub-clinical hypogonadism in
male patients with CLD could therefore result in high levels of serum leptin. Only 5 of
our male patients were hypogonadic. They had higher serum leptin adjusted for BMI
which was nearly significant when compared with eugonadic males (p=0.05) (data not
shown). As increased levels of leptin have mainly been found in alcoholic cirrhosis it has
been suggested that alcohol per se may influence serum leptin levels [112-114].
44
CONCLUSIONS
Patients with CLD have decreased BMD at the lumbar spine and increased rate of bone
loss most prominent at the femoral neck, which suggests that even cortical bone may be
affected in CLD. Risk factors for osteoporosis were low BMI and treatment with
corticosteroids. In a follow-up study including mainly patients with well preserved liver
function factors related to increased bone loss were hyperbilirubinemia and low vitamin
D levels. The pathogenesis of osteoporosis in CLD is probably multifactorial including
inhibitory effects of hyperbilirubinemia and corticosteroid treatment on osteoblasts,
effects of malnutrition and low vitamin D levels and hormonal changes. Furthermore,
patients with CLD are a heterogeneous group and it is possible that different types of
CLD affect bone by different mechanisms. IGFs probably are not related to osteoporosis
in CLD but are strongly associated with liver function suggesting that they can be used as
early markers of liver function and may be helpful in the future selection of patients for
liver transplantation. Serum leptin correlated with the nutritional status (BMI) of patients
with CLD and was inversely related to BMD. However, its role in the pathophysiology
of osteoporosis is possible but unclear.
Advanced liver disease is highly associated with osteoporosis, presenting new hazards in
the post-transplant era. As it can be expected that more transplants will be performed in
the future it is important to prevent the development of osteoporosis at an early stage.
The results in this report suggest that the combination of subnormal BMI and
corticosteroid medication warrants special attention with regard to osteoporosis.
Measurements of BMD should include measurements of both the lumbar spine and the
femoral neck. Vitamin D levels should be measured in patients with CLD, cholestatic or
not, and if low, the patients should receive supplementation. Furthermore, post-
menopausal females with CLD should be evaluated with respect to osteoporosis and
receive preventive treatment.

45
ACKNOWLEDGEMENTS
I wish to express my sincere gratitude to many people but in particular:
Lars Lööf, my supervisor, for introducing me to hepatology and for sharing with me his
extensive knowledge in the field. For allowing me to do things my way and then again,
never failing in support when suddenly needed. For being accurate and thorough with
special reference to the numerous new versions of manuscripts throughout the years.
Östen Ljunggren, my co-supervisor, for your bright ideas and chronic “positivism” and
for introducing me to the world of living bone (not to mention the laboratory part…).
Hans Mallmin, my co-supervisor, for taking care of the technical part of the work. For
making clear to me the importance of dividing individuals into males and females and
your skill of bringing things down to earth in discussions.
Helena Olofsson, co-author, for providing the controls and for thorough reading and
constructive criticism of the manuscripts. Karl Michaelssen, co-author, for quick
reactions in critical times and for answering all my questions about statistics without
hesitation.
Erik Lindh for enthusiasm and generosity in the beginning and thus giving me the best
of starts.
The staff at the Osteoporosis outpatient clinic for their professionalism and helpfulness.
Special thanks to Katarina Nisser for her flexibility in every situation.
My collegues at the Department of Gastroenterology and Hepatology. Especially I thank
Mari Thörn and Kristina Johnsson-Okembia for providing the essential “female
network”. Gudjon Kristjansson my roommate for all disturbances and for keeping me
46
informed about the position of KR in the Icelandic Basketball League. Yesuf Taha for
his friendship and interesting discussions in coffee shops and other places.
The “Girls” on the ward at the Department of Gastroenterology for taking care of my
blood samples and for their exceptional skill in taking care of liver patients. The personal
feasts will also be remembered….
Secretary Annette Hägg for valuable help with many practical things.
At last, but not least “strákunum mínum” for being just what they are and meaning all
to me.
This study was supported by grants from the Swedish Society of Medicine, Mary
Eriksson foundation, and Novartis, Sweden.
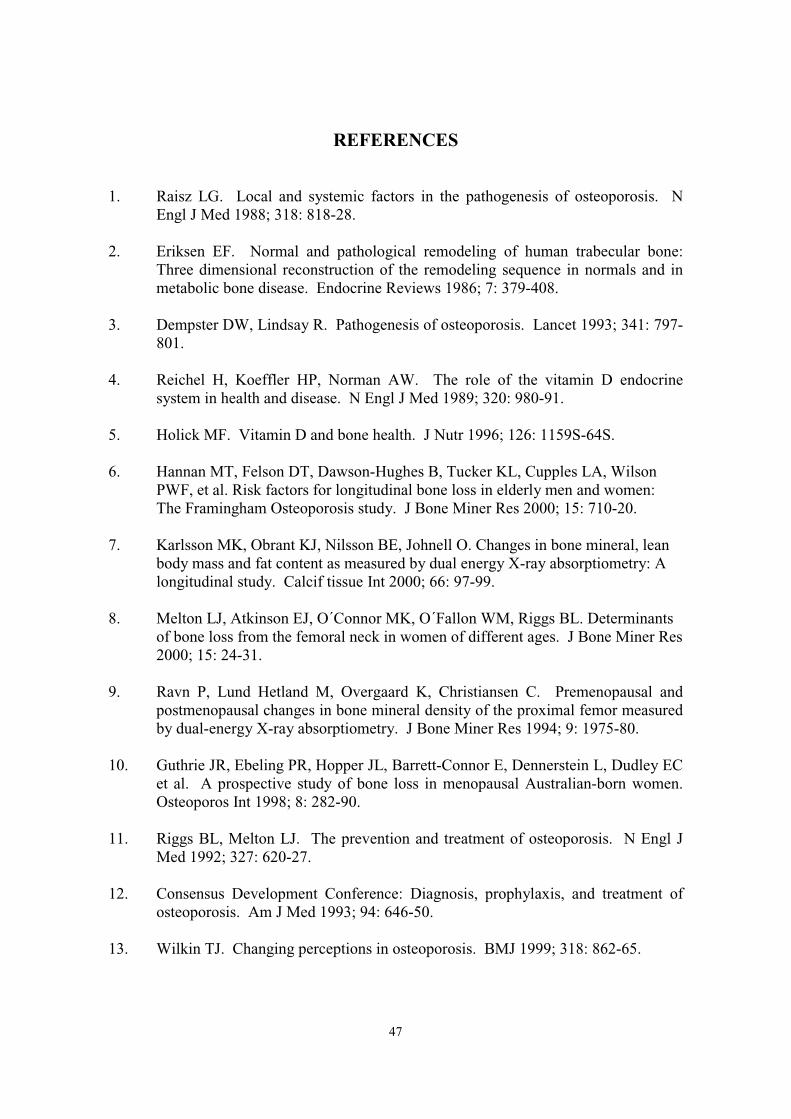
47
REFERENCES
1. Raisz LG. Local and systemic factors in the pathogenesis of osteoporosis. NEngl J Med 1988; 318: 818-28.
2. Eriksen EF. Normal and pathological remodeling of human trabecular bone:Three dimensional reconstruction of the remodeling sequence in normals and inmetabolic bone disease. Endocrine Reviews 1986; 7: 379-408.
3. Dempster DW, Lindsay R. Pathogenesis of osteoporosis. Lancet 1993; 341: 797-801.
4. Reichel H, Koeffler HP, Norman AW. The role of the vitamin D endocrinesystem in health and disease. N Engl J Med 1989; 320: 980-91.
5. Holick MF. Vitamin D and bone health. J Nutr 1996; 126: 1159S-64S.
6. Hannan MT, Felson DT, Dawson-Hughes B, Tucker KL, Cupples LA, WilsonPWF, et al. Risk factors for longitudinal bone loss in elderly men and women:The Framingham Osteoporosis study. J Bone Miner Res 2000; 15: 710-20.
7. Karlsson MK, Obrant KJ, Nilsson BE, Johnell O. Changes in bone mineral, leanbody mass and fat content as measured by dual energy X-ray absorptiometry: Alongitudinal study. Calcif tissue Int 2000; 66: 97-99.
8. Melton LJ, Atkinson EJ, O´Connor MK, O´Fallon WM, Riggs BL. Determinantsof bone loss from the femoral neck in women of different ages. J Bone Miner Res2000; 15: 24-31.
9. Ravn P, Lund Hetland M, Overgaard K, Christiansen C. Premenopausal andpostmenopausal changes in bone mineral density of the proximal femor measuredby dual-energy X-ray absorptiometry. J Bone Miner Res 1994; 9: 1975-80.
10. Guthrie JR, Ebeling PR, Hopper JL, Barrett-Connor E, Dennerstein L, Dudley ECet al. A prospective study of bone loss in menopausal Australian-born women.Osteoporos Int 1998; 8: 282-90.
11. Riggs BL, Melton LJ. The prevention and treatment of osteoporosis. N Engl JMed 1992; 327: 620-27.
12. Consensus Development Conference: Diagnosis, prophylaxis, and treatment ofosteoporosis. Am J Med 1993; 94: 646-50.
13. Wilkin TJ. Changing perceptions in osteoporosis. BMJ 1999; 318: 862-65.
48
14. Riggs BL, Wahner HW, Seeman E, Offord KP, Dunn WL, Mazess RB et al.Changes in bone mineral density of the proximal femur and spine with aging. JClin Invest 1982; 70: 716-23.
15. Wilson JD, Foster DW. Williams textbook of endocrinology, 8th Edn.Philadelphia; W.B. Saunders company, 1992.
16. Favus MJ. Primer on the metabolic bone disease and disorders of mineralmetabolism, 2nd Edn. Philadelphia; Lippincott-Raven Publishers 1993.
17. Genant HK, Engelke K, Fuerst T, Glüer C-C, Grampp S, Harris ST et al.Noninvasive assessment of bone mineral and structure: State of the art. J BoneMiner Res 1996; 11: 707-30.
18. Assessment of fracture risk and its application to screening for postmenopausalosteoporosis. WHO technical report series 843. Geneva: WHO, 1994.
19. Pugh RNH, Murray-Lyon IM, Dawson JL, Pietroni MC, Williams R. Transectionof the oesophagus for bleeding oesophageal varices. Br J Surg 1977; 60: 646-49.
20. Loeper M, Lemaire A, Lesobre R. Spondylomalacie dans la cirrhose biliaire.Arch Mal Appar Dig 1939; 6: 577-87.
21. Sherlock S, Dooley J. Diseases of the Liver and Biliary System, 9th Edn. Oxford;Blackwell Scientific Publications, 1993.
22. Stellon AJ, Davies A, Compston J, Williams R. Bone loss in autoimmune chronicactive hepatitis on maintenance corticosteroid therapy. Gastroenterology 1985;89: 1078-83.
23. Bonkovsky HL, Hawkins M, Steinberg K, Hersch T, Galambos JT, HendersonJM, Millikan WJ, Galloway JR. Prevalence and prediction of osteopenia inchronic liver disease. Hepatology 1990; 12: 273-80.
24. Diamond TH. Metabolic bone disease in primary biliary cirrhosis. Hepatology1990; 5: 66-81.
25. Diamond T, Stiel D, Lunzer M, Wilkinson M, Roche J, Posen S. Osteoporosis andskeletal fractures in chronic liver disease. Gut 1990; 31: 82-87.
26. Rose J, Compston JE, Crawley EO, Evans W, Evans C, Smith P. Osteoporosisassociated with chronic liver disease. Eur J Gastroenterol Hepatol 1991; 3 : 63-69.
27. McCaughan GW, Feller RB. Osteoporosis in chronic liver disease: Pathogenesis,risk factors, and management. Dig Dis 1994; 12: 223-231.
49
28. Hay JE. Bone disease in cholestatic liver disease. Gastroenterology 1995; 108 :276-83.
29. Wolfhagen FHJ, van Buuren HR, Vleggaar FP, Schalm SW. Management ofosteoporosis in primary biliary cirrhosis. Bailliére´s Clinical Gastroenterology2000; 14: 629-41.
30. Haagsma EB, Thijn CJP, Post JG, Slooff MJH, Gips CH. Bone disease afterorthotopic liver transplantation. J Hepatol 1988; 6: 94-100.
31. Porayko MK, Wiesner RH, Hay JE, Krom RAF, Dickson ER, Beaver S,Schwerman L. Bone disease in liver transplant recipients: Incidence, timing andrisk factors. Transplant Proc 1991; 23: 1462-65.
32. McDonald JA, Dunstan CR, Dilworth P, Sherbon K, Sheil AGR, Evans RA,McCaughan GW. Bone loss after liver transplantation. Hepatology 1991; 14: 613-19.
33. Eastell R, Dickson ER, Hodgson SF, Wiesner RH, Porayko MK, Wahner HW etal. Rates of vertebral bone loss before and after liver transplantation in womenwith primary biliary cirrhosis. Hepatology 1991; 14: 296-300.
34. Arnold JC, Hauser D, Ziegler R, Kommerell B, Otto G, Theilmann L, Wüster C.Bone disease after liver transplantation. Transplant Proc 1992; 24: 2709-10.
35. Heaf JG. Hepatic osteodystrophy. Scand J Gastroenterol 1985; 20: 1035-40.
36. Compston JE, Thompson RPH. Intestinal absorption of 25-hydroxyvitamin D andosteomalacia in primary biliary cirrhosis. Lancet 1977; 1: 721-24.
37. Dibble JB, Sheridan P, Hampshire R, Hardy GJ, Losowsky MS. Osteomalacia,vitamin D deficiency and cholestasis in chronic liver disease. Q J Med 1982; 201:89-103.
38. Compston JE, Crowe JP, Wells IP, Horton LWL, Hirst D, Merrett AL, WoodheadJS, Williams R. Vitamin D Prophylaxis and osteomalacia in chronic cholestaticliver disease. Dig Dis 1980; 25: 28-32.
39. Stellon AJ, Webb A, Compston J, Williams R. Low bone turnover state inprimary biliary cirrhosis. Hepatology 1987; 7: 137-42.
40. Diamond TH, Stiel D, Lunzer M, McDowall D, Eckstein RP, Posen S. Hepaticosteodystrophy. Static and dynamic bone histomorphometry and bone Gla-protein in 80 patients with chronic liver disease. Gastroenterology 1989; 96: 213-21.
50
41. Hay JE, Lindor K, Wiesner RH, Dickson ER, Krom RAF, LaRusso NF. Themetabolic bone disease of primary sclerosing cholangitis. Hepatology 1991; 14:257-61.
42. Crosbie OM, Freaney R, McKenna MJ, Hegarty JE. Bone density, vitamin Dstatus, and disordered bone remodeling in end-stage chronic liver disease. CalcifTissue Int 1999; 64: 295-300.
43. Hodgson SF, Dickson ER, Heinz WW, KA Johnson , Mann KG, Riggs BL.Bone loss and reduced osteoblast function in primary biliary cirrhosis. Ann InternMed 1985; 103: 855-60.
44. Stellon AJ, Webb A, Compston JE. Bone histomorphometry and structure incorticosteroid treated chronic active hepatitis. Gut 1988; 29: 378-84.
45. Pietschmann P, Resch H, Müller Ch, Woloszczuk W, Willvonseder R. Decreasedserum osteocalcin levels in patients with liver cirrhosis. Bone Miner 1990; 8:103-8.
46. Monegal A, Navasa M, Guanabens N, Peris P, Martinez de Osaba MJ, Rimola A,et al. Osteoporosis and bone mineral metabolism disorders in cirrhotic patientsreferred for orthotopic liver transplantation. Calcif Tissue Int 1997; 60:148-54.
47. Tsuneoka K, Tameda Y, Takase K, Nakano T. Osteodystrophy in patients withchronic hepatitis and liver cirrhosis. J Gastroenterol 1996; 31: 669-78.
48. De Vernejoul MC, Pointillart A, Cywiner Golenzer C, Morieux C, Bielakoff J,Modrowski D, Miravet L. Effects of iron overload on bone remodeling in pigs.Am J pathol 1984; 116: 377-84.
49. Diamond T, Stiel D, Posen S. Effects of testosterone and venesection on spinaland peripheral bone mineral in six hypogonadal men with hemochromatosis. JBone Miner Res 1991; 6: 39-43.
50. Janes CH, Dickson ER, Okazaki R, Bonde S, McDonagh AF, Riggs LB. Role ofhyperbilirubinemia in the impairment of osteoblast proliferation associated withcholestatic jaundice. J Clin Invest 1995; 95: 2581-86.
51. Ormarsdóttir S, Jonsson KB, Ljunggren Ö, Lööf L. Toxic effects of unconjugatedbilirubin on bone cells in culture. Scand J Gastroenterol 1996; 31 (suppl. 217):28.
52. Chen C-C, Wang S-S, Jeng F-S, Lee S-D. Metabolic bone disease of livercirrhosis: Is it parallel to the clinical severity of cirrhosis? J Gastroenterol Hepatol1996; 11: 417-21.
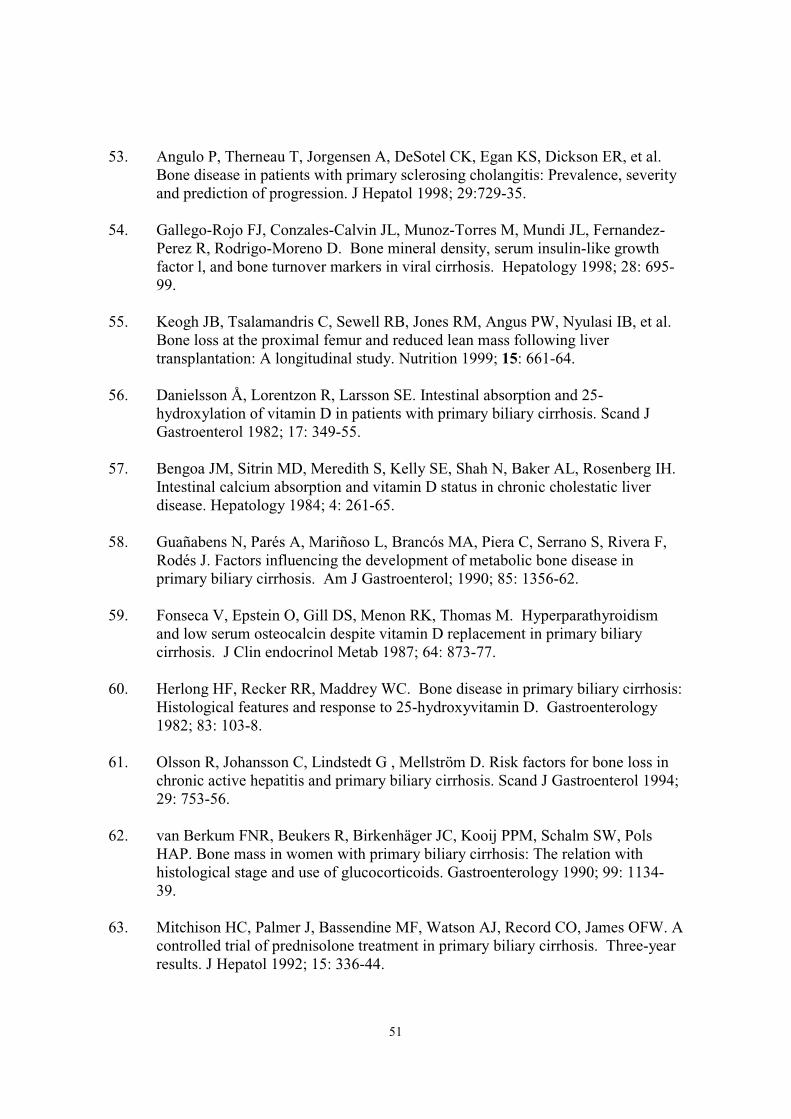
51
53. Angulo P, Therneau T, Jorgensen A, DeSotel CK, Egan KS, Dickson ER, et al.Bone disease in patients with primary sclerosing cholangitis: Prevalence, severityand prediction of progression. J Hepatol 1998; 29:729-35.
54. Gallego-Rojo FJ, Conzales-Calvin JL, Munoz-Torres M, Mundi JL, Fernandez-Perez R, Rodrigo-Moreno D. Bone mineral density, serum insulin-like growthfactor l, and bone turnover markers in viral cirrhosis. Hepatology 1998; 28: 695-99.
55. Keogh JB, Tsalamandris C, Sewell RB, Jones RM, Angus PW, Nyulasi IB, et al.Bone loss at the proximal femur and reduced lean mass following livertransplantation: A longitudinal study. Nutrition 1999; 15: 661-64.
56. Danielsson Å, Lorentzon R, Larsson SE. Intestinal absorption and 25-hydroxylation of vitamin D in patients with primary biliary cirrhosis. Scand JGastroenterol 1982; 17: 349-55.
57. Bengoa JM, Sitrin MD, Meredith S, Kelly SE, Shah N, Baker AL, Rosenberg IH.Intestinal calcium absorption and vitamin D status in chronic cholestatic liverdisease. Hepatology 1984; 4: 261-65.
58. Guañabens N, Parés A, Mariñoso L, Brancós MA, Piera C, Serrano S, Rivera F,Rodés J. Factors influencing the development of metabolic bone disease inprimary biliary cirrhosis. Am J Gastroenterol; 1990; 85: 1356-62.
59. Fonseca V, Epstein O, Gill DS, Menon RK, Thomas M. Hyperparathyroidismand low serum osteocalcin despite vitamin D replacement in primary biliarycirrhosis. J Clin endocrinol Metab 1987; 64: 873-77.
60. Herlong HF, Recker RR, Maddrey WC. Bone disease in primary biliary cirrhosis:Histological features and response to 25-hydroxyvitamin D. Gastroenterology1982; 83: 103-8.
61. Olsson R, Johansson C, Lindstedt G , Mellström D. Risk factors for bone loss inchronic active hepatitis and primary biliary cirrhosis. Scand J Gastroenterol 1994;29: 753-56.
62. van Berkum FNR, Beukers R, Birkenhäger JC, Kooij PPM, Schalm SW, PolsHAP. Bone mass in women with primary biliary cirrhosis: The relation withhistological stage and use of glucocorticoids. Gastroenterology 1990; 99: 1134-39.
63. Mitchison HC, Palmer J, Bassendine MF, Watson AJ, Record CO, James OFW. Acontrolled trial of prednisolone treatment in primary biliary cirrhosis. Three-yearresults. J Hepatol 1992; 15: 336-44.
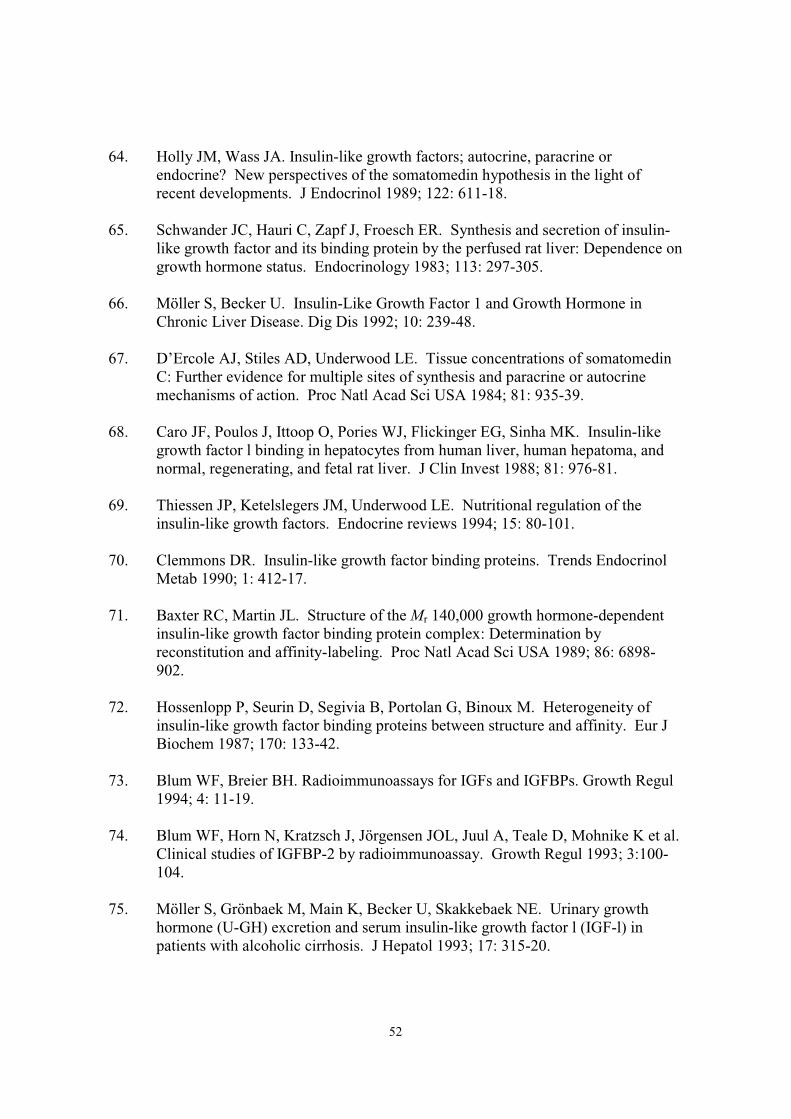
52
64. Holly JM, Wass JA. Insulin-like growth factors; autocrine, paracrine orendocrine? New perspectives of the somatomedin hypothesis in the light ofrecent developments. J Endocrinol 1989; 122: 611-18.
65. Schwander JC, Hauri C, Zapf J, Froesch ER. Synthesis and secretion of insulin-like growth factor and its binding protein by the perfused rat liver: Dependence ongrowth hormone status. Endocrinology 1983; 113: 297-305.
66. Möller S, Becker U. Insulin-Like Growth Factor 1 and Growth Hormone inChronic Liver Disease. Dig Dis 1992; 10: 239-48.
67. D’Ercole AJ, Stiles AD, Underwood LE. Tissue concentrations of somatomedinC: Further evidence for multiple sites of synthesis and paracrine or autocrinemechanisms of action. Proc Natl Acad Sci USA 1984; 81: 935-39.
68. Caro JF, Poulos J, Ittoop O, Pories WJ, Flickinger EG, Sinha MK. Insulin-likegrowth factor l binding in hepatocytes from human liver, human hepatoma, andnormal, regenerating, and fetal rat liver. J Clin Invest 1988; 81: 976-81.
69. Thiessen JP, Ketelslegers JM, Underwood LE. Nutritional regulation of theinsulin-like growth factors. Endocrine reviews 1994; 15: 80-101.
70. Clemmons DR. Insulin-like growth factor binding proteins. Trends EndocrinolMetab 1990; 1: 412-17.
71. Baxter RC, Martin JL. Structure of the Mr 140,000 growth hormone-dependentinsulin-like growth factor binding protein complex: Determination byreconstitution and affinity-labeling. Proc Natl Acad Sci USA 1989; 86: 6898-902.
72. Hossenlopp P, Seurin D, Segivia B, Portolan G, Binoux M. Heterogeneity ofinsulin-like growth factor binding proteins between structure and affinity. Eur JBiochem 1987; 170: 133-42.
73. Blum WF, Breier BH. Radioimmunoassays for IGFs and IGFBPs. Growth Regul1994; 4: 11-19.
74. Blum WF, Horn N, Kratzsch J, Jörgensen JOL, Juul A, Teale D, Mohnike K et al.Clinical studies of IGFBP-2 by radioimmunoassay. Growth Regul 1993; 3:100-104.
75. Möller S, Grönbaek M, Main K, Becker U, Skakkebaek NE. Urinary growthhormone (U-GH) excretion and serum insulin-like growth factor l (IGF-l) inpatients with alcoholic cirrhosis. J Hepatol 1993; 17: 315-20.
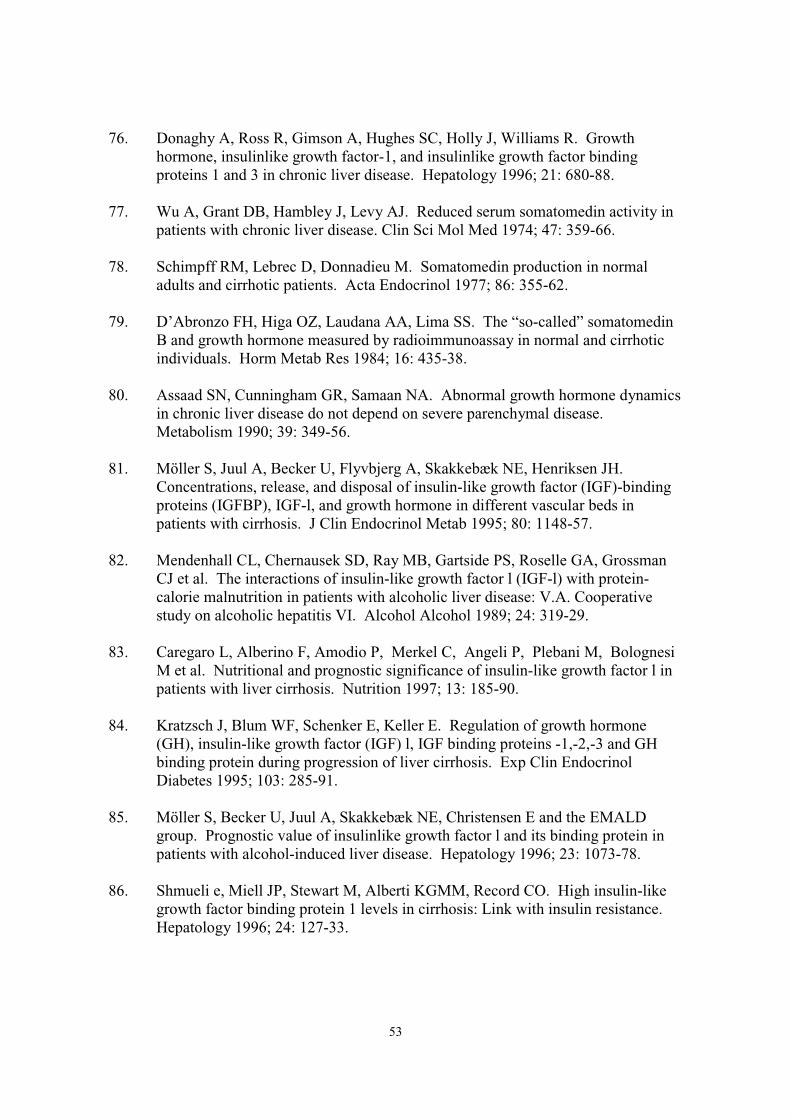
53
76. Donaghy A, Ross R, Gimson A, Hughes SC, Holly J, Williams R. Growthhormone, insulinlike growth factor-1, and insulinlike growth factor bindingproteins 1 and 3 in chronic liver disease. Hepatology 1996; 21: 680-88.
77. Wu A, Grant DB, Hambley J, Levy AJ. Reduced serum somatomedin activity inpatients with chronic liver disease. Clin Sci Mol Med 1974; 47: 359-66.
78. Schimpff RM, Lebrec D, Donnadieu M. Somatomedin production in normaladults and cirrhotic patients. Acta Endocrinol 1977; 86: 355-62.
79. D’Abronzo FH, Higa OZ, Laudana AA, Lima SS. The “so-called” somatomedinB and growth hormone measured by radioimmunoassay in normal and cirrhoticindividuals. Horm Metab Res 1984; 16: 435-38.
80. Assaad SN, Cunningham GR, Samaan NA. Abnormal growth hormone dynamicsin chronic liver disease do not depend on severe parenchymal disease.Metabolism 1990; 39: 349-56.
81. Möller S, Juul A, Becker U, Flyvbjerg A, Skakkebæk NE, Henriksen JH.Concentrations, release, and disposal of insulin-like growth factor (IGF)-bindingproteins (IGFBP), IGF-l, and growth hormone in different vascular beds inpatients with cirrhosis. J Clin Endocrinol Metab 1995; 80: 1148-57.
82. Mendenhall CL, Chernausek SD, Ray MB, Gartside PS, Roselle GA, GrossmanCJ et al. The interactions of insulin-like growth factor l (IGF-l) with protein-calorie malnutrition in patients with alcoholic liver disease: V.A. Cooperativestudy on alcoholic hepatitis VI. Alcohol Alcohol 1989; 24: 319-29.
83. Caregaro L, Alberino F, Amodio P, Merkel C, Angeli P, Plebani M, BolognesiM et al. Nutritional and prognostic significance of insulin-like growth factor l inpatients with liver cirrhosis. Nutrition 1997; 13: 185-90.
84. Kratzsch J, Blum WF, Schenker E, Keller E. Regulation of growth hormone(GH), insulin-like growth factor (IGF) l, IGF binding proteins -1,-2,-3 and GHbinding protein during progression of liver cirrhosis. Exp Clin EndocrinolDiabetes 1995; 103: 285-91.
85. Möller S, Becker U, Juul A, Skakkebæk NE, Christensen E and the EMALDgroup. Prognostic value of insulinlike growth factor l and its binding protein inpatients with alcohol-induced liver disease. Hepatology 1996; 23: 1073-78.
86. Shmueli e, Miell JP, Stewart M, Alberti KGMM, Record CO. High insulin-likegrowth factor binding protein 1 levels in cirrhosis: Link with insulin resistance.Hepatology 1996; 24: 127-33.
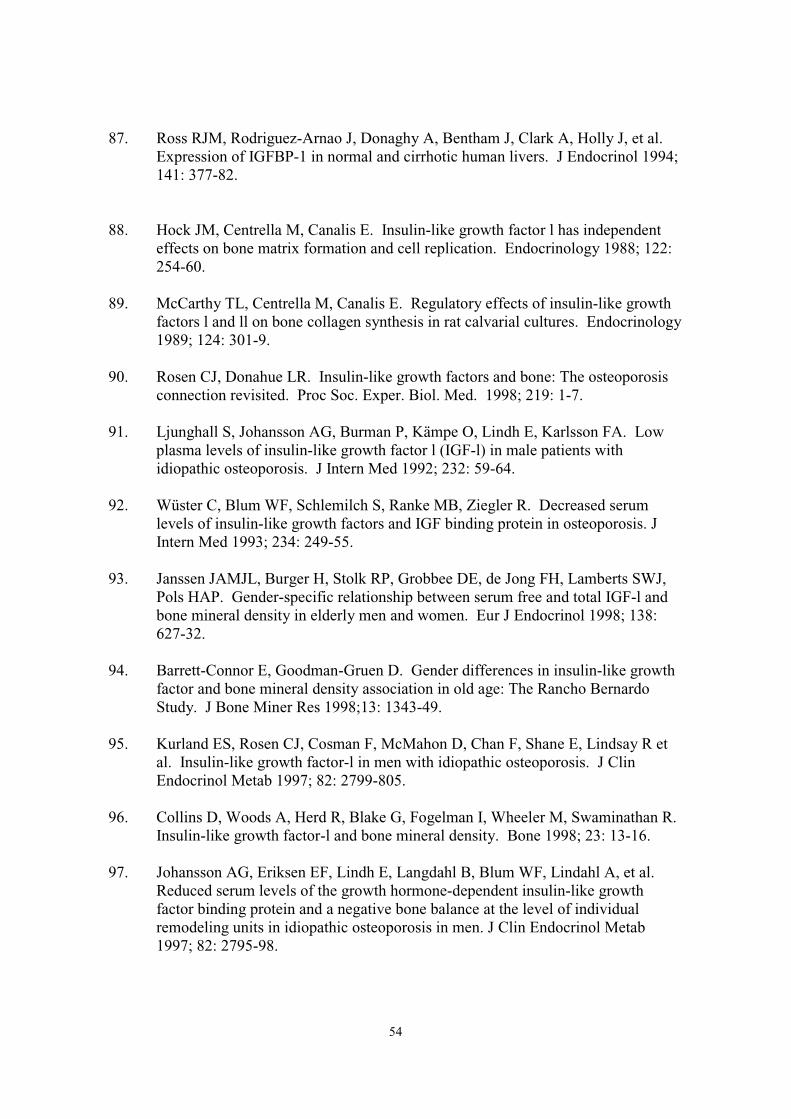
54
87. Ross RJM, Rodriguez-Arnao J, Donaghy A, Bentham J, Clark A, Holly J, et al.Expression of IGFBP-1 in normal and cirrhotic human livers. J Endocrinol 1994;141: 377-82.
88. Hock JM, Centrella M, Canalis E. Insulin-like growth factor l has independenteffects on bone matrix formation and cell replication. Endocrinology 1988; 122:254-60.
89. McCarthy TL, Centrella M, Canalis E. Regulatory effects of insulin-like growthfactors l and ll on bone collagen synthesis in rat calvarial cultures. Endocrinology1989; 124: 301-9.
90. Rosen CJ, Donahue LR. Insulin-like growth factors and bone: The osteoporosisconnection revisited. Proc Soc. Exper. Biol. Med. 1998; 219: 1-7.
91. Ljunghall S, Johansson AG, Burman P, Kämpe O, Lindh E, Karlsson FA. Lowplasma levels of insulin-like growth factor l (IGF-l) in male patients withidiopathic osteoporosis. J Intern Med 1992; 232: 59-64.
92. Wüster C, Blum WF, Schlemilch S, Ranke MB, Ziegler R. Decreased serumlevels of insulin-like growth factors and IGF binding protein in osteoporosis. JIntern Med 1993; 234: 249-55.
93. Janssen JAMJL, Burger H, Stolk RP, Grobbee DE, de Jong FH, Lamberts SWJ,Pols HAP. Gender-specific relationship between serum free and total IGF-l andbone mineral density in elderly men and women. Eur J Endocrinol 1998; 138:627-32.
94. Barrett-Connor E, Goodman-Gruen D. Gender differences in insulin-like growthfactor and bone mineral density association in old age: The Rancho BernardoStudy. J Bone Miner Res 1998;13: 1343-49.
95. Kurland ES, Rosen CJ, Cosman F, McMahon D, Chan F, Shane E, Lindsay R etal. Insulin-like growth factor-l in men with idiopathic osteoporosis. J ClinEndocrinol Metab 1997; 82: 2799-805.
96. Collins D, Woods A, Herd R, Blake G, Fogelman I, Wheeler M, Swaminathan R.Insulin-like growth factor-l and bone mineral density. Bone 1998; 23: 13-16.
97. Johansson AG, Eriksen EF, Lindh E, Langdahl B, Blum WF, Lindahl A, et al.Reduced serum levels of the growth hormone-dependent insulin-like growthfactor binding protein and a negative bone balance at the level of individualremodeling units in idiopathic osteoporosis in men. J Clin Endocrinol Metab1997; 82: 2795-98.
55
98. Sugimoto T, Nishiyama K, Kuribayashi F, Chihara K. Serum levels of insulin-likegrowth factor (IGF) l, IGF-binding protein (IGFBP)-2, and IGFBP-3 inosteoporotic patients with and without spinal fractures. J Bone Miner Res 1997;12: 1272-79.
99. Cemborain A, Castilla-Cortazar I, Garcia M, Quiroga J, Muguerza B, Picardi A,Santidrian S et al. Osteopenia in rats with liver cirrhosis: beneficial effects ofIGF-l treatment. J Hepatol 1998; 28: 122-31.
100. Johansson AG, Lindh E, Ljunghall S. Insulin-like growth factor l stimulates boneturnover in osteoporosis. Lancet 1992; 339; 1619
101. Ebeling PR, Jones JD, O’Fallon WM, Janes CH, Riggs BL. Short-term effects ofrecombinant human insulin-like growth factor l on bone turnover in normalwomen. J Clin Endocrinol Metab 1993; 77: 1384-87.
102. Johansson AG, Lindh E, Blum WF, Kollerup G, Sörensen OH, Ljunghall S.Effects of growth hormone and insulinlike growth factor l in men with idiopathicosteoporosis. J Clin Endocrinol Metab 1996; 81: 44-48.
103. Rubin CD, Reed B, Sakhaee K, Pak CYC. Treating a patient with the Wernersyndrome and osteoporosis using recombinant human insulin-like growth factor.Ann Intern Med 1994; 121: 665-68.
104. Zhang Y PR, Maffei M, Barone M, Leopold L, Friedman JM. Positional cloningof the mouse obese gene and its human homologue. Nature 1994; 372: 425-32.
105. Stephens TW, Basinski M, Bristow PK. The role of neuropeptide Y in theantiobesity action of the obese gene product. Nature 1995; 377; 530-32.
106. Auwerx J, Staels B. Leptin. Lancet 1998; 351: 737-42.
107. Maffei M, Halaas J, Ravussin E, Pratley RE, Lee GH, Zhang Y, et al. Leptinlevels in human and rodent: Measurement of plasma leptin and ob RNA in obeseand weight reduced subjects. Nat Med 1995; 1: 1155-61.
108. Blum WF, Englaro P, Hanitsch S, Juul A, Hertel NT, Müller J, et al. Plasmaleptin levels in healthy children and adolescents: Dependence on body massindex, body fat mass, gender, pubertal stage, and testosterone. J Clin EndocrinolMetab. 1997; 822: 904-10.
109. Considine RV, Sinha MK, Heiman ML et al. Serum immunoreactive-leptinconcentrations in normal-weight and obese humans. N Engl J Med 1996; 334:292-95.
56
110. Potter JJ, Womack L, Mezey E, Anania FA. Transdifferentiation of rat hepaticstellate cells results in leptin expression. Biochem Biophys Res Commun 1998;244: 178-82.
111. Kaplan LM. Leptin, obesity, and liver disease. Gastroenterology 1998; 115: 997-1001.
112. McCullough AJ, Bugianesi E, Marchesini G, Kalhan SC. Gender-dependentalterations in serum leptin in alcoholic cirrhosis. Gastroenterology 1998; 115:947-53.
113. Henriksen JH, Holst JJ, Möller S, Brinch K, Bendtsen F. Increased circulatingleptin in alcoholic cirrhosis: Relation to release and disposal. Hepatology 1999;29: 1818-24.
114. Greco AV, Mingroni G, Favuzzi A, Capristo E, Gniuli D, Addolorato G, et al.Serum leptin levels in post-hepatitis liver cirrhosis. J Hepatol. 2000; 33: 38-42.
115. Testa R, Franceschini R, Giannini E et al. Serum leptin levels in patients withviral chronic hepatitis or liver cirrhosis. J Hepatol 2000; 33: 33-37.
116. Ducy P, Amling M, Takeda S et al. Leptin inhibits bone formation through ahypothalamic relay: A central control of bone mass. Cell 2000; 100: 197-207.
117. Fleet JC. Leptin and bone: Does the brain control bone biology? Nutr Rev 2000;58: 209-11.
118. Goulding A, Taylor RW. Plasma leptin values in relation to bone mass anddensity and to dynamic biochemical markers of bone resorption and formation inpostmenopausal women. Calcif Tissue Int 1998; 63: 456-58.
119. Rauch F, Blum WF, Klein K, Allolio B, Schönau E. Does leptin have an effecton bone in adult women? Calcif Tissue Int 1998; 63: 453-55.
120. Odabasi E, Ozata M, Turan M et al. Plasma leptin concentrations inpostmenopausal women with osteoporosis. Eur J Endocrinol 2000; 142: 170-73.
121. Brahm H, Mallmin H, Michaelsson K, Ström H, Ljunghall S. Relationshipsbetween bone mass measurements and lifetime physical activity in a Swedishpopulation. Calcif Tissue Int 1997; 62: 400-12.
122. Briony T. Manual of dietetic practice, 2nd Edn. Oxford; Blackwell ScientificPublications, 1994.
123. Breier BH, Milsom SR, Blum WF, Schwander J, Gallaher BW, Gluckman PD.Insulin-like growth factors and their binding proteins in plasma and milk after
57
growth hormone-stimulated galactopoesis in normally lactating women. ActaEndocrinol 1993; 129: 427-35.
124. Blum WF, Englaro P, Attanasio AM, Kiess W, Rascher W. Human and clinicalperspectives on leptin. Proc Nutr Soc 1998; 57: 477-85.
125. Mitchison HC, Malcolm AJ, Bassendine MF, James OFW. Metabolic bonedisease in primary biliary cirrhosis at presentation. Gastroenterology 1988; 94:463-70.
126. Dykman TR, Gluck OS, Murphy WA, Hahn TJ, Hahn BH. Evaluation of factorsassociated with glucocorticoid-induced osteopenia in patients with rheumaticdiseases. Arthritis Rheum 1985; 28: 361-68.
127. Silvennoinen JA, Karttunen TJ, Niemelä SE, Manelius JJ, Lehtola J. A controlledstudy of bone mineral density in patients with inflammatory bowel disease. Gut1995; 37: 71-76.
128. Angulo P, Jorgensen RA, Keach JC, Dickson R, Smith C, Lindor K. Oralbudesonid in the treatment of patients with primary biliary cirrhosis with asuboptimal response to ursodeoxycholic acid. Hepatology 2000; 31: 318-23.
129. Mitchison HC, Bassendine MF, Malcolm AJ, Watson AJ, Record CO, JamesOFW. A pilot, double-blind, controlled 1-year trial of prednisolone treatment inprimary biliary cirrhosis: Hepatic improvement but greater bone loss. Hepatology1989; 10: 420-29.
130. Felson DT, Zhang Y, Hannan MT, Anderson JJ. Effects of weight and body massindex on bone mineral density in men and women: The Framingham study. JBone Miner Res 1993; 8: 567-62.
131. Tremollieres FA, Pouilles JM, Ribot C. Vertebral postmenopausal bone loss isreduced in overweight women: A longitudinal study in 155 early postmenopausalwomen. J Clin Endocrinol Metab 1993; 77: 683-86.
132. Michaëlsson K. Screening for osteopenia and osteoporosis-selection by bodycomposition. Osteoporosis Int 1996; 6: 120-26.
133. Burger H, de Laet CEDH, van Daele PLA, Weel AEAM, Witterman JCM,Hofman A, Pols HAP. Risk factors for increased bone loss in an elderlypopulation. The Rotterdam study. Am J Epidemiol 1998; 147: 871-79.
134. Ravn P, Cizza G, Bjarnason NH, Thompson D, Daley M, Wasnich RD, et al.Low body mass index is an important risk factor for low bone mass and increasedbone loss in early postmenopausal women. J Bone Miner Res 1999; 14: 1622-27.
58
135. Kenny AM, Prestwood KM, Marcello KM, Raisz LG. Determinants of bonedensity in healthy older men with low testosterone levels. J Gerontol 2000; 55A:M492-M497.
136. Merli M, Romiti A, Riggio O, Capocaccia L. Optimal nutritional indexes inchronic liver disease. J Parenter Enteral Nutr 1987; 11: 130S-134S.
137. DiCecco SR, Wieners EJ, Wiesner RH, Southorn PA, Plevak DJ, Krom RAF.Assessment of nutritional status of patients with end-stage liver diseaseundergoing liver transplantation. Mayo Clin Proc 1989; 64: 95-102.
138. Italian Multicentre Cooperative Project on nutrition in liver cirrhosis. Nutritionalstatus in cirrhosis. J Hepatol 1994; 21: 317-25.
139. Wicks C, Bray GP, Williams R. Nutritional assessment in primary biliarycirrhosis: The effect of disease severity. Clin Nutr 1995; 14: 29-34.
140. Jones G, Nguyen T, Sambrook P, Kelly PJ, Eisman JA. Progressive loss of bonein the femoral neck in elderly people: Longitudinal findings from the Dubboosteoporosis epidemiology study. BMJ 1994; 309: 691-95.
141. Ensrud KE, Palermo L, Black DM, Cauley J, Jergas M, Orwoll ES, et al. Hip andcalcaneal bone loss increases with advancing age. Longitudinal results from thestudy of osteoporotic fractures. J Bone Miner Res 1995; 10: 1778-87.
142. Bagur A, Mautalen C, Findor J, Sorda J, Somoza J. Risk factors for thedevelopment of vertebral and total skeleton osteoporosis in patients with primarybiliary cirrhosis. Calcif Tissue Int 1998; 63: 385-90.
143. Shiomi S, Masaki K, Habu D, Takeda T, Nishiguchi S, Kuroki T, et al. Calcitriolfor bone disease in patients with cirrhosis of the liver. J Gastrol Hepatol 1999; 14:547-52.
144. Newton JL, Rawlings D, Prince MI, James OFW, Bassendine MF, Jones DEJ.Osteoporosis is not a specific complication of primary biliary cirrhosis (PBC).35th EASL annual meeting 2000, abstract.
145. Lindor KD, Janes CH, Crippin JS, Jorgensen RA, Dickson ER. Bone disease inprimary biliary cirrhosis: Does ursodeoxycholic acid make a difference?Hepatology 1995; 21: 389-92.
146. Diamond T, Smerdely P, Kormas N, Sekel R, Vu T, Day P. Hip fracture inelderly men: The importance of subclinical vitamin D deficiency andhypogonadism. MJA 1998; 169: 138-41.
59
147. Mobarhan SA, Russell RM, Recker RR, Posner DB, Iber FL, Miller P. Metabolicbone disease in alcoholic cirrhosis: A comparison of the effect of vitamin D2, 25-hydroxyvitamin D, or supportive treatment. Hepatology 1984; 4: 266-73.
148. Matloff DS, Kaplan MM, Neer RM, Goldberg MJ, Bitman W, Wolfe H.Osteoporosis in primary biliary cirrhosis: Effects of 25-hydroxyvitamin D3
treatment.
149. Diamond T, Stiel D, Mason R, Lissner D, Bikle D, Wilson S, Posen S. Serumvitamin D metabolites are not responsible for low turnover osteoporosis inchronic liver disease. J Clin Endocrinol Metab 1989; 69: 1234-39.
150. Bikle DD, Gee E, Halloran B, Haddad JG. Free 1,25-dihydroxyvitamin D levelsin serum from normal subjects, pregnant subjects, and subjects with liver disease.J Clin Inv 1984; 74: 1966-71.
151. Mawer BE, Klass HJ, Warnes TW, Berry JL. Metabolism of vitamin D inpatients with primary biliary cirrhosis and alcoholic liver disease. Clin Sci 1985;69: 561-70.
152. Skinner RK, Long RG, Sherlock S, Wills MR. 25-hydroxylation of vitamin D inprimary biliary cirrhosis. Lancet 1977; 1: 720-21.
153. Lloyd M, Hart DJ, Nandra D, McAlindon TE, Wheeler M, Doyele DW, SpectorTD. The relationship between insulin-like growth factor-l concentrations, kneeosteoarthritis, bone density and fractures in the general population: The Chingfordstudy. Ann Rheum Dis 1996; 55: 870-74.
154. Langlois JA, Rosen CJ, Visser M, Hannan MT, Harris T, Wilson PWF, et al.Association between insulin-like growth factor l and bone mineral density in olderwomen and men: The Framingham heart study. J Clin Endocrinol Metab 1998;83: 4257-62.
155. Seck T, Scheppach B, Scharla S, Diel I, Blum WF, Bismar H, et al. J ClinEndocrinol Metab 1998; 83: 2331-37.
156. Sjögren K, Liu J-L, Blad K, Skrtic S, Vidal O, Wallenius V, et al. Liver-derivedinsulin-like growth factor l (IGF-l) is the principal source of IGF-l in blood but isnot required for postnatal body growth in mice. Proc Natl Acad Sci USA 1999;96: 7088-92.
157. Clemmons DR, Underwood LE, Dickerson RN, Brown RO, Hak LJ, MacPhee,Heizer WD. Use of plasma somatomedin-C/insulin-like growth factor lmeasurements to monitor the response to nutritional repletion in malnourishedpatients. Am J Clin Nutr 1985; 41: 191-98.
60
158. Wilson DM, Hammer LD, Litt IF, Vosti C, Miner B, Hayward C, et al. Insulin-like growth factor-l as a reflection of body composition, nutrition and puberty insixth and seven grade girls. J Clin Endocrinol Metab 1991; 73: 907-912.
159. Juul A, Bang P, Hertel NT, Main K, Dalgaard P, Jörgensen K, et al. Seruminsulin-like growth factor-l in 1030 healthy children, adolescents, and adults:Relation to age, sex, stage of puberty, testicular size, and body mass index. J ClinEndocrinol Metab 1994; 78: 744-52.
160. Behre HM, Simoni M, Nieschlag E. Strong association between serum levels ofleptin and testosterone in men. Clin Endocrinol 1997; 47: 237-40.