OSRAM Opto Semiconductors PowerPoint Master 16x9 EN/media/Files/O/Osram/Investor... · Xenon &...
32
OSRAM Licht AG | May 3, 2018 Light is OSRAM www.osram.com OSRAM continues technological transformation Q2 FY18 Earnings Release (preliminary, unaudited figures)
Transcript of OSRAM Opto Semiconductors PowerPoint Master 16x9 EN/media/Files/O/Osram/Investor... · Xenon &...

OSRAM Licht AG | May 3, 2018
Light is OSRAM
www.osram.com
OSRAM continues technological transformation
Q2 FY18 Earnings Release (preliminary, unaudited figures)
OSRAM Licht AG
Q2 FY18 Earnings Release (preliminary, unaudited figures) | May 3, 2018
2
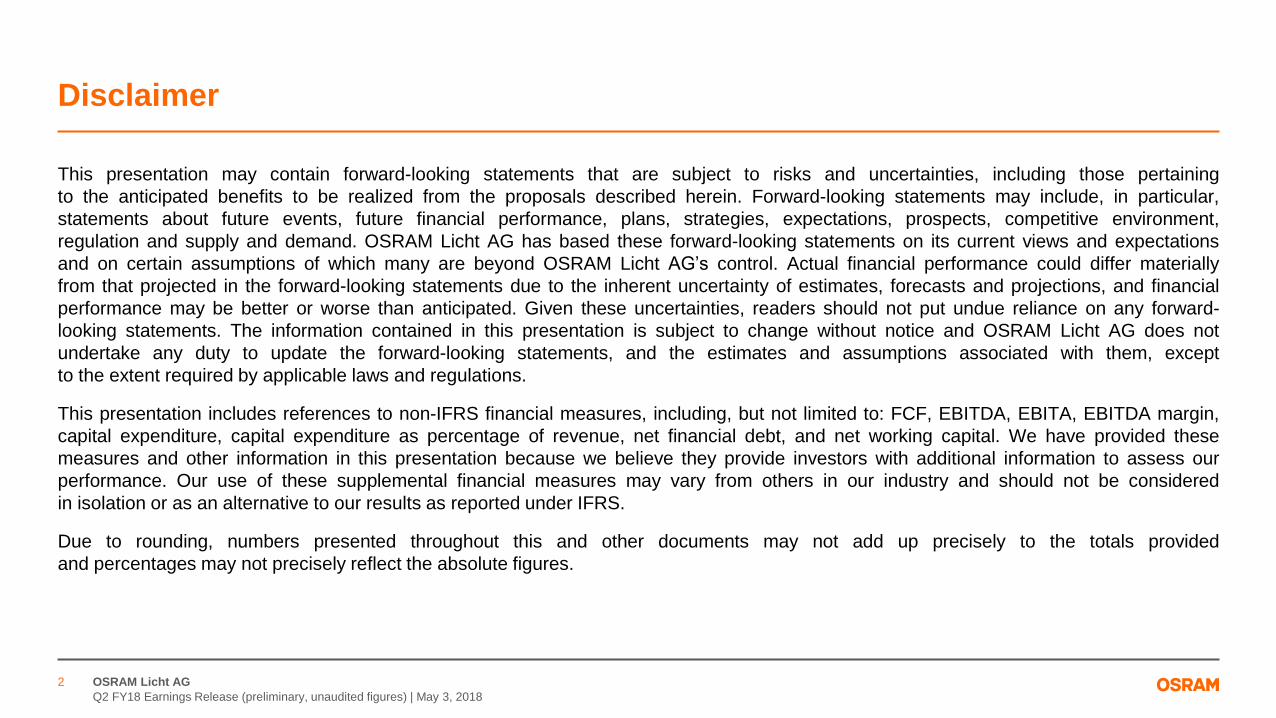
Disclaimer
This presentation may contain forward-looking statements that are subject to risks and uncertainties, including those pertaining
to the anticipated benefits to be realized from the proposals described herein. Forward-looking statements may include, in particular,
statements about future events, future financial performance, plans, strategies, expectations, prospects, competitive environment,
regulation and supply and demand. OSRAM Licht AG has based these forward-looking statements on its current views and expectations
and on certain assumptions of which many are beyond OSRAM Licht AG’s control. Actual financial performance could differ materially
from that projected in the forward-looking statements due to the inherent uncertainty of estimates, forecasts and projections, and financial
performance may be better or worse than anticipated. Given these uncertainties, readers should not put undue reliance on any forward-
looking statements. The information contained in this presentation is subject to change without notice and OSRAM Licht AG does not
undertake any duty to update the forward-looking statements, and the estimates and assumptions associated with them, except
to the extent required by applicable laws and regulations.
This presentation includes references to non-IFRS financial measures, including, but not limited to: FCF, EBITDA, EBITA, EBITDA margin,
capital expenditure, capital expenditure as percentage of revenue, net financial debt, and net working capital. We have provided these
measures and other information in this presentation because we believe they provide investors with additional information to assess our
performance. Our use of these supplemental financial measures may vary from others in our industry and should not be considered
in isolation or as an alternative to our results as reported under IFRS.
Due to rounding, numbers presented throughout this and other documents may not add up precisely to the totals provided
and percentages may not precisely reflect the absolute figures.

OSRAM Licht AG
Q2 FY18 Earnings Release (preliminary, unaudited figures) | May 3, 2018
3
“Taking a look at the first half of our fiscal year shows that
we faced tougher markets and a more challenging
environment. In addition the FX development was not in our
favor. Nevertheless, we are pushing ahead with our growth
strategy and continue to strengthen our market position as
a high-tech company.”
Pushing ahead with our growth strategy in a challenging environment
CEO statement
Highlights Q2 2018
• Currency and market effects reduce
growth
• €1,012m revenue equals +1.8%
comparable growth; adjusted EBITDA
margin at 15.1%
• High-tech growth strategy continues
• Future concept of OSRAM enters next
phase of implementation

OSRAM Licht AG
Q2 FY18 Earnings Release (preliminary, unaudited figures) | May 3, 2018
4
Currency and market topics shape development of Q2 FY18
Revenue (€m) / comparable growth
+1.8%
Q2/18
1,012
Q2/17
1,051
Strong Euro
strains revenue
with approx.
€-90m
Adj. EBITDA (€m) / margin
15.1%
Q2/17
183
17.4%
153
Q2/18
-30 Adj. EBITDA
impacted by
currency effects,
ramp-up costs and
higher R&D of
approx. €-50m
Free Cash Flow (€m)
5
-132
Q2/18Q2/17
FCF as expected
reflects high
invest at OS
Earnings per share, diluted (€)
-0.35
0.46
0.81
Q2/17 Q2/18
EPS reduced due
to currency effects
and special effects
OSRAM Licht AG
Q2 FY18 Earnings Release (preliminary, unaudited figures) | May 3, 2018
5
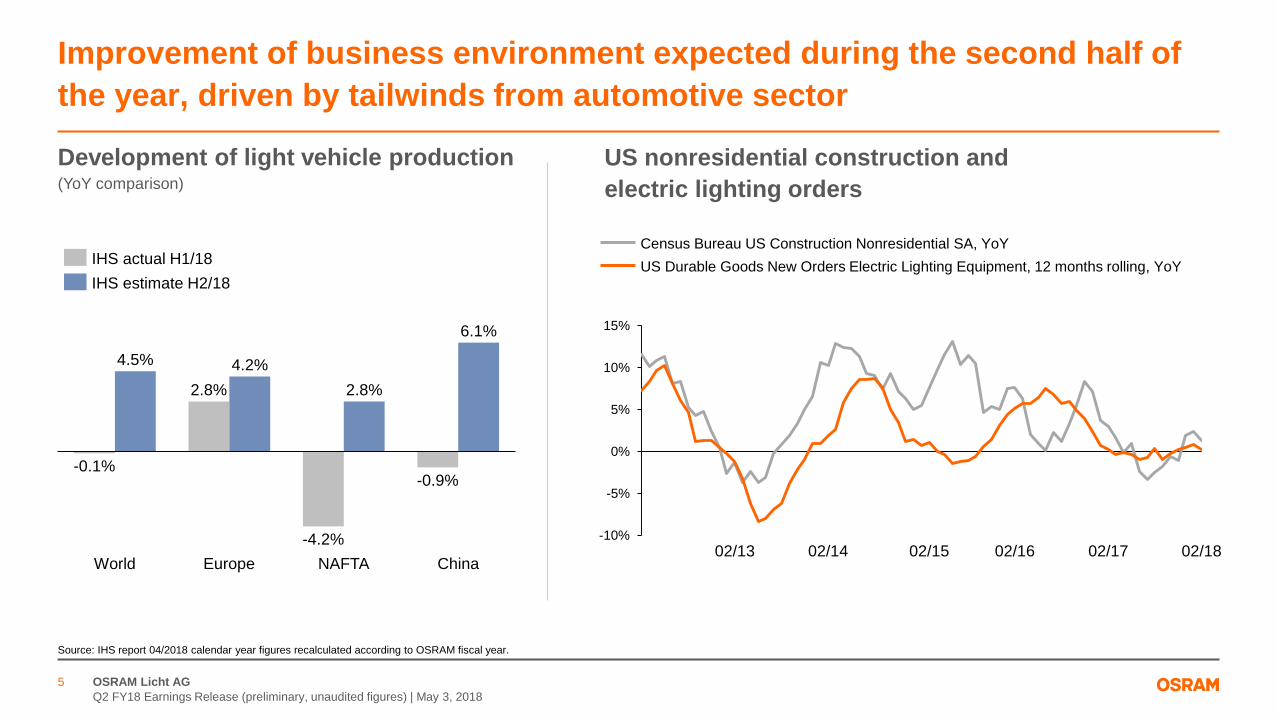
Improvement of business environment expected during the second half of
the year, driven by tailwinds from automotive sector
Development of light vehicle production (YoY comparison)
US nonresidential construction and
electric lighting orders
-10%
-5%
0%
5%
10%
15%
02/13 02/14 02/15 02/1802/16 02/17
Census Bureau US Construction Nonresidential SA, YoY
US Durable Goods New Orders Electric Lighting Equipment, 12 months rolling, YoY
Europe
2.8%
NAFTAWorld China
4.5% 4.2%
-0.1%
-4.2%
2.8%
-0.9%
6.1%
IHS actual H1/18
IHS estimate H2/18
Source: IHS report 04/2018 calendar year figures recalculated according to OSRAM fiscal year.

OSRAM Licht AG
Q2 FY18 Earnings Release (preliminary, unaudited figures) | May 3, 2018
6
• Order book reflects
improvement across
customers & products
• Inventory levels of
customers normalized
• Design wins for new
innovative products
• Positive signals
especially for Projection,
Stage and Video Wall
• First sales out of Kulim
delivered as of April
2018
Automotive Industry & Mobile Devices Capacity build-up
Upturn for semiconductor business expected in H2 FY18
Aiming for double digit growth for 2nd half of FY18

OSRAM Licht AG
Q2 FY18 Earnings Release (preliminary, unaudited figures) | May 3, 2018
7
OSRAM focuses on digital growth trends
JV contract with
Continental signed
Development of
segments with high
growth and margin
Acquisition of LED-
driver of Trilux
(# 3 in Germany)
Invest in VCSEL:
Technology lead
expanded
Mobility Horticulture Smart CitiesSensing

OSRAM Licht AG
Q2 FY18 Earnings Release (preliminary, unaudited figures) | May 3, 2018
8
Systematic execution of the strategy at SP
Signing OSRAM Continental
GmbH
Automotive
SSL lighting
Focus Applications SP Strategy
“Drive innovation”
Front lighting,
electronics and sensor
system
Special lighting “Focus and expand ”
Entertainment
and Industry
Automotive
TRAD lighting
“Last man standing”
Market leader
(NAFTA and EMEA)
Grow share in APAC
OS LSSSP
OSRAM Licht AG
Q2 FY18 Earnings Release (preliminary, unaudited figures) | May 3, 2018
9
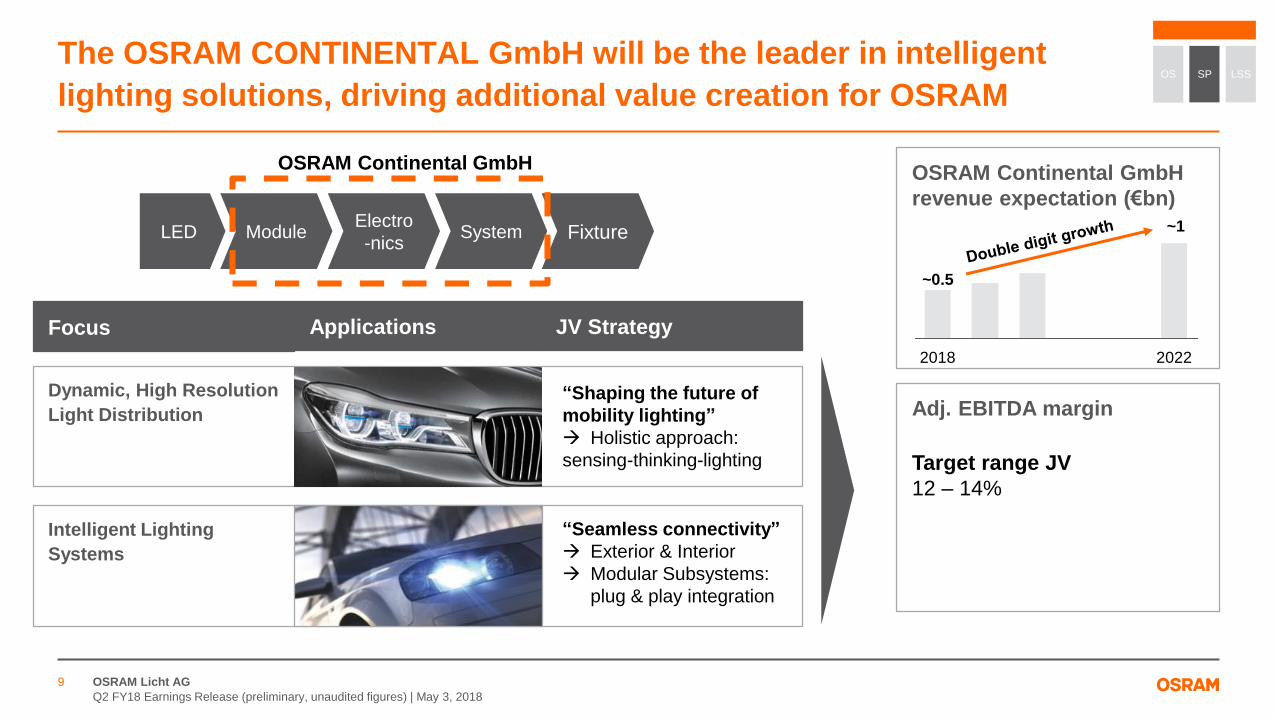
Dynamic, High Resolution
Light Distribution
Focus Applications JV Strategy
Intelligent Lighting
Systems
“Seamless connectivity”
Exterior & Interior
Modular Subsystems:
plug & play integration
The OSRAM CONTINENTAL GmbH will be the leader in intelligent
lighting solutions, driving additional value creation for OSRAM
OSRAM Continental GmbH
revenue expectation (€bn)
Adj. EBITDA margin
Target range JV
12 – 14%
“Shaping the future of
mobility lighting”
Holistic approach:
sensing-thinking-lighting
20222018
~0.5
OS LSSSP
LED ModuleElectro
-nicsSystem Fixture
OSRAM Continental GmbH
~1

OSRAM Licht AG
Q2 FY18 Earnings Release (preliminary, unaudited figures) | May 3, 2018
10
Automotive
SSL lighting
Focus Applications SP Strategy
“Drive innovation”
Front lighting,
electronics and sensor
system
Special lighting “Focus and expand ”
Entertainment
and Industry
Automotive
TRAD lighting
“Last man standing”
Market leader
(NAFTA and EMEA)
Grow share in APAC
Systematic execution of the strategy at SPOS LSSSP
Joint venture with
Continental
Acquisition of Fluence

OSRAM Licht AG
Q2 FY18 Earnings Release (preliminary, unaudited figures) | May 3, 2018
11
Acquisition of Fluence opens growth opportunities in horticulture
Focus Applications SP Strategy
OS LSSSP
Fluence Revenue
expectation (€m)
Adj. EBITDA margin
Target range
>15%
>30
>80ComponentsConnected
Hardware
Farm / Light
Control
Applications on
IoT Platform
Fluence2018 2022
OSRAM
OS
Special lighting “Focus and expand ”
Entertainment
and Industry

OSRAM Licht AG
Q2 FY18 Earnings Release (preliminary, unaudited figures) | May 3, 2018
12
Focus Applications
Visualization
and Sensing
General Lighting
Premium,
IR Emitter, Laser
OS Strategy
“Shape the future”
Win in new
business opportunities
“Gain competitive scale”
“Mega”-sites in
low-cost-locations
(Kulim, Wuxi)
“Grow the core”
Strengthen techno-
logy leadership
Systematic execution of the strategy at OSOS LSSSP
Acquisition of Vixar
3D Sensing incl.
Face Recognition
Gesture/Driver Monitoring
Surveillance Military Medical

OSRAM Licht AG
Q2 FY18 Earnings Release (preliminary, unaudited figures) | May 3, 2018
13
OS offers the broadest product portfolio in the industry including
VCSELOS LSSSP
Consumer
Mobile
3D Sensing incl.
Face Recognition
Autofocus
Smart Glasses
Automotive
Industry
Gesture/Driver Monitoring LIDAR
Surveillance Military Medical Machine vision
VCSEL with multiple applications
exemplary
VIXAR acquisition allows full light emitter offering
Vixar acquisition
LED EEL1) VCSEL
Osram OS existing business
1) EEL = Edge emitting laser.

OSRAM Licht AG
Q2 FY18 Earnings Release (preliminary, unaudited figures) | May 3, 2018
14
Industry
Focus VCSEL strategy
“Drive existing other Vixar business”
Continue specialized business at Vixar
Develop new business opportunities for OS
High potential for profitable growth
Consumer Mobile
& Automotive“Strengthen OS product/technology offering”
Build upon strong know-how & market access
Make use of in-house & sourcing capabilities
EPI Chip Package Module
Foundries
VCSEL value chain: in-house and external capabilities in target state
Design capabilities from EPI to package
OS LSSSP
VCSEL Revenue expectation
(€m)
Adj. EBITDA margin
Target range
>25%
200-300
>15
2018 2022
OSRAM Licht AG
Q2 FY18 Earnings Release (preliminary, unaudited figures) | May 3, 2018
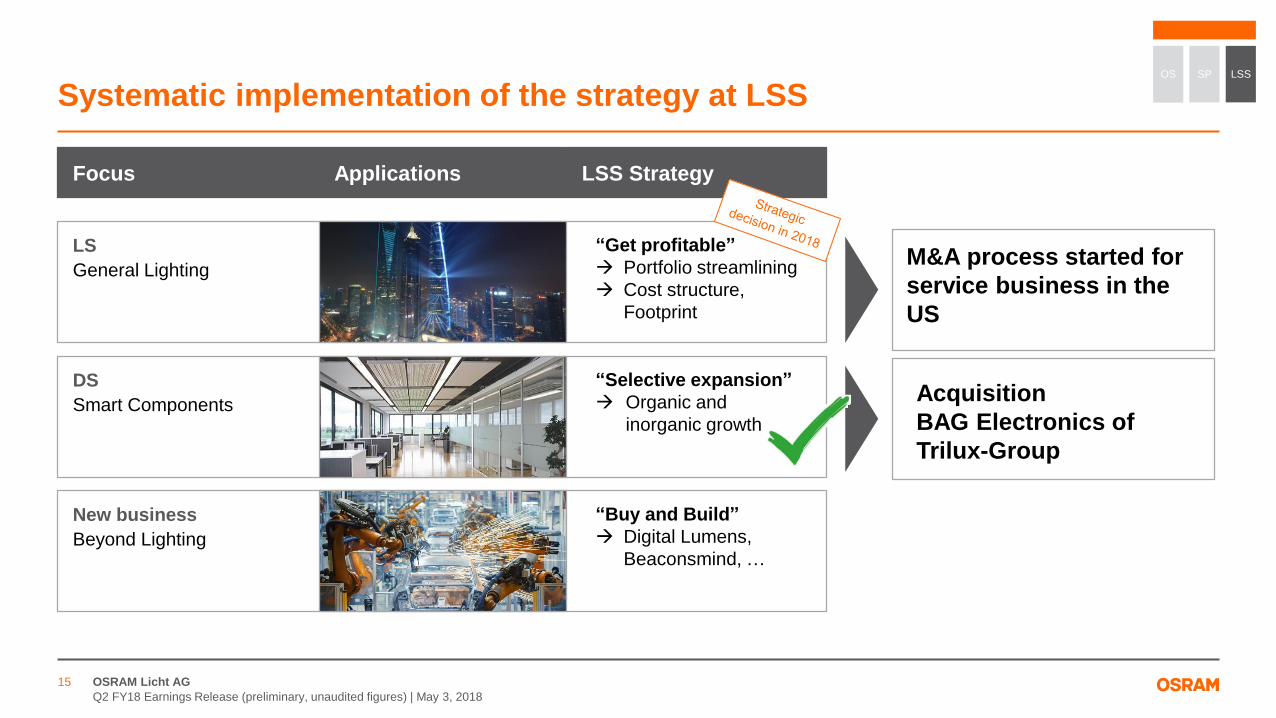
15
New business
Beyond Lighting
“Buy and Build”
Digital Lumens,
Beaconsmind, …
DS
Smart Components
Focus Applications LSS Strategy
“Selective expansion”
Organic and
inorganic growth
LS
General Lighting
“Get profitable”
Portfolio streamlining
Cost structure,
Footprint
Systematic implementation of the strategy at LSSOS LSSSP
Digitale ElektronikM&A process started for
service business in the
US
Acquisition
BAG Electronics of
Trilux-Group

OSRAM Licht AG
Q2 FY18 Earnings Release (preliminary, unaudited figures) | May 3, 2018
16
Driving OSRAM’s profitability
Performance ProgramsStrategy
Structure
New structure
for countries
and BU
sales &
distribution
Differentiation
of HQ and BU
end-to-end
functions
„Lean HQ“
-20%1)
Streamlining
structures
within BUs
Transformation
of
production sites
1) Target of overhead cost reduction (gross savings before cost inflation).

OSRAM Licht AG
Q2 FY18 Earnings Release (preliminary, unaudited figures) | May 3, 2018
17
Efficiency program initiated to support OSRAM’s long-term profitability
Targeted Gross
Savings1)
~ € 40 – 50 million
Drivers Focus
Manufacturing productivity
• Consolidation of SP manufacturing footprint
(“Last Man Standing Strategy“ SP)
• “Future Footprint Concept”
(SP, LSS)
Overhead cost reduction
• Benchmark costs in supporting functions
(e.g. Finance, IT, etc.)
• Address “Stranded Cost” from Ledvance carve-out
• Improve overhead productivity in LSS and SP
FX headwinds
Improve overhead
productivity
Transition towards
high-tech company
Cost of program expected between € 60 – 70 million2)
1) Estimate (before cost inflation).2) Timing pending consultation process; expected within CY 2018 (before tax).

OSRAM Licht AG
Q2 FY18 Earnings Release (preliminary, unaudited figures) | May 3, 2018
18
OSRAM – the long-term growth trend continues
Mid- to long-term:
Global growth trends remain strong for OSRAM
LED-share keeps rising thanks to segments with high
growth and margin
(e.g. Automotive and Smartphones)
OSRAM is excellently positioned as a high-tech player
in the long-term

OSRAM Licht AG
Q2 FY18 Earnings Release (preliminary, unaudited figures) | May 3, 2018
19
Q2 FY18 comparable revenue growth at 1.8%; growth continues for OS; LED components growth in
Automotive limited as destocking continued; SP traditional light sources with expected decline; Market
environment for LSS remains challenging
Q2 FY18 adjusted EBITDA @ 15.1%; negative impact from FX of 130bps and from R&D of 130bps; OS close
to 28% adjusted EBITDA profitability when adjusting for negative FX impact
Free Cash Flow negative with €132m as expected, mainly driven by footprint expansion CAPEX at OS
Q2 FY18 reported EPS at 46 Eurocents; adjusted EPS at 63 Eurocents; negative FX impact of ~19 Eurocents
Special Items in Q2 FY18 EBITDA at €-19m – as expected
Summary financial performance Q2 FY18

OSRAM Licht AG
Q2 FY18 Earnings Release (preliminary, unaudited figures) | May 3, 2018
20
Revenue (€m)
Q2 FY18 revenue level negatively impacted by stronger Euro
Revenue growth Q2 FY18
OSRAM Group: Revenue bridge Q2 FY18 YoY
Nom.
growthFX Portfolio
Comp.
growth
Opto Semiconductors -0.7% -9.1% 1.4% 7.0%
Specialty Lighting -8.7% -7.9% 0.0% -0.8%
Lighting Solutions & Systems -9.0% -7.0% 3.8% -5.8%
Comments
Foreign exchange (FX) impacts largely driven by appreciation of
EUR against USD – EUR/USD @ 1.23 vs. 1.07 in Q2/17
APAC growth driven by OS and LSS
Americas growth driven by SP Aftermarket performance
EMEA growth negative: Reduction in Automotive demand for
Xenon & Halogen; Traditional ballast market with double digit
decline
1.8%
Portfolio
2.8%
FX
-8.3%
Revenue
Q2/17
1,051
Revenue
Q2/18
1,012
Comparable
growth
Regional split Q2 FY18
27.3%
34.5%
38.2%
Americas
APAC
EMEA
Comp. growth
-4.7%
8.2%
2.7%

OSRAM Licht AG
Q2 FY18 Earnings Release (preliminary, unaudited figures) | May 3, 2018
21
Margin continues to be impacted by FX, ramp-up costs and R&D invest
Adjusted EBITDA (€m) / Adjusted EBITDA margin (%)
CommentsAdjusted EBITDA margin Q2 FY18
1) Adjustment for special items (S.I.) includes e.g. transformation costs, substantial legal and regulatory matters, and costs related to mergers and acquisitions activities including the sale of subsidiaries, investments and other businesses.
EUR/USD @ 1.23 in Q2/18 vs. 1.07 in Q2/17
Adjusted EBITDA margin negatively impacted by FX, ramp-up costs
and R&D expenses; positive effect from higher volume
OS excluding FX effect close to 28%
Adjusted EBITDA in Corporate Items: €-17m
Special Items @ €-19m – as expected
Adj. EBITDA
margin
FX impact
YoY
Opto Semiconductors 24.5% -3.3%
Specialty Lighting 14.2% -1.0%
Lighting Solutions & Systems -6.4% 0.2%
Adj. EBITDA
margin Q2/17
17.4%
R&DFX
-1.3% -1.3% 0.3%
Other
15.1%
Adj. EBITDA
margin Q2/18
21
-28
-13
Adj. EBITDA
Q2/17
FX
-12
Ramp-up R&D Volume /
Mix / Other
Adj. EBITDA
Q2/18
183
153
Adjusted1) EBITDA margin Q2 FY18 YoY Adjusted EBITDA Q2 FY18 YoY

OSRAM Licht AG
Q2 FY18 Earnings Release (preliminary, unaudited figures) | May 3, 2018
22
Segments: Key financials Q2 FY18
426430
Q2/17 Q2/18
105124
Q2/18
24.5%29.0%
Q2/17
OS
Revenue (€m) / Comp. growth (%) Adj.1) EBITDA (€m) / Adj. EBITDA margin (%)
557610
Q2/17 Q2/18
7999
14.2%
Q2/17
16.2%
Q2/18
SP
222243
Q2/17 Q2/18
-14
-6.4%
Q2/18
-11
-4.4%
Q2/17
LSS
Comments
OS
Automotive with slow growth as destocking continued;
tough y-o-y comps for Infrared due to limited capacity
High profitability maintained despite negative impacts from FX
(-3.3%), ramp-up costs and higher innovation spend
SP
Strong growth in Aftermarket; continued decline of first
equipment business in traditional light sources (Xenon/Halogen)
as expected; LED Components growth negatively impacted by
destocking in supply chain
Profitability below PYQ mainly due to FX (-1%)
LSS
Market environment in US and EMEA not showing signs of
near-term recovery
Adj. EBITDA impacted by lower volume and elevated price
competition especially in traditional ballast business in EMEA
Structural cost measures ongoing
Actively exploring M&A interest for LS Service business in US
1) Adjustment for special items (S.I.) includes e.g. transformation costs, substantial legal and regulatory matters, and costs related to mergers and acquisitions activities including the sale of subsidiaries, investments and other businesses.
+7.0%
-0.8%
-5.8%

OSRAM Licht AG
Q2 FY18 Earnings Release (preliminary, unaudited figures) | May 3, 2018
23
Free cash flow reflects ongoing capacity investment at OS
Free Cash Flow / Asset Management / Net Liquidity (€m)
CommentsFree cash flow1) Q2 FY18 YoY
Net working capital (days outstanding2)) Q2 FY18 Capital expenditure (percent of revenue) Q2 FY18 YoY
83184
133100
151 (14.9%)
4 13
Q1/18
201 (19.6%)
6 10
Q2/18Q2/17
147
104 (9.9%)
Others /
corporate
LSS
SP
OS
687 725
-694-750
641613
+22.4%
Trade payables
Trade receivables
Inventories
Mar 31, 2018
673 (60)
Dec 31, 2017
550 (48)
-132
5
-138
Q2/18Q2/17
Free cash flow in line with expectations, largely driven by capital
expenditure plan implementation at OS
Increase in inventories mainly at OS; reduction expected in the
second half of FY18
1) Defined as net cash provided by (used in) operating activities less capital expenditure.2) Defined as operating net working capital divided by revenue (last twelve months) times 365 days.

OSRAM Licht AG
Q2 FY18 Earnings Release (preliminary, unaudited figures) | May 3, 2018
24
Reported EPS impacted by FX and Special Items
Earnings per share1) (€) / Net liquidity bridge (€m)
Adjusted2) EPS Q2 FY18 YoY
Reported EPS of €0.46 below PYQ due to FX effect, higher
depreciation and Special Items
FX impact compared to previous year ~19 Eurocent
Tax rate at approx. 28%
Comments
Net liquidity bridge Q2 FY18
63
3081
Cash flow
from disc.
operations
and others
Acquisitions
and financial
investments
-1
Net liquidity
Dec 31, 2017
FCF
-132
Proceeds and
payments
from sales of
business
activities
-107
Dividend
payment
-4
Net liquidity
Mar 31, 2018
Net liquidity driven by higher capital expenditure spend and dividend
payment
Comments
Q2/17
0.12
0.81
FX
0.17
0.46
Q2/18
0.93FX effect
Reported EPS
EPS from S.I.
1) Diluted.2) Adjustment for special items (S.I.) includes e.g. transformation costs, substantial legal and regulatory matters, and costs related to mergers and acquisitions activities including the sale of subsidiaries, investments and other businesses.
0.63
OSRAM Licht AG
Q2 FY18 Earnings Release (preliminary, unaudited figures) | May 3, 2018
25
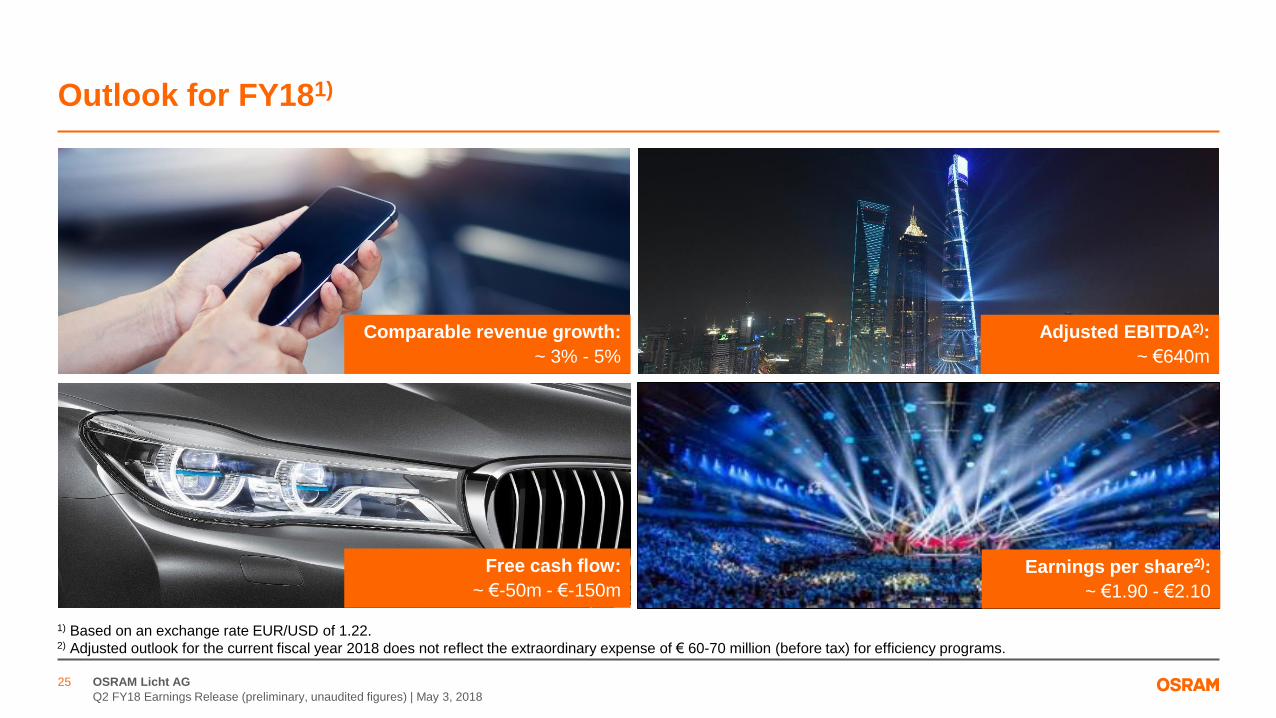
Outlook for FY181)
Comparable revenue growth:
~ 3% - 5%
Adjusted EBITDA2):
~ €640m
Free cash flow:
~ €-50m - €-150m
Earnings per share2):
~ €1.90 - €2.10
1) Based on an exchange rate EUR/USD of 1.22.2) Adjusted outlook for the current fiscal year 2018 does not reflect the extraordinary expense of € 60-70 million (before tax) for efficiency programs.
OSRAM Licht AG
Q2 FY18 Earnings Release (preliminary, unaudited figures) | May 3, 2018
26
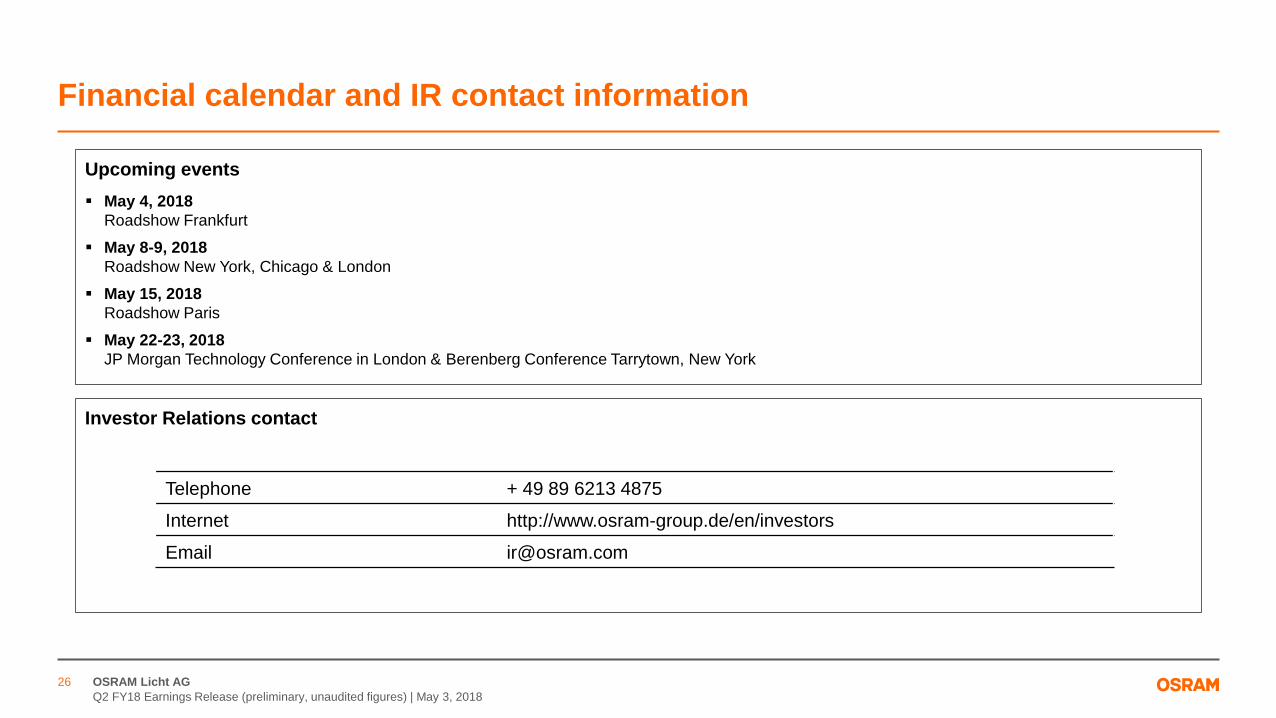
Financial calendar and IR contact information
Upcoming events
May 4, 2018
Roadshow Frankfurt
May 8-9, 2018
Roadshow New York, Chicago & London
May 15, 2018
Roadshow Paris
May 22-23, 2018
JP Morgan Technology Conference in London & Berenberg Conference Tarrytown, New York
Telephone + 49 89 6213 4875
Internet http://www.osram-group.de/en/investors
Email [email protected]
Investor Relations contact
OSRAM Licht AG
Q2 FY18 Earnings Release (preliminary, unaudited figures) | May 3, 2018
27
Appendix

OSRAM Licht AG
Q2 FY18 Earnings Release (preliminary, unaudited figures) | May 3, 2018
28
Key financial metrics
(preliminary, unaudited)
Group (€m) Q2 FY17 Q2 FY18 Change (y-o-y)
nom. -3.7%
Revenue 1,051 1,012 comp. 1.8%
Gross margin 36.2% 34.3% -200 bps
R&D -90 -103 -14.2%
SG&A -176 -177 -0.6%
EBITDA 169 134 -21.0%
EBITDA margin 16.1% 13.2% -290 bps
Adj. EBITDA 183 153 -16.6%
Adj. EBITDA margin 17.4% 15.1% -230 bps
Financial result (including at-equity result) -2 -5 -148.4%
Income before income taxes 113 63 -44.6%
Taxes -34 -17 48.5%
Net income 79 45 -42.9%
Diluted EPS in € 0.81 0.46 -43.2%
Free cash flow 5 -132 n/a
CAPEX -104 -151 -45.9%
Net liquidity 570 63 -88.9%
Equity ratio 59.7% 58.7% -100 bps
Employees (in thousands) 25.9 26.9 4.0%

OSRAM Licht AG
Q2 FY18 Earnings Release (preliminary, unaudited figures) | May 3, 2018
29
Segment overview
(preliminary, unaudited)
1) Net assets on segment level; total assets on group level; CIE includes reconciling items.
Q2 FY18 (€m) OS SP LSS CIEOSRAM
Licht Group
Revenue 426 557 222 -193 1,012
Change % vs. PY reported -0.7% -8.7% -9.0% -3.7%
Change % vs. PY comparable 7.0% -0.8% -5.8% 1.8%
EBITDA 105 74 -23 -22 134
EBITDA margin 24.5% 13.4% -10.3% 13.2%
Special items EBITDA 0 -5 -9 -6 -19
therein transformations costs 0 -3 -8 -4 -15
EBITDA before special items 105 79 -14 -17 153
EBITDA margin before special items 24.5% 14.2% -6.4% 15.1%
Assets1) 1,237 748 322 1,794 4,102
Free cash flow -101 28 -37 -22 -132
Additions to intangible assets and property, plant and equipment 133 13 4 1 151
Amortization 1 4 2 1 7
Depreciation 41 12 6 0 59

OSRAM Licht AG
Q2 FY18 Earnings Release (preliminary, unaudited figures) | May 3, 2018
30
Three months ended March 31 Three months ended March 31
2018 2017
Revenue 1,012 1,051
Cost of goods sold and services rendered -665 -670
Gross profit 347 381
Research and development expenses -103 -90
Marketing, selling and general administrative expenses -177 -176
Other operating income 3 0
Other operating expense -2 0
Income (loss) from investments accounted for using the equity method, net -3 0
Interest income 1 3
Interest expense -2 -3
Other financial income (expense), net 0 -1
Income before income taxes OSRAM (continuing operations) 63 113
Income taxes -17 -34
Income OSRAM (continuing operations) 45 79
Income (loss) from discontinued operation, net of tax -1 -56
Net income 45 23
Attributable to:
Non-controlling interests 1 0
Shareholders of OSRAM Licht AG 44 23
Basic earnings per share (in €) 0.45 0.24
Diluted earning per share (in €) 0.45 0.24
Basic earnings per share (in €) OSRAM (continuing operations) 0.46 0.81
Diluted earning per share (in €) OSRAM (continuing operations) 0.46 0.81
Consolidated statement of income
(preliminary, unaudited)

OSRAM Licht AG
Q2 FY18 Earnings Release (preliminary, unaudited figures) | May 3, 2018
31
Consolidated statement of financial position
(preliminary, unaudited)
As of
March 31
As of
September 30
2018 2017
Assets
Current Assets
Cash and cash equivalents 255 609
Available-for-sale financial assets 2 2
Trade receivables 641 634
Other current financial assets 61 44
Inventories 725 662
Income tax receivables 34 35
Other current assets 120 112
Assets held for sale - 2
Total current assets 1,838 2,100
Goodwill 146 148
Other intangible assets 143 142
Property, plant and equipment 1,578 1,396
Investments accounted for using the equity method 65 66
Other financial assets 13 13
Deferred tax assets 269 314
Other assets 49 59
Total assets 4,102 4,238
As of
March 31
As of
September 30
2018 2017
Liabilities and equity
Current liabilities
Short-term debt and current maturities of long-term debt 26 16
Trade payables 694 752
Other current financial liabilities 32 29
Current provisions 72 75
Income tax payables 92 99
Other current liabilities 311 309
Liabilities associated with assets classified as held for sale - 0
Total current liabilities 1,227 1,280
Long-term debt 168 184
Pension plans and similar commitments 149 150
Deferred tax liabilities 2 10
Provisions 31 32
Other financial liabilities 9 10
Other liabilities 107 111
Total liabilities 1,693 1,778
Equity
Common stock, no par value 105 105
Additional paid-in capital 2,032 2,035
Retained earnings 659 699
Other components of equity -11 5
Treasury shares, at cost -386 -392
Total equity attributable to shareholders of OSRAM Licht AG 2,399 2,452
Non-controlling interests 10 8
Total equity 2,409 2,460
Total liabilities and equity 4,102 4,238

OSRAM Licht AG
Q2 FY18 Earnings Release (preliminary, unaudited figures) | May 3, 2018
32
Three months
ended March 31
Three months
ended March 31
2018 2017
Cash flows from operating activities
Net income 45 23
Adjustments to reconcile net income (loss) to cash provided
Income (loss) from discontinued operation, net of tax 1 56
Amortization, depreciation, and impairments 66 54
Income taxes 17 34
Interest (income) expense, net 2 0
(Gains) losses on sales and disposals of businesses, intangible assets,
and property, plant and equipment, net 0 2
(Income) loss from investments 3 0
Other non-cash (income) expenses 1 0
Change in current assets and liabilities
(Increase) decrease in inventories -40 -25
(Increase) decrease in trade receivables -38 -45
(Increase) decrease in other current assets 11 -7
Increase (decrease) in trade payables -11 45
Increase (decrease) in current provisions 0 2
Increase (decrease) in other current liabilities -17 -46
Change in other assets and liabilities -5 2
Income taxes paid -17 9
Interest received 1 3
Net cash provided by (used in) operating activities - OSRAM
(continuing operations) 19 109
Net cash provided by (used in) operating activities from discontinued
operation -4 -12
Net cash provided by (used in) - OSRAM Licht Group (total) 15 97
Consolidated statement of cash flows
(preliminary, unaudited)
Three months
ended March 31
Three months
ended March 31
2018 2017
Cash flows from investing activities
Additions to intangible assets and property, plant and equipment -151 -104
Acquisitions, net of cash and cash equivalents acquired 0 -10
Purchases of investments -1 0
Proceeds and payments from sales of investments, intangible assets, and
property, plant and equipment 1 0
Proceeds and payments from the sale of business activities 1 388
Net cash provided by (used in) investing activities from continuing
operations -151 275
Net cash provided by (used in) investing activities from discontinued operation – -8
Net cash provided by (used in) investing activities - OSRAM (continuing
operations) -151 267
Cash flows from financing activities
Purchase of treasury stock – -67
Repayment of long-term debt -2 -2
Change in debt and other financing activities -1 -6
Interest paid -1 -1
Dividends paid to shareholders of OSRAM Licht AG -107 -97
Dividends paid to non-controlling interests 0 -3
Net cash provided by (used in) financing activities - OSRAM (continuing
operations) -112 -177
Net cash provided by (used in) financing activities from discontinued
operation – -2
Net cash provided by (used in) financing activities - OSRAM Licht Group
(total) -112 -179
Effect of exchange rates on cash and cash equivalents -1 2
Net increase (decrease) in cash and cash equivalents -249 187
Cash and cash equivalents at beginning of period 504 593
Cash and cash equivalents at the end of period 255 781
Cash and cash equivalents at end of period (consolidated statement of
financial position) 255 781