OSPrey800 - CMIKOREAcmikorea.com/pdf/osprey800.pdf · OSPrey800 S ifi tiSpecifications Excitation -...
22
Oxford Instruments OSPrey800 OSPrey800 Optical Metrology of OSP Coatings OSP Film Thickness & Q alit Anal sis OSP Film Thickness & Quality Analysis ©Oxford Instruments 2006
-
Upload
trinhthuan -
Category
Documents
-
view
213 -
download
0
Transcript of OSPrey800 - CMIKOREAcmikorea.com/pdf/osprey800.pdf · OSPrey800 S ifi tiSpecifications Excitation -...

Oxford Instruments
OSPrey800OSPrey800
Optical Metrology of OSP CoatingsOSP Film Thickness & Q alit Anal sisOSP Film Thickness & Quality Analysis
©Oxford Instruments 2006

Oxford Instruments
Measurement Technique:Spectral ReflectanceSpectral Reflectance
– Subject sample to various wavelengths of light
– Measure reflected light from the surface of coating and substrate
– Correlate wavelength and reflectance value to ti thi kcoating thickness
©Oxford Instruments 2006

Oxford Instruments
SchematicLight Source
Light Out
SpectrometerFiber Optic Cable
Camera
Reflected Light In
Camera
Focus Motor (Z-axis) E l
Lens Assembly
Enclosure
Transmitted and reflected light
SamplePC
©Oxford Instruments 2006

Oxford Instruments
Solving for Coating Thickness
Iterative process with
• Initial input of– Expected thickness rangep g– Roughness (coating and substrate)– Extinction coefficient (coating and substrate)
Refractive index (OSP chemistry)– Refractive index (OSP chemistry)
• Scan wavelength range, 420nm~665nm
• Measure the reflected light intensity ‘R’ and solve for ‘d’
©Oxford Instruments 2006

Oxford Instruments
Spectral Reflectance Basicsp
2Air/OSP/Copper
nd)2Bcos(ARλπ
+≈Air
Reflected Light, R
1 k1)2cos( ndBAR
λπ
+≈
n1, k1
d ⎠⎞
⎜⎝⎛ −
=B
ARcosn2
d 1-λ
n2, k2d ⎠⎝ Bn2π
f ti i diTransmitted Light
ni = refractive indices,
ki = extinction coefficientsAbsorbed Light
©Oxford Instruments 2006

Oxford Instruments
OSPrey800 Analyzery y
©Oxford Instruments 2006

Oxford Instruments
Control UnitOptical Components mounted on a motorized z-stage
PCB / PWB
©Oxford Instruments 2006

Oxford Instruments
20x Optics20x Optics
Probed Area
PCB / PWB
©Oxford Instruments 2006

Oxford Instruments
Thickness Morphology2-D Map of Sample Surface
Each camera pixel measures a discrete region (1µm x 1µm) on a total surface area of 330 µm x 265µm on the sample.
©Oxford Instruments 2006
Thickness (Å)

Oxford Instruments
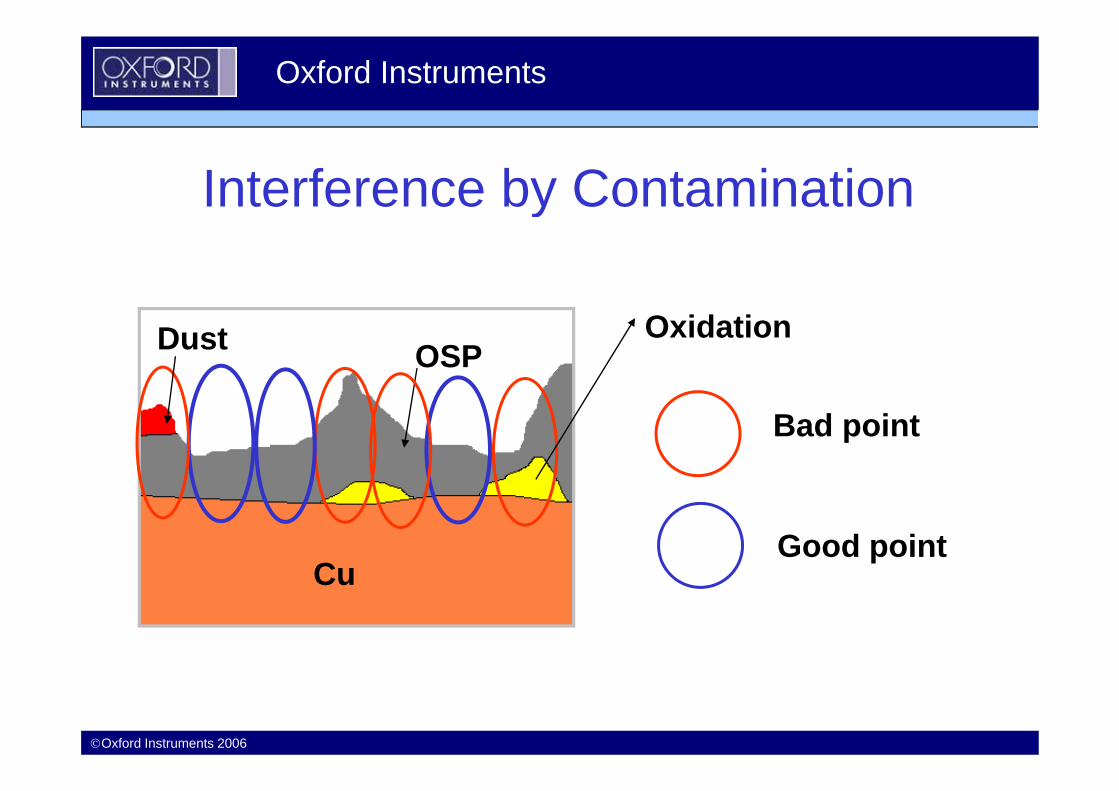
Interference Characterization• A sample spectrum is obtained from each pixel. This
spectrum may or may not produce a valid thicknessspectrum may or may not produce a valid thickness measurement dependent upon the physical properties of the measurement location.
• Individual measurement points may be invalid for one or more of the following reasonsg– Non-uniform OSP thickness distribution– Cu substrate oxidation
Oth ti l t i ti– Other particle contamination– Excessive substrate (Cu) roughness
©Oxford Instruments 2006
Oxford Instruments
Interference by Contaminationy
OSPOxidationDust
Bad point
Good pointCuCu
©Oxford Instruments 2006

Oxford Instruments
Interference by Roughness (r)Problem = “r” value is changingProblem = r value is changing

Oxford Instruments
Goodness of Fit (GOF) Determination
• Blue points represent measured Spectrum from one pixel
spectrum• Red line represents closest
t hi th ti l tmatching theoretical spectrum• Correlation between the two
spectra is quantified with a GOFspectra is quantified with a GOF value
• GOF = 1 perfect correlation• GOF = 0 no correlation
©Oxford Instruments 2006

Oxford Instruments
GOF DeterminationUser can define a GOF threshold to separate “good” from

Oxford Instruments
Goodness of FitSystem iterates to find the best spectral fit for thickness.
©Oxford Instruments 2006
X Poor fit GOF=0.011 Good fit GOF=0.995

Oxford Instruments
2-D Thickness Mapp
GOF value vs. user-defined thresholdGOF badBlack = cannot be measured
accurately
GOF goodThickness is color scaled
Thickness (Å)
Blue = thick
White = thin
©Oxford Instruments 2006
( )

Oxford Instruments
Real-time on-screen feedbackfeedback
M tMeasurement
H d / S ftHardware / Software Interface
©Oxford Instruments 2006

Oxford Instruments
CCD Image 2-D Thickness Mapct
ance
Ref
lec
©Oxford Instruments 2006
Wavelength [nm]

Oxford Instruments
Typical Measurements of ypOSP coatings using OSPrey800
©Oxford Instruments 2006

Oxford Instruments
BGA Sample
Interesting Area of very low OSP coverage
©Oxford Instruments 2006
Oxford Instruments
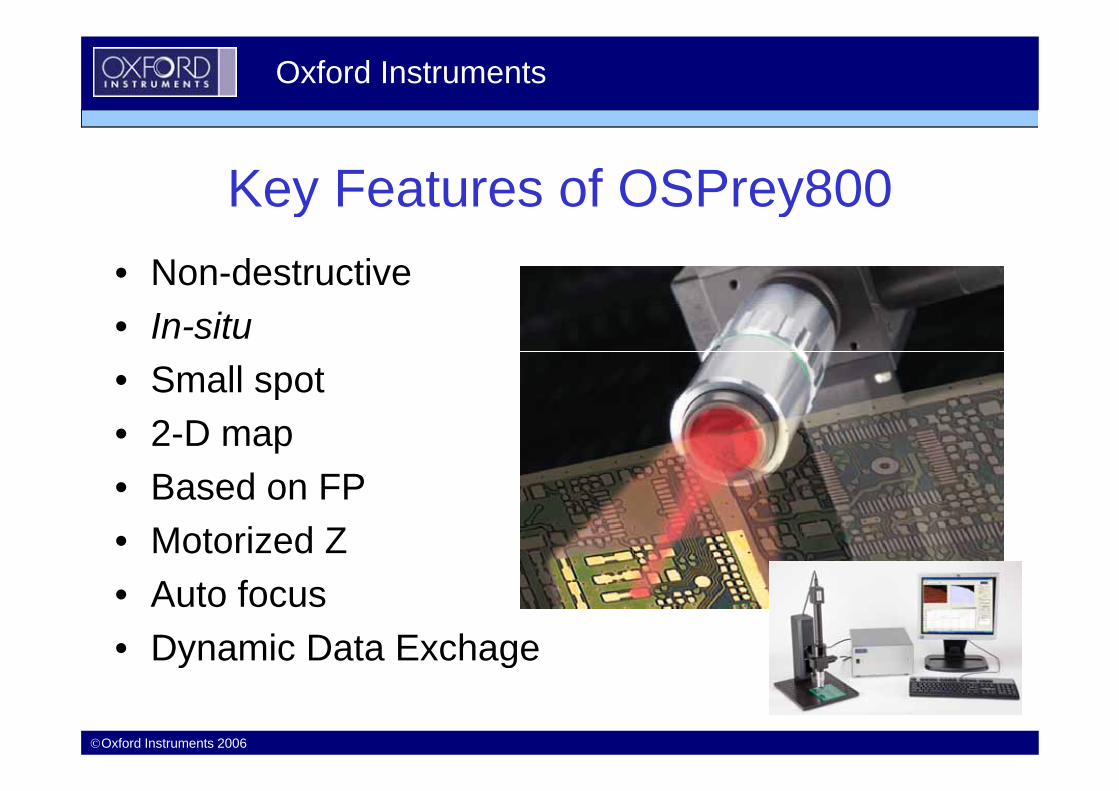
Key Features of OSPrey800y y• Non-destructive • In-situ• Small spotp• 2-D map• Based on FP• Based on FP• Motorized Z• Auto focus• Dynamic Data Exchage
©Oxford Instruments 2006
y g

Oxford Instruments
OSPrey800 S ifi tiSpecifications
Excitation- Multi-wavelength optical excitation 420-
665 nm accessed via notch filterselection from a filament source
Optics- Illumination and imaging system with
- Memory: 1 GB DRAM- Monitor: 1280 X 1024- Operating System: Window XP- Ports: At least two USB 2.0 ports
Power SupplyIllumination and imaging system with 20x optical magnification- Fibre Optic Light Guide 1/8"
Detector- CCD detector.
Analysis
Power Supply- 100-240 V, AC, 50-60 Hz, 230 Watts -
Maximum. Fuse provided: 4A, 250VWorking Environment
- 50°F (10°C) to 104°F (40°C) and up to 98% RH non condensingAnalysis
- Processing of wavelength dependent reflectance spectra from OSP thin-film coated samples- Programmable recipe editor for initial
- 98% RH, non-condensing Sample Stage
- Fixed in-plane XY sample stage- Motorized z-axis optical autofocus
Dimensionsparameter definition
Computer- Pentium D or Pentium 4 Processor with HT Technology- Clock Speed: >/= 3.0 GHz
- Measurement Stage: 25 W x 30 D x 46.5 H (cm)- Controller Unit: 27.5 W x 20.7 D x 14.5 H (cm).
Weight
©Oxford Instruments 2006
p- Front Side Bus (FSB) Speed: >/= 800MHz- Hard Drive Capacity: >/= 80 GB
Weight- Measurement Stage: 6.6 kg (14.5 lbs)- Controller Unit: 5.7 kg (12.5 lbs)

![7 17 Ifi] bbl' UCH 17 17 Ifi] bbl' UCH 1](https://static.fdocuments.net/doc/165x107/5e3e165587e5c433c82c4919/-7-17-ifi-bbl-uch-1-7-17-ifi-bbl-uch-1.jpg)