Osmoregulatory Physiology and its Evolution in the ...
117
University of Connecticut OpenCommons@UConn Doctoral Dissertations University of Connecticut Graduate School 8-24-2016 Osmoregulatory Physiology and its Evolution in the reespine Stickleback (Gasterosteus aculeatus) Jeffrey N. Divino University of Connecticut - Storrs, jeff[email protected] Follow this and additional works at: hps://opencommons.uconn.edu/dissertations Recommended Citation Divino, Jeffrey N., "Osmoregulatory Physiology and its Evolution in the reespine Stickleback (Gasterosteus aculeatus)" (2016). Doctoral Dissertations. 1217. hps://opencommons.uconn.edu/dissertations/1217
Transcript of Osmoregulatory Physiology and its Evolution in the ...

University of ConnecticutOpenCommons@UConn
Doctoral Dissertations University of Connecticut Graduate School
8-24-2016
Osmoregulatory Physiology and its Evolution inthe Threespine Stickleback (Gasterosteusaculeatus)Jeffrey N. DivinoUniversity of Connecticut - Storrs, [email protected]
Follow this and additional works at: https://opencommons.uconn.edu/dissertations
Recommended CitationDivino, Jeffrey N., "Osmoregulatory Physiology and its Evolution in the Threespine Stickleback (Gasterosteus aculeatus)" (2016).Doctoral Dissertations. 1217.https://opencommons.uconn.edu/dissertations/1217

Osmoregulatory Physiology and its Evolution in the Threespine Stickleback (Gasterosteus aculeatus)
Jeffrey Nicholas Divino, PhD
University of Connecticut, 2016
Maintaining ion balance in environments of changing salinity is one of the greatest physiological
challenges facing aquatic organisms and by comparing populations inhabiting different salinity regimes,
we can learn how physiological plasticity evolves in response to local osmotic stress. I characterized the
evolution of osmoregulatory responses in representative marine, anadromous, and freshwater (FW)
populations of Threespine Stickleback (Gasterosteus aculeatus) by comparing survival and physiological
measures in F1-generation fish following salinity challenge. Juveniles from a population landlocked for
~10,000 years displayed ontogenetically-delayed seawater (SW) tolerance, a lower maximum salinity
threshold, and did not upregulate the Na+/K+-ATPase (NKA) ion transporter as much as marine
counterparts (Chapter 1). Stickleback also responded to salinity stress by remodeling their gill epithelium:
I observed a higher density of ionoregulatory cells when juveniles were subjected to both low and high
salinities, and the latter treatment induced strong upregulation of ion secretory cells (Chapter 2). Finally, I
examined the speed at which osmoregulatory plasticity evolves by comparing halotolerance between an
anadromous population and descendants that had been FW-restricted for only two generations (Chapter
3). The lake-introduced group had improved survival in FW, but also retained SW tolerance and had
similar increases in gill NKA activity, gill Na+/K+/2Cl- cotransporter abundance, and organic osmolytes in
SW. Overall, the differentiated responses to salinity I observed among stickleback populations indicate
that osmoregulation has evolved in a manner consistent with local adaptation and following FW
invasions, positive selection on FW tolerance acts more rapidly than relaxed selection on SW tolerance.

i
Osmoregulatory Physiology and its Evolution in the Threespine Stickleback (Gasterosteus aculeatus)
Jeffrey Nicholas Divino
B.S., Gordon College, 2002
M.S., University of Alberta, 2005
A Dissertation
Submitted in Partial Fulfillment of the
Requirements for the Degree of
Doctor of Philosophy
at the
University of Connecticut
2016

ii
Copyright by
Jeffrey Nicholas Divino
2016

iii
APPROVAL PAGE
Doctor of Philosophy Dissertation
Osmoregulatory Physiology and its Evolution in the Threespine Stickleback (Gasterosteus aculeatus)
Presented by
Jeffrey Nicholas Divino, B.S., M.S.
Major Advisor ___________________________________________________________________
Eric T. Schultz
Associate Advisor ___________________________________________________________________
John A. Baker
Associate Advisor ___________________________________________________________________
Elizabeth L. Jockusch
Associate Advisor ___________________________________________________________________
Stephen D. McCormick
Associate Advisor ___________________________________________________________________
J. Larry Renfro
University of Connecticut
2016

iv
Acknowledgements
To complete a dissertation, you cannot simply work on it; you must be married to it. This is highly
problematic for graduate students who are already married! So I must first thank my patient and
understanding wife, Tatyana, for putting up with my polygamy for six of our 13 years of marriage.
Moreover, we had a child during the first and last years of this degree, and I would like Sofia and young
Nathan to know that I cherish them and was thinking of them even while away from home. Though I
strove to maximize my time spent with them when I was not conducting research, studying for classes,
and teaching, it breaks my heart to think of the precious moments I missed of their early life stages now
gone by. But I am pleased to have more family time now that I am no longer a Professional Student. I also
look forward to the day my children will read this book and discover all that I was working on when I
disappeared for long stretches of the day (or week!).
Quite certainly, this dissertation could not have been completed without the support of my
immediate and extended family, primarily those who provided child care. I am indebted to my in-laws
Valentina and Alex Krasnoshek, as well as the rest of the Krasnoshek Clan: Vickie, Lena, and now Aide.
(Surely if you sat through the defense seminar rehearsal I gave from my living room television, you
should be mentioned here by name.) I also express my gratitude to my parents, Mimmo and Karen Divino
who have always prioritized my education and, especially nearing the end of my degree, insisted on
repeatedly making the 2-h drive from their home to mine to help out with domestic needs…despite facing
risks of highway breakdown in cars that were driven 0.25-0.5 million miles! I have been encouraged by
many other well-wishing friends and family, including my sister Ariane and aunt Linda, who both
traveled great distances to come to my defense.
Now to take an academic turn, I wish to express my appreciation for the three professors whose
mentorship has most strongly influenced the direction of my professional life in ecology: Dorothy Boorse,
my undergraduate advisor at Gordon College, William Tonn, my Master’s advisor at the University of
Alberta, and now Eric Schultz, who has been so much more than a PhD advisor at UConn. My
relationship with Eric began when I joined his lab to research fecundity in river herring, and this side

v
project eventually blossomed into a publication and several conference presentations. Later, Eric was at
the forefront of an exciting new collaboration with several researchers investigating the evolution of
salinity tolerance in Threespine Stickleback and he brought me to one of their initial meetings. After
recognizing that the potential for discovery in this largely unexplored area was limitless, I immediately
made it the subject of my dissertation and began to carve out my own research niche under Eric’s expert
guidance. I appreciated his hands-off approach to overseeing student-driven research. However, he also
provided more direct aid when my burgeoning PhD project left me buried in gill samples generated from
large-scale experiments on more than 10,000 juvenile fish. After my personal realization (one faced by
most graduate students) that multiple lifetimes would be required to pursue every burning question and
perform all intriguing analyses, Eric helped me reassess my project goals and transform my mounting
anxiety into a clear plan of action. Out of our constructive discussions emerged a research framework that
optimized merit and achievability and culminated in these chapters.
Eric is deeply invested in both the professional and personal well-being of his students and he
consistently demonstrated that he has my best interests in mind and, throughout my program, has always
reserved (and sometimes made) time to meet with me to converse about all things related to my research,
grad school life, career goals, and more. Eric also sets high standards for his students and his challenging
and copious editorial suggestions have substantially improved my writing and my presentation skills. By
addressing his insightful questions, I became a better scientist with the knowledge and confidence to stand
behind the validity, interpretation, and significance of my findings, as well as critically evaluate and
discuss the work of scientific peers.
I also thank the other members of my Graduate Advisory Committee, John Baker, Elizabeth
Jockusch, Stephen McCormick, and Larry Renfro, whose unique areas of expertise improved my
dissertation research in different ways. Thank you for being available particularly when urgencies arose,
and I hope to remain in professional contact with each of you, having now – as was put during my
defense examination – crossed over from student to colleague.

vi
Science is not a solitary endeavor, especially when the study populations are 3,500 miles away! I
am deeply thankful to John Baker (Clark University), Michael Bell (Stony Brook), and Frank von Hippel
(University of Alaska Anchorage) who collected the parental generation of wild Threespine Stickleback
from remote sites in Alaska. Under these principal investigators labored students and technicians led by
Justin Golub, Miguel Reyes, Jennifer Rollins, Daniella Swenton, and Matthew Wund. These field crews
shipped to our lab with more than 16,700 F1-generation embryos over four summers of research, which
my team and I reared and used in a multitude of experiments. And let me not overlook the study
organism! I thank the many stickleback that made the ultimate sacrifice for the advancement of our
scientific understanding. All stickleback entrusted to my care were treated with respect, and I gathered as
much information as possible from them to generate the valuable data I report in this volume.
My own blood, sweat, and tears could only get me so far with this ambitious project. Researchers
with differing specializations mutually benefit when they work together. I thank my major collaborators
Steve McCormick (Conte Anadromous Fish Research Center), Michelle Monette (Western Connecticut
State University), and Paul Yancey (Whitman College), in whose labs many of my samples were
processed on the way to making important molecular discoveries that enriched this study and also formed
lasting professional bonds and friendships. During my trips to Conte, I received expert training from
Michael O’Dea (1962-2014) and Amy Regish. At the other institutions, Aiden Ford, Socheata Lim,
Robert Toth, and Kyle Flannery provided more helping hands with extensive sample processing.
Closer to home, I thank the many Schultz Lab members who served as assistants with fish care,
data collection, or provided advice over the years of this study. These include the comrades who
languished with me for countless hours in the windowless confines of the Fish Room: my older lab
brother Jonathan Velotta and five trusty sidekicks who, in addition to helping me, conducted independent
stickleback-related projects between 2010 and 2015: Dante Paolino, David Fryxell, Silvana Luongo,
Sammy Beynor, and Zachary Skelton. I am also grateful to graduate student lab mates Justin Davis,
Michael Smircich, Kasey Pregler, Lauren Barbieri, Jacob Kasper, in addition to the many undergraduate
students that advanced the osmoregulatory cause: Nicolle Murphy, Steven Ehrlich, Megan Cruz, Cody

vii
Roberge, Emmanuel Seow Tzer Yeun, Nishita Patel, Grace Casselberry, Rebecca Colby, Emily Funk, and
Marat Vasilenko. More broadly, I thank my fellow graduate students and the helpful administrative staff
in UConn’s Department of Ecology and Evolutionary Biology (EEB), as well as logistical support from
Biology Central Services, and the Aquatics Facility.
The experiments I present here could not have been performed without financial support, which
was used to purchase supplies ranging from fish nets to reagents for molecular assays. Generous funding
came through a Multidisciplinary Environmental Research Award from UConn’s Center for
Environmental Sciences and Engineering, the John Rankin Scholarship Fund to EEB and the Connecticut
State Museum of Natural History, a Grants-in-Aid of Research award from Sigma Xi, and MVAO.
Lastly, it is with humility that I recognize that not everyone gets to spend their time trying to
understand the natural world. I consider myself privileged to have had both the academic ability and the
opportunity to pursue scholarly goals and enjoy a fulfilling career in ecological education and research.
“I do not feel obliged to believe that the same God who has endowed us with senses, reason, and intellect
has intended us to forgo their use and by some other means to give us knowledge which we can attain by
them.” – Galileo Galilei, 1615
viii
Contents
Statement of Author Contributions ............................................................................................................... 1
Preface .......................................................................................................................................................... 3
Chapter 1: Osmoregulatory divergence in Threespine Stickleback ecotypes: effects of early ontogeny
and salinity acclimation on halotolerance and gill Na+/K+-ATPase activity .............................................. 11
Introduction ............................................................................................................................................. 11
Materials & Methods .............................................................................................................................. 14
Results ..................................................................................................................................................... 20
Discussion ............................................................................................................................................... 23
Tables & Figures ..................................................................................................................................... 32
Chapter 2: Characterizing population- and salinity-dependent divergence in gill ionocyte composition
among Threespine Stickleback ecotypes using scanning electron microscopy .......................................... 47
Introduction ............................................................................................................................................. 47
Materials & Methods .............................................................................................................................. 50
Results ..................................................................................................................................................... 53
Discussion ............................................................................................................................................... 54
Tables & Figures ..................................................................................................................................... 58
Chapter 3: Osmoregulatory physiology and rapid evolution of salinity tolerance in Threespine
Stickleback recently introduced to fresh water ........................................................................................... 70
Introduction ............................................................................................................................................. 70
Materials & Methods .............................................................................................................................. 74
Results ..................................................................................................................................................... 80
Discussion ............................................................................................................................................... 83
Tables & Figures ..................................................................................................................................... 90
Literature Cited ........................................................................................................................................... 98

1
Statement of Author Contributions
Chapter 1: Osmoregulatory divergence in Threespine Stickleback ecotypes: effects of early ontogeny
and salinity acclimation on halotolerance and gill Na+/K+-ATPase activity
Content in this dissertation chapter will be included in a manuscript with the following authors:
Jeffrey Divino, Stephen McCormick, and Eric Schultz
Author Contributions:
Study Conception & Design – JD, ES, SM
Funding Acquisition – JD, ES
Data Collection – JD, ES, SM
Analysis & Interpretation – JD, ES, SM
Writing of Original Draft – JD
Chapter 2: Characterizing population- and salinity-dependent divergence in gill ionocyte composition
among Threespine Stickleback ecotypes using scanning electron microscopy
Content in this dissertation chapter will be included in a manuscript with the following authors:
Jeffrey Divino, Dante Paolino, Silvana Luongo, Zachary Skelton, and Eric Schultz
Author Contributions:
Study Conception & Design – JD, ES
Funding Acquisition – JD, ES, DP, SL
Data Collection – DP, SL, JD, ES
Analysis & Interpretation – JD, DP, ZS, SL, ES
Writing of Original Draft – JD

2
Chapter 3: Osmoregulatory physiology and rapid evolution of salinity tolerance in Threespine
Stickleback recently introduced to fresh water
A manuscript version of this dissertation chapter has been published with the following citation:
Divino JN, Monette MY, McCormick SD, Yancey PH, Flannery KG, Bell MA, Rollins JL, von Hippel
FA, Schultz ET (2016) Osmoregulatory physiology and rapid evolution of salinity tolerance in
threespine stickleback recently introduced to fresh water. Evol Ecol Res 17:179-201
Author Contributions:
Study Conception & Design – JD, ES, SM, MB, FvH
Funding Acquisition – JD, ES, MM, MB, JR
Data Collection – JD, ES, MM, SM, PY, KF, with fieldwork from MB, JR, FvH
Analysis & Interpretation – JD, ES, MM, SM, PY, KF
Writing of Original Draft – JD
Critical Manuscript Revision – JD, ES, MM, SM, PY, MB, FvH
Final Manuscript Approval – JD, MM, SD, PY, KF, MB, JR, FvH, ES

3
Preface
Euryhalinity & osmoregulation in fishes.— Aquatic organisms must continually contend with water and
ion imbalances imposed by an environmental osmotic pressure, which is often different than that of their
tissues and may fluctuate across relatively short spatial and temporal scales. This physiological problem
can be fatal if the internal-external osmotic gradient is great, but can be mitigated through the energy-
consuming task of osmoregulation (reviewed by Marshall & Grosell 2006). Euryhalinity is the ability of
an organism to detect changes in environmental osmolality and respond rapidly and appropriately to
maintain ion homeostasis across a wide salinity spectrum. Euryhalinity is an important evolutionary
innovation that facilitated range expansion by ancestrally marine or estuarine taxa into freshwater (FW)
halohabitats (Lee & Bell 1999). For example, in fishes, the most diverse group of vertebrates, an
estimated 3-5% of species are euryhaline, approximately a third of which are diadromous (Helfman et al.
2009; McCormick et al. 2013a). Colonization of FW habitats by euryhaline fishes has often yielded
prolific radiations in geographically isolated and heterogeneous FW lakes and streams, such as by
catfishes and cyprinids (Betancur-R 2010; Nakatani et al. 2011). In fact, the disproportionality of FW
species is exceedingly large: 43% of all fish diversity (~12,000 species) is found exclusively in FW,
which makes up <0.01% of the Earth’s available water (Nelson 2006). The high potential for evolutionary
divergence following the invasion of disconnected FW systems by founding euryhaline species dispersing
across marine environments has made this subset of fishes important for cladogenesis (Schultz &
McCormick 2013).
Selection on osmoregulation.— Comparisons of the characteristics of the osmoregulatory response across
species or among salinity-divergent populations allow tests of fundamental predictions concerning the
pace and outcome of evolution of halotolerance. When a population of marine or anadromous colonizers
becomes geographically stranded in FW (i.e., landlocked), positive selection for enhanced performance in
ion-poor conditions is intense, since survival is contingent on maintaining homeostasis. Consequently,
FW tolerance is expected to improve rapidly as landlocked descendants adapt to local FW conditions.

4
Selection for SW tolerance, meanwhile, is no longer imposed on the landlocked population, and thus
euryhalinity might erode through mutation accumulation in the gene networks associated with hypo-
osmoregulation (Snell-Rood et al. 2010). However, the evolutionary effects of this relaxed selection are
less clear because they depend on maintenance costs and degree of pleiotropy of the genes essential for
hypo-osmoregulation (Lahti et al. 2009). If energetic costs to maintain a functional osmoregulatory
response to high salinity are high, or the genes involved largely reside in a distinct regulatory module (or
both), then loss of these traits should be more rapid than if costs are small and/or genes were highly
integrated within networks necessary for the fish to function in FW.
Field sampling and salinity challenge experiments have provided empirical evidence for
evolutionary differences in halotolerance indicative of local adaptation among populations evolving under
divergent salinity regimes. For example, when Mummichog (Fundulus heteroclitus) occupying headwater
reaches of the Potomac and James Rivers were exposed to SW, they had lower survival, greater osmotic
stress, and a dampened transcriptomic response compared to estuarine counterparts in the Chesapeake
Bay (Whitehead et al. 2011, 2012). In a related genus, expression profiles of osmoregulatory genes
between two sister species of fundulids corresponded to their divergent halohabitats. The euryhaline
Rainwater Killifish (Lucania parva) has a broad coastal range that includes the full FW-SW gradient,
whereas the Bluefin Killifish (L. goodei) is restricted to FW lakes. Berdan and Fuller (2012) found that,
compared to Rainwater Killifish, the species under relaxed selection for SW tolerance failed to upregulate
a suite of hypoosmoregulatory genes when exposed to SW. Similar halohabitat transitions exist among
populations of Clupeidae, which have also resulted in divergence in osmoregulatory capacity. Compared
to ancestral anadromous Alewives (Alosa pseudoharengus), derived landlocked populations have lower
survival and higher osmotic imbalance when challenged with SW (Velotta et al. 2014).
Halotolerance also differs along the axis of ontogeny, particularly in diadromous species, and
early life stages are often the most vulnerable to perturbations in salinity regime. SW tolerance is
generally positively correlated with size and age in most euryhaline fishes (Zydlewski & Wilkie 2013),
and may be linked to entry into a new developmental stage, as most notably exhibited in the parr-smolt

5
transformation in juvenile salmonids (McCormick 2013). Since landlocked juveniles remain in FW
beyond the natural timing of their outmigration to SW, comparative studies on evolution of the
osmoregulatory system should include these young age-classes.
From performance to mechanism.— The precise physiological mechanisms by which euryhaline fishes
adjust their osmoregulatory systems have been intensively studied in several groups of teleosts: eels,
clupeids, salmonids, killifish, and tilapia (reviewed by Evans et al. 2005; McCormick et al. 2013a). To
combat osmotic stress at the cellular level, cells regulate their internal osmolality and volume by adjusting
electrolyte and osmolyte concentrations (Kültz 2012). At the organismal level, the gill, kidney, and gut
epithelia work together to more efficiently restore and maintain ion homeostasis of the surrounding
extracellular fluid, which buffers the cells against osmotic perturbations. For example, on the vascularized
surface of the gill, specialized ion transporting cells called ionocytes secrete excess ions from circulating
plasma (hypo-osmoregulation) or take up ions from the environment (hyper-osmoregulation) to
compensate for diffusive ion gains in seawater (SW) or losses in FW. These cell types differ markedly in
their morphology and euryhaline fishes can plastically switch from hypo- to hyper-osmoregulation by
remodeling their ion-exchanging epithelia upon entering new halohabitats (McCormick 2001; Kaneko &
Hiroi 2008). Osmoregulatory responses trigger cell signaling cascades that alter gene expression within
hours of perception of a change in environmental osmolality (Kültz 2012, 2013; Whitehead et al. 2012),
and gill epithelial remodeling may become evident after one day of exposure to a new salinity (Hiroi et al.
2005). However, full acclimation usually requires several weeks and involves transporter rearrangement
and ionocyte recruitment (e.g., Evans 2010; Christensen et al. 2012).
A growing body of cellular physiological research has produced detailed models of branchial
ionocyte function via identification and mapping of key membrane-bound transporters. The basolateral
sodium-potassium ATPase pump (NKA) plays a critical role in both hypo- and hyper-osmoregulation
because it establishes a negative membrane potential inside the ionocyte and establishes a strong sodium
gradient that can drive the work of secondary co-transporters and exchangers. Current models of hypo-

6
osmoregulation appear to be highly similar across taxa, pairing basolateral sodium-potassium-chloride
cotransporter (NKCC) and apical cystic fibrosis transmembrane conductance regulator (CFTR) for
chloride secretion (reviewed by McCormick 2001; Edwards & Marshall 2013). The consequent build-up
of apical chloride facilitates paracellular extrusion of sodium (Kaneko & Hiroi 2008).
In contrast, ion transport models of hyper-osmoregulation are more taxon-specific and involve
combinations of distinct ionocyte cell types, which are specialized for absorbing sodium or chloride from
ion-poor environments. In FW, ion uptake may be enhanced by an apical vacuolar-type hydrogen ATPase
(VHA), whose active extrusion of protons makes absorption of cations more favorable electrochemically
(Lee et al. 2011). Sodium may enter the cell via an apical sodium-hydrogen exchanger (NHE), a sodium-
chloride cotransporter (NCC), or an acid-sensing ion channel (ASIC; Dymowska et al. 2012, 2014).
Interestingly, NKCC has also been identified in some FW ionocyte sub-types (Hwang & Lin 2013; Hsu et
al. 2014).
Research objectives.— My research goal was to characterize how euryhalinity has evolved following
halohabitat transitions by examining salinity-, age-, and population-dependent differences in the
euryhaline Threespine Stickleback (Gasterosteus aculeatus; henceforth “stickleback”). Across its
circumpolar range, stickleback have a well-documented history of parallel evolution following transitions
from marine to FW habitats, many of which became landlocked following post-glacial rebound. These
colonization events and subsequent ecological adaptation have become a prime example of contemporary
ecological speciation by giving rise to a replicated set of derived FW populations whose ages vary from
the post-glacial Pleistocene (10,000-20,000 years ago) to only a few generations (Bell & Foster 1994;
Bell et al. 2004; Baker et al. 2010). I am especially interested in how osmoregulatory plasticity and
halotolerance breadth change in derived FW populations that no longer experience saline environments.
The core objective of my dissertation is summarized in the following question: How does the
interplay between genetics, environment, and ontogeny affect the physiology underpinning salinity

7
tolerance? This principal question can be unpacked into questions that isolate four main effects expected
to influence evolution of the stickleback’s osmoregulatory system:
1. How does salinity treatment - be it acute change or gradual acclimation - affect osmoregulation?
2. How do temporal dynamics of the osmoregulatory response change as inexperienced fish acclimate
to new salinities?
3. Does early ontogeny influence halotolerance/-preference?
4. How do marine, anadromous, and freshwater stickleback populations differ in their range of
osmoregulatory capacity, and how quickly does divergence evolve?
To answer these questions, I raised the offspring of stickleback from marine, anadromous, and lake sites
in common salinity environments. Juvenile fish at various life stages were then subjected to either a
foreign salinity or a salinity preference chamber to evaluate halotolerance or halo-preference,
respectively. I measured effects of evolution on osmoregulatory function at multiple scales, ranging from
organismal performance down to cellular and molecular composition of osmoregulatory machinery. By
taking this multi-level approach, I characterized some of the physiological differences that may underlie
the stickleback radiation. At each level of analysis, I assessed the mark of selection on osmoregulation by
comparing populations in both the ancestral and derived salinities. Differences in the slope of reaction
norms revealed interplay between alternative modes of selection acting at each condition. For example,
following the transition from anadromy to FW, positive selection on enhanced FW tolerance in lake
stickleback resulted in rapid divergence in response variables relative to ancestral groups, whereas relaxed
selection on SW tolerance led to slower emergence of differences among populations.
The stickleback as an appropriate physiological model.— The persistence of the SW-adapted lineage of
ancestral marine/anadromous phenotypes has allowed evolutionary biologists to make direct experimental
comparisons between ancestral and derived forms to aid our understanding of the evolutionary
consequences of halohabitat transitions. The majority of this research has been focused on characterizing
the rapid evolution of lateral plate and pelvic morphology, trophic specialization, and reproductive

8
behavior observed following FW colonization events (McKinnon & Rundle 2002; Colosimo et al. 2005;
Aguirre et al. 2008; Foster et al. 2008; Arnegard et al. 2014). However, selective pressures acting on the
osmoregulatory physiology of a stickleback in FW is likely stronger than those imposed on its
morphology or life history, since disruption of ion homeostasis would be fatal within days if left
unmitigated. Thus, intense selection on the colonizers’ ability to initiate a rapid and appropriate
osmoregulatory response may represent the first fitness hurdle that must be cleared for successful
establishment in the new environment. Subsequently, if osmoregulatory plasticity is lost through
adaptation and/or relaxed selection within a restricted FW halo-niche, then local salinity regime could
also contribute to divergence between marine and lake-resident stickleback.
In one of the first direct examinations of divergence in halotolerance between these ecotypes,
Heuts (1946) found population-specific differences in egg survival that correlated with approximately
native salinity. Other researchers detected salinity-dependent survival in egg and larval stages (Campeau
et al. 1984; Belanger et al. 1987), or measured factors influencing salinity preference (Baggerman 1957;
Audet et al. 1985). But these later organismal-level studies lacked population contrasts and often did not
probe any physiological mechanisms (Guderley 1994). Schaarschmidt et al. (1999) attempted to address
this problem by examining osmolyte and gill enzyme activity levels following salinity challenges of
marine and stream populations in northern Germany. Although the authors linked poor survival of marine
fish in a cold FW treatment to a drop in the osmolyte taurine, they did not identify any other physiological
differences between the populations. Recent work has shown that ancestral and derived phenotypes
exhibit divergence in osmoregulatory genes (DeFaveri et al. 2011; Shimada et al. 2011; Jones et al.
2012b) as well as osmoregulatory gene expression (McCairns & Bernatchez 2010; Taugbøl et al. 2014;
Wang et al. 2014).
Nonetheless, given the potential importance of salinity for shaping the stickleback radiation, the
lack of physiological data on this prolifically-studied species is surprising. For example, the absence of
osmoregulatory data on stickleback from the recent Fish Physiology volume Euryhaline Fishes
(McCormick et al. 2013a) underscores the need to investigate the physiological underpinnings that

9
enabled migrating ancestral stickleback populations to survive their initial passage into ion-poor
environments and to assess how rapidly these traits have evolved in isolated FW systems. Moreover, the
diversity of FW ionocyte cell-types described in other euryhaline species suggests that osmoregulatory
adaptations are phylogenetically-dependent, so the stickleback cannot be assumed to have followed the
same evolutionary trajectory as other orders of fishes.
There are numerous advantages of using the stickleback as a model for investigating
physiological evolution. First, the availability of the extant ancestral stock allows side-by-side
comparisons of marine, anadromous, and independently-derived FW-resident populations. Because lake
populations vary in age of colonization and include several recent introductions, I can test the pace of
evolution of the osmoregulatory system in real time. Moreover, the relative ease of rearing stickleback in
the laboratory is conducive for conducting “common garden” experiments, which control for
environmental variables. Large-scale laboratory manipulations also enable high throughput sampling of
integrated, multi-level (molecular/cellular, tissue, systems and organismal) targets: survival and
behavioral data can be gathered on large numbers of individuals held at multiple salinity treatments, while
osmoregulatory organs can be collected for examining potential mechanistic causes for observed
differences in performance. For example, gill tissue can be allocated for a suite of molecular assays, such
as osmoregulatory gene and protein expression or localization, enzyme activity, and scanning electron
microscopy of ionocytes. And because the stickleback has a well-annotated genome (Ensembl 2016),
putative osmoregulatory genes can be readily targeted for designing gene- or protein-specific probes.
Overview of research framework.— Our knowledge of evolutionary adaptation, behavioral ecology, and
population genetics has been far advanced through many decades of intensive study of the Threespine
Stickleback radiation. My unique contribution to this large body of research was to investigate a still-
unoccupied niche of physiological divergence, which I directly linked to organismal performance. I
adopted a biologically holistic approach to examining stickleback osmoregulation: I quantified divergence
in osmoregulatory machinery at the molecular, cellular, and tissue levels, while also documenting impacts

10
of osmotic stress on whole-organism physiology and performance. In a related set of experiments, I
measured salinity preference behavior by allowing juvenile stickleback to select from among several
conditions. All experiments were conducted on multiple populations and larval age-classes to assess
osmoregulatory evolution and plasticity as a function of early development. This broad analytical scope
can be lacking in reductionist osmoregulatory studies focused on measuring a narrow set of responses in a
more limited number of treatments.
Although I studied osmoregulatory evolution in the laboratory, my findings apply to wild
populations. First, clutch families were generated from at least 8-10 pairs of wild-caught parents, which
adequately captured population-level differences in genotypes. Second, the treatments I chose for the
salinity challenge experiments are ecologically relevant and reflect environmental conditions under which
selection naturally operates on the osmoregulatory system. Additional hypersaline treatments revealed
potential variation in osmoregulatory capacity among divergent stickleback populations, which may only
manifest when these euryhaline fish are subject to severe osmotic challenge.
My research is valuable to integrative organismal biologists in general because it unites multiple
levels of physiological responses to provide functional (mechanistic) explanations, which I interpret in an
evolutionary context. My work is especially relevant to researchers interested in understanding how the
environment influences complex phenotypes along developmental trajectories, identifying criteria by
which plasticity is maintained or lost, describing functional correlations among traits, or defining how
emergent traits arise from interactions at lower levels of organization (Martin et al. 2015).

11
Chapter 1
Osmoregulatory divergence in Threespine Stickleback ecotypes: effects of early ontogeny and
salinity acclimation on halotolerance and gill Na+/K+-ATPase activity
Introduction
The capacity of euryhaline organisms to rapidly and appropriately respond to changes in environmental
salinity has played a key role in the evolutionary diversification of aquatic life (Lee & Bell 1999; Schultz
& McCormick 2013). As halohabitat generalists, euryhaline organisms have greater potential for
geographic range expansion because they can cross osmotic barriers impassable to species intolerant of
certain salinity levels or large salinity fluctuations. Consequently, euryhalinity is commonly associated
with aquatic invasive species (Ricciardi & MacIsaac 2000). Darwin observed that many fishes have large
spatial distributions that span salinity boundaries, and he recognized that euryhalinity confers great
dispersal advantage and evolutionary potential: “there is hardly a single group of fishes confined
exclusively to fresh water, so that we may imagine that a marine member of a fresh-water group might
travel far along the shores of the sea and subsequently become modified and adapted to the fresh waters
of a distant land” (Darwin 1859). Colonization of isolated freshwater (FW) habitats by marine fishes is of
great interest to evolutionary biology because it often leads to radiations (Bell & Foster 1994; Betancur-R
2010; Nakatani et al. 2011).
Following the halohabitat transition to FW residency, the impact that local salinity regime has on
shaping physiological adaptation involves an interplay between positive selection on FW tolerance and
relaxed selection on seawater (SW) tolerance, which bears consequences for euryhalinity. Selection on
hyper-osmoregulatory processes should be strong because the derived population must survive constant,
ion-poor conditions. In contrast, the strength of relaxed selection on SW tolerance is less certain because
it depends on the fitness cost and genetic architecture underlying maintenance of osmoregulatory
plasticity. General theory on rates of adaptation suggest that if a high degree of pleiotropy exists between
co-adapted FW and SW gene complexes or if neutral processes dominate, then SW tolerance may persist
even in a FW-stable environment (Lahti et al. 2009; Hohenlohe et al. 2012). Alternatively, if energetic

12
costs and/or modularity are high, then SW tolerance might erode rapidly in favor of a specialized FW
phenotype (Lande 2009; Snell-Rood 2012). Halotolerance shifts may also be rapid if a tradeoff exists
between osmoregulation in FW and SW, which has been demonstrated between salinity-segregated
populations in a few teleosts (Brennan et al. 2015; Velotta et al. 2015).
The euryhaline Threespine Stickleback (Gasterosteus aculeatus; hereafter ‘stickleback’) is an
ideal organism in which to study the evolution of physiological plasticity because it has repeatedly
colonized FW environments across its circumpolar range, and derived populations can be studied in
relation to ancestral marine and anadromous (collectively called ‘oceanic’) forms. The life histories of
these three ecotypes differ with respect to salinity. Within the oceanic group, marine stickleback are
strictly coastal/estuarine spawners and do not migrate upriver, whereas anadromous stickleback hatch and
spawn in FW. The spawning migrations of anadromous stickleback have produced numerous derived, FW
isolates, many of which have been landlocked since the Pleistocene deglaciation (Bell & Ortí 1994; von
Hippel 2008). A century of empirical research on the stickleback radiation has revealed parallel evolution
of morphology, reproductive life history, and behavior between ancestral and derived forms, as well the
genetic underpinnings of many traits under selection (Bell & Foster 1994; Baker et al. 2008; DeFaveri et
al. 2011; Jones et al. 2012b; Foster 2013; Bell & Aguirre 2013). In addition, physiological divergence
between ancestral and derived ecotypes has been shown from halotolerance experiments measuring
salinity-dependent survival (e.g., Marchinko & Schluter 2007; DeFaveri & Merilä 2014) or
osmoregulatory genes or gene expression (e.g., McCairns & Bernatchez 2010; Shimada et al. 2011; Jones
et al. 2012a). Nonetheless, comparative osmoregulatory physiology among salinity-divergent stickleback
populations remains poorly understood, particularly at the level of ion transport and its underlying
mechanisms.
Evolutionary divergence in haloplasticity should be rooted in physiological mechanisms,
primarily involving osmoregulatory organs such as the gill, whose epithelium contains ion transporting
cells called ionocytes. Specialized ionocyte types function to offset either diffusive ion losses (by
absorbing ions from the FW environment) or ion gains (by secreting excess ions in SW). Both actions are

13
driven by the Na+/K+-ATPase pump (NKA), a basolaterally-bound enzyme that maintains an
electrochemical gradient across the cell membrane necessary to power a suite of secondary ion
transporters (reviewed by Edwards & Marshall 2013). The essential role that NKA plays in ion transport
and its high abundance in ionocytes has made it the principal molecular target in osmoregulatory studies.
During hypo-osmoregulation in SW, NKA establishes conditions favorable for sodium and chloride
uptake through the apical membrane of FW-type ionocytes. In hyper-osmoregulation in FW, NKA
facilitates chloride and (paracellular) sodium extrusion in SW ionocytes (Edwards & Marshall 2013). In
euryhaline fishes, upregulation of gill NKA activity commonly occurs following SW transfers (e.g.,
Schaarschmidt et al. 1999; McCormick et al. 2009), although some species display a more complex, “U”-
shaped pattern, where activity increases in FW as well as in SW (Kelly et al. 1999; Herrera et al. 2009).
We investigated how osmoregulatory capacity evolves among stickleback populations occupying
different halohabitats. We further tested how osmoregulatory responses are affected by early ontogeny
and salinity acclimation. Our main research objectives were to characterize divergence of halotolerance
and osmoregulatory responses by (1) measuring survival among multiple stickleback populations
subjected to osmotic challenge during early ontogeny, and (2) mechanistically link osmoregulatory
performance of the whole organism to the biochemical level by examining gill NKA activity as an
indicator of ionocyte function. We reared F1-generation stickleback from representative marine,
anadromous, and lake populations in common salinity environments and then challenged juveniles to
more extreme salinities, including hypersaline treatments, with the goal of measuring the full extent of
osmoregulatory plasticity and how halotolerance thresholds are influenced by salinity acclimation.
We hypothesized that the evolution of halotolerance would manifest as differences in both the
stickleback’s performance (i.e., survival) and ion transport (i.e., gill NKA activity) and that both of these
responses would be influenced by ontogeny and acclimation. At the organismal level, we predicted that
populations will demonstrate local adaptation as a result of differences in halotolerance breadth,
evidenced as progressively higher mortality the further the departure from native (i.e., naturally
experienced) salinities. For example, marine stickleback were predicted to survive best in SW, but poorest
14
in FW treatments, and vice versa for lake stickleback. Second, we predicted osmoregulatory capacity will
increase with development, as seen in other euryhaline fishes (reviewed by Zydlewski & Wilkie 2013).
The increase in halotolerance should be especially evident with anadromous stickleback, which transition
from FW to SW within their first months of development. Third, we predicted that halotolerance will be
affected by a stickleback’s acclimation salinity. Thus, lake stickleback pre-acclimated to SW would be
able to survive at more hypersaline treatments than they could otherwise, but this increase would still be
less than the upper halotolerance thresholds of marine and anadromous populations. On a mechanistic
level, we hypothesized that stickleback will respond to osmotic stress by increasing the number and/or
function of gill ionocytes, as marked by an increase in gill NKA activity. In general, we expected gill
NKA activity to increase when fish are hyper-osmotically challenged, which has been documented in
many euryhaline teleosts. Finally, we predicted that members of the landlocked population would exhibit
a diminished response in upregulating gill NKA activity to combat hyperosmotic stress compared to
oceanic populations, indicating a loss of osmoregulatory plasticity as a consequence of relaxed selection
on SW tolerance.
Materials & Methods
Source populations & fish husbandry.— Threespine Stickleback used in this study were sourced from
three populations in south-central Alaska, representing marine, anadromous, and lake ecotypes. Marine
adults were captured on their spawning grounds at the head of Resurrection Bay off the shoreline of
Seward, AK on the Kenai Peninsula (60.124°N, 149.418°W). The other two populations are located in the
Matanuska-Susitna Borough, near the Cook Inlet: anadromous adults were captured in Rabbit Slough, at a
culvert running under the Parks Highway near Palmer (61.534°N, 149.268°W), and derived, landlocked
stickleback were taken from Frog Lake (61.614°N, 149.717°W), a population presumed to have been
colonized by anadromous ancestors 10,000-12,000 years ago.
In May-June 2010 and 2011, breeding stickleback from all three locales were trapped using
unbaited, steel minnow traps (0.32 cm mesh) set overnight by John Baker and his team from Clark

15
University (Worchester, MA, USA). Adults were brought to the University of Alaska Anchorage, where
they produced an F1 generation via in vitro fertilization between the gametes of male-female pairs.
Between four and eight full-sibling clutches for each population were initially used in the experiments
(Table 1). However, as cohort size decreased, some of smaller families within populations were
combined, which ensured adequate sample sizes (Table 1).
In 2010, the fertilized embryos were disinfected by bathing them in a 1% iodine solution for 3
min. They were then rinsed and incubated in aerated 0.5 ppt water before being shipped on ice overnight
to the University of Connecticut’s Aquatic Facility, where they developed in a common environment of 3
ppt. In 2011, each clutch was split into 0.5 ppt and 15 ppt media prior to shipment. Upon arrival, we
transitioned half of the 15 ppt embryos into 30 ppt. All fish were raised in reverse osmosis (RO) water in
which Instant Ocean aquarium salt (Spectrum Brands, Blacksburg, VA, USA) was dissolved to the
desired rearing salinity. All salinity treatments were measured to the nearest 0.1 ppt using a Yellow
Springs Instruments 85 digital salinometer (Yellow Springs, OH, USA). Conductivity measurements were
also recorded for each treatment. We incubated embryos in glass Petri dishes, and after successful
feedings were observed, the fry were briefly kept in quart jars before being transferred into replicate 38-L
aquaria, each equipped with a Penguin 100 power filter with bio-wheel (Marineland Aquarium Products,
Cincinnati, OH, USA), and a segment of plastic pipe fitted with plastic plants provided habitat
enrichment. Colonies were maintained at 19 ± 1°C with a 14-h light: 10-h dark photoperiod. Larval
stickleback were fed live brine shrimp nauplii daily ad libitum, which we hatched from Artemia cysts
(Argentemia, Argent Chemical Laboratories, Redmond, WA, USA or Brine Shrimp Direct, Ogden, UT,
USA brands). Nauplii were strained from the culture medium, washed in RO, and resuspended in batches
at salinities appropriate for given acclimation conditions. More details about our fish husbandry practices
can be found in Divino and Schultz (2014). All experimentation on animals was approved by the
University of Connecticut’s IACUC (Protocol A10-013).

16
Two-week salinity challenges.— In 2010, we reared all stickleback at a common 3 ppt (approx.
conductivity = 4.6 mS/cm). We haphazardly selected individuals from each family for acute salinity
challenge trials when the fish were 3, 7, and 10-weeks post-hatch. Fish were fasted for at least 12 h and
then directly transferred from the intermediate rearing salinity into wide-mouth mason jars (Ball brand,
Hearthmark, LLC, Daleville, IN, USA) containing either a low (FW ≤0.4 ppt; ≤677 µS/cm) or high (SW
= 35 ppt; 50.7 mS/cm) salinity treatment. Treatments were set up for each family in duplicate with 10 fish
per jar. To reduce handling stress, groups of 10 fish were first dip-netted into a hexagonal, polystyrene
weighing dish (13-cm diameter) containing ~100 mL of treatment water, which was then gently poured
into the jar. This step also allowed us to photograph each batch of fish before transfer to obtain standard
length data from ruler-calibrated, digital measurements. Three-week and 7-week-old stickleback were
placed in quart-sized jars (0.86 L) and 10-week olds in half-gallon jars (1.5 L; Table 1). Because mortality
had been nonexistent for stickleback juveniles held in jars at the rearing salinity in numerous other
salinity trials (J. Divino, unpubl. data), parallel control jars were not set up. However, fish were sampled
from the rearing tanks to obtain baseline physiological data in Week 10.
For each age trial, salinity-challenged fish were monitored at least twice per day for 13-15 d; at
each inspection, we immediately removed and recorded mortalities. We periodically checked ammonium,
nitrite, nitrate, and pH levels (Aquarium Pharmaceuticals, Inc., Chalfont, PA, USA) and maintained water
quality and constant salinity throughout the experiment through a combination of debris removal and
water changes. Fish were fed salinity-appropriate suspensions of brine shrimp nauplii beginning on Day 2
of the trials.
Only 1/450 3-week-old stickleback survived the 0 ppt (~6 µS/cm) FW treatment. Thus, we
excluded this treatment from the Week 3 analysis and used 0.2 ppt (353 µS/cm) as the FW treatment for
the Week 7 trial. However, when this treatment was used on the larger, 10-week-old stickleback, another
die-off occurred, and the Week 10 FW trial was re-performed at 0.4 ppt (677 µS/cm; Table 1).
Mean standard length of stickleback entering the Week 3 and Week 7 trials differed slightly
among populations, with lake juveniles being, on average ≤1 mm shorter than oceanic counterparts

17
(which corresponded to a 12% and 3% decrease in body size, respectively; Table S1). Size distributions
among populations were even more similar in 10-week-olds, with mean lengths differing by ≤2%. In all
trials, length distributions overlapped completely in the low end of the range (Table S1).
At the end of each trial, we euthanized survivors with an overdose of MS-222 anesthetic
(Tricaine-S, Western Chemical, Inc., Ferndale, WA, USA). Fish were then rinsed in deionized water,
blot-dried, and standard lengths were measured using digital calipers (to the nearest 0.1 mm). Subsets of
at least eight stickleback per treatment were selected for gill NKA activity and families were pooled to
increase sample size. We micro-dissected branchial baskets (eight gill arches) from Week 7 and Week 10
juveniles, while the fish lay on ice-cold glass. Tissue samples were immersed in tubes containing 100 µL
of sucrose-EDTA-imidazole (SEI) buffer (McCormick 1993), snap-frozen in liquid nitrogen or on dry ice,
and stored at -80°C.
The gill tissue was later analyzed for NKA activity at the Conte Anadromous Fish Research
Center (Turners Falls, MA, USA) via a 96-well microplate spectrophotometric assay, which measures the
rate at which functioning, sample-derived ATPases can hydrolyze ATP (McCormick 1993). Preliminary
tests using pooled stickleback gill homogenates confirmed that assay conditions, originally developed for
salmonids, also worked optimally for this species (J. Divino, unpubl. data). Stickleback gill samples
stored in the SEI buffer were thawed on ice, homogenized in 0.1% deoxycholate (which emulsifies the
sample-derived ATPases), and centrifuged to pellet insoluble material. To initiate the reaction, we added
an assay mixture containing salts (NaCl, KCl, MgCl2), ATP, and reagents that enzymatically couple ADP
production with NADH oxidation (phosphoenolpyruvate, and the enzymes lactic dehydrogenase and
pyruvate kinase in an imidazole buffer). Kinetic oxidation of NADH was measured by repeated 340 nm
absorbance readings taken for 10 min on a plate reader at 25°C using Gen5 software (BioTek Instruments,
Winooski, VT, USA). For each sample, NKA activity was quantified as the difference between the mean
NADH decay slope of the reaction in duplicate wells in the presence or absence of 0.5 mM ouabain, a
potent NKA inhibitor. Readings were normalized to the sample’s total protein concentration, as
determined using a Pierce BCA Protein Assay (ThermoFisher, Waltham, MA, USA). We statistically
18
analyzed gill NKA activity using two-way ANOVA, testing for effects of population (pop), salinity (salt),
and their interaction. Families and jars were pooled to increase sample size (minimum N = 8). For overall
significant effects (P < 0.05), we performed Tukey’s HSD multiple-comparison tests to elucidate group
differences.
Multi-acclimation halotolerance studies.— In 2011, we performed a second set of experiments on F1
stickleback crossed from the same populations, but we divided the clutches of embryos into FW (0.5 ppt;
~0.8 mS/cm), brackish water (BW = 15 ppt; 22.5 mS/cm), or SW (30 ppt; 43.8 mS/cm) acclimation
groups for a total of nine population-salinity combinations. We distributed the embryos by family into
100-mm diameter, glass Petri dishes at densities of 25 eggs/dish (Ndish = 107). Water was replaced daily
and embryos were monitored closely with the aid of microscopy. We removed and recorded mortalities.
Proportion survival in each Petri dish was averaged during a comprehensive tally taken at 2 and 9 d post-
hatch, which respectively corresponded to pre-feeding yolk-sac larvae (Stage 27) and feeding fry (Stage
29; Swarup 1958) just before we relocated them to quart jars. Containers of embryos and larvae were
periodically photographed to document development. We transferred 2-week-old juveniles to 38-L
rearing aquaria, pooling families to increase population-acclimation cohort sizes. At this time, we also
established 10 and 20 ppt acclimation groups (which corresponded to approx. 15.1 and 29.7 mS/cm) from
additional anadromous clutches, which had been reared in 3 ppt (Table 1), and individuals were allowed
to acclimate to these salinities for >30 d prior to experimentation.
We assessed acute low and high salinity toxicity among all 11 population-acclimation groups
when stickleback approached 3 months of age. We assigned fish to one of 11 challenge salinities, which
spanned 0-0.5 ppt for low-salt and 30-50 ppt for high-salt treatments. Due to limitations in the number of
fish available, treatments were selected with respect to the fish’s acclimation salinity in an attempt to
ensure that lower and upper lethal concentrations could be accurately estimated (see Results for details).
Fish were fasted for at least 12 h prior to being transferred directly into glass jars containing 1.5 L of a

19
challenge salinity at a target density of 10 fish per jar; duplicate jars were set up if possible. The fish did
not differ in body size among populations (Table S1).
We monitored fish multiple times daily and removed and recorded mortalities. Jar water was not
replaced and food was not provided during this short 3-d trial. A final census was conducted on Day 3
before the survivors were euthanized. Fish were then rinsed, blot-dried, and measured as described above.
Branchial tissue (four gill arches) was sampled from fish exposed to select challenge treatments for NKA
activity analysis (see Results; target N = 6). Control gill samples were also collected from each
population-acclimation group (N = 5), and samples were processed as described above.
Survival analyses.— We coded each subject in the two-week salinity challenges as a survivor (“0”) or a
mortality (“1”) with time-to-event recorded for all individuals. Survival curves were plotted using the
survfit function in the survival package in R (R Core Team 2016). Final (endpoint) survival was analyzed
on the binary response via a binomial generalized linear mixed-effects model (bGLMM) using the glmer
function in the lme4 package in R, shown below:
(1) glmer(MortScore ~ Popn*fsalt + (1|FamID/JarID), family = binomial (link = logit), nAGQ = 1, data)
In Eq. 1, the binary survival outcome (MortScore) of each individual is determined by the fixed effects of
population (Popn), salinity (coded as a factor; fsalt), and their two-way interaction, in addition to the
random effects of jar (JarID) nested within clutch family (FamID). The nAGQ argument specifies
Laplace’s approximation of the log-likelihood of the variance components (the default setting). Because
this model uses the binomial family to relate the response variable to the predictors on a logit scale, it
breaks down if there is perfect separation in one or more levels of the data, yielding standard errors that
greatly exceed the coefficient estimates (Abrahantes & Aerts 2012). A category having complete survival
or complete mortality in one population-salinity group occurred in each trial. For these three cases, we

20
changed the survival score of one stickleback so that it had a non-identical response compared to the rest
of the group (N = 60-160 fish), allowing the logit-linked models to run properly.
We determined that our statistical interpretation was robust to model selection after producing
similar results when the response variable was adjusted to be the proportion of stickleback that survived
in each jar replicate. Results were also consistent when we ran mixed-effects, Cox proportional hazards
models for the Week 3 and 7 trials (coxme in R; see also Divino et al. 2016). The failure of the time-to-
event survival model to produce estimates for some of the model terms with the Week 10 data, as well as
the similar pattern of mortality among populations (see Results), contributed to our decision to analyze
endpoint survival.
For the acute salinity toxicity study in 2011, we applied logistic regression on proportion survival
data to estimate lower- and upper-limit lethal salinity concentrations, or LCx (expressed as ppt, where x is
percent survival). We tested lower and upper halotolerance boundaries for each FW, BW, and SW
population-acclimation group (N = 18). However, only a low-salt LC85 and a high-salt LC50 could be
quantified for the FW-acclimated stickleback (see Results). In all other groups, estimates could not be
accurately determined because of too few challenge treatments to serve as data points for the regression
and/or because survival at the most extreme salinity was too high to extrapolate a LCx.
Results
Two-week salinity challenges.— In all three of the 2-week salinity challenges, virtually all mortality
occurred within the first 2 d, after which the survival curves stabilized (Figs. S1-S3). No 3-week-old lake
stickleback survived SW, whereas 63 ± 4% (mean ± SE) of anadromous and 73 ± 5% of marine juveniles
did (Fig. 1; bGLMM: pop P < 0.00001). However, population differences in SW tolerance disappeared in
later trials (P’s ≥ 0.4). Survival in SW by lake stickleback increased dramatically in 7-week olds, reaching
79 ± 5% (Fig. 2). Mean SW tolerance in 7-week-old anadromous and marine stickleback also increased
compared to that of 3-week-old counterparts, with no marine fish dying in SW (Fig. 2). This led to an
overall effect of salinity on survival in the Week 7 trial (bGLMM: salt P = 0.007). The pop*salt

21
interaction was also significant (P = 0.03). Specifically, the overall salinity effect was driven by the
increase in SW relative to FW survival in oceanic stickleback, whereas the lake cohort performed
similarly in both treatments (Fig. 2). In Week 10, no lake stickleback died in FW, and mean FW survival
was lower in marine relative to anadromous stickleback (71 ± 5% vs. 89 ± 3%; Fig. 3). However, no
significant differences were detected among populations, between salinities, or their interaction according
to the bGLMM (P’s > 0.2). Nearly all 10-week-old stickleback survived the SW treatment (94-99%; Fig.
3).
Inclusion of a FW treatment in the Week 7 and 10 salinity challenges enabled testing of
halotolerance reaction norms. The sign of the FW-SW reaction norm slopes for each family was usually
the same as that representing their respective populations (Figs. 2 and 3), and there was no correlation in
the relationship between the Week 7 and Week 10 reaction norm slopes for the nine families that were
tested in both trials (R2 = 0.005).
Gill NKA activity exhibited strong salinity and population effects in both the Week 7 and Week
10 trials (Fig. 4; 2-way ANOVA: salt P’s ≤ 0.0005, pop P’s < 0.0001). NKA activity was almost 19%
higher in SW than in FW when averaged over both trials. Values in FW were not different from those in
the 3-ppt controls in Week 10. In both trials, marine stickleback had higher NKA activity levels than the
other populations, irrespective of salinity, and lake stickleback had significantly lower activity in Week
10 (Fig. 4). Two-way interactions were non-significant in both trials (pop*salt P’s ≥ 0.1). Overall, NKA
activity levels were almost 20% lower in Week 10 compared to Week 7 samples.
Multi-acclimation halotolerance studies.— The 2,575 stickleback larvae hatched 7-10 days post-
fertilization (dpf), with hatch-out peaking at 8-9 dpf. Hatching was typically delayed 1 d in the SW-
acclimation group. Overall survivorship was 65.5% ± 2.8% (mean ± SE) in 2-day-old yolk sac larvae and
62.9% ± 2.9% in 9-day-old feeding larvae. Early-stage survival differed with respect to population and
salinity in both censuses, but without a significant interaction (Table 2; 2-way ANOVAs: pop P’s =
0.0003-0.001, salt P’s < 0.0001, pop*salt P’s = 0.5-0.6). Across all acclimation groups, lake larvae had
22
lower survival than their marine counterparts (9 dph: 47.9% vs. 76.2%). Larval survival was similar
between the FW- and BW-groups (68.1-72.1%), but lower in the SW-acclimation group (40.4%). The
SW-acclimated lake stickleback had the lowest survival of any group (28.8%), and this was lower than
that of SW-acclimated oceanic counterparts (45.1-46.5%; Table 2).
When the stickleback reached ~3 months of age, all acclimation groups displayed broad
halotolerance when acutely exposed to low and high salinity challenge for 3 d. Nearly all fish survived
transfer to ion-poor conditions of ≤0.5 ppt, regardless of acclimation salinity (Fig. 5). Low-salt LC85 of
the FW-acclimated marine and anadromous groups was 0.04 ± 0.07 (mean ± SE) and 0.03 ± 0.06 ppt,
respectively. No lake juveniles died in the three low-salt treatments tested. In contrast, hypersaline
challenge revealed population differences in halotolerance, which could not be removed completely by
acclimation. For each acclimation group, members of marine and anadromous populations had higher
survival in ≥40 ppt than lake individuals. Among FW-acclimated individuals, 80% of oceanic stickleback
survived direct transfer to 40 ppt, whereas only 15% of lake stickleback did (Fig. 5). This population-
level difference was reflected in the high-salt LC50 thresholds (marine: 42.5 ± 0.6 ppt, anadromous: 41.1 ±
0.6 ppt, and lake: 37.0 ± 0.6 ppt; mean ± SE).
The BW- and SW-acclimated groups of the ancestral stickleback populations also exhibited
higher halotolerance thresholds: all BW-acclimated oceanic stickleback survived in 40 ppt, in contrast to
55% survival in lake counterparts. Moreover, ~60% of SW-acclimated oceanic stickleback survived
transfer to 50 ppt, but no members of the lake population survived this extreme hypersaline condition
(Fig. 5).
Gill NKA activity differed among stickleback acclimation groups in a “J”-shaped curve: the
lowest activity was detected in fish acclimated to near isosmotic conditions of BW (15 ppt), and was
higher in FW and SW groups, respectively. This nonlinear pattern was most visible in the anadromous
population, which had additional intermediate-salinity acclimation groups of 10 ppt and 20 ppt (Fig. 6A;
1-way ANOVA: salt P < 0.0001). Across all three populations, gill NKA activity ranked, in order from
highest to lowest, SW, FW, and BW groups (Fig. 6B; 2-way ANOVA: salt P < 0.0001): in SW, NKA

23
levels were 26% greater than FW and 55% greater than BW. Mean NKA activity was highest in marine
stickleback gills in FW and BW compared to the other populations. However, the significant population
effect (P = 0.03) could not be statistically resolved by the post hoc Tukey tests. No interaction was
detected (Fig. 6B; pop*salt P = 0.07).
In all populations, gill NKA activity increased in stickleback exposed to saline and hypersaline
conditions for 3 d, relative to the baseline level of the respective acclimation group. FW-acclimated
stickleback challenged in 40 ppt had more than 46% higher NKA activity compared to 0.5-ppt controls
(Fig. 7A; salt P < 0.0001; the 35 and 40 ppt treatments were statistically similar, as were the 0.2 ppt and
0.5 ppt groups). Similarly, BW-acclimated stickleback challenged in 40 ppt had 34% higher levels than
15-ppt controls (Fig. 7B; salt P < 0.0001). Even though SW-acclimated fish had the highest baseline
NKA activity among all acclimation groups, levels increased further when these fish were challenged in
50 ppt (Fig. 7B; only marine and anadromous stickleback survived this hypersaline treatment; salt P =
0.01). FW- and BW-acclimated marine stickleback had higher NKA activity than members of the two
other populations (Fig. 7A,B; pop P’s ≤ 0.04). However, SW-acclimated marine stickleback had lower
levels than their anadromous counterparts (Fig. 7B; pop P = 0.04). In each within-acclimation-group
analysis, the interaction between salinity and population was not significant (pop*salt P’s ≥ 0.7). Finally,
when challenged in 40 ppt, the anadromous stickleback groups acclimated to 10 and 20 ppt had 62% and
40% higher gill NKA activity, respectively (Fig. 7C; T-tests: P’s ≤ 0.002).
Discussion
In this study, we performed common garden halotolerance experiments on multiple populations of F1-
generation Threespine Stickleback, with the aim of assessing how the osmoregulatory system can evolve
under different salinity regimes. We tested for evidence of local adaptation by challenging juveniles in
ecologically relevant salinities. We also included hypersaline treatments in our design to expose potential
among-population differences in osmoregulatory performance that might not be discernable in a standard
SW treatment for this euryhaline organism. We have demonstrated that a derived population of

24
landlocked stickleback has delayed development of SW tolerance and a reduced hypersaline threshold,
relative to oceanic ancestors. Furthermore, the reduced branchial NKA activity in this derived population
provides a mechanistic link to the corresponding differences in organismal performance. Taken together,
our results suggest that when a euryhaline organism no longer experiences ancestral marine conditions,
relaxed selection on SW tolerance can lead to a loss of hyper-osmoregulatory capacity and plasticity in
the direction of FW-specialization.
In a broader evolutionary context, divergence in halotolerance can establish an osmotic barrier
between derived and ancestral populations, which has important implications for speciation. Independent
invasions of FW followed by adaptive evolution to ion-poor conditions has produced the postglacial
radiation of stickleback (Bell & Foster 1994). Salinity is one of many ecological conditions that impose
selective pressure on marine or brackish-water species colonizing isolated, FW habitats. In some cases,
the inland migrants may become landlocked (Foote et al. 1994; Velotta et al. 2015). But even where the
geographic separation is incomplete, FW residents may still become isolated from conspecifics that have
higher salinity tolerance (McCairns & Bernatchez 2010; Whitehead et al. 2011). A similar pattern of
halohabitat-induced osmoregulatory divergence is seen in other fishes, as well as several invertebrate
taxa, including copepods (reviewed by Lee & Bell 1999; Lee 2016), which highlights the importance of
halohabitat as a driver of physiological evolution.
Evolution of halotolerance in fishes colonizing FW.— Euryhalinity encapsulates a suite of physiological
traits that enables aquatic organisms to occupy a wide osmotic niche. We predicted that differences in
halotolerance that existed among stickleback populations would persist, at least to some degree, despite
salinity acclimation. In general, stickleback from the three populations we tested could successfully be
acclimated to and survive challenges at a wide range of salinities. Embryos representing all ecotypes
hatched in 15 ppt and 30 ppt, but typically required one additional day of incubation at these higher
salinities, consistent with previous observations (Belanger et al. 1987). Furthermore, the stabilization of
the survival curves during the 2-week trials indicated that stickleback could rapidly acclimate to acute FW

25
and SW challenge. Even members of the Frog Lake population, which has been landlocked for ~10,000
years, still retained a degree of SW tolerance: a portion of each clutch could be successfully acclimated to
hyperosmotic conditions, and 10-week-old juveniles (acclimated to 3 ppt) could survive direct transfer to
35 ppt at rates on par with those of marine (Resurrection Bay) and anadromous (Rabbit Slough)
counterparts. Yet population differences in halotolerance supported our hypothesis: 3-week-old larval
stickleback from Frog Lake could not cope at all with a direct transfer from a standard lab-rearing salinity
to SW, and one month later, their survival in SW was still lower than in oceanic counterparts. In addition,
members of this derived population consistently had the lowest survival in SW and markedly reduced
hypersaline tolerance, which became apparent in ≥40 ppt. Our multi-acclimation trial showed that this
osmoregulatory divergence in SW tolerance did not disappear after prior acclimation to high-salt
conditions. Compared to the FW-acclimated lake stickleback, the BW-acclimated lake group had
improved survival (55%) when challenged in 40 ppt, whereas no BW-anadromous or BW-marine
individuals died in this treatment. Moreover, prior SW-acclimation of the derived fish did not enable them
to withstand 50 ppt, but did confer some survival in the other populations. In sum, the reduced
halotolerance breadth of derived stickleback is evidence of a loss in osmoregulatory plasticity.
A loss of SW tolerance has been seen in other derived versus anadromous stickleback population
comparisons (Marchinko & Schluter 2007; McCairns & Bernatchez 2010; DeFaveri & Merilä 2014).
Others have reported enhanced FW survival in derived Threespine Stickleback populations, suggesting
evolution of a more specialized FW phenotype (Heuts 1947; Schaarschmidt et al. 1999; Divino et al.
2016). Taken together, the decreased SW tolerance of FW-resident stickleback in the ancestral (“foreign”)
habitat coupled with increased FW tolerance in the derived (“local”) habitat is a classic demonstration of
local adaptation (Kawecki & Ebert 2004). Such a performance tradeoff is exhibited in FW-resident
populations of Alewife (Alosa pseudoharengus; Velotta et al. 2015), Mummichog (Fundulus heteroclitus;
Brennan et al. 2015), as well as in a calanoid copepod (Eurytemora affinis; Lee et al. 2003).
We did not observe a distinct FW-SW tradeoff in this study, as Frog Lake stickleback did not
have significantly higher survival in FW. However, our inability to detect enhanced FW tolerance in lake

26
stickleback may have been masked by some proportion of FW mortalities caused by extraneous factors
indirectly linked to ion-poor conditions. Even so, despite the added stressors associated with the FW
treatment in small-volume jars (which were experienced by all subjects), few 10-week-old stickleback
died in the 0.4 ppt FW trial. In a similarly-designed experiment, improved FW tolerance was detected in
6-week-olds from a recently lake-introduced population that had been stocked with anadromous adults
from Rabbit Slough (Divino et al. 2016). The researchers challenged fish at 0.4, 0.2, and 0 ppt and
achieved higher survival rates at these conditions than we report here, likely because they fed subjects
artificial pellets. If we had conducted our salinity challenges using this improved feeding technique, we
would have been better able to discern whether or not FW halotolerance differences emerged between the
ancestral and derived populations.
The dramatic increase in SW tolerance exhibited by lake stickleback from Week 3 to Week 10
underscores the importance of early development on hypo-osmoregulatory function. Early juvenile
development is an important period for increasing osmoregulatory capacity, and body size is positively
related to improved osmoregulatory function in many euryhaline fishes (reviewed by Zydlewski & Wilkie
2013). Larger juvenile fish have more developed branchial anatomy, which can better function as an
osmoregulatory organ: longer filaments facilitate increased ionocyte abundance over the greater epithelial
surface area (Finn & Kapoor 2008). During our study, juvenile stickleback more than tripled in body
length from Week 3 to Week 10, with size discrepancies among population decreasing during that span.
While the increase in body size likely contributed to the increase in osmoregulatory performance overall,
lake individuals consistently underperformed oceanic counterparts in each SW challenge. Since the
smallest size-classes were represented in all populations, we do not believe that the modestly smaller
average size of the lake cohort can account for their complete failure to survive in SW as 3-week olds.
Rather, we conclude that derived stickleback have evolved a lower absolute halotolerance threshold, as
well as a delay in the developmental timing of hypo-osmoregulatory function following FW residency.
Developmental changes in osmoregulatory capacity have been best studied in anadromous fishes, largely
with respect to seasonality (Zydlewski & McCormick 1997; McCormick et al. 2013b). Our findings

27
reveal that examination of early ontogenetic effects on osmoregulation is also needed to fully understand
the physiological evolution of derived populations subsequent to their FW invasion.
Patterns of gill NKA activity.— To establish mechanistic support for population differences in
halotolerance following salinity challenge, we quantified the stickleback’s osmoregulatory investment by
measuring levels of gill NKA activity in branchial ionocytes. NKA is an important mediator of hypo-
osmoregulation and upregulation of NKA activity in SW has been well-documented in the gills of
phylogenetically diverse euryhaline fishes, including Atlantic Salmon (Salmo salar; McCormick et al.
2013b), Gilthead Sea Bream (Sparus aurata; Sangiao-Alvarellos et al. 2003), Japanese Medaka (Oryzias
latipes; Kang et al. 2008), Senegalese Sole (Solea senegalensis; Arjona et al. 2007), as well as
anadromous and FW-resident Alewife (A. pseudoharengus; Christensen et al. 2012; Velotta et al. 2015)
and Inconnu (Stenodus leucichthys; Howland et al. 2001). Recently, Divino et al. (2016) found higher
levels of NKA activity in gills of F1 lab-reared juvenile Threespine Stickleback from an anadromous and
a recently lake-introduced population exposed to 35 ppt compared to control (3 ppt) or FW-challenged
juveniles.
Consistent with our predictions and with these previous reports, gill NKA activity increased in
juvenile stickleback exposed to SW. Across all experiments in this study, we detected a salinity-induced
upregulation of NKA activity by 72 h, which persisted for at least 2 weeks of high-salinity exposure.
Schaarschmidt et al. (1999) acclimated wild-caught, adult stickleback to 10 ppt, transferred them to 35 ppt
water, and measured gill NKA activity during a 43-d time course experiment. Gill NKA activity increased
on Day 1 of SW exposure, continued to rise on Days 3 and 7, and peaked at Day 29 of the experiment.
This temporal pattern indicates that SW-type ionocytes recruit to the gill epithelium quickly to expel
excess ions in response to hyperosmotic conditions, and they continue to proliferate to maintain ion
homeostasis during salinity acclimation. Their results also suggest that the rapid upregulation of NKA
activity we observed in the 3-d hypersaline challenge would have likely continued to increase over time.

28
Longer-duration salinity challenges are necessary to determine when and at what rate NKA activity
plateaus in juvenile stickleback.
Although halotolerance increased with age in juvenile stickleback, we did not find a
corresponding increase in gill NKA activity between 7-week and 10-week-old fish. A possible
explanation for the slight decrease in gill NKA activity levels we observed is that as the juveniles
developed, the gill epithelium became increasingly used for non-ionoregulatory functions, such as gas
exchange. Alternatively, this result may be an artifact caused by surface area: volume scaling in larger
branchial baskets, such that the ionocyte-rich epithelial layer comprised a smaller fraction of the total gill
tissue in the samples from older fish.
Our multi-salinity acclimation study revealed a nonlinear, convex relationship between
environmental osmolality and gill NKA activity: levels were moderate in stickleback acclimated to FW,
lowest in those acclimated to BW (where salinity approached isosmotic conditions), and highest in SW-
acclimated counterparts. Moreover, NKA activity further increased when fish were challenged in
hypersaline conditions, and did so irrespective of the fish’s acclimation salinity. Collectively, the response
resembled a “J”-shaped curve. A similar pattern was found in Black Seabream (Mylio macrocephalus;
Kelly et al. 1999) and Wedge Sole (Dicologoglossa cuneata; Herrera et al. 2009). Although these authors
often refer to “U”-shaped NKA activity response curves, they are often more accurately described as a “J”
because the relationship is asymmetric about the isosmotic point, i.e., with values from fish exposed to
saline or hypersaline treatments exceeding those in FW.
In response to either hypo- or hyperosmotic stress, euryhaline fishes recruit more FW or SW-type
branchial ionocytes, respectively, both of which are powered by basolateral NKA (Edwards & Marshall
2013). Thus, using NKA activity as a proxy for osmoregulatory expenditure, the convex pattern we
observed implies that euryhaline fishes expend the least energy maintaining ion balance at or near
isosmotic conditions, and work harder to absorb or secrete ions in more extreme halohabitats.
Interestingly, some populations of the euryhaline copepod E. affinis also displayed a similar pattern of
NKA activity across a smaller range of salinities (Lee et al. 2011). A nonlinear relationship between gill

29
NKA activity and salinity may apply to other euryhaline organisms, and researchers should also take note
whether other constituents of osmoregulatory machinery, e.g., ion transporters and transcription factors,
are likewise downregulated in BW and upregulated in FW and SW.
The increase of branchial NKA activity from an isosmotic salinity to changes in environmental
osmolality in either direction has important implications concerning study design and inferences made
about NKA-related osmoregulatory responses to salinity transfers - especially since activity rates of NKA
are presumably linked to its gene and/or protein expression. Conclusions about up- or downregulation of
NKA in response to salinity may be contingent on which “FW” and “SW” treatments are chosen. For
example, McCairns and Bernatchez (2010) compared gill NKAα1 (atp1a1a.4; splice variant transcript ID
ENSGACT00000018945; Ensembl 2016) expression in larval stickleback from parapatric estuarine and
stream residents of the St. Lawrence River, out of which they reared F1 progeny in either <1 ppt or 20 ppt.
They noted substantial upregulation in the FW treatment in both demes. They concluded that a FW-
specific NKA isoform associated with FW adaptation was responsible for the negative relationship
between salinity and NKA expression.
Differentially-expressed FW and SW NKA isoforms (e.g., NKAα1a and NKAα1b) have been
found in several teleosts (Scott et al. 2005; Aykanat et al. 2011; Dalziel et al. 2014), and localize to
distinct FW and SW ionocytes on the gill (McCormick et al. 2009). Across multiple continents, ancestral
and derived stickleback populations exhibit ecotype-specific sequence signatures in several
osmoregulatory genes, including NKAα1 (atp1a1), that are characteristic of directional selection
(DeFaveri et al. 2011; Shimada et al. 2011). However, functionally distinct NKAα1a and α1b paralogs
have not been identified in the stickleback genome.
Given that the NKA pump drives ion uptake in hyper-osmoregulation, a plausible alternative
explanation for McCairns and Bernatchez’s (2010) detection of relatively higher NKAα1 expression in
FW follows from the increase in osmoregulatory effort expected in stickleback transferred from a near
isosmotic 20 ppt to a FW condition, which corresponds to the left side of the “J”-shaped NKA activity
response curve described above. It remains unclear whether the expression of the atp1a1a.4 splice variant

30
they measured is upregulated exclusively in ion-poor conditions, or whether it would also be involved in a
response to a more effective hyperosmotic challenge. Curiously, this locus maps to NKAα1b orthologs in
salmonids and Zebrafish (Danio rerio; Norman et al. 2012). More work is needed to verify whether or not
reciprocally salinity-responsive NKA isoforms exist in stickleback and if they evolved independently
from those identified in other teleost lineages.
Local salinity regime affected the physiological evolution of stickleback ecotypes, as
demonstrated by population differences in gill NKA activity. In almost all salinity challenge experiments
we performed in 2010 and 2011, F1-generation marine stickleback exhibited higher gill NKA activity than
did members of an anadromous or a landlocked population. Lake stickleback, on the other hand, often had
the lowest levels among the three populations, and these fish exhibited the poorest survival in SW and
hyper-SW treatments. The inability of derived stickleback to upregulate gill NKA activity to the same
degree as ancestral populations provides an important mechanistic link contributing to their reduction in
SW tolerance during 10,000 years of lake isolation. Decreased survival in SW and a concomitant decrease
in NKA activity was also found in landlocked versus anadromous Atlantic Salmon (S. salar; Nilsen et al.
2003; Nilsen et al. 2007) and Arctic Char (Salvelinus alpinus; Staurnes et al. 1992). Interestingly,
multiple FW isolates of a copepod (E. affinis), which invaded FW ca. 70 years ago, also had lower SW
tolerance and NKA activity relative to their respective coastal populations (Lee et al. 2011). These
examples implicate salinity as a potent ecological factor and demonstrate how the lack of SW exposure
can lead to rapid loss of hypo-osmoregulatory function in marine organisms that transition to FW.
Future investigation.— The multitude of Threespine Stickleback populations occupying different
halohabitats across their circumpolar range makes it an invaluable study organism for advancing our
understanding of the evolution of the plasticity of the osmoregulatory system, particularly in regard to
relaxed selection on hypo-osmoregulation. Future halotolerance studies on stickleback should include
older age-classes and compare additional FW-resident populations to confirm whether or not the loss of
SW tolerance we observed in the landlocked Frog Lake stickleback can be more broadly generalized for

31
this derived ecotype. Lake populations with known colonization dates that vary on a wide temporal scale
would prove especially informative for assessing rates of physiological evolution following transition to
FW. Some stickleback populations have colonized FW in the past few decades (Bell & Aguirre 2013;
Lescak et al. 2015). Even more recently, Alaska’s Cheney Lake and Scout Lake have been stocked with
anadromous stickleback, providing an excellent opportunity for examining osmoregulatory divergence in
real time (Bell et al. 2016; Divino et al. 2016).
The comprehensive study of osmoregulatory evolution following halohabitat transitions requires
an integrated, multi-level approach. In stickleback, most of this work has been done on osmoregulatory
genes and gene expression (e.g., Shimada et al. 2011; Jones et al. 2012a; Wang et al. 2014). Less is
known at the protein level, such as on the abundance and localization of membrane transporters likely
involved in epithelial ion uptake or secretion (e.g., NHE, NCC, CFTR or NKCC), which have been
described in other teleost models (reviewed by Edwards & Marshall 2013; Hwang & Lin 2013). Studies
should also incorporate whole-body osmoregulatory performance measures, such as plasma osmolality
and organic osmolyte content, and endocrine factors, which will provide deeper insights into the effects of
osmotic stress at the organismal level. To conclusively demonstrate salinity-induced osmoregulatory
evolution between ancestral and derived populations, we will need the corroborating evidence that comes
from finding parallel divergence in a suite of physiological endpoints.

32
32
Table 1. Study designs of the salinity acclimation and challenge experiments performed on F1-generation juvenile Threespine Stickleback, sorted
chronologically by fish age. Three Alaskan populations were compared: M = marine (Resurrection Bay); A = anadromous (Rabbit Slough); L =
landlocked lake (Frog Lake). For the 2-week trials, fish were fed brine shrimp nauplii (BSN) ad libitum, beginning on Day 2.
a Within populations, full-sibling families that were too small to achieve target experimental quotas were combined to form a “mixed” family.
b The reverse osmosis water (0 ppt) treatment resulted in complete fish mortality and was excluded from the analysis.
c After an initial trial of 0.2 ppt resulted in nearly complete mortality of 10-week olds, the FW trial was conducted again at 0.4 ppt.
d In 2011, the full-sibling clutches were divided among the three main acclimation salinities as embryos.
e Due to greater cohort abundance, the anadromous population had additional 3, 10, and 20 ppt acclimation groups (italics).
f Control samples were collected from rearing tanks 2-3 d prior to the start of the 3-d challenge.
g The specific lower and upper challenge salinities tested depended on the acclimation salinity (see Results).
Year
Class
Age
Post-hatch
Standard
Length (mm)
mean ± SD
Populations-
Families
Total
Families
(# mixed) a
Acclimation Salinities
(ppt)
Acute Challenge
Salinities (ppt)
lower, upper Trial
Duration (d) Feeding
Container
Type
Total
Subjects
Total Gill
Samples
2010 3 weeks 7.8 ± 1.1 M-8, A-7, L-8 23 (0) 3 0 b , 35 15 BSN quart jar 900
(450 SW) ---
7 weeks 19.4 ± 1.3 M-3, A-4, L-4 11 (2) 3 0.2 , 35 14 BSN quart jar 440 66
10 weeks 25.6 ± 1.9 M-4, A-5, L-5 14 (3) 3 0.4 c , 35 13 BSN ½-gal jar 540 113
2011 ~2 days
~9 days
6.5 ± 0.4
7.3 ± 0.6 M-4, A-4, L-4 12 0.5, 15, 30 d --- --- BSN Petri dish 2,575 ---
11 weeks 30.0 ± 2.3 M, A, L pooled 0.5, 3, 10, 15, 20, 30 e --- --- fasted 10-gal
aquarium f --- 62
11.5 weeks 30.0 ± 2.1 M, A, L pooled 0.5, 3, 10, 15, 20, 30 0-0.5 , 30-50 g 3 fasted ½-gal jar 949 103

33
Table 2. Percent survival of larval stickleback for each level of population (marine, anadromous, lake)
and salinity acclimation. Survival was recorded on censuses taken 2 and 9 days post-hatch (dph) and
averaged across Petri dish replicates containing 25 embryos each. Data are presented as the mean ± SD,
with the sample size of each group given in parentheses.
Salinity Dph Marine Anadromous Lake
0.5 2 88.9 ± 7.2 (20) 74.1 ± 18.3 (20) 54.0 ± 32.2 (16)
9 87.7 ± 7.2 71.7 ± 19.0 53.0 ± 32.5
15 2 83.4 ± 14.9 (7) 62.5 ± 28.9 (9) 63.4 ± 38.0 (7)
9 83.4 ± 14.9 62.1 ± 28.8 60.6 ± 39.6
30 2 56.7 ± 19.3 (9) 50.3 ± 31.6 (10) 31.1 ± 30.5 (9)
9 45.1 ± 22.4 46.5 ± 29.5 28.8 ± 30.6

34
Figure 1. Proportion survival of 3-week-old Threespine Stickleback acutely exposed to SW (35 ppt).
Three Alaskan populations were compared: Marine (Resurrection Bay; green circles), Anadromous
(Rabbit Slough; red squares), and landlocked Frog Lake (blue triangles). Data are presented as overall
population means (± SE; filled symbols) and mean survival of each family (open symbols; 20 fish per
family; points offset for clarity). Letters denote population differences as determined by a mixed effects,
binomial GLM.

35
Figure 2. Reaction norms for proportion survival of 7-week-old Threespine Stickleback acutely exposed
to FW (0.2 ppt) or SW (35 ppt). Three Alaskan populations were compared: Marine (Resurrection Bay;
green circles, solid lines), Anad. = Anadromous (Rabbit Slough; red squares, dashed lines), and Lake =
Landlocked Frog Lake (blue triangles, dotted lines). (A) Overall population means (± SE) in each
environment (points offset along x-axis for clarity). A mixed effects, binomial GLM identified an overall
effect of salinity (horizontally-aligned letters) and an interaction between the reaction norm for the Lake
population relative to the two others (vertically-aligned, prime letters). (B) Mean survival by family (20
fish per family per treatment), which was a random effect in the model.

36
Figure 3. Reaction norms for proportion survival of 10-week-old Threespine Stickleback acutely exposed
to FW (0.4 ppt) or SW (35 ppt). Three Alaskan populations were compared: Marine (Resurrection Bay;
green circles, solid lines), Anad. = Anadromous (Rabbit Slough; red squares, dashed lines), and Lake =
Landlocked Frog Lake (blue triangles, dotted lines). (A) Overall population means (± SE) in each
environment (points offset along x-axis for clarity). A mixed effects, binomial GLM found no group
differences. (B) Mean survival by family (20 fish per family per treatment), which was a random effect in
the model.

37
Figure 4. Gill NKA activity in juvenile marine (Resurrection Bay; green circles), anadromous (Rabbit
Slough; red squares), and landlocked (Frog Lake; blue triangles) Threespine Stickleback, following two
weeks exposure to FW (0.2-0.4 ppt) or SW (35 ppt) beginning when fish were (A) 7-weeks or (B) 10-
weeks old. Unchallenged fish from the common rearing salinity (3 ppt) were also analyzed in the latter
trial. Data are presented as the mean ± SE of a minimum of eight samples (average N = 11; points offset
along x-axis for clarity). Horizontally-aligned letters identify salinities that differed significantly, whereas
vertically-aligned, prime letters denote population differences, as determined by Tukey post hoc tests. The
interaction between these two main effects was non-significant for both trials.

38
Figure 5. Halotolerance matrix in juvenile Threespine Stickleback. Clutches from three populations were
split and acclimated to various salinities as embryos and subjected to salinity challenge when fish were 3-
months old. Color-coded cell values are the proportion of 10 fish that survived 3-d exposure in a 1.5 L jar
containing one of 11 challenge salinities, with a target of two jars per treatment (Njar = 96). Limitations in
the number of fish available in each population-acclimation group prevented some combinations from
being tested (shaded cells); treatments were selected with respect to the fish’s acclimation salinity in an
attempt to ensure that lower and upper lethal concentrations could be accurately estimated. Underlining
marks the treatments from which gill samples were collected for NKA activity analysis. Control samples
were also taken for each acclimation group (not shown).
Population
Anadromous Marine Lake
Acclimation→
Salinity (ppt) 0.5 10 15 20 30 0.5 15 30 0.5 15 30
Ch
all
en
ge S
ali
nit
y (
pp
t)
0 .9
1 1
0.1 .8 .9 .1
1 .2 1
Lo
w 0.2 1 1
1 1 1 1
1 1
0.3 1 1 .9 1
1 1
1 1
0.4 1 1
1 1 1 1
1 1 1 1
1 1 1 1
0.5
1 1 1 1
1 1
1
30 1 1 1 1 1 1 1 1 1 1 1 1 1 1 1 1
Hig
h 35 1 1
1 1
1 .5
40 .6 .8 .9 1 1 1 1 1
.8 1 1 1
.2 .1 .7 .4
45 .1 0
.2 0 .1
0
50
.9 .3 0
.7 .5
0

39
Figure 6.

40
Figure 6. Gill NKA activity in juvenile Threespine Stickleback, which were acclimated to different
salinities as embryos. Data are presented as the mean ± SE of five samples (points offset along x-axis for
clarity). Horizontally-aligned letters identify salinities that differed significantly in the response variable,
as determined by Tukey post hoc tests. (A) Members from an anadromous population (Rabbit Slough; red
squares) were raised in 0.5 (FW), 3, 10, 15 (BW), 20, or 30 ppt (SW). (B) Gill NKA activity from the
FW, BW, and SW-acclimated groups were compared to that of a marine (Resurrection Bay; green circles)
and landlocked (Frog Lake; blue triangles) population. Although a two-way ANOVA indicated a
significant, overall population effect in (B), no population pairs significantly differed according to Tukey
post hoc tests (vertically-aligned prime letters).

41
Figure 7.

42
Figure 7. Gill NKA activity in juvenile marine (Resurrection Bay; green circles), anadromous (Rabbit
Slough; red squares), and landlocked (Frog Lake; blue triangles) Threespine Stickleback, which had been
acclimated to various salinities as embryos and then transferred to a foreign salinity for 3 d. In each panel,
groups of control fish are designated by arrows (see Fig. 6). Data are presented as the mean ± SE of 5-6
samples, unless otherwise noted in parentheses (points offset along x-axis for clarity). Within acclimation
groups, horizontally-aligned letters denote salinities that differed significantly in the response, whereas
vertically-aligned, prime letters denote population differences, as determined by Tukey post hoc tests. The
interaction between these two main effects was non-significant in all cases. Open symbols were excluded
from statistical analysis due to missing levels or low sample size. (A) Fish acclimated to FW (0.5 ppt)
were challenged at either 0.2, 35, or 40 ppt. (B) Fish acclimated to BW (15 ppt) were challenged at 40
ppt, while fish acclimated to SW (30 ppt) were challenged at 50 ppt (no Lake stickleback survived this
hypersaline treatment). (C) Additional anadromous stickleback acclimated to 10 or 20 ppt were compared
to counterparts challenged at 40 ppt, and the asterisk denotes significant salinity-induced upregulation in
both cases.

43
43
Table S1. Summary statistics of stickleback standard lengths by population and age (post-hatch) at the start of each experiment. Length
distributions are described in percentiles (P).
Trial Starting Age Population Mean ± SD (N) P1 P10 P25 P50 P75 P90 P99
2-week acute 3 weeks Marine 8.4 ± 1.3 (260) 5.8 6.7 7.4 8.3 9.5 10.1 11.1
Challenge Anadromous 7.8 ± 0.8 (258) 6.1 6.7 7.2 7.8 8.3 8.8 9.4
(2010) Lake 7.3 ± 0.7 (280) 6.0 6.4 6.8 7.3 7.8 8.3 9.2
7 weeks Marine 19.7 ± 1.3 (120) 16.3 18.1 18.9 19.8 20.5 21.3 22.3
Anadromous 19.4 ± 1.5 (160) 14.0 17.4 18.7 19.6 20.2 21.0 22.9
Lake 19.1 ± 1.1 (160) 15.6 17.9 18.5 19.1 19.8 20.3 21.7
10 weeks Marine 25.4 ± 1.9 (238) 19.0 23.0 24.2 25.5 26.6 27.6 29.2
Anadromous 26.0 ± 1.7 (308) 22.2 23.8 24.8 25.9 27.2 28.0 30.5
Lake 25.5 ± 2.2 (239) 20.1 23.2 24.2 25.4 27.0 28.5 30.3
Larval 2 days Marine 6.6 ± 0.4 (30) 5.9 6.0 6.4 6.7 6.9 7.0 7.2
Survival Anadromous 6.4 ± 0.4 (23) 5.1 6.0 6.1 6.4 6.6 6.8 7.2
(2011) Lake 6.4 ± 0.5 (25) 5.7 5.8 6.0 6.4 6.6 7.0 7.5
9 days Marine 7.2 ± 0.7 (50) 6.0 6.5 6.7 7.1 7.7 8.2 8.8
Anadromous 7.4 ± 0.6 (63) 6.1 6.6 6.9 7.4 7.9 8.0 8.7
Lake 7.2 ± 0.5 (63) 5.2 6.5 6.9 7.2 7.5 7.7 8.3
3-d acute 11.5 weeks Marine 29.9 ± 2.5 (85) 24.0 26.4 28.3 30.1 31.8 33.0 35.5
challenge Anadromous 30.0 ± 1.7 (136) 26.6 27.5 29.0 30.0 31.1 32.2 33.8
(2011) Lake 30.0 ± 2.6 (67) 24.4 26.6 28.1 29.4 32.3 33.7 36.2
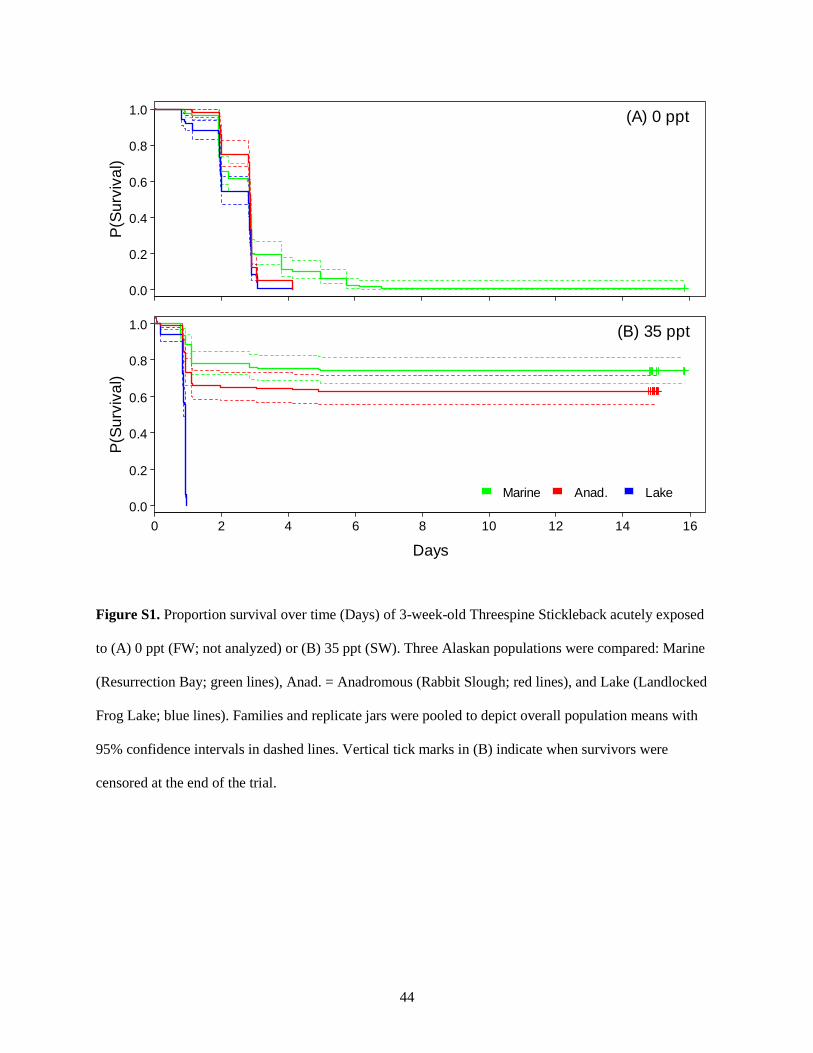
44
Figure S1. Proportion survival over time (Days) of 3-week-old Threespine Stickleback acutely exposed
to (A) 0 ppt (FW; not analyzed) or (B) 35 ppt (SW). Three Alaskan populations were compared: Marine
(Resurrection Bay; green lines), Anad. = Anadromous (Rabbit Slough; red lines), and Lake (Landlocked
Frog Lake; blue lines). Families and replicate jars were pooled to depict overall population means with
95% confidence intervals in dashed lines. Vertical tick marks in (B) indicate when survivors were
censored at the end of the trial.
0.0
0.2
0.4
0.6
0.8
1.0P
(Su
rviv
al)
(A) 0 ppt
0 2 4 6 8 10 12 14 16
0.0
0.2
0.4
0.6
0.8
1.0
Days
P(S
urv
iva
l)
(B) 35 ppt
Marine Anad. Lake

45
Figure S2. Proportion survival over time (Days) of 7-week-old Threespine Stickleback acutely exposed
to (A) 0.2 ppt (FW) or (B) 35 ppt (SW). Three Alaskan populations were compared: Marine (Resurrection
Bay; green lines), Anad. = Anadromous (Rabbit Slough; red lines), and Lake (Landlocked Frog Lake;
blue lines). Families and replicate jars were pooled to depict overall population means with 95%
confidence intervals in dashed lines. Vertical tick marks indicate when gill tissue samples were collected
from a subset of the survivors at the end of the trial.
0.0
0.2
0.4
0.6
0.8
1.0P
(Su
rviv
al)
(A) 0.2 ppt
0 2 4 6 8 10 12 14
0.0
0.2
0.4
0.6
0.8
1.0
Days
P(S
urv
iva
l)
(B) 35 ppt Marine Anad. Lake

46
Figure S3. Proportion survival over time (Days) of 10-week-old Threespine Stickleback acutely exposed
to (A) 0.4 ppt (FW) or (B) 35 ppt (SW). Three Alaskan populations were compared: Marine (Resurrection
Bay; green lines), Anad. = Anadromous (Rabbit Slough; red lines), and Lake (Landlocked Frog Lake;
blue lines). Families and replicate jars were pooled to depict overall population means with 95%
confidence intervals in dashed lines. Vertical tick marks indicate when gill tissue samples were collected
from a subset of the survivors at the end of the trial.
0.0
0.2
0.4
0.6
0.8
1.0P
(Su
rviv
al)
(A) 0.4 ppt
0 2 4 6 8 10 12
0.0
0.2
0.4
0.6
0.8
1.0
Days
P(S
urv
iva
l)
(B) 35 ppt Marine Anad. Lake

47
Chapter 2
Characterizing population- and salinity-dependent divergence in gill ionocyte composition among
Threespine Stickleback ecotypes using scanning electron microscopy
Introduction
Aquatic organisms that osmoregulate – i.e., maintain ion homeostasis in disequilibrium with the
environment – devote a great amount of energetic resources to expel excess ions in seawater (SW) or take
up ions in fresh water (FW). However, relatively few species possess the physiological plasticity to
survive in both environments, which require opposite functional responses that integrate cellular
processes across multiple organ and endocrine systems. For example, <3% of fishes are euryhaline
(Betancur-R et al. 2015), even though this trait confers the advantages of greater habitat availability and
resource exploitation. Indeed, euryhaline fishes have high evolutionary potential because they can expand
their range, crossing osmotic barriers to colonize FW environments that are isolated from each other and
possess diverse ecological conditions and niche space (Schultz & McCormick 2013). Given the complex
interplay between selective forces that can act on SW and FW tolerance, euryhaline fishes are especially
important to investigate because they can inform us about how the osmoregulatory system evolves
following halohabitat transitions. For instance, experiments comparing derived, FW-resident populations,
which no longer need to hypo-osmoregulate, with marine ancestors will help us learn how
osmoregulatory plasticity evolves in response to changing salinity regime.
Besides its role as a respiratory organ, the fish’s highly vascularized gill epithelium is also a key
osmoregulatory organ, serving as a large surface area for the exchange of electrolytes with the
environment. Specialized ionoregulatory cells, called ionocytes, line the gill epithelium and actively
transport ions against their electrochemical gradients to counteract ion imbalances with the environment.
Transepithelial ion transport involves the coordinated action of a distinct configuration of membrane-
bound transporters, which are localized in ionocyte types specialized for ion secretion in SW or
absorption in FW. These salinity-specific ionocytes are taxonomically widespread among euryhaline
organisms and have distinct cellular morphologies, including the apical surface, which is in contact with

48
the water (Lee et al. 1996; Kaneko & Hiroi 2008; Edwards & Marshall 2013). The apical opening of FW-
type ionocytes is relatively large, flat or convex, in relation to surrounding epithelial pavement cells, and
are ridged or studded with microvilli to increase absorptive surface area. In contrast, the apical opening of
SW-type ionocytes is deeply recessed, forming a pit or ‘crypt’, which is often shared in a multicellular
complex of ionocytes and accessory cells (Christensen et al. 2012). The narrow apical opening, formed by
a ring of pavement cells, serves the purpose of concentrating the chloride ions secreted from the ionocytes
in the crypt, which create an electrical gradient favorable for drawing out sodium ions through
paracellular channels that lie between the ionocyte and the accessory cells (Kaneko & Hiroi 2008).
In response to salinity change, euryhaline fishes can rapidly remodel their gill epithelium through
a combination of recruitment of new ionocytes as well as the functional transformation of pre-existing
ionocytes via morphological alteration and translocation of ion transporters (Hiroi et al. 2005). Salinity-
induced remodeling of branchial epithelia has been well described in the developmental process of
smoltification in out-migrating Atlantic Salmon (Salmo salar; Lubin et al. 1989; McCormick 2013), as
well as in Mummichog (Fundulus heteroclitus; Whitehead et al. 2012), Mozambique Tilapia
(Oreochromis mossambicus; Lee et al. 1996; Inokuchi et al. 2009; Choi et al. 2011), and Nile Tilapia (O.
niloticus; Fridman et al. 2011). In these species, researchers characterized the distribution of branchial
ionocytes using scanning electron microscopy (SEM) and/or immunocytochemistry, used to fluorescently
label ion transporters that generally distinguish ionocytes from other epithelial cells (Na+/K+-ATPase;
NKA), as well as to identify specific ionocyte types recruited for ion uptake in FW (e.g., Na+/H+
exchanger; NHE3 and Na+/Cl- cotransporter; NCC) or for ion secretion in SW (e.g., Na+/K+/2Cl-
cotransporter; NKCC). Similarly, FW-type ionocytes have been identified in the swimming legs of a
euryhaline copepod (Eurytemora affinis) via immunostaining of ion transporters (Johnson et al. 2014).
Topological analysis of the gill epithelia is valuable because it consolidates the many molecular
changes that may result from ion perturbation into a quantifiable, integrated osmoregulatory response at
the tissue level. Dual-imaging of branchial ionocytes, which pair scanning electron microscopy (SEM) of
the gill filament with immunolocalization of transporters, have confirmed that superficial differences in

49
apical morphology distinguishable by SEM are directly linked to FW- and SW-cell types (Inokuchi et al.
2009; Choi et al. 2011). This means that quantification of gill ionocyte types based on their morphology
under SEM also characterizes functional differences associated with osmoregulation in FW or SW.
Unfortunately, in situ examinations of how branchial ionocyte composition changes in response
to osmotic stress or across populations are rarely quantified, including tests for divergence among
ecotypes that occupy different salinities. Data are lacking for many euryhaline teleosts, such as the
Threespine Stickleback (Gasterosteus aculeatus; hereafter ‘stickleback’). Across their Holarctic range,
ancestral marine stickleback populations have independently colonized isolated FW lakes and streams,
where they have subsequently undergone evolutionary changes in morphology, life history, and
physiology (Barrett et al. 2011; DeFaveri et al. 2011; Bell & Aguirre 2013). The parallel nature of this
evolution implies local adaptation to local ecological conditions, including environmental osmolality.
Differences in halotolerance have been well-characterized between marine and FW stickleback ecotypes
(e.g., Heuts 1947; DeFaveri & Merilä 2014; Divino et al. 2016; Chapter 1), and this divergence has a
basis in osmoregulatory genes and gene transcripts (e.g., Shimada et al. 2011; Wang et al. 2014). Little is
known, however, about the ultrastructure of the osmoregulatory epithelia of the stickleback gill,
morphological changes in branchial ionocytes in response to osmotic stress, or about how gill
osmoregulatory tissue has evolved among salinity-divergent ecotypes. Branchial ionocytes were
identified in stickleback using transmission electron microscopy, but only generally assessed for
degeneration resulting from exposure to toxicants (Matthiessen & Brafield 1973; Holm et al. 1991).
We used SEM techniques to formally describe effects of salinity on branchial ionocytes in
stickleback. Our objective was to assess how osmoregulatory plasticity of gill tissue has evolved among
representative marine, anadromous, and FW-resident populations. We selected the same Alaskan
populations shown previously to differ in SW tolerance and degree of osmoregulatory investment, as
measured by differences in gill NKA activity (Chapter 1). We tested whether corresponding, population-
level changes in the osmoregulatory response to salinity challenge would be detectable in the composition
of ionocytes on gill epithelia. We hypothesized that mean densities of SW-type ionocytes would increase

50
in fish held in SW, whereas FW-type ionocytes would proliferate following the fish’s exposure to
hypoosmotic conditions. We further predicted that derived stickleback from a landlocked lake would
exhibit divergence with respect to salinity-dependent ionocyte densities on the gill filament in a manner
consistent with local adaption to salinity. Specifically, we expected gill filaments of lake stickleback
exposed to SW to contain relatively less SW-type ionocytes than marine and anadromous counterparts as
a result of relaxed selection on SW tolerance in the derived group. Conversely, the gills of lake
stickleback exposed to FW should have the highest abundance of FW-type ionocytes due to positive
selection on FW tolerance. Finally, given their migratory life history, anadromous stickleback might
exhibit the greatest plasticity among the populations with respect to salinity-specific regulation of
ionocyte types.
Materials & Methods
Fish populations, husbandry, & salinity challenge.— The Threespine Stickleback used in this experiment
were collected from three populations in south-central Alaska, representing marine (Resurrection Bay),
anadromous (Rabbit Slough), and lake (Frog Lake, presumably colonized by anadromous ancestors
10,000-12,000 years ago) ecotypes. Between four and eight full-sibling clutches for each population were
generated via in vitro fertilization of the gametes of male-female pairs to produce an F1 generation, which
we raised in a common environment of 3 ppt. More details about field collection and our fish husbandry
practices can be found in Chapter 1 and in Divino and Schultz (2014).
We performed an acute salinity challenge when the stickleback reached 10-weeks post-hatch, in
which fish from each family were directly transferred from the intermediate rearing salinity into either a
low (FW = 0.4 ppt) or high (SW = 35 ppt) salinity. Treatments were run in duplicate jars with 10 fish per
jar (Fig. 1). We monitored the stickleback at least twice per day for 14 d and removed and recorded
mortalities at each inspection. We maintained water quality and constant salinity throughout the
experiment and fed fish salinity-appropriate suspensions of brine shrimp nauplii beginning on Day 2 of
the trial. This salinity challenge was conducted as part of a larger study and is described in more detail in

51
Chapter 1. All experimentation on animals was approved by the University of Connecticut’s IACUC
(Protocols A10-013 and A13-019).
Gill processing.— At the end of the 2-week trial, we euthanized the stickleback with an overdose of MS-
222 anesthetic (Tricaine-S, Western Chemical, Inc., Ferndale, WA, USA). We then rinsed, blot-dried, and
measured (standard length) the fish as part of a larger sampling effort (see Chapter 1 for details). Subsets
of four stickleback per treatment-population were selected for SEM imaging. We stratified this sampling
by selecting two fish per family and one per jar. We also sampled two stickleback from each population
from the rearing tanks (3 ppt) as controls.
As described in Paolino (2011), we micro-dissected 2-4 branchial arches while the fish lay on ice-
cold glass. Individual gill arches were rinsed with distilled water and immediately submerged in an ice-
cold fixative solution (2% glutaraldehyde and 2% paraformaldehyde in a 0.1 M phosphate buffer; pH 7.4)
in glass vials. The volume of fixative was adjusted to always exceed that of the sample by a factor of 20.
We stored the tissue samples at 4°C until use. To prepare samples for SEM imaging, we washed the
branchial arches in ice-cold 0.1 M phosphate buffer (pH 7.4; 3 x 10 min). After the second rinse, we
selected a single gill arch from the set that appeared in the best condition for imaging. This arch was
incubated in 2% osmium tetroxide in 0.1 M phosphate buffer for 16 h at 4°C, followed by washing with
4°C distilled water (3 x 10 min). We then dried the samples via an ethanol series, incubating them for 15
min in increasing concentrations of ethanol (first in 30%, 50%, and 70% at 4°C and then at room
temperature, once in 95% and finally four times in 100%). Samples were stored in 100% ethanol for 24 h
and then critical point dried using a Polaron E3000 Series Critical Point Drying Apparatus (Polaron
Equipment Ltd., Line Lexington, PA, USA), in which samples were incubated in liquid CO2 for 90 min.
Immediately following critical point drying, the arches were mounted sagittally to aluminum stubs using
double-sided carbon tape, painted with silver, and then sputter-coated using a Polaron Series II Sputtering
System (Type E5100). We imaged specimens at the UConn Bioscience Electron Microscopy Laboratory
(Storrs, CT, USA) using a Zeiss DSM982 Field Emission Scanning Electron Microscope (FESEM; Zeiss

52
Microscopy, Peabody, MA, USA), with an accelerating voltage of 2 kV and a working distance of 7 mm.
For each specimen (N = 30), we imaged the afferent (or trailing) edge of a filament centrally-located on
the gill arch, which was where branchial ionocytes were prevalent (Fig. 2). Specifically, we digitally
captured non-overlapping images of the focal filament at 2000x magnification at approximately evenly-
spaced intervals along the length of the proximal-distal axis (i.e., from the base to the tip; mode = 12
images/filament). Each image included a metric scale bar.
Ionocyte analysis.— Stickleback branchial ionocytes were quantitatively analyzed in the collection of
digital SEM micrographs (N = 341) by three independent observers (JND, DAP, and ZRS). To remove
the possibility of scoring bias, the file names of the images did not reveal information about the specimen
to the analyst. Images were analyzed using ImageJ software (v. 1.51d; Wayne Rasband, National
Institutes of Health; https://imagej.nih.gov/ij/). First, we defined criteria for classifying ionocytes in our
specimens by the morphology of their apical opening, which was based on similarly-described cell types
in Mozambique Tilapia (Table 1; Lee et al. 1996). We then enumerated and categorized ionocytes using
the Cell Counter plugin, scoring them as Type 1 (Wavy Convex), Type 2 (Shallow Basin), Type 3 (Deep
Hole), or a fourth category for ionocytes that could not be equivocally assigned to a morphotype (Table
1). The sum of the cell counts in these four categories yielded total ionocytes.
We calculated the density of each ionocyte type in each image by dividing the cell tally by
epithelial surface area, which we delineated by digitally outlining the filament with a calibrated polygon
(Fig. S1). The filament was carefully traced to only include the portion censused; we excluded areas that
were obstructed, damaged, or out of focus. Overall ionocyte densities were also calculated for the entire
filament (i.e., per fish) by dividing the total counts from the image set for each specimen by the
cumulative surface area censused. To examine ionocyte distribution across gill filament length, we
measured linear distance along the approximate midline of the focal filament in each image. These
segments were summed to yield a total length for each filament, from which we apportioned ionocyte

53
densities and proportional composition of cell types into 10 standardized percentiles (deciles). Due to
differences in absolute filament length among fish, sample sizes varied among deciles (N’s = 31-39).
The density of ionocytes per fish was statistically analyzed using two-way ANOVA, testing for
effects of population, salinity, and their interaction. Fish family and jars were pooled to increase sample
size. To analyze patterns of ionocyte distribution along the proximal-distal axis of the gill filament, we
constructed a linear mixed-effects model using the ‘lmer’ function in the lme4 package in R (R Core
Team 2016). Here the abundance of total ionocytes in each SEM image was examined across the
standardized deciles of filament length, with the individual fish included as a random effect. We ran
similar models with the proportion of each ionocyte type as the response variable. We performed Tukey’s
HSD post hoc multiple-comparison tests on overall significant effects (P < 0.05) to elucidate group
differences.
In 2012, we performed a similar salinity challenge experiment on 3-month-old, F1-generation
stickleback from the same anadromous population (Rabbit Slough). However, a large proportion of the
mounted gill preparations were of poor quality (Fig. S2), so only qualitative results are presented here.
Results
Density estimates of total branchial ionocytes ranged from 0.406 ± 0.022 to 0.464 ± 0.027 cells/100 µm2
(mean ± SE) among the three observers. The total number of ionocytes counted per image was strongly
positively correlated between combinations of observer pairs (Pearson’s r = 0.87-0.89). Following this
among-observer validation for precision in the image analysis, we report here the results from the most
comprehensive census performed by JND.
All three ionocyte morphotypes were clearly identifiable in both 10-week and 22-week-old
stickleback (Figs. 3 and 4). In the former image set, we counted a total of 1,962 branchial ionocytes, of
which ~53% could be unambiguously categorized. Ionocytes were detected in approximately 94% of the
images (319/341). At least one of the specific ionocyte types was absent in 54-66% of the images. All 30
specimens contained unidentifiable (Type 4) ionocytes, as well as the transitional Type 2 category. Type

54
1 ionocytes were absent in two stickleback held in SW; Type 3 ionocytes absent in eight fish, seven of
which were from the FW treatment.
We found no differences in ionocyte density among populations or in the population*salinity
interaction for any category (P’s ≥ 0.2). Salinity did not affect Type 1 or Type 2 ionocyte densities (Fig.
5A,B; P’s ≥ 0.1). However, an overall salinity effect was detected for Type 3 ionocyte density, which
increased 6.6-fold in SW compared to the other treatments (Fig. 5C; 0.153 vs. 0.023 cells/100 µm2; P =
0.001). An overall salinity effect was also present in the total ionocyte density (which includes the
unidentifiable group): abundance was more than 50% higher in the fish held in FW or SW compared to
the control group (Fig. 5D; 0.501 vs. 0.319 cells/100 µm2; P = 0.02).
Ionocytes of all types were present along the entire proximal-distal axis of the gill filament, but
their abundance differed among deciles (Fig. 6; P’s ≤ 0.008). In general, the distribution of ionocytes
across filament length was concave, with lower densities typically at the base and/or the tip, i.e., the 10th
and 90th deciles. The relative proportions of Type 2 and 3 cells did not vary across filament length (P’s ≥
0.1), but this effect was significant for Type 1 ionocytes (P = 0.04), with fewer found at the distal end
than in the 20th percentile (Fig. 7). Unidentifiable ionocyte types composed the greatest proportion of cells
in each decile.
Discussion
Invasion of FW environments by marine organisms produces derived populations that experience new
selective pressures on the osmoregulatory system. Specifically, there is positive selection on the capacity
to hyper-osmoregulate in the ion-poor environment and relaxed selection on hypo-osmoregulation. We
examined the effects of the interplay of these evolutionary forces on the ion-exchanging surface of the gill
in marine versus landlocked Threespine Stickleback. We quantified osmoregulatory responses to salinity
challenge in juveniles of each ecotype, using SEM to identify and count ionocytes, and found no
interpopulation differences. Across all populations, juvenile stickleback upregulated ionocytes in response
to both hyper- and hypo-osmotic stress. In SW, this was most markedly demonstrated by the induction of
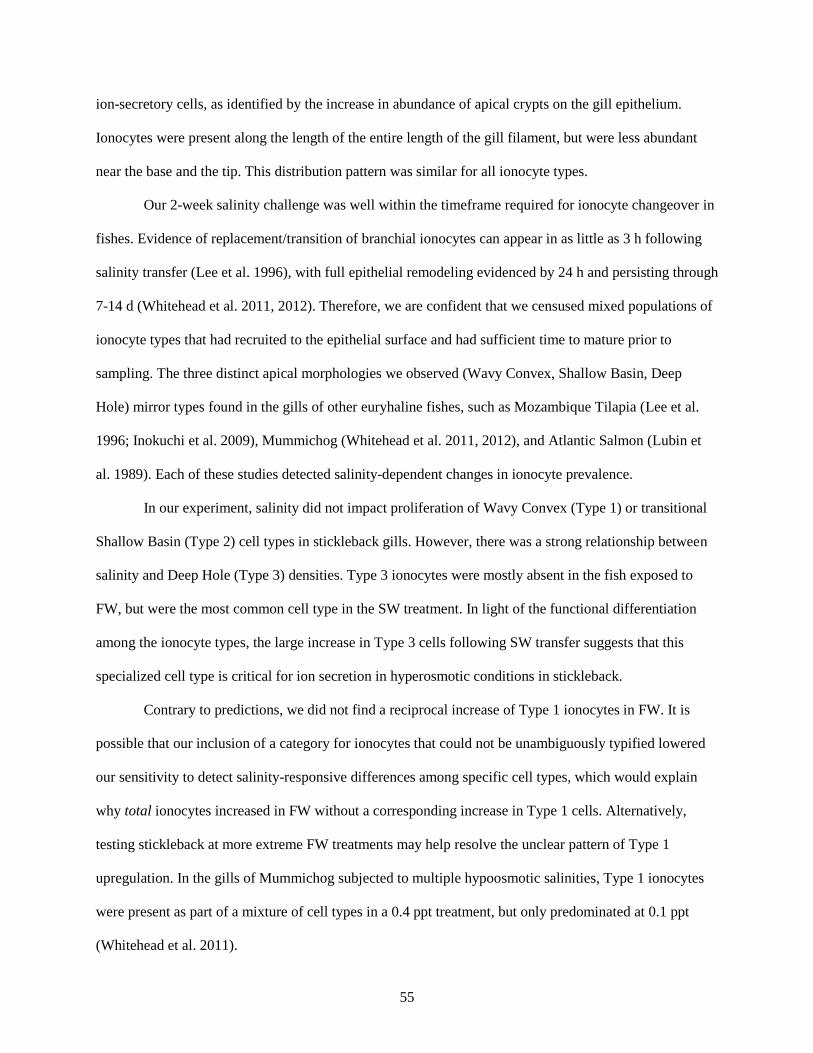
55
ion-secretory cells, as identified by the increase in abundance of apical crypts on the gill epithelium.
Ionocytes were present along the length of the entire length of the gill filament, but were less abundant
near the base and the tip. This distribution pattern was similar for all ionocyte types.
Our 2-week salinity challenge was well within the timeframe required for ionocyte changeover in
fishes. Evidence of replacement/transition of branchial ionocytes can appear in as little as 3 h following
salinity transfer (Lee et al. 1996), with full epithelial remodeling evidenced by 24 h and persisting through
7-14 d (Whitehead et al. 2011, 2012). Therefore, we are confident that we censused mixed populations of
ionocyte types that had recruited to the epithelial surface and had sufficient time to mature prior to
sampling. The three distinct apical morphologies we observed (Wavy Convex, Shallow Basin, Deep
Hole) mirror types found in the gills of other euryhaline fishes, such as Mozambique Tilapia (Lee et al.
1996; Inokuchi et al. 2009), Mummichog (Whitehead et al. 2011, 2012), and Atlantic Salmon (Lubin et
al. 1989). Each of these studies detected salinity-dependent changes in ionocyte prevalence.
In our experiment, salinity did not impact proliferation of Wavy Convex (Type 1) or transitional
Shallow Basin (Type 2) cell types in stickleback gills. However, there was a strong relationship between
salinity and Deep Hole (Type 3) densities. Type 3 ionocytes were mostly absent in the fish exposed to
FW, but were the most common cell type in the SW treatment. In light of the functional differentiation
among the ionocyte types, the large increase in Type 3 cells following SW transfer suggests that this
specialized cell type is critical for ion secretion in hyperosmotic conditions in stickleback.
Contrary to predictions, we did not find a reciprocal increase of Type 1 ionocytes in FW. It is
possible that our inclusion of a category for ionocytes that could not be unambiguously typified lowered
our sensitivity to detect salinity-responsive differences among specific cell types, which would explain
why total ionocytes increased in FW without a corresponding increase in Type 1 cells. Alternatively,
testing stickleback at more extreme FW treatments may help resolve the unclear pattern of Type 1
upregulation. In the gills of Mummichog subjected to multiple hypoosmotic salinities, Type 1 ionocytes
were present as part of a mixture of cell types in a 0.4 ppt treatment, but only predominated at 0.1 ppt
(Whitehead et al. 2011).

56
More generally, the density of total ionocytes increased in FW and in SW, relative to control
conditions. The proliferation of branchial ionocytes in response to both hypo- and hyperosmotic challenge
may indicate an increase in energetic expenditure on osmoregulation. Since both FW and SW-type
ionocytes are powered by ATP-consuming NKA pumps (Edwards & Marshall 2013; Hwang & Lin 2013),
higher ionocyte densities likely translates into higher energetic costs. In contrast, fewer ionocytes in the
unchallenged controls suggest that stickleback in a less hypotonic rearing salinity (3 ppt) did not need to
invest as much in maintaining ion balance. Interestingly, our whole-tissue findings corroborate results at
the molecular level: the convex, or “U”-shaped, relationship between ionocyte abundance and salinity is
similar to the pattern recorded for gill NKA activity levels in these populations (Chapter 1). Gill filaments
from stickleback exposed to additional salinities nearer isosmotic conditions should be analyzed to
examine the relationship between salinity and branchial ionocyte abundance more fully.
Our positional analysis along the proximal-distal axis revealed that most of the length of the
afferent (trailing) edge of the stickleback gill is used in osmoregulation, with the possible exception of the
innermost and outermost ends, which had less than half as many ionocytes. We did not find proportional
differences among the cell types by filament length, except in a pair of deciles for Type 1 cells.
We did not find differences in branchial ionocyte composition among stickleback populations,
which would indicate evolution of the osmoregulation system at the tissue level. This result was
somewhat unexpected, since juveniles from these populations displayed some differences in SW tolerance
in a series of salinity challenges (see Chapter 1). However, the decreased SW tolerance in Frog Lake
juveniles was restricted to earlier ontogeny: although no 3-week-old lake fry survived 35 ppt, our SEM
samples originated from the survivors of the Week 10 trial, when survival at this treatment was similar
among populations (older lake juveniles only had poorer survival in hypersaline conditions). Alternative
explanations for the lack of population differences in ionocyte density include small sample size and
survivor bias. We only quantified ionocyte density in the fish that successfully acclimated to the transfer
salinity; it is possible that ionocyte densities were lower in the individuals that died, assuming mortality
was linked with osmoregulatory failure.

57
In conclusion, our SEM image analysis of the stickleback gill demonstrates a valuable,
quantitative technique for assessing osmoregulatory responses to osmotic stress and for identifying how
this plasticity might differ among populations. In situ examination of branchial ionocytes should be
included as part of an integrative biological approach to understanding the evolution of osmoregulation,
which links whole-organism performance with underlying molecular mechanisms. Our knowledge of
comparative physiology in stickleback, especially at the tissue and organ-level, is lacking. The numerous
marine and FW-resident populations of Threespine Stickleback offer a unique natural experiment for
assessing the evolution of physiological plasticity under different salinity regimes. Future investigations
should include additional derived populations, especially ones with known dates of colonization, to test
for robustness and parallelism in osmoregulatory divergence subsequent to FW establishment. Different
age-classes should also be tested, including earlier life stages, which may have less developed
osmoregulatory capability. Physiological examination of the stickleback radiation will reveal general
mechanistic patterns applicable to other aquatic organisms and lead to new predictions about
osmoregulatory evolution following FW invasion.

58
58
Table 1. Classification of branchial ionocytes in juvenile Threespine Stickleback, as viewed under scanning electron microscopy. Ionocytes were
identified as one of three major types, sensu Lee et al. (1996), based on their apical morphologies visible at junctions of plate-like pavement cells
on the gill filament epithelium. We also enumerated ionocytes that could not be firmly categorized.
Category Ionocyte Type
(Example) Morphological Description Proposed Function a
1 Wavy Convex
(Figs. 3B, 4B)
Apical surface is flush with adjacent pavement cell membranes
on the gill filament and is studded with “wavy” ridges of
microvilli that appear white (and may show signs of flaking on
the specimen). When fully developed, this cell has the largest
surface area of the three types.
The ridged surface of microvilli
maximizes the area of the apical
membrane exposed for ion uptake in FW.
2 Shallow Basin
(Figs. 3C, 4C)
At least a portion of the apical surface is partially recessed
beneath the adjacent pavement cells, but it is visible and may be
smooth or ridged. This is a transitional cell type between Types
‘1’ and ‘3’ and its surface area varies accordingly.
The partially-recessed apical crypt
facilitates ion secretion in SW; considered
a transitional ionocyte form that is often
visible during gill remodeling.
3 Deep Hole
(Figs. 3D, 4D)
Dark apical pit, conspicuously outlined by a ring of pavement
cell membrane. The apical surface is so far recessed that it is
usually not visible. When fully developed, the diameter of the
opening shrinks to form a so called ‘apical crypt’.
The deeply-recessed apical crypt is part of
a multi-cellular complex adapted for ion
secretion, involving one or several
ionocytes, accessory cells, and their
paracellular junctions.
4 Unidentifiable
(Fig. S1A)
An ionocyte is present, but the specific type cannot be
conclusively determined, either because it possesses a
characteristic of each of the three major cell types, or it is
partially hidden from view, damaged, obscured by debris, or not
in focus.
NA
a References: Evans et al. 2005; Hiroi et al. 2005; Kaneko & Hiroi 2008; Christensen et al. 2012.

59
Figure 1. Schematic of the 14-d, multi-population salinity challenge performed on 10-week-old
Threespine Stickleback. Full-sibling families belonging to representative marine (M; Resurrection Bay),
anadromous (A; Rabbit Slough), and landlocked (L; Frog Lake) populations were transferred into
duplicate jars containing 1.5 L of either FW (0.4 ppt) or SW (35 ppt) at a density of 10 individuals per jar.
Additional fish held in the common rearing salinity (3 ppt) served as controls. At the end of the trial, gill
arches were sampled from a subset of survivors for scanning electron microscopy image analysis.
Population
1 2 1 2 1 2
FW
(0.4 ppt)
1
2
.
.
.
M M
.
.
.
.
.
.
M M
A A
.
.
.
.
.
.
A A
L L
.
.
.
.
.
.
L L
Control (3 ppt)
1
2
.
.
.
M
.
.
.
M
A
.
.
.
A
L
.
.
.
L
SW
(35 ppt)
1
2
.
.
.
M M
.
.
.
.
.
.
M M
A A
.
.
.
.
.
.
A A
L L
.
.
.
.
.
.
L L
Family
Jar

60
Figure captions for the micrographs
Figure 2. Morphology of the juvenile stickleback gill, as viewed using a scanning electron microscope
(SEM). (A) Dorsal view of a branchial arch, with blue lines overlaid to show the direction of water flow
over the gill filaments. (The dorsal-most filaments in this specimen are missing/damaged.) Scale bar =
200 μm (100x magnification). The white box inset is enlarged in panel (B), on which arrows indicate
ionocytes (‘Deep Hole’ type) on the afferent (trailing) edge of the filament (Af), which is the side we
analyzed. Ef = Efferent (leading) edge of the filament; L = lamellae. Scale bar = 50 µm (500x mag.). (C)
Lateral view of a branchial arch (BA), illustrating how the afferent and efferent edges of the filaments (F)
interdigitate. R = raker. Anatomical orientation: A = anterior, P = posterior, D = dorsal, V = ventral. Scale
bar = 250 μm.
Figure 3. Representative SEM images from 10-week-old Threespine Stickleback. (A) The entire
branchial arch from which the entire length of the trailing edge of one centrally located filament was
imaged and analyzed. Anatomical compass as detailed in Fig. 2. Scale bar = 500 μm (50x magnification).
(B-D) Micrographs of the surface of the trailing edge of the gill filament, highlighting apical
morphologies of the three major ionocyte types. Pavement cells are marked with asterisks. Scale bars =
10 μm (2,000x mag.). Arrows point to (B) ‘Wavy Convex’ (FW - Type 1), (C) ‘Shallow Basin’
(transitioning - Type 2), or (D) ‘Deep Hole’ (SW - Type 3) ionocytes, as described by Lee et al. (1996).
Figure 4. Representative SEM images from 22-week-old Threespine Stickleback. (A) The entire
branchial arch from which the entire length of the trailing edge of one centrally located filament was
imaged and analyzed. Anatomical compass as in Fig. 2. Scale bar = 1 mm (45x magnification). (B-D)
Micrographs of the surface of the trailing edge of the gill filament, highlighting apical morphologies of
the three major ionocyte types. Pavement cells are marked with asterisks. Scale bars = 10 μm (2,350x

61
mag.). Arrows point to (B) ‘Wavy Convex’ (FW - Type 1), (C) ‘Shallow Basin’ (transitioning - Type 2),
or (D) ‘Deep Hole’ (SW - Type 3) ionocytes, as described by Lee et al. (1996).
Figure S1. Example of a SEM image of a stickleback gill filament processed for quantitative analysis
using ImageJ. Ionocytes were flagged with a color-coded, numeric label (see Table 1). A polygon (red)
was then traced to measure the surface area within the boundaries of the census. A linear distance
(yellow) was also measured along the proximal-distal axis at the mid-line of the filament. All
measurements were calibrated to the scale bar.
Figure S2. Examples of the most common issues encountered during SEM image analysis of branchial
ionocytes in stickleback. (A) Granular debris obscuring the apical surfaces of ionocytes (arrows).
Ionocytes that prolapsed or ruptured during sample preparation had a similar appearance. (B) Wrinkled or
folded epithelial surface. (C) Portions of the afferent edge of the gill filament (Af) obscured from view, in
this case by lamellae (L) from adjacent filaments. (D) Fissures in the epithelial layer or broken filaments.
Scale bars = 10 μm.

62
62
Figure 2.

63
63
Figure 3.

64
64
Figure 4.

65
Figure 5. Branchial ionocyte densities in 10-week-old marine (Resurrection Bay; green circles),
anadromous (Rabbit Slough; red squares), and landlocked (Frog Lake; blue triangles) Threespine
Stickleback, as observed by scanning electron microscopy. Gills were sampled from survivors held in FW
(0.4 ppt) or SW (35 ppt) for two weeks (N = 4), as well as unchallenged controls in the rearing salinity (3
ppt; N = 2). Ionocytes were enumerated on the afferent edge of a centrally-located gill filament and
categorized by their apical morphology (see Table 1 for details). Mean abundance (± SE) of (A) Type 1-
Wavy Convex, (B) Type 2-Shallow Basin, or (C) Type 3-Deep Hole ionocytes is presented for each
population. (D) Total ionocyte density (including unidentifiable types) was also quantified. Letters
identify salinities that differed significantly, according to Tukey post hoc tests.

66
Figure 6. Distribution of branchial ionocytes along the proximal-distal axis of the stickleback gill
filament. Mean (± SE) abundance of (A) Type 1-Wavy Convex, (B) Type 2-Shallow Basin, (C) Type 3-
Deep Hole, and (D) total ionocytes (including unidentifiable types) are presented for each standardized
percentile of filament length along the proximal-distal (P→D) axis. Due to differences in absolute
filament length among fish, sample sizes varied among deciles (N’s = 31-39). Letters denote percentiles
that differed significantly, according to Tukey post hoc tests.

67
Figure 7. Stacked bar chart of proportions of each ionocyte type by percentile of filament length along
the proximal-distal (P→D) axis. T1=Type 1 (Wavy Convex), T2=Type 2 (Shallow Basin), T3=Type 3
(Deep Hole), and T4=Type 4 (Unidentifiable types). Due to differences in filament length among fish,
sample sizes varied among standardized deciles (N’s = 31-39). The letters mark the only significantly
different pair of proportions, according to Tukey post hoc tests.

68
68
Figure S1.

69
69
Figure S2.

70
Chapter 3
Osmoregulatory physiology and rapid evolution of salinity tolerance in Threespine Stickleback
recently introduced to fresh water
Introduction
The degree to which an organism can physiologically adjust to counter abrupt environmental
change has important implications for adaptation. Physiological plasticity, i.e., wide tolerance ranges for
factors such as temperature, and nutrient, oxygen and osmotic concentrations, offers the fitness
advantages of higher survival in a broader range of conditions and the ability to traverse patches of
unsuitable habitat. However, there are constraints on the direction and magnitude of plasticity (Snell-
Rood 2012) and it does not always evolve adaptively (Ghalambor et al. 2015). Plasticity may also be lost
in canalized phenotypes that are locally-adapted to the new environment (Lande 2009; Snell-Rood 2012).
These complexities compel us to ask: how rapidly can tolerance thresholds evolve in populations, and
under what ecological circumstances will specialization be favored?
The potential evolutionary outcomes of plasticity can be examined in aquatic organisms that have
undergone halohabitat transitions (Schultz & McCormick 2013; Lee 2016). Euryhalinity, the ability to
survive across a wide salinity spectrum, is an important evolutionary innovation that facilitated range
expansion and rapid adaptation of marine or estuarine taxa to freshwater (FW) halohabitats (Lee & Bell
1999; Schultz & McCormick 2013). Colonization of geographically isolated and heterogeneous FW
habitats by founding euryhaline fishes that are capable of crossing osmotic barriers has often yielded
prolific radiations in FW lakes and streams (Bell & Foster 1994; Betancur-R 2010; Nakatani et al. 2011).
When a marine population invades FW, positive selection for enhanced performance in ion-poor
conditions is initially intense because survival is contingent on maintaining ion homeostasis.
Consequently, FW tolerance is expected to improve rapidly as FW descendants adapt to local conditions,
possibly through a selective sweep of co-adapted FW-osmoregulatory gene complexes (DeFaveri et al.
2011; Hohenlohe et al. 2012; Jones et al. 2012b). In contrast, because selection for seawater (SW)
tolerance is no longer imposed on the derived population, euryhalinity might erode through mutation

71
accumulation in the gene networks underlying hypo-osmoregulation (Snell-Rood et al. 2010). The
evolutionary effects of relaxed selection are less clear because they may depend on maintenance costs and
pleiotropy of the genes essential for hypo-osmoregulation (Lahti et al. 2009; Brennan et al. 2015). If
energetic costs to maintain a functional osmoregulatory response to high salinity are high or the genes
involved largely reside in a distinct regulatory module, then loss of these traits should be more rapid than
if costs are small or genes are highly integrated within networks necessary for the fish to function in FW.
Evidence of local evolution of halotolerance among fish populations from contrasting salinity
regimes is extensive (e.g., Whitehead 2010; Brennan et al. 2015; Velotta et al. 2015). In the majority of
halotolerance studies, however, the populations or species pairs tested diverged thousands of years ago,
which precludes characterization of the incipient effects of selection on the osmoregulatory system in real
time. The euryhaline Threespine Stickleback (Gasterosteus aculeatus) is an ideal model to capture the
pace of physiological evolution because it has a well-documented history of parallel divergence following
transitions from marine to FW habitats across its circumpolar range. Lab-based manipulations of
stickleback have also demonstrated rapid evolution of traits such as trophic morphology and cold
tolerance after only a few generations (Wund et al. 2008; Barrett et al. 2011). FW colonization, and
subsequent adaptation, have become a prime example of ecological speciation by giving rise to a
replicated set of derived FW populations whose ages vary from the post-glacial Pleistocene (10,000-
20,000 years ago; Bell & Foster 1994) to only a few generations (von Hippel & Weigner 2004; Gelmond
et al. 2009; Bell & Aguirre 2013). The persistence of the SW-adapted lineage of ancestral
marine/anadromous (collectively called oceanic) phenotypes has allowed evolutionary biologists to make
direct experimental comparisons between ancestral and derived forms to aid our understanding of the
evolutionary consequences of halohabitat transitions. Salinity transfer experiments between oceanic and
lake-resident ecotypes have demonstrated salinity-dependent differences in survival that correlate with
approximate native salinity, with enhanced FW tolerance and/or lower SW tolerance in derived
populations (Heuts 1947; Marchinko & Schluter 2007; McCairns & Bernatchez 2010; DeFaveri & Merilä
2014). Recent work has shown that ancestral and derived phenotypes exhibit divergence in
72
osmoregulatory genes (DeFaveri et al. 2011; Shimada et al. 2011; Jones et al. 2012a; DeFaveri & Merilä
2013) as well as osmoregulatory gene transcription (McCairns & Bernatchez 2010; Taugbøl et al. 2014).
A major site of osmoregulation is the vascularized gill epithelium, where specialized ion
transporting cells called ionocytes buffer against osmotic perturbations by taking up ions from the
environment (hyper-osmoregulation) or secreting excess ions from circulating plasma (hypo-
osmoregulation) to compensate for diffusive ion losses in FW or gains in SW (Edwards & Marshall
2013). Detailed models of teleost branchial ionocyte function in FW and SW have mapped suites of
membrane-bound transporters that control the intake or expulsion of ions. The basolateral sodium-
potassium ATPase pump (NKA) is required for both functions because it produces electrochemical
gradients across the cell membrane that drive the coordinated work of secondary co-transporters and
exchangers (Edwards & Marshall 2013). However, NKA is often upregulated in SW exposure because it
facilitates paracellular extrusion of sodium and also powers the sodium-potassium-chloride cotransporter
(NKCC), which is involved in chloride secretion (reviewed by McCormick 2001; Kaneko & Hiroi 2008).
In addition to actively pumping ions to maintain homeostasis of the extracellular fluid, fishes also
regulate cell volume by adjusting intracellular concentrations of organic osmolytes, which are uncharged
solutes that increase osmolality without interfering with cellular biochemistry and can also have other
cytoprotectant roles (Yancey et al. 1982; Kültz 2012). Compatible osmolytes, such as taurine and other
free amino acids, are upregulated in response to a rise in the osmolality of extracellular fluid during
hyperosmotic stress in at least some bony fishes (Fiess et al. 2007). Conversely, osmolytes are
downregulated when plasma osmolality drops (Edwards & Marshall 2013). Therefore, in at least some
species, measurements of tissue osmolyte levels can serve as an indicator of plasma osmolality in the
extracellular fluid, for instance, where blood samples cannot be acquired.
The precise physiological mechanisms by which euryhaline fishes adjust their osmoregulatory
systems have been intensively studied in several diverse groups of teleosts, including eels, clupeids,
salmonids, killifish, and tilapia (reviewed by Evans et al. 2005; McCormick et al. 2013a). Considering the
potential importance of environmental salinity for shaping the stickleback radiation, the lack of

73
mechanistic, physiological data on this intensively-studied, evolutionary model species is surprising.
Moreover, given the diverse mechanisms of ion uptake in FW described in other euryhaline models
(Hwang & Lin 2013; Hsu et al. 2014), we cannot assume that osmoregulatory adaptations in
Gasterosteiformes have followed the same evolutionary trajectory.
The goals of this study were to measure how rapidly osmoregulatory responses evolve after
oceanic stickleback initiate FW residency and to characterize the physiological mechanisms underpinning
such divergence. In a common lab environment, we reared F1-generation stickleback from both an
anadromous population and its descendants, which had been introduced approximately two generations
earlier to nearby, landlocked lakes (Bell et al. 2016). We then compared halotolerance thresholds in
members of the ancestral and derived populations by conducting “direct” and “gradual” salinity challenge
experiments, which measure osmoregulatory capacity in complementary ways (Schultz & McCormick
2013). Direct salinity transfers assess acute osmoregulatory responses to abrupt osmotic shock. In the
gradual design, salinity is changed incrementally, which reveals physiological effects of chronic exposure
and also measures absolute halotolerance limits by allowing fish time to acclimate.
Our main objectives were to compare survival between ancestral and derived stickleback
subjected to osmotic challenge and to mechanistically link divergence in performance to osmoregulatory
machinery at the molecular and tissue levels. We adopted an integrated organismal approach, uniting
multiple levels of physiological responses to provide functional explanations for halotolerance
differences. We hypothesized that, compared to juveniles from an anadromous population, lake-
introduced stickleback would exhibit a halotolerance shift towards FW and away from SW, and that their
diminished hypo-osmoregulatory response would be evidenced by lower gill NKA activity and NKCC
abundance in SW. Furthermore, the signs of osmotic stress would be detectable in organic osmolyte
content, with departures from baseline levels indicating osmotic perturbation. Specifically, we predicted
the lake-introduced stickleback would have a greater increase in organic osmolytes in SW to mitigate the
effects of higher plasma osmolality. Conversely, anadromous stickleback would downregulate organic
osmolytes to offset their relatively lower plasma osmolality when held in ion-poor conditions.

74
Materials & Methods
Source populations & fish husbandry.— Threespine Stickleback used in this study were sampled from an
anadromous population in Rabbit Slough (RS) of the Matanuska-Susitna Borough, Alaska, and two
Southcentral Alaskan lake populations derived from it (Bell et al. 2016). In 2009 and 2011, respectively,
~3,000 anadromous RS adults were captured at a culvert running under the Parks Highway near Palmer
(61.534°N, 149.268°W) and released into Cheney Lake (CL; 61.200°N, 149.762°W; conductivity = ~168
µS/cm), located in the Anchorage Municipality, and Scout Lake (SL; 60.535°N, 150.832°W; conductivity
= ~35 µS/cm), located to the south on the Kenai Peninsula. Both lakes lack outlet streams and had been
treated with rotenone by the Alaska Department of Fish and Game to exterminate Northern Pike (Esox
lucius); this treatment also eradicated the native Threespine Stickleback populations.
In May-June 2012, breeding stickleback from all three locales were trapped using unbaited, steel
minnow traps (0.32 cm mesh) set overnight. Adults were brought to the University of Alaska Anchorage,
where we produced an F1 generation of more than 1,700 embryos from each population through “mass
cross” in vitro fertilization. Gametes from multiple males and females were mixed prior to fertilization to
increase genetic diversity. The number of parents used in the mass cross depended on the size of the
female and trapping success: RS = 10 males and 7 females; SL = 15 males and 15 females; CL = 1 male
and 10 females. Beginning with the initial cohort that hatched in each of the lakes during the summer of
introduction, the experimental progeny from SL had persisted in FW for 2 generations, and the progeny
from CL had persisted in FW for 3-4 generations, depending on whether they bred after 1 or 2 years post-
introduction (Bell et al. 2016).
Fertilized embryos were disinfected with methylene blue and furan (Aquarium Pharmaceuticals,
Inc., Chalfont, PA, USA), placed in aerated, 3 ppt water, and shipped to the University of Connecticut’s
Aquatic Facility, where they developed in a common environment. The fish were raised in reverse
osmosis water in which Instant Ocean aquarium salt was dissolved to a salinity of 3 ppt, as measured by a
digital salinometer (Yellow Springs Instruments 85, Yellow Springs, OH, USA). Fish were held in

75
replicate 38-L aquaria, equipped with filters and maintained at 19 ± 1°C with a 14-h light: 10-h dark
photoperiod. Larval stickleback were fed brine shrimp nauplii, which had been gut-enriched with Self-
Emulsifying Lipid Concentrate (SELCO, Brine Shrimp Direct, Ogden, UT, USA). We transitioned one
month-old juveniles to a pelleted feed (Golden Pearls, Brine Shrimp Direct; Divino & Schultz 2014).
The direct salinity transfer.— When the F1 cohort reached 6-weeks post-hatch (mean standard length =
16.7 mm ± 1.9 SD), 410 of the lab-reared individuals from each source population were randomly
selected for an abrupt salinity challenge in which they were directly transferred from the rearing salinity
into wide-mouth mason jars (Ball brand) containing 1.5 L of water at one of seven salinity treatments at a
density of 10 fish per jar (50-60 individuals per salinity per population; Fig. 1). Three hypoosmotic (0,
0.2, 0.4 ppt) and four hyperosmotic salinity treatments (35, 40, 45, 50 ppt) were chosen to encompass
anticipated lower and upper tolerance limits. Approximate conductivities for these seven treatments were:
6, 353, and 677 µS/cm for the low salinity treatments and 50.7, 57.2, 63.7, and 70.3 mS/cm for the high
salinity treatments. To obtain baseline physiological data, fish were sampled from a control jar (3 ppt;
conductivity = 4.9 mS/cm) on Day 0 of the time course. Because mortality had been nonexistent for
stickleback juveniles held in jars at the rearing salinity in numerous salinity trials (J. Divino, unpubl.
data), we did not collect additional controls at each time point.
Salinity-challenged fish were monitored at least twice per day for 10 d; at each inspection,
mortalities were recorded and immediately removed. To capture potential temporal dynamics in
physiological responses to salinity stress, acutely-challenged stickleback were sampled during the time
course on Days 0, 0.25, 1, 3, 7, and 10 (Fig. 1). To increase sample size necessary for obtaining additional
gill samples for molecular analyses after salinity acclimation, additional jars of fish were set up for
sampling on Day 7 of the trial. We periodically checked ammonium, nitrite, nitrate, and pH levels in jars
(Aquarium Pharmaceuticals, Inc.) and maintained water quality throughout the experiment through a
combination of debris removal and water changes. Fish were fed pelleted feed beginning on Day 2 of the
trial.

76
Owing to differences in hatch date, this experiment was performed separately on 6-week-old CL
juveniles. During this period, however, maintenance work was performed on the reverse osmosis water
supply, which we believe caused high mortality across the three hypoosmotic treatments, including
complete loss of the 0.2 ppt group. Therefore, we have excluded direct transfer results on CL fish.
Each RS and SL fish in the direct transfer experiment was coded as either a mortality or a right-
censored event (i.e., sampled fish or final survivors), with time-to-event recorded in either case. A mixed-
effects, Cox proportional hazard model (coxme package in R; R Core Team 2016) was used to analyze the
effects of population, salinity, and their interaction on survival in the lower and upper halotolerance
thresholds (which we determined from the trial to be 0 and 40 ppt, see Results), with experimental jar as a
random effect. To further characterize the relationship between population and salinity, we performed
log-rank tests on Kaplan-Meier survival curves between each population at each threshold salinity
(survdiff function in the survival package in R), with jar included as a factor. Excluding jar as a factor did
not change the statistical outcomes of either the Cox or log-rank tests (data not shown).
For each population-salinity combination, mean proportion survival was calculated at each
inspection out of a declining number of fish “at risk” due to censoring. Just prior to the Day 3 sampling,
when most of the mortality had ceased (see Results), we estimated lower- and upper-limit lethal salinity
concentrations, LCx (expressed in ppt, where x is percent survival), using logistic regression. For each
population, proportion of stickleback alive per jar (at 67 h) was plotted across the three FW treatments (0,
0.2, and 0.4 ppt) and the four high salinity treatments (35, 40, 45, and 50 ppt), and LCx was calculated
from fitted curves. It is conventional to report LC50, but because of high survival of SL juveniles in 0 ppt
(see Results), LC85 was the lowest common salinity calculable for quantifying FW halotolerance across
populations.
The gradual seawater challenge.— We also performed a gradual salinity challenge experiment on 100 3-
week-old, F1 juveniles from RS, SL, and CL. Fifty fish were transferred into duplicate, 19-L aquaria
initially containing the common rearing salinity (3 ppt water), which we increased by 2 ppt·d-1. Each tank

77
was equipped with a Penguin 100 power filter with bio-wheel (Marineland Aquarium Products,
Cincinnati, OH, USA), and a segment of plastic pipe fitted with plastic plants provided habitat
enrichment. Fish were fed gut-enriched nauplii and/or pellets daily. The experiment ended at the salinity
in which at least 50% of the current cohort died (the cohort LC50). At the end of the trial, all survivors
were sampled either for gill tissue or whole-body water content and osmolyte analysis, as described
below.
Molecular assays.— At the designated time points of the direct salinity trial, fish were euthanized with an
overdose of MS-222 anesthetic in a salinity approximating that of the challenge treatment. Eight samples
were collected per jar, except in a few cases where this target could not be reached due to mortality. Fish
were first rinsed in deionized water, blot-dried, and then measured (standard length) using digital calipers.
Gill tissue or body samples were collected in pairs of low and high salinity treatments (Fig. 1). Branchial
baskets from individuals in the 0.2 ppt and 35 ppt treatments were micro-dissected on ice-cold glass and
snap frozen on dry ice, either in empty microcentrifuge tubes for NKCC protein abundance, or in tubes
containing 100 µL of sucrose-EDTA-imidazole (SEI) buffer for NKA activity (McCormick 1993). For
body water and osmolyte analysis, we chose stickleback from the 0 and 40 ppt treatments because
inclusion of the branchial basket in the sample was necessary for measurement accuracy. These
stickleback were eviscerated (to remove potentially confounding influence of the gut lumen), weighed to
0.01 mg, dried to a constant mass (48 h at 60°C), and reweighed. Percent water content was calculated as
the proportional difference between the sample’s wet and dry masses multiplied by 100.
Gill NKCC protein abundance was quantified by SDS polyacrylamide gel electrophoresis (SDS-
PAGE) followed by Western immunoblotting with infrared (IR) detection. Gill tissue was thawed and
homogenized using a Kontes motorized pellet pestle (Kimble-Chase, Vineland, NJ, USA) in a buffer
containing 1% Triton X-100 and protease inhibitors (Roche Diagnostics Corp., Indianapolis, IN, USA).
Homogenates were then centrifuged at 13,000 rpm for 10 min at 4°C to remove insoluble material. Total
protein concentration of the supernatant was determined using a Pierce BCA Protein Assay kit

78
(ThermoFisher, Waltham, MA, USA). Samples were mixed with a 4x-concentrated Laemmli buffer
containing 8% SDS. Ten µg of protein was loaded into each of 11 sample lanes in 12-well pre-cast, 7.5%
acrylamide TGX gels (Bio-Rad, Hercules, CA, USA). A molecular weight ladder was loaded into the first
lane of each gel, and to control for potential blot-to-blot variation in signal intensity, a common calibrator
sample was also added into this lane, which we prepared by pooling gill homogenates from several 19-
week-old juveniles that had been exposed to 35 ppt for 7 d. Proteins separated through the gel at 250 V
for 45 min and were then wet-transferred onto nitrocellulose membranes by submerging both in ice-cold
Tris-glycine sample buffer and applying 400 mA current for 90 min. We probed blots for NKCC with the
monoclonal T4 antibody (mouse IgG1; Developmental Studies Hybridoma Bank, University of Iowa,
Iowa City, USA), which binds to the conserved carboxy-terminus region of the protein (MET902-
SER1212). This antibody detects both NKCC1 and NKCC2 isoforms, but only the former isoform is
present in gill tissue (Hiroi et al. 2008). Immunoblots were blocked in 0.05% Tween in phosphate-
buffered saline (PBS-T) containing 1% bovine serum albumin (BSA) for 1 h at room temperature and
then incubated in T4 (1:1,000) overnight at 4°C. Following three washes in PBS-T, blots were incubated
with a conjugated secondary antibody (1:10,000; goat anti-mouse IgG; IR-Dye 800CW, LI-COR
Biosciences, Lincoln, NE, USA) for 1 h at room temperature. Blots were washed again and wet-pressed
with protein side down onto a dual-channel IR laser scanner (LI-COR Odyssey Classic). Blots were
scanned at 169 µm resolution at two wavelengths: the secondary antibody (800 channel, green) and the
molecular weight ladder (700 channel, red). Pixel intensity of the NKCC bands was quantified from
digital images using Image Studio Lite (v4.0, LI-COR). NKCC was visualized as multiple bands on the
Western blots, presumably due to the presence of glycosylated and multimeric forms of the cotransporter
(Fig. S1). NKCC multimers resisted cleavage even when dosed with high concentrations of reducing
agents, therefore we quantified all bands to yield total NKCC abundance. Potential blot-to-blot variation
in signal strength was accounted for by normalizing the signal from the sample to that of the calibrator.
Additional gill tissue in 0.2 and 35 ppt treatments was examined on Day 7 of the abrupt challenge
to compare NKA activity relative to controls, following a 96-well microplate spectrophotometric assay

79
that enzymatically couples ADP production with NADH oxidation (McCormick 1993). Briefly, gills
stored in the SEI buffer were thawed on ice, homogenized, and centrifuged to pellet insoluble material.
Supernatants were then loaded into duplicate wells containing the assay mixture in the presence or
absence of 0.5 mM ouabain, a potent NKA inhibitor. Kinetic oxidation of NADH was measured by
repeated 340 nm absorbance readings taken for 10 min on a plate reader at 25°C using Gen5 software
(BioTek Instruments, Winooski, VT, USA). For each sample, NKA activity was quantified as the
difference between the mean NADH decay slope of the reaction with and without ouabain, normalized to
the sample’s total protein concentration, as determined by the Pierce BCA method.
Organic osmolyte levels were quantified in 0 and 40 ppt-treated fish using high performance
liquid chromatography (HPLC; Wolff et al. 1989). The dried carcasses were first reweighed to determine
appropriate dilution volumes. We dissolved the samples in ice-cold 7% perchloric acid and homogenized
them using a tapered glass tissue grinder. Protein was precipitated and removed from homogenates by
incubating them for 4 h at 4°C, followed by centrifugation at 15,000 rpm for 30 min (at 4°C). The
supernatant was neutralized with 2 M KOH, passed through a C18 cartridge (Sep-Pak, Waters Corp.,
Milford, MA, USA) to remove lipids, and then a 0.22 µm filter. We separated small carbohydrates,
methylamines, amino acids, and other small organic solutes by injecting the supernatant (Series 200
pump, PerkinElmer, Waltham, MA, USA) through a heated (80°C), Sugar-Pak I column (Waters Corp.).
Samples were run for 60 min with peak detection by a refractive index detector (Bio-Rad #1755) and
chromatogram peaks were integrated using eDAQ Powerchrom software. Sensitivity limitations of the
assay necessitated within-group pooling of the smallest individuals to achieve a minimum dry mass of 10
mg per sample, which typically reduced sample size by at least half.
Pilot tests in juvenile stickleback tissue identified the following composition of organic
osmolytes: taurine, myo-inositol, alanine, glycine, and creatine. Osmolyte content of each of these
molecules was determined in sample homogenates in relation to 1 mM standards. The five values were
summed to yield the total osmolyte content (OC) and normalized to the sample wet mass to more closely

80
approximate a physiological concentration. Removal from the osmolyte panel of creatine, which has a
separate role in creatine-phosphate energy storage, did not appreciably alter patterns.
For the direct transfer experiment, we statistically analyzed physiological endpoints using three-
way ANOVA, testing for effects of population (pop), salinity (salt), experimental day, and associated
interactions. Two-way models were also performed on the time-course data separately for FW and SW
challenge salinities, which incorporated control groups as Day 0. Models were re-evaluated with
nonsignificant terms removed, but this did not affect interpretation. Multiple-comparison tests were
performed on significant effects (P < 0.05): Tukey’s HSD tests were used to examine mean differences
between FW and SW treatments at each time point, whereas Dunnett’s tests compared means of each FW
or SW time point to pre-transfer controls. To quantify a per-generation rate of phenotypic divergence
between RS and SL populations, all response variables measured in the direct salinity transfer were
converted into haldanes (hp; Table 1; Hendry & Kinnison 1999; Bell & Aguirre 2013). For the gradual
SW challenge, percent water content and OC were compared across populations using nonparametric
Kruskal-Wallis (K-W) tests due to small sample sizes.
Results
The direct salinity transfer.— The majority of stickleback mortality occurred within 3 d following direct
transfer to extreme salinities and typically happened sooner in the SW treatments (Fig. 2). Most of the
mortality in the 45 and 50 ppt hypersaline treatments, in which all fish perished, occurred within 12 h. At
least 90% of stickleback survived in 0.2 ppt or 35 ppt. Survival of SL juveniles was 97% in the 0.4 ppt
treatment, but for RS counterparts, two additional deaths in the Day 10 jar depressed mean survival
subsequent to the Day 7 sampling, when it became the last remaining jar in the trial (Fig. 2).
At the threshold salinities, population differences in survival emerged just prior to the Day 3
sampling: compared to RS stickleback, SL fish had 89% higher survival in 0 ppt (0.85 ± 0.10 v. 0.45 ±
0.06; mean ± SD), but had 12.5% lower survival in 40 ppt (0.47 ± 0.06 v. 0.53 ± 0.06). These patterns
persisted through Day 10, albeit without replication at this final time point, when the SL fish had 67%

81
higher survival in FW (0.67 v. 0.40), but had 20% lower survival in SW (0.40 v. 0.50; Fig. 2). At 0 ppt,
total mortality was 2.4-fold higher in RS fish than in SL fish (24/60 v. 10/60), but at 40 ppt, mortality of
RS fish was slightly (26%) lower (17/50 v. 23/50). The salinity-dependent change in mortality
contributed to sharply different hazard function ratios for each population in the Cox proportional hazards
model: risk of dying in 40 ppt, relative to 0 ppt, did not change in RS stickleback (“exp(coef)” = eβ =
1.01), but increased almost 5-fold in SL fish (eβ = 4.86). Consequently, the model yielded highly
significant pop and pop*salt effects (Wald tests: pop P = 0.0043; salt P = 0.97; pop*salt P = 0.0014).
Log-rank tests performed at the threshold salinities revealed that survival differed between the two
populations only in FW (0 ppt challenge: χ2 = 14.7, df = 7, P = 0.0401; 40 ppt: χ2 = 8.9, df = 9, P = 0.45).
The high survival of SL stickleback in 0 ppt relative to RS fish influenced the low-salinity LC85 (SL:
0.015 ppt ± 0.205; RS: 0.208 ppt ± 0.133). For two generations of development under different salinity
regimes, this amounts to a population divergence rate of 0.5689 hp (Table 1).
Although RS and SL populations did not differ statistically in the molecular physiological
endpoints we measured in the direct transfer experiment, we report phenotypic haldanes for all response
variables in Table 1, as recommended by Hendry and Kinnison (1999). Relative to FW and control levels
(3 ppt rearing salinity), abundance of gill NKCC increased 2.6-fold in stickleback challenged with 35 ppt
for one week, and was almost 3-fold higher by day 10 (Fig. 3). In FW-challenged stickleback, gill NKCC
abundance remained at or slightly above control levels (Fig. 3). No population differences in NKCC
protein expression were detected (3-way ANOVA: salt P = 0.002, day P < 0.0001, salt*day P < 0.0001,
pop P = 0.60; salt*pop P = 0.58). Gill NKA activity increased by about 50% after 7 d in SW (13.8 v. 9.3
µmol ADP·mg protein-1·hr-1) compared to control fish (3 ppt), but it did not differ between the
populations (Fig. 4; 2-way ANOVA: salt P < 0.00001; pop P = 0.17; salt*pop P = 0.17).
Organic osmolytes fluctuated transiently in response to acute salinity challenge in a manner
consistent with the pattern of mortality in FW and SW (Fig. 5; 3-way ANOVA: salt P < 0.0001, day P <
0.0001, salt*day P < 0.0001). Across both populations, OC spiked more than 51% after 6 h in 40 ppt to
58.9 ± 6.8 (mean ± SD) mmol·kg-1 wet mass and then returned to baseline levels (38.9 ± 5.1 mmol·kg-1)

82
by Day 3 of the time course, doing so more quickly in RS fish. In contrast, the drop in OC in fish exposed
to deionized water was slower, reaching minimum values in both populations by Day 3. In RS
stickleback, the FW decrease in OC was significantly (31%) lower than control levels (Fig. 5). Compared
to RS fish, OC in the SL group was lower overall, but all interactions involving population were non-
significant (3-way ANOVA: pop P = 0.028, pop*salt P = 0.62, pop*day P = 0.11, pop*salt*day P =
0.24).
The composition of OC by osmolyte was, in descending order: taurine (47.8%), alanine (21.6%),
creatine (20.0%), glycine (9.4%), and myo-inositol (1.2%). Water content of eviscerated carcasses ranged
from 80 to 83% during the time course, typically increased to a maximum level at Day 3 and then
returned to control levels by Day 10, irrespective of salinity. Water content in all fish held at 40 ppt was
about 1% lower than those held at 0 ppt, but it did not differ between the two populations (npop = 70-72; 3-
way ANOVA: salt P = 0.0056, day P = 0.0006, salt*day P = 0.0089, pop P = 0.17).
The gradual seawater challenge.— The upper threshold of salinity tolerance increased greatly when
juvenile stickleback were gradually acclimated to hyperosmotic conditions, achieving an LC50 of 71 ppt
for all three populations (RS, SL, CL), when the fish were 8 weeks old (Fig. 6). During this 35-d
experiment, essentially no mortality was observed until salinity exceeded 61 ppt (Day 29), at which point
feeding was reduced. At 69 ppt, fish stopped eating and the daily survival rate began to decline rapidly.
The five organic osmolytes that were observed in abruptly-challenged stickleback were also
detected in gradually-challenged fish, with a proportional composition, in descending order, of taurine
(38.4%), alanine (34.2%), glycine (14.3%), creatine (10.1%), and myo-inositol (3.0%). Average OC in
the 71-ppt survivors was 60.5 mmol·kg-1 and did not differ among populations (K-W: P = 0.06). This was
similar to maximal levels recorded in the 40-ppt challenge and 72% higher than levels in the Week 6
control fish. The whole-body 71 ppt samples displayed an additional HPLC peak that did not match
known standards and was considerably lower in the 40 ppt samples. We did not account for the
contribution of this unidentified solute in our calculation of OC, which may make our estimate of OC for

83
the 71-ppt group conservative. Water content in the gradual SW challenge survivors was higher in SL fish
than in samples from the other two populations (npop = 4-6; RS = 76.8%, CL = 76.2%, SL = 79.1%; K-W:
P = 0.01).
Discussion
After only two generations in FW, lake-introduced stickleback (SL) had enhanced FW tolerance relative
to their anadromous ancestor (RS), suggesting rapid physiological evolution. Indeed, the divergence rate
of 0.569 hp we calculated for acute, low-salinity LC85 is much faster than evolutionary rates reported for
many morphological traits in stickleback populations (Bell & Aguirre 2013). However, the FW
halotolerance rate is similar to the 0.63 hp measured for cold tolerance adaptation in an experimentally-
manipulated marine population (Barrett et al. 2011), which suggests that selection on physiological traits
required to survive in seasonally cold, ion-poor lakes is very strong. However, we did not detect a tradeoff
in halotolerance: SL juveniles maintained a high SW tolerance, as evidenced by their similar performance
in hypersaline conditions and hypo-osmoregulatory responses compared to RS fish. Nor did we identify a
clear physiological mechanism for the observed population-level difference in performance under low-ion
conditions: Salinity affected gill NKCC, NKA activity, and whole-body organic osmolytes, but did so
similarly for each population.
Our salinity challenge experiments were designed to characterize the physiological limits and
temporal dynamics of halotolerance in an evolutionary context by comparing an anadromous population
with descendant populations that had only recently become FW-restricted. All F1-generation fish used in
this study had lived in a common rearing salinity since fertilization, thus we cannot rule out the potential
influence of maternal or epigenetic effects. Our panel of FW and SW treatments included salinities that
were ecologically relevant to anadromous Threespine Stickleback. Deionized and hypersaline treatments
were also included to expose potentially hidden variation among populations in reaction norms, which
may only appear at extreme salinities (Whitehead 2010). We focused our halotolerance tests on early
ontogeny because juveniles in this anadromous population typically emigrate from RS to the Cook Inlet

84
marine environment when they are 6-10 weeks old (John Baker, Clark University, personal
communication). Thus, it is possible that anadromous juveniles could lose hyper-osmoregulatory capacity
as they develop, which has been shown in anadromous American Shad (Alosa sapidissima; Zydlewski &
McCormick 1997).
To assess divergence in FW and SW halotolerance, survival was analyzed at extreme salinity
thresholds. Population-level performance was similar in 40 ppt, but differences in deionized water
indicate rapid evolution of the osmoregulatory system in a manner consistent with local adaptation to
low-ion conditions. Enhanced FW tolerance has been documented in embryos and adults from other
derived stickleback populations (Heuts 1947; Schaarschmidt et al. 1999). In contrast, others have found
no ecotypic-level differences in FW survival, but reported that derived populations had lower SW
tolerance compared to anadromous fish (Marchinko & Schluter 2007; McCairns & Bernatchez 2010;
DeFaveri & Merilä 2014). These seemingly conflicting survival reaction norms are difficult to reconcile
because the salinities selected as the “FW” and “SW” treatments are typically singular and differ widely
across studies, yet patterns may reflect different colonization histories of derived populations in
evolutionary time.
In other fishes that have transitioned from SW to FW halohabitats, improved FW performance
can be associated with loss of SW tolerance. Compared to ancestral anadromous Alewives (Alosa
pseudoharengus), derived landlocked populations have lower survival and higher osmotic imbalance
when challenged with SW (Velotta et al. 2014, 2015). Similarly for a killifish species pair, the euryhaline
Rainwater Killifish (Lucania parva) and the landlocked Bluefin Killifish (L. goodei) each display higher
survival in their native salinity and the latter has a much lower halotolerance limit (Fuller et al. 2007;
Whitehead 2010). Salinity-stratified populations of Mummichog (Fundulus heteroclitus) inhabiting the
Chesapeake Bay watershed differ in their physiological and transcriptomic responses to osmotic stress
(Whitehead et al. 2011; Brennan et al. 2015). These examples suggest a tradeoff between FW and SW
osmoregulatory ability, which may arise from antagonistic pleiotropies between gene complexes that
govern each pathway (Snell-Rood et al. 2010; Hohenlohe et al. 2012).

85
A FW-SW tradeoff was not detected in this study: survival in the 40 ppt hypersaline treatment
was statistically comparable between RS and SL fish, which indicates that the derived stickleback have
retained full hypo-osmoregulatory capability after two generations of FW residency. Similarly, in the
gradual SW challenge the ancestral and both derived populations (SL and CL, landlocked for 2 and ~4
generations, respectively) had the same LC50, remarkably withstanding up to 71 ppt. Future salinity
challenges conducted on the lake-introduced populations may yet reveal a decline of SW tolerance after
more time has elapsed in the FW environment. Gradual loss of SW tolerance in lake stickleback has been
used as a “physiological clock” to estimate timing of FW colonization. For example, in British Columbia
lakes containing benthic-limnetic species pairs, decreased hatching success and survival in SW of benthic,
but not limnetic, stickleback was used to argue that the benthic stickleback had invaded FW before the
limnetic ecotype (Kassen et al. 1995).
Application of general theory on rates of adaptation following environmental change suggests
that following SW-FW transitions, the pace of evolution of osmoregulatory plasticity is expected to be
slow in situations where negative pleiotropies are absent and there is little or no cost to maintain SW
tolerance in the derived habitat. Specifically, relaxed selection on SW tolerance experienced by derived
FW-residents, will slow the decay of hyper-osmoregulatory capacity if it is governed strictly by neutral
processes (Lahti et al. 2009). Likewise, genetic assimilation of specialized FW phenotypes from
euryhaline ancestors will be gradual in the predictable lake environment (Lande 2009). Such mechanisms
could explain why nonanadromous Sockeye Salmon (Oncorhynchus nerka, called Kokanee) landlocked
for ~10,000 years still exhibit an increase in SW tolerance during the seasonal period of smoltification
undergone by anadromous conspecifics (Foote et al. 1992; Foote et al. 1994).
Euryhaline fishes can plastically switch from hypo- to hyper-osmoregulation by remodeling their
ion-exchanging epithelia upon acclimating to new halohabitats (McCormick 2001; Kaneko & Hiroi 2008;
Evans 2010; Christensen et al. 2012). Hyperosmotic challenge caused both RS and SL stickleback to
increase salt-secreting branchial ionocytes, as evidenced by increases in both NKCC and NKA during the
10-d time course. Increases in these proteins during acclimation coincided with return of tissue osmolytes

86
to resting levels and no further mortality, suggesting that gill epithelia successfully remodeled to excrete
excess ions and restore internal osmolality within one week. Upregulation of NKCC and/or NKA activity
following SW transfer has been reported in many euryhaline teleosts, such as Atlantic Salmon (Salmo
salar; Pelis et al. 2001; McCormick et al. 2009), anadromous Alewife; Christensen et al. 2012; Velotta et
al. 2015), Mozambique Tilapia (Oreochromis mossambicus; Hiroi et al. 2008), Mummichog (Berdan &
Fuller 2012), and Japanese Medaka (Oryzias latipes; Hsu et al. 2014).
Although there were not enough survivors of the gradual SW challenge to perform the planned
molecular assays on gill tissue at desired sample sizes, gill NKCC abundance at 71 ppt appears to be
strongly elevated in both RS and SL stickleback, relative to levels found at lower salinities (Socheata Lim
and M. Monette, unpubl. data). This preliminary finding invites further examination of gradual
osmoregulatory responses to extreme hypersaline challenge, with the aim of comparing the magnitude of
salinity-dependent upregulation of SW transporters across populations.
The increase of gill NKCC over time in 0.2 ppt-challenged stickleback was unexpected and may
be attributable to cross-reactivity of the T4 antibody with a structurally similar apical transporter
responsible for ion uptake in FW ionocytes, sodium chloride cotransporter (NCC). Apical NCC has been
detected immunohistochemically with T4 in branchial FW ionocytes in other teleosts (Hiroi et al. 2008;
Hsu et al. 2014), and an apical NCC-like protein has been found in stickleback using this antibody
(Makoto Kusakabe, University of Tokyo, personal communication). Upregulation of NCC would be
expected during FW acclimation, which may have increased the NKCC signal in this treatment due to
their shared epitope in the C-terminus. However, in SW the presence of NCC would be minimal (Hiroi et
al. 2008), so it is unlikely that NKCC levels in the 35 ppt treatment were confounded by NCC-bound T4.
In fact, because NKCC abundance in FW may be overestimated, true salinity-dependent differences in
NKCC may be greater than we have reported. Future immunoblotting work using stickleback-specific
antibodies to each transporter will be necessary to resolve changes in stickleback NCC-like proteins
during acclimation to hypoosmotic conditions.

87
The fluctuation in whole-body organic osmolytes during the 10-d time course revealed short-term
osmotic shock and later acclimation of the survivors. Furthermore, the asymmetry in the deviation from
baseline osmolyte levels between the FW (0 ppt) and SW (40 ppt) treatments matched the observed
pattern of mortality. The initial slopes of the survival curves dropped steeply in the SW treatments, but
the decline was more gradual and delayed in FW conditions. Correspondingly, a rapid spike in OC 6 h
after SW transfer indicated that internal osmolality was elevated almost immediately. In deionized water,
however, diffusive loss of salts to the environment may have been slower, as suggested by the slower
decline in OC (more strongly seen in the RS samples), which again matched the period of mortality in
FW. Few stickleback died after Day 3, which coincided with organic osmolyte levels returning to near
baseline levels. Water content in the acutely-challenged stickleback did not fluctuate widely and did not
differ between populations, but compared to FW samples, the SW treatment had a slight dehydrating
effect. In contrast to the transient response of OC in the direct transfer experiment, juveniles gradually
SW-challenged for 35 d matched the maximum OC levels recorded in fish abruptly-challenged at 40 ppt,
which suggests chronic hyperosmotic stress and ultimately osmoregulatory failure as the cause of death.
Water content was lower in stickleback surviving the 71 ppt gradual challenge compared to those directly
transferred to 40 ppt, in accord with expectations of greater dehydration resulting from increasingly
hyperosmotic conditions. However, the pattern of population differences in water content in the gradual
SW challenge was opposite the prediction that anadromous stickleback would be superior hypo-
osmoregulators. SL fish were significantly less dehydrated than the other populations, albeit sample size
was small.
Analysis of multiple organic osmolytes and the sensitivity of OC to transient salinity responses
via HPLC is a promising alternative (or addition) to measuring osmotic stress, particularly when ion
concentrations cannot be measured from blood plasma. A wider use of this technique could enrich
comparative studies of osmoregulation by providing an additional metric of physiological performance. In
both our direct-transfer and gradual salinity challenges, taurine was the predominant osmolyte,
approaching 50% of the OC, with lesser contributions from alanine and glycine. Similar relative

88
proportions of these free amino acids were detected in tissues from adults from anadromous and stream
populations in Germany (Schaarschmidt et al. 1999). Myo-inositol, a major osmolyte in some
Mozambique Tilapia tissues (Fiess et al. 2007), composed no more than a few percent of OC in our
samples. The relative proportions of osmolytes contributing to OC did not change between the direct and
gradual experiments, with the exception of creatine. Creatine in the 71 ppt survivors was half the level
found in abruptly-challenged fish (10% v. 20%), which might be due to cessation of feeding in the former
group as the rising salinity became intolerable. These chronically, hyperosmotically-stressed stickleback
may have also upregulated an additional osmolyte, which we could not identify in our HPLC analysis.
The physiological endpoints we measured did not provide mechanistic explanations for
differences in survival between the anadromous and landlocked populations. Osmoregulatory divergence
may be operating at other molecular levels and/or on other ion transporters. Genome scanning of oceanic
and FW stickleback has identified many osmoregulatory genes under strong directional selection between
these environments, including atp1a1 (NKA), aqp3 (aquaporin 3; a water channel), and kir2.2 (a
potassium channel) (Shimada et al. 2011; DeFaveri et al. 2011). Because performance differed in FW,
researchers should consider examining the expression or abundance of transporters associated with ion
uptake (e.g., NHE, VHA, NCC; Evans 2011), as well as tight junction and mucous proteins (mucins),
which help reduce diffusive ion loss across the gill epithelium (Jones et al. 2012a; Bossus et al. 2015).
These proteins may differ among salinity-divergent stickleback populations with respect to their gene
expression, abundance, or isoform variants. Transcriptomic analysis may reveal regulatory networks and
transcriptional pathways that have evolved and could account for improved FW tolerance in derived
stickleback. Another possibility is that population-level differences in osmoregulatory responses may
manifest further downstream in protein function via transporter localization to the cell membrane or their
rapid activation. For example, an increase in the proportion of phosphorylated NKCC in response to
osmotic stimuli would suggest more functionally-active protein, and hence, a higher capacity for salt
secretion (Flemmer et al. 2010). Signaling pathways responsible for phospho-activation of ion
transporters (e.g., cAMP-dependent protein kinase A in the case of NKCC) may therefore be targeted by

89
selection rather than the transporters themselves. At the tissue level, branchial ionocyte topology along
gill filaments could be compared among populations, salinities, and exposure times using scanning
electron microscopy (Whitehead et al. 2012).
The recent stocking of RS stickleback into CL and SL simulated colonization events that have
occurred repeatedly since the last ice age (Bell & Foster 1994). Our examination of osmoregulatory
performance in these ancestral and derived populations provides a baseline for future studies of
physiological evolution in these lakes and other young, FW isolates (see Gelmond et al. 2009; Bell &
Aguirre 2013; Lescak et al. 2015; Bell et al. 2016). The rate at which osmoregulatory plasticity evolves
will be better understood by examining a time series of derived stickleback populations that have older,
known dates of FW invasion. Comparisons between populations that had established FW-residency
~10,000 years ago to others less than a century old could reveal the degree, rate, and physiological basis
of evolutionary change of halotolerance breadth and plasticity. It may be of value for future studies to
incorporate additional developmental stages, e.g., pre- and post-outmigration juveniles, as well as adults,
since osmoregulatory capacity changes with ontogeny (Zydlewski & Wilkie 2013). Complementary work
examining evolution of salinity preference behavior (e.g., Baggerman 1957; Audet et al. 1986) may yield
important insights into evolution of halotolerance, especially in freshwater populations of Threespine
Stickleback whose migratory routes to the sea are intact.
The stickleback radiation in FW is an exemplar of salinity’s role in phenotypic divergence and
ecological speciation (Bell & Foster 1994; McKinnon & Rundle 2002). The availability of ancestral
oceanic populations throughout coastal regions of the northern hemisphere, coupled with the adaptive
radiation of derived FW populations, many having a unique history of isolation, makes this species
complex ideal for characterizing the evolution of euryhalinity. Our work underscores the advantages of
using this model fish to investigate divergence of osmoregulatory responses and their mechanisms
following halohabitat transition.

90
90
Table 1. Per-generation rate of phenotypic divergence (haldanes; hp) for all physiological responses measured in juvenile anadromous (Rabbit
Slough; RS) and lake-introduced (Scout Lake; SL) stickleback in the 10-d direct salinity transfer experiment.
Trait Measurement Salinity (ppt) Trial Day RS Mean (SD, N) SL Mean (SD, N) hp a
FW
halotolerance
LC50 b 0, 0.2, 0.4 3 0.004 (0.123, 12) NAc NA
LC85 0, 0.2, 0.4 3 0.208 (0.133, 12) 0.015 (0.205, 12) 0.569
SW
halotolerance
LC50 35, 40, 45, 50 3 40.3 (1.5, 13) 39.7 (1.5, 13) 0.190
LC85 35, 40, 45, 50 3 38.3 (2.1, 13) 37.7 (2.3, 13) 0.121
Gill NKCC
abundance
normalized fold
change
0.2 10 2.99 (1.91, 8) 1.98 (1.49, 8) 0.296
35 10 4.61 (2.45, 8) 3.58 (1.31, 8) 0.274
Gill NKA
activity
µmol ADP·mg
protein-1·h-1
0.2 7 10.2 (1.8, 8) 11.0 (3.1, 8) 0.159
35 7 12.6 (2.4, 8) 15.0 (1.8, 8) 0.573
Total organic
osmolyte content
mmol/kg wet
mass d
0 3 28.5 (5.8, 2) 29.7 (3.3, 5) 0.160
40 0.25 61.3 (5.9, 4) 54.1 (7.6, 2) 0.576
Water content percent 0 3 84.3 (2.2, 4) 83.2 (1.8, 8) 0.298
40 0.25 78.3 (1.4, 8) 81.1 (3.3, 6) 0.621
a Phenotypic haldanes were calculated using the following equation: hp = |(x1 – x2)/SDpooled/g| , where x is the mean trait value for a population,
SDpooled is the pooled standard deviation, and g is the generation time since divergence (= 2 in this comparison). Bold values denote significance
at the population level as determined by inferential statistics.
b Lethal salinity concentrations were determined using logistic regression models, fitted for proportion survival (per experimental jar) by salinity.
c The LC50 was not calculable for SL due to high survival in FW.
d Osmolyte content was measured on pooled samples. Because salinity had a transient effect on osmolyte and water content, populations were
compared at time points of maximal hypo- and hyperosmotic stress.

91
Figure 1. Experimental design of the acute salinity challenge time course, in which 6-week-old
anadromous and lake-introduced stickleback were transferred from the rearing salinity (3 ppt) to one of a
range of low (FW) or high (SW and hypersaline) salinity treatments at a density of 10 juveniles of each
population per jar (1.5 L water). Mortality was recorded at all salinities for 10 d. During the trial,
survivors were sampled from the lettered jars at control (Day 0; 3 ppt) and low and high salinity
treatments for physiological endpoints: gill NKCC abundance (G), gill NKA activity (G, Day 7), and
whole-body water content and organic osmolytes (B).
B B B B B B
G G G G G G
G G G G G G
B B B B B
Salinity (ppt)
3 ppt
Control
0.25 1 3 7 10 Time point (days)
High
50
45
40
35
0
0.4
0.2 Low
G B

92
Figure 2. Survival of 6-week-old ancestral anadromous (Rabbit Slough; RS) and lake-introduced
stickleback (Scout Lake; SL) held at low (FW) and high salinities (SW) for 10 days. Fish were held in
replicate jars and were systematically censored from the trial at designated sampling times (Fig. 1). Each
data point represents the mean proportion (± SE) of fish alive during a census. We performed a survival
analysis at the threshold halotolerances, 0 ppt and 40 ppt. The asterisk denotes a significant difference in
the 0 ppt survival curves between the two populations according to log-rank tests.

93
Figure 3. Protein abundance of gill NKCC in anadromous (Rabbit Slough; RS) and lake-descendant
(Scout Lake; SL) stickleback challenged in 0.2 ppt or 35 ppt for 10 d. Total NKCC was determined by IR
fluorescence immunoblotting using the T4 antibody. Protein expression was normalized by dividing
sample signal by that of a calibrator run in each blot. The horizontal line represents the calibrator’s signal,
set to one. Letters denote time points when protein expression differed significantly from control levels
(“C”) and/or between salinities (“S”), according to Dunnett and Tukey post hoc tests, respectively. Each
data point represents the mean (± SE) of eight individuals.

94
Figure 4. Gill NKA activity in anadromous (Rabbit Slough; RS; red) and lake-descendant (Scout Lake;
SL; blue) stickleback held in the rearing salinity (3 ppt) or challenged for 7 days in FW (0.2 ppt) or SW
(35 ppt). The asterisk denotes that NKA activity was higher in SW compared to the other salinities, as
indicated by a 2-way ANOVA.

95
Figure 5. Total organic osmolyte content (OC) in 6-week-old anadromous (Rabbit Slough; RS) and lake-
descendant (Scout Lake; SL) stickleback subjected to extreme low (0 ppt) and high (40 ppt) salinities for
10 d. Total OC for each population is expressed per unit wet mass. Letters denote time points when OC
differed significantly from control levels (“C”) and/or between salinities (“S”), according to Dunnett and
Tukey post hoc tests, respectively. Each data point represents the mean (± SE) of individual and pooled
samples; only one pooled Scout Lake sample was measured in the Day 7, 40 ppt group.

96
Figure 6. Salinity tolerance over time in 3-week-old threespine stickleback gradually exposed to
increasingly hyperosmotic conditions at a rate of +2 ppt·d-1. Juveniles from the anadromous ancestor
(Rabbit Slough; RS) and two introduced-lake descendants (Scout Lake; SL and Cheney Lake; CL) were
initially held at the common rearing salinity of 3 ppt. Survival is plotted as the mean daily proportion
alive over time (± SD). The trial ended when half or more of the surviving cohort died (defined as the
LC50), which was at 71 ppt for all groups (Day 35).

97
Figure S1. Representative immunoblot of NKCC protein levels in anadromous stickleback gills. NKCC
was visualized by incubating blots in the T4 antibody and probing with an IR-fluorescent conjugate
(green bands). Blots were digitized by high-resolution infrared scanning and fluorescence intensity of
smaller (monomeric) and larger (multimeric) bands was quantified for total NKCC abundance. Each blot
(n = 16) comprised a panel of homogenized gill samples selected from each time point and salinity (FW =
0.2 ppt; SW = 35 ppt). Potential blot-to-blot variation in signal strength was accounted for by normalizing
to a common calibrator (Calib) consisting of gill tissue from pooled samples and run in the first lane of
each blot. Molecular masses of the protein ladder (L; red bands) are labeled in kilodaltons.

98
Literature Cited
Abrahantes JC, Aerts M (2012) A solution to separation for clustered binary data. Stat Modelling 12:3-27
Aguirre WE, Ellis KE, Kusenda M, Bell MA (2008) Phenotypic variation and sexual dimorphism in
anadromous threespine stickleback: implications for postglacial adaptive radiation. Biol J Linn Soc
95:465-478
Arjona FJ, Vargas-Chacoff L, Ruiz-Jarabo I, Martin del Rio MP, Mancera JM (2007) Osmoregulatory
response of Senegalese sole (Solea senegalensis) to changes in environmental salinity. Comp
Biochem Physiol A Mol Integr Physiol 148:413-421
Arnegard ME, McGee MD, Matthews B, Marchinko KB, Conte GL, Kabir S, Bedford N, Bergek S, Chan
YF, Jones FC, Kingsley DM, Peichel CL, Schluter D (2014) Genetics of ecological divergence
during speciation. Nature 511:307-311
Audet C, FitzGerald GJ, Guderley H (1986) Environmental control of salinity preferences in four
sympatric species of sticklebacks Gasterosteus aculeatus, Gasterosteus wheatlandi, Pungitius
pungitius, and Apeltes quadracus. J Fish Biol 28:725-740
Audet C, FitzGerald GJ, Guderley H (1985) Salinity preferences of four sympatric species of sticklebacks
(Pisces: Gasterosteidae) during their reproductive season. Copeia 1985:209-213
Aykanat T, Thrower FP, Heath DD (2011) Rapid evolution of osmoregulatory function by modification
of gene transcription in steelhead trout. Genetica 139:233-242
Baggerman B (1957) An experimental study on the timing of breeding and migration in the three-spined
stickleback (Gasterosteus aculeatus L.). Arch Néerl Zool XII:105-318
Baker JA, Heins DC, Foster SA, King RW (2008) An overview of life-history variation in female
threespine stickleback. Behaviour 145:579-602
Baker JA, Wund MA, Chock RY, Ackein L, Elsemore R, Foster SA (2010) Predation history and
vulnerability: conservation of the stickleback adaptive radiation. Biol Conserv 143:1184-1192
Barrett RDH, Paccard A, Healy TM, Bergek S, Schulte PM, Schluter D, Rogers SM (2011) Rapid
evolution of cold tolerance in stickleback. Proc R Soc Lond B 278:233-238
Belanger G, Guderley H, FitzGerald G (1987) Salinity during embryonic development influences the
response to salinity of Gasterosteus aculeatus L. (trachurus). Can J Zool 65:451-454
Bell MA, Aguirre WE, Buck NJ (2004) Twelve years of contemporary armor evolution in a threespine
stickleback population. Evolution 58:814-824
Bell MA, Heins DC, Wund MA, von Hippel FA, Massengill R, Dunker K, Bristow GA, Rollins JL,
Aguirre WE (2016) Reintroduction of the threespine stickleback into Cheney and Scout lakes,
Alaska. Evol Ecol Res 17:157-178

99
Bell MA, Aguirre WE (2013) Contemporary evolution, allelic recycling, and adaptive radiation of the
threespine stickleback. Evol Ecol Res 15:377-411
Bell MA, Foster SA (1994) The Evolutionary Biology of the Threespine Stickleback. Oxford University
Press, New York, NY, USA
Bell MA, Ortí G (1994) Pelvic reduction in threespine stickleback from Cook Inlet Lakes: Geographical
distribution and intrapopulation variation. Copeia 1994:314-325
Berdan EL, Fuller RC (2012) Interspecific divergence of ionoregulatory physiology in killifish: insight
into adaptation and speciation. J Zool 287:283-291
Betancur-R R (2010) Molecular phylogenetics supports multiple evolutionary transitions from marine to
freshwater habitats in ariid catfishes. Mol Phylogenet Evol 55:249-258
Betancur-R R, Ortí G, Pyron RA (2015) Fossil-based comparative analyses reveal ancient marine
ancestry erased by extinction in ray-finned fishes. Ecol Lett 18:441-450
Bossus MC, Madsen SS, Tipsmark CK (2015) Functional dynamics of claudin expression in Japanese
medaka (Oryzias latipes): Response to environmental salinity. Comp Biochem Physiol A Mol Integr
Physiol 187:74-85
Brennan RS, Galvez F, Whitehead A (2015) Reciprocal osmotic challenges reveal mechanisms of
divergence in phenotypic plasticity in the killifish Fundulus heteroclitus. J Exp Biol. doi:
10.1242/jeb.110445
Campeau S, Guderley H, FitzGerald G (1984) Salinity tolerances and preferences of fry of two species of
sympatric sticklebacks: possible mechanisms of habitat segregation. Can J Zool 62:1048-1051
Choi JH, Lee KM, Inokuchi M, Kaneko T (2011) Morphofunctional modifications in gill mitochondria-
rich cells of Mozambique tilapia transferred from freshwater to 70% seawater, detected by dual
observations of whole-mount immunocytochemistry and scanning electron microscopy. Comp
Biochem Physiol A Mol Integr Physiol 158:132-142
Christensen AK, Hiroi J, Schultz ET, McCormick SD (2012) Branchial ionocyte organization and ion-
transport protein expression in juvenile alewives acclimated to freshwater or seawater. J Exp Biol
215:642-652
Colosimo PF, Hosemann KE, Balabhadra S, Villarreal G, Dickson M, Grimwood J, Schmutz J, Myers
RM, Schluter D, Kingsley DM (2005) Widespread parallel evolution in sticklebacks by repeated
fixation of ectodysplasin alleles. Science 307:1928-1933
Dalziel AC, Bittman J, Mandic M, Ou M, Schulte PM (2014) Origins and functional diversification of
salinity-responsive Na+, K+ ATPase α1 paralogs in salmonids. Mol Ecol 23:3483-3503
Darwin CR (1859) On the Origin of Species By Means of Natural Selection. John Murray, London, UK

100
DeFaveri J, Merilä J (2013) Evidence for adaptive phenotypic differentiation in Baltic Sea sticklebacks. J
Evol Biol 26:1700-1715
DeFaveri J, Merilä J (2014) Local adaptation to salinity in the three-spined stickleback? J Evol Biol
27:290-302
DeFaveri J, Shikano T, Shimada Y, Goto A, Merilä J (2011) Global analysis of genes involved in
freshwater adaptation in threespine sticklebacks (Gasterosteus aculeatus). Evolution 65:1800-1807
Divino JN, Schultz ET (2014) Juvenile Threespine Stickleback husbandry: standard operating procedures
of the Schultz lab. University of Connecticut. http://fishlab.eeb.uconn.edu/wp-
content/uploads/sites/116/2014/07/CompleteSTBKhandbook_31jul.pdf. Accessed 1 Aug 2014
Divino JN, Monette MY, McCormick SD, Yancey PH, Flannery KG, Bell MA, Rollins JL, von Hippel
FA, Schultz ET (2016) Osmoregulatory physiology and rapid evolution of salinity tolerance in
threespine stickleback recently introduced to fresh water. Evol Ecol Res 17:179-201
Dymowska AK, Schultz AG, Blair SD, Chamot D, Goss GG (2014) Acid-sensing ion channels are
involved in epithelial Na+ uptake in the rainbow trout Oncorhynchus mykiss. Am J Physiol-Cell
Physiol 307:C255-C265
Dymowska AK, Hwang PP, Goss GG (2012) Structure and function of ionocytes in the freshwater fish
gill. Respir Physiol Neurobiol 184:282-292
Edwards SL, Marshall WS (2013) Principles and patterns of osmoregulation and euryhalinity in fishes.
In: McCormick SD, Farrell AP, Brauner CJ (eds) Euryhaline Fishes. Academic Press, New York, pp
1-44
Ensembl (2016) Stickleback Gasterosteus aculeatus Genome assembly BROAD S1, Release 84. The
European Bioinformatics Institute. http://useast.ensembl.org/Gasterosteus_aculeatus/Info/Index.
Accessed 16 June 2016
Evans DH (2011) Freshwater fish gill ion transport: August Krogh to morpholinos and microprobes. Acta
Physiol 202:349-359
Evans DH, Piermarini PM, Choe KP (2005) The multifunctional fish gill: dominant site of gas exchange,
osmoregulation, acid-base regulation, and excretion of nitrogenous waste. Physiol Rev 85:97-177
Evans TG (2010) Co-ordination of osmotic stress responses through osmosensing and signal transduction
events in fishes. J Fish Biol 76:1903-1925
Fiess JC, Kunkel-Patterson A, Mathias L, Riley LG, Yancey PH, Hirano T, Grau EG (2007) Effects of
environmental salinity and temperature on osmoregulatory ability, organic osmolytes, and plasma
hormone profiles in the Mozambique tilapia (Oreochromis mossambicus). Comp Biochem Physiol A
Mol Integr Physiol 146:252-264

101
Finn RN, Kapoor BG (2008) Fish Larval Physiology:724
Flemmer AW, Monette MY, Djurisic M, Dowd B, Darman R, Gimenez I, Forbush B (2010)
Phosphorylation state of the Na+-K+-Cl- cotransporter (NKCC1) in the gills of Atlantic killifish
(Fundulus heteroclitus) during acclimation to water of varying salinity. J Exp Biol 213:1558-1566
Foote CJ, Wood CC, Clarke WC, Blackburn J (1992) Circannual cycle of seawater adaptability in
Oncorhynchus nerka: genetic differences between sympatric sockeye salmon and kokanee. Can J
Fish Aquat Sci 49:99-109
Foote C, Mayer I, Wood C, Clarke W, Blackburn J (1994) On the developmental pathway to
nonanadromy in sockeye salmon, Oncorhynchus nerka. Can J Zool 72:397-405
Foster SA (2013) Evolutionary insights from behavioural geography: Plasticity, evolution, and responses
to rapid environmental change. Evol Ecol Res 15:705-731
Foster SA, Shaw KA, Robert KL, Baker JA (2008) Benthic, limnetic and oceanic threespine stickleback:
profiles of reproductive behaviour. Behaviour 145:485-508
Fridman S, Bron JE, Rana KJ (2011) Ontogenetic changes in location and morphology of chloride cells
during early life stages of the Nile tilapia Oreochromis niloticus adapted to fresh and brackish water.
J Fish Biol 79:597-614
Fuller RC, Mcghee KE, Schrader M (2007) Speciation in killifish and the role of salt tolerance. J Evol
Biol 20:1962-1975
Gelmond O, von Hippel FA, Christy MS (2009) Rapid ecological speciation in three-spined stickleback
Gasterosteus aculeatus from Middleton Island, Alaska: The roles of selection and geographic
isolation. J Fish Biol 75:2037-2051
Ghalambor CK, Hoke KL, Ruell EW, Fischer EK, Reznick DN, Hughes KA (2015) Non-adaptive
plasticity potentiates rapid adaptive evolution of gene expression in nature. Nature 525:372-375
Guderley HE (1994) Physiological ecology and evolution of the threespine stickleback. In: Bell MA,
Foster SA (eds) The Evolutionary Biology of the Threespine Stickleback. Oxford University Press,
Oxford; New York, pp 85-113
Helfman GS, Collette BB, Facey DE, Bowen BW (2009) The diversity of fishes: biology, evolution, and
ecology. Wiley-Blackwell, Hoboken, NJ
Hendry AP, Kinnison MT (1999) The pace of modern life: Measuring rates of contemporary
microevolution. Evolution 53:1637-1653
Herrera M, Vargas-Chacoff L, Hachero I, Ruiz-Jarabo I, Rodiles A, Navas JI, Mancera JM (2009)
Osmoregulatory changes in wedge sole (Dicologoglossa cuneata Moreau, 1881) after acclimation to
different environmental salinities. Aquacult Res 40:762-771

102
Heuts MJ (1946) Physiological isolating mechanisms and selection within the species Gasterosteus
aculeatus L. Nature 158:839-840
Heuts MJ (1947) Experimental studies on adaptive evolution in Gasterosteus aculeatus L. Evolution
Hiroi J, McCormick SD, Ohtani-Kaneko R, Kaneko T (2005) Functional classification of mitochondrion-
rich cells in euryhaline Mozambique tilapia (Oreochromis mossambicus) embryos, by means of
triple immunofluorescence staining for Na+/K+-ATPase, Na+/K+/2Cl- cotransporter and CFTR anion
channel. J Exp Biol 208:2023-2036
Hiroi J, Yasumasu S, McCormick SD, Hwang P, Kaneko T (2008) Evidence for an apical Na-Cl
cotransporter involved in ion uptake in a teleost fish. J Exp Biol 211:2584-2599
Hohenlohe PA, Bassham S, Currey M, Cresko WA (2012) Extensive linkage disequilibrium and parallel
adaptive divergence across threespine stickleback genomes. Phil Trans R Soc B 367:395-408
Holm G, Norrgren L, Lindén O (1991) Reproductive and histopathological effects of long-term
experimental exposure to bis(tributyltin)oxide (TBTO) on the three-spined stickleback, Gasterosteus
aculeatus Linnaeus. J Fish Biol 38:373-386
Howland KL, Tonn WM, Goss G (2001) Contrasts in the hypo-osmoregulatory abilities of a freshwater
and an anadromous population of inconnu. J Fish Biol 59:916-927
Hsu HH, Lin LY, Tseng YC, Horng JL, Hwang PP (2014) A new model for fish ion regulation:
identification of ionocytes in freshwater- and seawater-acclimated medaka (Oryzias latipes). Cell
Tissue Res 357:225-243
Hwang PP, Lin LY (2013) Gill ionic transport, acid–base regulation, and nitrogen excretion. In: Evans
DH, Claiborne JB, Currie S (eds) The Physiology of Fishes, 4th edn. CRC Press, New York, pp 205-
233
Inokuchi M, Hiroi J, Watanabe S, Hwang P, Kaneko T (2009) Morphological and functional classification
of ion-absorbing mitochondria-rich cells in the gills of Mozambique tilapia. J Exp Biol 212:1003-
1010
Johnson KE, Perreau L, Charmantier G, Charmantier-Daures M, Lee CE (2014) Without gills:
Localization of osmoregulatory function in the copepod Eurytemora affinis. Physiol Biochem Zool
87:310-324
Jones F, Chan Y, Schmutz J, Grimwood J, Brady S, Southwick A, Absher D, Myers R, Reimchen T,
Deagle B, Schluter D, Kingsley D (2012a) A genome-wide SNP genotyping array reveals patterns of
global and repeated species-pair divergence in sticklebacks. Curr Biol 22:83-90
Jones FC, Grabherr MG, Chan YF, Russell P, Mauceli E, Johnson J, Swofford R, Pirun M, Zody MC,
White S, Birney E, Searle S, Schmutz J, Grimwood J, Dickson MC, Myers RM, Miller CT,
Summers BR, Knecht AK, Brady SD, Zhang H, Pollen AA, Howes T, Amemiya C, Broad Institute

103
Genome Sequencing Platform & Whole Genome Assembly Team, Lander ES, Di Palma F,
Lindblad-Toh K, Kingsley DM (2012b) The genomic basis of adaptive evolution in threespine
sticklebacks. Nature 484:55-61
Kaneko T, Hiroi J (2008) Osmo- and ionoregulation. In: Finn RN, Kapoor BG (eds) Fish Larval
Physiology. Science Publishers, Enfield, NH, USA, pp 163-183
Kang C, Tsai S, Lee T, Hwang P (2008) Differential expression of branchial Na+/K+-ATPase of two
medaka species, Oryzias latipes and Oryzias dancena, with different salinity tolerances acclimated
to fresh water, brackish water and seawater. Comp Biochem Physiol A Molec Integ Physiol
151:566-575
Kassen R, Schluter D, McPhail JD (1995) Evolutionary history of threespine sticklebacks (Gasterosteus
spp.) in British Columbia: insights from a physiological clock. Can J Zool 73:2154-2158
Kawecki TJ, Ebert D (2004) Conceptual issues in local adaptation. Ecol Lett 7:1225-1241
Kelly S, Chow I, Woo N (1999) Haloplasticity of black seabream (Mylio macrocephalus): hypersaline to
freshwater acclimation. J Exp Zool 283:226-241
Kültz D (2012) The combinatorial nature of osmosensing in fishes. Physiology 27:259-275
Kültz D (2013) Osmosensing. In: McCormick SD, Farrell AP, Brauner CJ (eds) Euryhaline Fishes.
Academic Press, New York, pp 45-68
Lahti DC, Johnson NA, Ajie BC, Otto SP, Hendry AP, Blumstein DT, Coss RG, Donohue K, Foster SA
(2009) Relaxed selection in the wild. Trends Ecol Evol 24:487-496
Lande R (2009) Adaptation to an extraordinary environment by evolution of phenotypic plasticity and
genetic assimilation. J Evol Biol 22:1435-1446
Lee CE (2016) Evolutionary mechanisms of habitat invasions, using the copepod Eurytemora affinis as a
model system. Evol Appl 9:248-270
Lee CE, Bell MA (1999) Causes and consequences of recent freshwater invasions by saltwater animals.
Trends Ecol Evol 14:284-288
Lee CE, Kiergaard M, Gelembiuk GW, Eads BD, Posavi M (2011) Pumping ions: rapid parallel evolution
of ionic regulation following habitat invasions. Evolution 65:2229-2244
Lee CE, Remfert JL, Gelembiuk GW (2003) Evolution of physiological tolerance and performance during
freshwater invasions. Integr Comp Biol 43:439-449
Lee TH, Hwang PP, Lin HC, Huang FL (1996) Mitochondria-rich cells in the branchial epithelium of the
teleost, Oreochromis mossambicus, acclimated to various hypotonic environments. Fish Physiol
Biochem 15:513-523

104
Lescak EA, Bassham SL, Catchen J, Gelmond O, Sherbick ML, von Hippel FA, Cresko WA (2015)
Evolution of stickleback in 50 years on earthquake-uplifted islands. Proc Natl Acad Sci USA
112:E7204-E7212
Lubin RT, Rourke AW, Bradley TM (1989) Ultrastructural alterations in branchial chloride cells of
Atlantic salmon, Salmo salar, during parr-smolt transformation and early development in sea water.
J Fish Biol 34:259-272
Marchinko KB, Schluter D (2007) Parallel evolution by correlated response: Lateral plate reduction in
threespine stickleback. Evolution 61:1084-1090
Marshall WS, Grosell M (2006) Ion transport, osmoregulation, and acid-base balance. In: Evans DH,
Claiborne JB (eds) The Physiology of Fishes, 3rd edn. Taylor & Francis, New York, New York,
USA, pp 177-230
Martin LB, Ghalambor CK, Woods HA (2015) Integrative Organismal Biology:344
Matthiessen P, Brafield AE (1973) The effects of dissolved zinc on the gills of the stickleback
Gasterosteus aculeatus (L.). J Fish Biol 5:607-613
McCairns RJS, Bernatchez L (2010) Adaptive divergence between freshwater and marine sticklebacks:
insights into the role of phenotypic plasticity from an integrated analysis of candidate gene
expression. Evolution 64:1029-1047
McCormick SD, Regish AM, Christensen AK (2009) Distinct freshwater and seawater isoforms of
Na+/K+-ATPase in gill chloride cells of Atlantic salmon. J Exp Biol 212:3994-4001
McCormick SD (1993) Methods for nonlethal gill biopsy and measurement of Na+, K+-ATPase activity.
Can J Fish Aquat Sci 50:656-658
McCormick SD (2001) Endocrine control of osmoregulation in teleost fish. Am Zool 41:781-794
McCormick SD (2013) Smolt physiology and endocrinology. In: McCormick SD, Farrell AP, Brauner CJ
(eds) Euryhaline Fishes. Academic Press, New York, pp 199-251
McCormick SD, Farrell AP, Brauner CJ (2013a) Euryhaline Fishes 32:594
McCormick SD, Regish AM, Christensen AK, Björnsson BT (2013b) Differential regulation of sodium–
potassium pump isoforms during smolt development and seawater exposure of Atlantic salmon. J
Exp Biol. doi: 10.1242/jeb.080440
McKinnon JS, Rundle HD (2002) Speciation in nature: the threespine stickleback model systems. Trends
Ecol Evol 17:480-488
Nakatani M, Miya M, Mabuchi K, Saitoh K, Nishida M (2011) Evolutionary history of Otophysi
(Teleostei), a major clade of the modern freshwater fishes: Pangaean origin and Mesozoic radiation.
BMC Evol Biol 11:177

105
Nelson JS (2006) Fishes of the World. John Wiley and Sons, Inc., Hoboken, New Jersey
Nilsen TO, Ebbesson LOE, Stefansson SO (2003) Smolting in anadromous and landlocked strains of
Atlantic salmon (Salmo salar). Aquaculture 222:71-82
Nilsen TO, Ebbesson LOE, Madsen SS, McCormick SD, Andersson E, Bjornsson BT, Prunet P,
Stefansson SO (2007) Differential expression of gill Na+,K+-ATPase α- and β-subunits, Na+,K+,2Cl-
cotransporter and CFTR anion channel in juvenile anadromous and landlocked Atlantic salmon
Salmo salar. J Exp Biol 210:2885-2896
Norman JD, Robinson M, Glebe B, Ferguson MM, Danzmann RG (2012) Genomic arrangement of
salinity tolerance QTLs in salmonids: A comparative analysis of Atlantic salmon (Salmo salar) with
Arctic charr (Salvelinus alpinus) and rainbow trout (Oncorhynchus mykiss). BMC Genomics 13:1-15
Paolino DA (2011) Relative abundance of mitochondria rich cell types in Threespine Stickleback:
interpopulation differences and salinity effects. Honors Thesis, University of Connecticut
Pelis RM, Zydlewski J, McCormick SD (2001) Gill Na+-K+-2Cl- cotransporter abundance and location
in Atlantic salmon: Effects of seawater and smolting. Am J Physiol -Regul Integr Comp Physiol
280:R1844-R1852
R Core Team (2016) R: A Language and Environment for Statistical Computing. v.3.3
Ricciardi A, MacIsaac HJ (2000) Recent mass invasion of the North American Great Lakes by Ponto–
Caspian species. Trends Ecol Evol 15:62-65
Sangiao-Alvarellos S, Laiz-Carrión R, Guzmán JM, Martín del Río MP, Miguez JM, Mancera JM,
Soengas JL (2003) Acclimation of S. aurata to various salinities alters energy metabolism of
osmoregulatory and nonosmoregulatory organs. Am J Physiol Integr Comp Physiol 285:R897-R907
Schaarschmidt T, Meyer E, Jurss K (1999) A comparison of transport-related gill enzyme activities and
tissue-specific free amino acid concentrates of Baltic Sea (brackish water) and freshwater threespine
sticklebacks, Gasterosteus aculeatus, after salinity and temperature acclimation. Mar Biol 135:689-
697
Schultz ET, McCormick SD (2013) Euryhalinity in an evolutionary context. In: McCormick SD, Farrell
AP, Brauner CJ (eds) Euryhaline Fishes. Academic Press, New York, pp 477-533
Scott GR, Claiborne JB, Edwards SL, Schulte PM, Wood CM (2005) Gene expression after freshwater
transfer in gills and opercular epithelia of killifish: insight into divergent mechanisms of ion
transport. J Exp Biol 208:2719-2729
Shimada Y, Shikano T, Merilä J (2011) A high incidence of selection on physiologically important genes
in the three-spined stickleback, Gasterosteus aculeatus. Mol Biol Evol 28:181-193

106
Snell-Rood EC (2012) Selective processes in development: implications for the costs and benefits of
phenotypic plasticity. Integ Comp Biol 52:31-42
Snell-Rood EC, Van Dyken JD, Cruickshank T, Wade MJ, Moczek AP (2010) Toward a population
genetic framework of developmental evolution: The costs, limits, and consequences of phenotypic
plasticity. Bioessays 32:71-81
Staurnes M, Sigholt T, Lysfjord G, Gulseth OA (1992) Difference in the seawater tolerance of
anadromous and landlocked populations of Arctic Char (Salvelinus alpinus). Can J Fish Aquat Sci
49:443-447
Swarup H (1958) Stages in the development of the stickleback Gasterosteus aculeatus (L.). J Embryol
Exp Morph 6:373-383
Taugbøl A, Arntsen T, Østbye K, Vøllestad LA (2014) Small changes in gene expression of targeted
osmoregulatory genes when exposing marine and freshwater Threespine Stickleback (Gasterosteus
aculeatus) to abrupt salinity transfers. PLoS ONE 9:e106894
Velotta JP, McCormick SD, O'Neill RJ, Schultz ET (2014) Relaxed selection causes microevolution of
seawater osmoregulation and gene expression in landlocked Alewives. Oecologia 175:1081-1092
Velotta JP, McCormick SD, Schultz ET (2015) Trade-offs in osmoregulation and parallel shifts in
molecular function follow ecological transitions to freshwater in the Alewife. Evolution 69:2676-
2688
von Hippel FA, Weigner H (2004) Sympatric anadromous-resident pairs of threespine stickleback species
in young lakes and streams at Bering Glacier, Alaska. Behaviour 141:1441-1464
von Hippel FA (2008) Conservation of threespine and ninespine stickleback radiations in the Cook Inlet
Basin, Alaska. Behaviour 145:693-724
Wang G, Yang E, Smith KJ, Zeng Y, Ji G, Connon R, Fangue NA, Cai JJ (2014) Gene expression
responses of threespine stickleback to salinity: implications for salt-sensitive hypertension. Frontiers
in Genetics 5:312
Whitehead A (2010) The evolutionary radiation of diverse osmotolerant physiologies in killifish
(Fundulus sp.). Evolution 64:2070-2085
Whitehead A, Roach JL, Zhang S, Galvez F (2011) Genomic mechanisms of evolved physiological
plasticity in killifish distributed along an environmental salinity gradient. Proc Natl Acad Sci USA
108:6193-6198
Whitehead A, Roach JL, Zhang S, Galvez F (2012) Salinity- and population-dependent genome
regulatory response during osmotic acclimation in the killifish (Fundulus heteroclitus) gill. J Exp
Biol 215:1293-1305

107
Wolff SD, Yancey PH, Stanton TS, Balaban RS (1989) A simple HPLC method for quantitating major
organic solutes of renal medulla. Am J Physiol Renal Physiol 256:F954-F956
Wund MA, Baker JA, Clancy B, Golub JL, Foster SA (2008) A test of the "Flexible stem" model of
evolution: Ancestral plasticity, genetic accommodation, and morphological divergence in the
threespine stickleback radiation. Am Nat 172:449-462
Yancey PH, Clark ME, Hand SC, Bowlus RD, Somero GN (1982) Living with water stress: evolution of
osmolyte systems. Science 217:1214-1222
Zydlewski J, McCormick SD (1997) The loss of hyperosmoregulatory ability in migrating juvenile
American shad, Alosa sapidissima. Can J Fish Aquat Sci 54:2377-2387
Zydlewski J, Wilkie MP (2013) Freshwater to seawater transitions in migratory fishes. In: McCormick
SD, Farrell AP, Brauner CJ (eds) Euryhaline Fishes. Academic Press, New York, pp 253-326
The
End