Oshawa PUC - RPP Pilot Program - Interim Results Report · SUPER PEAK TOU OPT-OUT 2,000 1560...
113
Sept 20, 2019 RPP PILOT PROGRAM – INTERIM RESULTS REPORT
Transcript of Oshawa PUC - RPP Pilot Program - Interim Results Report · SUPER PEAK TOU OPT-OUT 2,000 1560...

Sept 20, 2019
RPP PILOT PROGRAM – INTERIM RESULTS REPORT

2 © 2019 Publicis.Sapient. All rights reserved.
TABLE OF CONTENTS LIST OF TABLES ...................................................................................................................................................... 3 LIST OF GRAPHS & FIGURES ................................................................................................................................... 4
Executive Summary ...................................................................................................................................... 6 Preliminary Results ............................................................................................................................................................. 7 Interim Conclusion ............................................................................................................................................................ 10
Introduction ............................................................................................................................................... 12 Description of the Programs ............................................................................................................................................. 12 Digital Engagement Tools ................................................................................................................................................. 14 Program Enrollment ......................................................................................................................................................... 16
Data ........................................................................................................................................................... 17 Maximizing the Value of Data ........................................................................................................................................... 17 Description/Summary of the Data .................................................................................................................................... 17 Data Preprocessing ........................................................................................................................................................... 18 Issues and Concerns Relating to Data Integrity or Validity ............................................................................................... 18 Price Neutrality ................................................................................................................................................................. 19
Methodology .............................................................................................................................................. 22 Experimental Design/Sampling ......................................................................................................................................... 22 Price/Non-Price Impact Modelling Discussion .................................................................................................................. 27 Deviation from the EM&V Plan ........................................................................................................................................ 33
Preliminary Results ..................................................................................................................................... 34 Program Results ................................................................................................................................................................ 34 Participant Engagement ................................................................................................................................................... 39 Summer Price/Non-Price Impacts .................................................................................................................................... 41 Summer Shoulder Price/Non-Price Impacts ..................................................................................................................... 49 Price Elasticity Analysis ..................................................................................................................................................... 55 Digital Impact .................................................................................................................................................................... 56 Survey ............................................................................................................................................................................... 70 Issues ................................................................................................................................................................................ 72
Conclusion .................................................................................................................................................. 73 Preliminary Results Recap ................................................................................................................................................ 73 Insights and Discussion ..................................................................................................................................................... 76 Lessons Learned ................................................................................................................................................................ 76 Considerations for Deployment at a Broader Scale .......................................................................................................... 77
Appendix .................................................................................................................................................... 78 A. Pilot Surveys ............................................................................................................................................................ 78 B. Peak App Screenshots ............................................................................................................................................. 82 C. Hourly Impact .......................................................................................................................................................... 85 D. Peak App Usage ....................................................................................................................................................... 92 E. Pilot Enrollment ....................................................................................................................................................... 97 F. Pilot Dropouts ....................................................................................................................................................... 101 G. Household Demographics and Characteristics ...................................................................................................... 102 H. Recruitment Outreach Calendar ........................................................................................................................... 105 I. Campaign Calendar ............................................................................................................................................... 108 J. Regression Raw Results Example: ......................................................................................................................... 112

3 © 2019 Publicis.Sapient. All rights reserved.
LIST OF TABLES Table 1. RPP Pilot Treatment Groups Overview .............................................................................................................. 6 Table 2. Summer Peak Usage Impact as of October 31st, 2018 ...................................................................................... 7 Table 3. Summer Conservation Impact as of October 31st, 2018 ................................................................................... 7 Table 4. Monthly Average Total Bill Impact and Monthly Usage Impact for the First Six Months ................................. 8 Table 5. Usage Impacts as of October 31, 2018 .............................................................................................................. 9 Table 6. RPP Pilot Treatment Groups Overview ............................................................................................................ 12 Table 7. Seasonal TOU with CPP Pricing ........................................................................................................................ 13 Table 8. Super-Peak TOU Pricing ................................................................................................................................... 13 Table 9. TOU Pricing Comparison .................................................................................................................................. 20 Table 10. Average kWh Consumption for Summer Months ......................................................................................... 20 Table 11. Average kWh Consumption for Summer Shoulder Months ......................................................................... 20 Table 12. Monthly Average Total Bill Impact and Monthly Usage Impact for the First Six Month ............................... 35 Table 13. Monthly Average Total Bill Impact and Monthly Usage Impact for segments .............................................. 36 Table 14. Communication Groups by Month ................................................................................................................ 40 Table 15. Email Click Through Based on Message Type* .............................................................................................. 40 Table 16. Summer Peak Usage Impact as of October 31st, 2018 .................................................................................. 41 Table 17. Summer Conservation Impact as of October 31st, 2018 ............................................................................... 41 Table 18. Monthly Average Total Bill Impact and Monthly Usage Impact for the Summer Months ............................ 42 Table 19. Summer Usage impacts as of August 31, 2018 .............................................................................................. 43 Table 20. Critical Peak Events Impact ............................................................................................................................ 44 Table 21. Summer Shoulder Peak Usage Impact as of October 31st, 2018 .................................................................. 49 Table 22. Summer Shoulder Conservation Impact as of October 31st, 2018 ............................................................... 49 Table 23. Monthly Average Total Bill Impact and Monthly Usage Impact for Summer Shoulder Months ................... 50 Table 24. Summer Shoulder Usage Impacts as of Oct. 31, 2018 ................................................................................... 51 Table 25. Price Elasticity Estimated Across Different Treatments ................................................................................ 55 Table 26. Elasticity of Substitution for Super-Peak TOU and Seasonal TOU with CPP Plans ........................................ 55 Table 27. Strategy Engagement..................................................................................................................................... 58 Table 28. Badges and milestone to achieve .................................................................................................................. 64 Table 29. Summer Digital Impact as of Aug 31st, 2018 .................................................................................................. 67 Table 30. Pilot Surveys Timelines .................................................................................................................................. 70 Table 31. Survey Participation Metrics .......................................................................................................................... 70 Table 32. Interim price and non-price impact ............................................................................................................... 74 Table 31 Seasonal Recruitment Communication Channels ........................................................................................... 97 Table 32 Super Peak Pre-Start stats .............................................................................................................................. 98 Table 33 Information Only Recruitment Communication Channels ............................................................................. 99 Table 34 Recruitment numbers per month ................................................................................................................. 100 Table 35 Dropout numbers per month as of December 21, 2018 .............................................................................. 101 Table 36. Household segments based on age of participants ..................................................................................... 102 Table 37 Segments based on household income of participants ................................................................................ 103 Table 38 Segments based on number of adults in each household ............................................................................ 103 Table 39 Segments based on number of senior citizens in each household ............................................................... 104 Table 40 Segments based on education of participants ............................................................................................. 104 Table 41 Recruitment outreach calendar .................................................................................................................... 105

4 © 2019 Publicis.Sapient. All rights reserved.
LIST OF GRAPHS & FIGURES Figure 1. Publicis Sapient’s Engagement Model ............................................................................................................ 14 Figure 2. Peak App Screenshots .................................................................................................................................... 15 Figure 3. Data Usage and Flow in This Pilot .................................................................................................................. 17 Figure 4. Seasonal TOU with CPP .................................................................................................................................. 21 Figure 5. TOU Super-Peak.............................................................................................................................................. 21 Figure 6. Information-Only ............................................................................................................................................ 21 Figure 7. Enrollment Efforts According to Opt-In and Opt-Out Groups ........................................................................ 23 Figure 8. Histogram of Daily Mean Temperature of Summer Weekdays ..................................................................... 25 Figure 9. Total Energy Consumption Profile of the Treatment Groups and Matching Groups ..................................... 26 Figure 10. Daily Temperature of Top 3 Similar Days in CPP Event Evaluation .............................................................. 29 Figure 11. Daily Temperature of Top 3 Similar Days for Coincident Hour Evaluation .................................................. 30 Figure 12. Pre-Pilot Survey: Most Effective Way to Reduce Your Bill in the Summer ................................................... 37 Figure 13. Mid-Pilot Survey: Most Effective Way to Reduce Your Bill in the Summer .................................................. 37 Figure 14. Pre-Pilot Survey: Belief that TOU Pricing is Fair ........................................................................................... 38 Figure 15. Mid-Pilot Survey: Belief that TOU Pricing is Fair .......................................................................................... 38 Figure 16. Pilot Enrollment Summary (Oct. 31, 2018) ................................................................................................... 39 Figure 17. Hourly Impact; Seasonal TOU with CPP; Non-CPP Event Summer Weekdays ............................................. 45 Figure 18. Hourly Impact; CPP Events; Summer Weekdays .......................................................................................... 45 Figure 19. Hourly Impact; Super-Peak TOU; All Participants; Summer Weekdays ....................................................... 46 Figure 20. Hourly Impact; Super-Peak; Digitally Engaged Participants ; Summer Weekdays ....................................... 47 Figure 21. Hourly Impact; Information Only; Summer Weekday ................................................................................. 48 Figure 22. Hourly Impact; Seasonal TOU with CPP; Summer Shoulder Weekdays ....................................................... 52 Figure 23. Hourly Impact; Super-Peak TOU; All Participants; Summer Shoulder Weekdays ........................................ 53 Figure 24. Hourly Impact; Super-Peak; Digitally Engaged Participants; Summer Shoulder Weekdays ........................ 53 Figure 25. Hourly Impact; Information Only; Summer Shoulder Weekday .................................................................. 54 Figure 26. Publicis Sapient’ s Engagement Model ......................................................................................................... 56 Figure 27. Conservation Strategy Categorization ......................................................................................................... 57 Figure 28. Peak App Screenshots .................................................................................................................................. 59 Figure 29. Digital Population in Different Treatment Groups ....................................................................................... 61 Figure 30. Weekly Recap Open Rate ............................................................................................................................. 62 Figure 31. Gamification Ranks Achieved by Digitally Engaged Participants vs. Non-Digitally Engaged Participants .... 64 Figure 32 Typical timeline CPP event day in Seasonal TOU with CPP plan .................................................................. 65 Figure 33. Summer Months CPP Email Statistics ........................................................................................................... 65 Figure 34. Digital Engagement Ratio Between Pilot Groups ......................................................................................... 68 Figure 35 Peak App Usage by Hour of the Day .............................................................................................................. 69 Figure 36 Hourly Impact; Seasonal TOU with CPP; Non-CPP days; All Participants; Summer Weekdays ..................... 85 Figure 37 Hourly Impact; Seasonal TOU with CPP; Non-CPP days; Digitally Engaged Participants; Summer Weekdays85 Figure 38 Hourly Impact; Seasonal TOU with CPP; Non-CPP days; All Participants; Summer Weekends .................... 85 Figure 39 Hourly Impact; Seasonal TOU with CPP; Non-CPP days; Digitally Engaged Participants; Summer Weekends85 Figure 40 Hourly Impact; Seasonal TOU with CPP; CPP days; All Participants; Summer Weekday .............................. 86 Figure 41 Hourly Impact; Seasonal TOU with CPP; CPP days; Digitally Engaged Participants; Summer Weekday ....... 86 Figure 42 Hourly Impact; Super-Peak TOU; All Participants; Summer Weekdays ........................................................ 87 Figure 43 Hourly Impact; Super-Peak; Digitally Engaged Participants; Summer Weekdays ......................................... 87 Figure 44 Hourly Impact; Super-Peak; All Participants; Summer Weekend .................................................................. 87 Figure 45 Hourly Impact; Super-Peak; Digitally Engaged Participants; Summer Weekends......................................... 87 Figure 46 Hourly Impact; Information Only; All Participants; Summer Weekdays ....................................................... 88 Figure 47 Hourly Impact; Information Only; All Participants; Summer Weekends ....................................................... 88 Figure 48 Hourly Impact; Information Only; Digitally Engaged Participants; Summer Weekdays ................................ 88

5 © 2019 Publicis.Sapient. All rights reserved.
Figure 49 Hourly Impact; Information Only; Digitally Engaged Participants; Summer Weekends ............................... 88 Figure 50 Hourly Impact; Information Only; Digitally Engaged Participants; Summer Shoulder Weekends ................ 89 Figure 51 Hourly Impact; Information Only; Digitally Engaged Participants; Summer Shoulder Weekends ................ 89 Figure 52 Hourly Impact; Information Only; Digitally Engaged Participants; Summer Shoulder Weekends ................ 89 Figure 53 Hourly Impact; Information Only; Digitally Engaged Participants; Summer Shoulder Weekends ................ 89 Figure 54 Hourly Impact; Super-Peak; All Participants; Summer Shoulder Weekdays ................................................. 90 Figure 55 Hourly Impact; Super-Peak; Digitally Engaged Participants; Summer Shoulder Weekdays.......................... 90 Figure 56 Hourly Impact; Super-Peak; Digitally Engaged Participants; Summer Shoulder Weekdays.......................... 90 Figure 57 Hourly Impact; Super-Peak; Digitally Engaged Participants; Summer Shoulder Weekends ......................... 90 Figure 58 Hourly Impact; Super-Peak; No Info Participants; Summer Shoulder Weekends ......................................... 90 Figure 59 Hourly Impact; Super-Peak; No Info Participants; Summer Shoulder Weekends ......................................... 90 Figure 60 Hourly Impact; Information Only; All Participants; Summer Shoulder Weekdays ........................................ 91 Figure 61 Hourly Impact; Information Only; Digitally Engaged Participants; Summer Shoulder Weekdays ................ 91 Figure 62 Hourly Impact; Information Only; All Participants; Summer Shoulder Weekends ....................................... 91 Figure 63 Hourly Impact; Information Only; Digitally Engaged Participants; Summer Shoulder Weekends ................ 91 Figure 64 % of visits when users viewed their usage in app ......................................................................................... 92 Figure 65 % of visits when users accessed the home page ........................................................................................... 92 Figure 66 % of visits when users accessed Today's Drawer on app ............................................................................. 93 Figure 67 % of visits when users accessed Message Centre ......................................................................................... 93 Figure 68 % visits when users accessed the billing page ............................................................................................... 93 Figure 69 % of visits when users accessed the help page ............................................................................................. 93 Figure 70 % of visits when users accessed Saving Strategies ........................................................................................ 93 Figure 71 % of times Peak app was used by day of the week from month to month ................................................... 94 Figure 72 Daily usage pattern of age groups ................................................................................................................. 95 Figure 73 % times Peak app was used by month for age groups .................................................................................. 96 Figure 74 Seasonal Recruitment Channel Progress ....................................................................................................... 97 Figure 75 Information Only Recruitment Channel Progress ......................................................................................... 99 Figure 76 Dropouts vs. active participants for all the three pricing groups in pilot .................................................... 101 Figure 77 Segments based on household age of participants ..................................................................................... 102 Figure 78 June Communication Highlight ................................................................................................................... 108 Figure 79 July Communication Highlight ..................................................................................................................... 109 Figure 80 August Communication Highlight ................................................................................................................ 109 Figure 81 September Communication Highlight ......................................................................................................... 110 Figure 82 October Communication Highlight .............................................................................................................. 111 Figure 83 Regression results of a summer weekday at 4 PM ...................................................................................... 112 Figure 84 Regression results of a summer weekday at 4 PM under a second pricing plan ........................................ 113

6 © 2019 Publicis.Sapient. All rights reserved.
Executive Summary During the spring of 2018, Oshawa PUC Networks Inc. (Oshawa Power) and Publicis Sapient (Sapient) launched “Peak Performance Pricing” with funding from the Ontario Energy Board (OEB), through its Regulated Price Plan (RPP) Roadmap initiative.
The Peak Performance Pricing pilot’s objective was to assess the effectiveness of price and non-price factors in influencing participant conservation. The Peak Performance Pricing pilot distinguishes itself from other behavioural-based pilots or programs due to the combination of traditional as well as leading-edge marketing techniques and technology to test impacts on conservation. Using these techniques to benefit electricity consumers is an innovative approach and builds upon successful methods used in other industries.
To assess the effectiveness of both price and non-price factors, the pilot includes three treatment groups, where two are subject to alternative pricing plans relative to standard Time of Use (TOU) pricing, and one that is on standard TOU pricing. All three of the treatment groups have access to the digital engagement tools, but participants must choose to leverage them. These tools are email, SMS, a mobile application and web portal. All participants receive bill messages, bill inserts, direct mailers, events and call support whether or not they choose to use one or more of the digital engagement tools available. A summary of these groups is as follows.
Table 1. RPP Pilot Treatment Groups Overview
PILOT GROUP NONDIGITAL DIGITAL NEW PRICING
CRITICAL EVENTS RECRUITMENT TARGET
SIZE
ACTUAL SIZE(as of June 1st,
2018)
SEASONAL TOU WITH CPP OPT-IN 500 508
SUPER PEAK TOU OPT-OUT 2,000 1560
INFORMATION ONLY OPT-IN 500 512
Digital Engagement
The app, Peak, created by Publicis Sapient provides the tools like Peak mobile app and Web portal and analytics tools. This app delivered messages at key moments to engage, educate and help lower peak period usage. The digital tools helped to achieve up to five times more conservation of kWh than using pricing tools alone in the Super Peak TOU group, see Table 18.
The analytics in this app leveraged data from several sources to focus on behaviours of individuals and develop strategies to implement the pilot goals. These strategies demonstrated their effectiveness through multiple observations. For example, participants who used the Peak mobile app or Peak web portal, conserve more energy and score higher engagement rankings as compared to users who did not. Understanding the best way to communicate with participants is being assessed throughout the pilot. The participants received messaging from multiple channels to promote behavioural shifts that reduce energy consumption and kept participants engaged. The monitoring and tracking of participant interest drove the preferred channel (i.e., email, push notification, in-app alerts, app inbox, SMS) and timing of communications.
All the participants in the pilot program have access to enhanced information using different digital and traditional channels as mentioned above. The two most responsive communication channels tested through this pilot’s approach are the Peak mobile app and Peak web portal, which provide personalized, relevant messaging based on the participant’s profile and behaviour. For context, existing customer portals focus on data, while the Peak app, Peak web portal and digital communications provided through this pilot provide insights, recommendations and functionality for understanding electricity usage. For participants who do not have access to the Peak app, the Peak web portal has equivalent functionality to the Peak app but naturally does not allow for the same mobile push notifications.

7 © 2019 Publicis.Sapient. All rights reserved.
Preliminary Results
In May 2018, the pilot successfully achieved its recruitment goals per pilot group through a targeted advertising and promotions strategy. As of January 2019, over 2,200 Oshawa Power customers are providing feedback as part of the pilot program.
Table 2 & Table 3 show the average hourly On-peak and Super-peak/CPP demand reduction and average daily conservation for all three treatment groups during the summer months. The On-peak demand reductions in Table 2 are measured on “per user per peak hour”. The Seasonal TOU with CPP group reduced their On-peak consumption by 3.33%, followed by Super-Peak TOU group which reduced their On-peak consumption by 2.04% and the Information Only group reduced their on-peak consumption by 0.40%. We also observe that average hourly reduction during CPP events for Seasonal TOU pricing group was at 10.13%, similarly for Super-peak hours the reduction was at 2.64%. The conservation impacts in Table 3 are measured using “per user per day”.
Table 2. Summer Peak Demand Reduction as of October 31st, 2018
Table 3. Summer Conservation Impact as of October 31st, 2018
Table 4 summarizes the monthly bill, including fixed costs, and monthly conservation impacts for the first six months of the pilot program, covering the summer and summer shoulder months. The monthly bill impact is the average change in bill per user per month; similarly, the monthly usage impact the average change in kWh per user per month. These results are for the period from May to October 2018 . “All Participants” refers to all enrolled customers under each treatment and “Digitally Engaged Participants” refers to customers who downloaded the Peak app or who have accessed the web portal. Apart from the Peak app and the web portal, all participants are able to register to receive communications via email and SMS according to their preferences. Further analysis of the individual time periods are presented in Chapter 5: Preliminary Results.
AVERAGE HOURLY ON-PEAK DEMAND
REDUCTION AVERAGE HOURLY SUPER-PEAK/CPP DEMAND
REDUCTION
SUMMER kWh % 95% CONFIDENCE INTERVAL
kWh % 95% CONFIDENCE INTERVAL
LOWER UPPER SIGNIFICANT LOWER UPPER SIGNIFICANCE SEASONAL TOU WITH CPP -0.041 -3.33 -0.048 -0.035 TRUE -0.185 -10.13 -0.214 -0.157 TRUE SUPER PEAK TOU -0.021 -2.04 -0.025 -0.018 TRUE -0.038 -2.64 -0.042 -0.034 TRUE INFORMATION ONLY -0.006 -0.40 -0.014 0.002 FALSE NA NA NA NA NA
AVERAGE DAILY USAGE REDUCTION
SUMMER kWh % 95% CONFIDENCE INTERVAL
LOWER UPPER SIGNIFICANT SEASONAL TOU WITH CPP -0.244 -0.81 -0.801 0.312 FALSE SUPER PEAK TOU -0.106 -0.37 -0.501 0.290 FALSE INFORMATION ONLY 1.045 3.30 0.417 1.673 TRUE

8 © 2019 Publicis.Sapient. All rights reserved.
1. Seasonal TOU with Critical Peak Pricing (CPP) (opt-in) – The Seasonal TOU demonstrated the greatest kWh savings, of 0.78 %, and were the only treatment group that reduced their bills, by 0.67%. Digitally Engaged Participants reduced their consumption two times more than All Participants within this treatment. This suggests that alternate price structures in connection with additional information and digital engagement can result in lower usage and bills than using price tools alone.
2. Super-Peak TOU (opt-out) – Within the Super-Peak TOU treatment, both the All Participants and Digitally Engaged Participants saw an increase in their bills; however, the Digitally Engaged Participants did reduce their consumption, demonstrating the benefits of the Peak app. This subgroup managed to reduce their consumption, resulting in a smaller bill increase relative to All Participants within the Super-Peak TOU treatment group.
3. Information Only (opt-in) – The Information Only group had the highest increase in kWh consumption, or 3.24%, yet still experienced only modest gain in costs, 2.37%. This result may be related to a better understanding of the TOU rate structure that led to increased usage during lower-cost periods.
Table 4. Monthly Average Total Bill Impact and Monthly Usage Impact for the First Six Months
SIX-MONTH IMPACT MONTHLY TOTAL BILL IMPACT MONTHLY USAGE IMPACT
$ % kWh % SEASONAL TOU WITH CPP (Opt-in)
ALL PARTICIPANTS -0.55 -0.50 -4.93 -0.61 DIGITALLY ENGAGED PARTICIPANTS -1.40 -1.28 -11.57 -1.42
SUPER-PEAK TOU (OPT-OUT) ALL PARTICIPANTS 8.19 7.76 -0.52 -0.07 DIGITALLY ENGAGED PARTICIPANTS 6.63 6.23 -9.87 -1.25
INFORMATION ONLY (OPT-IN) ALL PARTICIPANTS 2.69 2.37 27.60 3.25 DIGITALLY ENGAGED PARTICIPANTS 2.86 2.51 29.54 3.46

9 © 2019 Publicis.Sapient. All rights reserved.
Table 5 demonstrates that all three of the treatment groups exhibited load shifting during the summer and summer shoulder seasons. The impacts are measured on “per user per day,” with the exception of “conservation impact”, which is measured using “per user per season.” Although system-coincident peak only occurs as one hour per month this table shows the calculation based on “per user per day” for the day when system coincident peak occurs.
From Table 5, we see the Seasonal TOU with CPP reduced their on-peak consumption by 3.33%, followed by Super-Peak TOU which reduced their on-peak consumption by 2.04% and finally the Information Only treatment reduced their on-peak consumption by 0.40%. Both the Super-Peak and Seasonal with CPP treatment groups shifted some of their consumption from on-peak to off-peak times. The Information Only group had a modest increase in energy usage during the summer mid-peak period, where their consumption increased by 0.63%.
Table 5. Usage Impacts as of October 31, 2018
SEASONAL TOU WITH CPP
kWh % 95% CONFIDENCE INTERVAL
LOWER UPPER SIGNIFICANT SUMMER ON-PEAK IMPACT -0.4948 -3.33 -0.5749 -0.4146 TRUE SUMMER OFF-PEAK IMPACT (WEEKDAY) 0.1863 1.39 0.1151 0.2575 TRUE SUMMER OFF-PEAK IMPACT (WEEKEND) 0.0320 0.10 -0.1742 0.2383 FALSE SUMMER SYSTEM-COINCIDENT PEAK IMPACT -0.0731 -3.51 -0.1231 -0.0231 TRUE SUMMER AVERAGE CONSERVATION IMPACT -22.4811 -0.81 -73.6758 28.7136 FALSE SUMMER SHOULDER SYSTEM-COINCIDENT ON-PEAK IMPACT -0.0759 -4.02 -0.1128 -0.0391 TRUE SUMMER SHOULDER AVERAGE CONSERVATION IMPACT -7.1089 -0.33 -48.3689 34.1511 FALSE
SUPER-PEAK TOU kWh %
95% CONFIDENCE INTERVAL LOWER UPPER SIGNIFICANT
SUMMER SUPER-PEAK IMPACT -0.2290 -2.64 -0.2536 -0.2018 TRUE SUMMER ON-PEAK IMPACT -0.1286 -2.04 -0.1497 -0.1074 TRUE SUMMER OFF-PEAK IMPACT (WEEKDAY) 0.1802 1.38 0.1423 0.2182 TRUE SUMMER OFF-PEAK IMPACT (WEEKEND) 0.0577 0.19 -0.0615 0.1770 FALSE SUMMER SYSTEM-COINCIDENT PEAK IMPACT -0.0339 -1.69 -0.0619 -0.0059 TRUE SUMMER AVERAGE CONSERVATION IMPACT -9.7362 -0.37 -46.1267 26.6544 FALSE SUMMER SHOULDER ON-PEAK IMPACT -0.1775 -1.58 -0.2167 -0.1383 TRUE SUMMER SHOULDER OFF-PEAK IMPACT (WEEKDAY) 0.1733 1.68 0.1368 0.2097 TRUE SUMMER SHOULDER OFF-PEAK IMPACT (WEEKEND) 0.2370 1.00 0.1246 0.3493 TRUE SUMMER SHOULDER SYSTEM-COINCIDENT PEAK IMPACT -0.0147 -0.81 -0.0358 0.0064 FALSE SUMMER SHOULDER AVERAGE CONSERVATION IMPACT 6.6072 0.32 -20.4763 33.6906 FALSE
INFORMATION ONLY kWh %
95% CONFIDENCE INTERVAL LOWER UPPER SIGNIFICANT
SUMMER ON-PEAK IMPACT -0.0351 -0.40 -0.0812 0.0111 FALSE SUMMER MID-PEAK IMPACT 0.0506 0.63 0.0137 0.0875 TRUE SUMMER OFF-PEAK IMPACT (WEEKDAY) 0.8618 6.08 0.7971 0.9264 TRUE SUMMER OFF-PEAK IMPACT (WEEKEND) 1.4272 4.32 1.2201 1.6344 TRUE SUMMER SYSTEM-COINCIDENT PEAK IMPACT 0.0100 0.43 -0.0426 0.0626 FALSE SUMMER AVERAGE CONSERVATION IMPACT 96.1071 3.30 38.3231 153.8912 TRUE SUMMER SHOULDER ON-PEAK IMPACT 0.1142 1.94 0.0748 0.1536 TRUE SUMMER SHOULDER MID-PEAK IMPACT 0.1142 1.90 0.0813 0.1470 TRUE SUMMER SHOULDER OFF-PEAK IMPACT (WEEKDAY) 0.4946 4.48 0.4351 0.5541 TRUE SUMMER SHOULDER OFF-PEAK IMPACT (WEEKEND) 0.8252 3.21 0.6388 1.0116 TRUE SUMMER SHOULDER SYSTEM-COINCIDENT PEAK IMPACT 0.0278 1.32 -0.0107 0.0663 FALSE SUMMER SHOULDER AVERAGE CONSERVATION IMPACT 69.4757 3.17 27.8785 111.0728 TRUE

10 © 2019 Publicis.Sapient. All rights reserved.
Interim Conclusion
Through the first six months (May 2018 through October 2018, inclusive) of the pilot the program, measurements show a change in electricity consumption due to the pilot. The Seasonal TOU with CPP participants who downloaded the Peak app doubled the conservation and dollar impacts as compared with participants who have not opted to use the Peak app. The Peak app is acting as an instrument to convey knowledge of TOU pricing impacts and enable people to take advantage of the new pricing plans. Even the Information Only treatment group has demonstrated improved knowledge of the existing pricing plans, having reduced their on-peak consumption in favour of off-peak usage.
In the first six months, the pilot has already demonstrated the benefits of digital outreach and engagement. Some pilot highlights are:
1. Seasonal TOU with CPP: Critical Peak Pricing demonstrated a 10% reduction in consumption during the CPP hours, see Table 20. Also, we see a reduction in peak period usage of more than 3% (see Table 5). Participants who leveraged the Peak app showed a 2x higher reduction in consumption during the summer than those who did not, see Table 4.
2. Super-Peak TOU: This treatment group as a whole load shifted, but increased usage and bills, but we expect that some of the bill impact is associated with higher summer rates. Only the digitally engaged participants both load shifted and conserved energy compared with the control group. We expect the average monthly bills to drop further with the lower non-summer rates.
3. Information Only: This group had the highest engagement and demonstrated the most sophisticated understanding of when to use electricity. During the first six months of the pilot, they flattened their load profile, leveraging the lowest cost period.
4. Low and Middle Income (LMI) participants showed an increase in consumption within the opt-in groups and a decrease within the opt-out group.
5. Participants in older houses have shown higher levels of conservation or lower increases in consumption than those in newer houses.
6. High-energy users, who are in the top 10%, have stood out by showing consistent conservation across pricing groups and the lowest increase in energy consumption for participants in the Information-Only group.
7. The mid-pilot survey has shown an increase in knowledge in every aspect as compared to the start of pilot survey, such as a better understanding on how to use a smart thermostat to conserve energy and an increase in respondents believing that TOU pricing was fair.
8. Email outreach yielded faster and more effective results to both recruit people into the pilot and educate them about the benefits of participating in the information treatment.
9. Over 80% of the opt-in groups were actively using the mobile application, and almost 50% of the opt-out group was digitally engaged.

11 © 2019 Publicis.Sapient. All rights reserved.
PILOT OBJECTIVE MID-TERM PROGRESS
To assess whether providing customers with timely electronic notifications of electricity price, load shifting and saving opportunities can lead to reductions in peak demand, energy use and customer bills
The pilot has observed that information alone has improved understanding of the rate structures, costs and reduced peak demand marginally, but has not resulted in reduction in consumption.
To assess whether providing customers with alternative rate structures that incentivize Off-peak use and charge more for On-peak use will have any effect on them changing their pattern of electricity use
The pilot has observed that alternate rate structures have resulted in reduced consumption and load shifting. This conservation effect is improved when participants have been Digitally Engaged.
To determine whether the information provided, and price structures used, result in better customer understanding of electricity pricing and opportunities for managing electricity use
The pilot has observed that participants have both conserved and load shifted, with the exception of the Information Only treatment that saw an increase in consumption. This suggests they have a better understanding of cost differentials between pricing periods.
To estimate the impact of a rollout of such a program to the entire Oshawa Power customer base
While only at the mid-way point of the pilot, a roll out of the pilot treatments in a consistent manner to the way that participants were recruited would have similar savings results.
The pilot has observed which channels have been more successful with individuals as well as the day-of-week and time-of-day feedback that drives behaviour change. Through these learnings, the pilot adapted different follow-up measures to drive engagement on participant’s preferred channels. The Peak app has also been instrumental in measuring both initial engagement and response to messaging. Finally, the Peak app has also been an effective medium for any quick, actionable communication to targeted customers, such CPP events and notifying participants when Oshawa Power representatives were available at Deal Day locations.

12 © 2019 Publicis.Sapient. All rights reserved.
Introduction During the spring of 2018, Oshawa PUC Networks Inc. (Oshawa Power) and Publicis Sapient (Sapient) launched “Peak Performance Pricing” with funding from the Ontario Energy Board (OEB), through its Regulated Price Plan (RPP) Roadmap initiative.
The Peak Performance Pricing pilot’s objective was to assess the effectiveness of price and non-price factors in influencing participant conservation. The Peak Performance Pricing pilot distinguishes itself from other behavioural-based pilots or programs due to the combination of traditional as well as leading-edge marketing techniques and technology to test impacts on conservation. Using these techniques to benefit electricity consumers is an innovative approach and builds upon successful methods used in other industries.
To assess the effectiveness of both price and non-price factors, the pilot includes three treatment groups, where two are subject to alternative pricing plans relative to standard Time of Use (TOU) pricing, and one that is on standard TOU pricing. All three of the treatment groups have access to the digital engagement tools, but participants must choose to leverage them. These tools are email, SMS, a mobile application and portal. All participants receive bill messages, bill inserts, direct mailers, events and call support when choosing to not to use one or more of the digital tools available. A summary of these groups is as follows.
Table 6. RPP Pilot Treatment Groups Overview
PILOT GROUP NONDIGITAL DIGITAL NEW PRICING
CRITICAL EVENTS RECRUITMENT
TARGET SIZE
ACTUAL SIZE(as of June 1st,
2018)
SEASONAL TOU WITH CPP OPT-IN 500 508
SUPER PEAK TOU OPT-OUT 2,000 1560
INFORMATION ONLY OPT-IN 500 512
The messaging engine created by Publicis Sapient delivered messages at key moments to engage, educate and help lower peak period usage. The digital tools helped to achieve up to five times more conservation of kWh than using pricing tools alone in the Super Peak TOU group, see Table 18.
The Peak app leveraged data from several sources to focus on behaviours of individuals and develop strategies to implement the pilot goals. These strategies demonstrated their effectiveness through multiple observations. For example, Digitally Engaged Participants achieve more conservation and engagement rankings as compared to users who did not use the Peak app or portal, see Table 4 or refer section Program Results.
Description of the Programs
Goals and Objectives: The following are the primary goals of the project:
• To assess whether providing customers with timely electronic notifications of electricity price, load shifting and saving opportunities can lead to reductions in peak demand, energy use and customer bills
• To assess whether providing customers with alternative rate structures that incentivize Off-peak use and charge more for On-peak use will have any effect on them changing their pattern of electricity use
• To determine whether the information provided, and price structures used, result in better customer understanding of electricity pricing and opportunities for managing electricity use
• To estimate the impact of a rollout of such a program to the entire Oshawa Power customer base

13 © 2019 Publicis.Sapient. All rights reserved.
To achieve these goals, Peak Performance Pricing developed the following three pilot groups and selected control groups.
1. Seasonal TOU with Critical Peak Pricing (CPP) – A group of 500 customers who have access to the digital engagement tools, including the analytics-driven Peak app, and participate in a Seasonal TOU price plan plus Critical Peak Pricing (CPP), which includes 20 events per year with a four-hour duration. These events are split evenly between the summer and winter season.
2. Super-Peak TOU – A group of almost 2,000 customers automatically enrolled in the program with the ability to opt out who have access to the digital engagement tools, including the analytics-driven Peak app, and participate in a trial TOU price that is significantly higher during summer afternoons but is lower during off-peak times.
3. Information Only – A group of 500 customers who have access to the Peak app, but maintain traditional province-wide TOU pricing.
Control Groups – For each of the three treatment groups, the project team constructed a matched control group of the same size. The objective of creating a matched control group was to run a difference-in-difference analysis with minimal bias.
The tables below describe the pricing plans for the Seasonal TOU with CPP and Super-Peak TOU pilot groups.
Table 7. Seasonal TOU with CPP Pricing
PRICING TIMELINE TIME OF THE YEAR TIMINGS & PRICE
SUMMER AND WINTER WEEKDAYS JUNE, JULY, AUGUST, DECEMBER, JANUARY, FEBRUARY
7:00 PM – 7:00 AM 5.3C / KWHR (OFF-PEAK) 7:00 AM – 7:00 PM 13.2C / KWHR (ON-PEAK)
SUMMER AND WINTER WEEKENDS + HOLIDAYS
JUNE, JULY, AUGUST, DECEMBER, JANUARY, FEBRUARY
12:00 AM – 12:00 AM 5.3C / KWHR (OFF-PEAK)
CPP TOTAL CPP EVENTS = 20 IN A YEAR 10 IN SUMMER AND 10 IN WINTER
4:00 PM – 8:00 PM 26.3C / KWHR (CRITICAL-PEAK)
SPRING AND FALL, ALL DAY EVERY DAY MARCH, APRIL, MAY, SEPTEMBER, OCTOBER, NOVEMBER
12:00 AM – 12:00 AM 7.9C / KWHR (SHOULDER-PEAK)
Table 8. Super-Peak TOU Pricing
PRICING TIMELINE TIME OF THE YEAR TIMINGS & PRICE
SUMMER WEEKDAYS JUNE, JULY, AUGUST 7:00 PM – 7:00 AM 6.3C / KWHR (OFF-PEAK) 7:00 AM – 1:00 PM 9.5C / KWHR (ON-PEAK) 1:00 PM – 7:00 PM 25.2 C / KWHR (SUPER-PEAK)
ALL NON-SUMMER WEEKDAYS JANUARY, FEBRUARY, MARCH, APRIL, MAY, SEPTEMBER, OCTOBER,
NOVEMBER, DECEMBER
7:00 PM – 7:00 AM 6.3C / KWHR(OFF-PEAK) 7:00 AM – 7:00 PM 9.5C / KWHR(ON-PEAK)
YEAR-ROUND WEEKENDS + HOLIDAYS 12:00 AM – 12:00 AM 6.3C / KWHR (OFF-PEAK)

14 © 2019 Publicis.Sapient. All rights reserved.
Digital Engagement Tools
All the participants in the pilot program have access to enhanced information using different digital and traditional channels as mentioned. The two most responsive communication channels tested through this pilot’s approach are the Peak app and Peak web portal, which provide personalized, relevant messaging based on the participant’s profile and behaviour. For context, existing customer portals focus on data, while the Peak app, Peak web portal and digital communications provided through this pilot provide insights, recommendations and functionality for understanding electricity usage. The pilot delivered messaging and experiences that encouraged participants to use the app and portal to understand further how they can make conservation and budget decisions when using electricity. For participants who do not have access to the Peak app, the Peak web portal has equivalent functionality but naturally does not allow for the same mobile push notifications.
Figure 1. Publicis Sapient’s Engagement Model
The RPP pilot uses Publicis Sapient’ s digital engagement tools, which include a mobile app (Peak App), web portal, digital messaging engine and advanced data processing and analytics engines. These tools leverage data from multiple sources to refine the user’s experience and measure participant results continuously. Continuous data collection and measurement increases the understanding of the participant behaviour, allowing the digital engagement tools to adapt over time. This continuous feedback loop, which makes the digital engagement tools more relevant, is a key success factor within the pilot.

15 © 2019 Publicis.Sapient. All rights reserved.
Peak App Screenshots
Figure 2 shows four key screens from the Peak app. These screens highlight the tone of the app, its targeted and personalized content, relevant daily information and the ability to understand easily how usage and price affects the bill. Further screenshot are in Appendix B.
Figure 2. Peak App Screenshots
Critical to the success of the pilot was the participants usage and interaction with the digital engagement tools. Therefore, Sapient design expertise and internal focus groups determined how to present the content in the most appealing, user-friendly way that would also encourage persistent use of the digital engagement tools. The result was a friendly, encouraging and accessible design. To achieve this, the pilot created content and visually styled the Peak app and Peak web portal to be both casual and motivational so that participants do not feel guilty about their energy usage. This design sought to remove the complexities of energy usage and create an overall effect that is a fun, highly relevant and usable set of digital tools.
Understanding the best way to communicate with participants was assessed throughout the pilot. The participants received messaging from multiple channels to promote behavioural shifts that reduce energy consumption and kept participants engaged. The monitoring and tracking of participant interest drove the preferred channel (i.e., email, push notification, in-app alerts, app inbox, SMS) and timing of communications. Algorithms use the Peak app / web portal usage logs to create the optimal timings for future communications. Similarly, the digital engagement tools capture behaviours based on page views, app interactions, reading savings strategies and marking them complete.

16 © 2019 Publicis.Sapient. All rights reserved.
Program Enrollment
Oshawa Power led the recruitment process, which was open for all customers within the targeted Oshawa participant segments. The pilot executed the recruitment activities and generated a representative stratification of Oshawa residents within each pilot group.
For two of the treatment groups (Information Only and Seasonal TOU with CPP Groups), customers were invited to enroll in the program through an opt-in process. For the third treatment group, Super-Peak TOU, close to 2,000 customers received a price change notification.
Pilot Sample Size
As the pilot called for two recruitment types, opt-in and opt-out, the efforts for getting to the final sample size was different for each. To complicate recruitment, the pilot had to remove self-selection bias. To remove this bias, each potential participant had to be unaware of the other pilot groups. This was achieved with a combination of targeted messaging with pilot-specific details to individuals and broader pilot awareness to groups of people.
A key part of the pilot was the increased level of information provided to participants. Each group had a different motivation encouraging engagement with the digital engagement tools. The Information Only group was the only group recruited where the benefit of their participation was based solely on access to more information. The other two treatment groups, that had revised pricing plans, were encouraged to use the digital engagement tools in support of their participation in the pilot. Not surprisingly, the Information Only group (opt-in) had the highest Peak app usage at 85%. The Seasonal with CPP (opt-in) had the second highest with 79%, presumably due to the CPP events. The Super-Peak (opt-out) had the lowest at 20%. However, in absolute terms, there was the same number of participants, approximately 360, in each treatment group. Detailed descriptions of the recruitment process, digital engagement and dropouts are contained further in the document.

17 © 2019 Publicis.Sapient. All rights reserved.
Data Maximizing the Value of Data
Collecting and leveraging data to inform participants on how they can reduce their energy usage to deliver on the Ontario Energy Board’s goals is central to all treatment groups with the Peak Performance Pricing pilot. When leveraging data, it is important to focus on the right data and not simply gathering all data. The following figure highlights the key points in gathering data and maximizing the value.
Figure 3. Data Usage and Flow in This Pilot
Description/Summary of the Data
This chapter describes the types of data used in the pilot. The algorithms embedded in the digital engagement tools leverage these types of data to deliver key communications, develop groupings of participants and identify the key moments to communicate with participants in order to drive load shifting and conservation behaviour.
Usage Data: Smart meter measurements quantify the energy consumption patterns of pilot participants. Hourly historical smart meter measurements date back from Jan. 1, 2015, to Oct. 31, 2018, are used for this interim report.
Weather Data: The impact analysis and Peak app algorithms use hourly temperature and humidity information from Dark Sky.
Engagement Data: Pilot communication and app usage logs define how people engage and react to information delivered to them. Optimal timings for delivering information in the future is calculated through analysis of the Peak app/web portal usage logs. Similarly, the digital engagement tools capture behaviours based on page views, app interactions, reading savings strategies and marking them complete. The participant engagement section (refer page 39) and appendix on page 92 contain additional information about participant engagement.
Survey Data: Survey data forms the basis for the Peak app/web portal to initialize participant engagement. Subsequent surveys identify changes in behaviour, knowledge on energy usage and the adoption of new technologies (e.g., a smart thermostat). The digital engagement tools communicate with participants according to the demographic details obtained from pilot participants. In this interim report, only the pre and mid pilot surveys are conducted and results around it can be found in the section titled Survey.

18 © 2019 Publicis.Sapient. All rights reserved.
Participant Information: The Peak app regularly asks the participants questions around their behaviours and household information such as type, count and age of appliances. This information further defines the participant and household. Questions are formulated in a way to create engagement and interest in the topic. Based on responses to these questions, specific recommendations are made to participants to reduce their energy consumption.
Message Response and Read Data: The digital engagement tools track how participants respond to different communications by tracking each communication for open rates, click rates and landing page hits. Based on this data, the algorithms identify segments of participants for every communication and distributes these according to optimal schedules for each participant/group or participants.
Direct Feedback Data: Participants are reaching out to different support channels offered in the pilot program, be it from Peak app help section, direct emails or support calls. Oshawa Power has provided customers with the support required in a timely fashion. The Peak app logged over 1,000 email clarifications and 150 requests through the end of October 2018.
Conservation and Load-Shifting Strategies: Each conservation and load-shifting strategy included in the pilot were categorized based on their characteristics, including (1) associated effort and high-level cost to implement, (2) an order of magnitude in savings, (3) time to see the savings and (4) time until the savings were achieved. The algorithms embedded in the digital engagement tools used these attributes to make individual recommendations and track their implementation over time. Both the strategy and users’ interactions with these strategies formed a valuable data set.
Data Preprocessing
Usage Missing Data Cleansing: Before the pilot recruitment, we excluded customers who had significant gaps in their smart meter data. As a result, the majority of the enrolled pilot participants have a complete usage history. However, app monitoring discovers occasional missing data. As a result, this app uses a data imputation method to replace the missing smart meter measurements.
Issues and Concerns Relating to Data Integrity or Validity
Using data from multiple sources requires constant analytics and adjustments, as both individual data shifts and trends influence how best to engage with participants, as well as the recommended conservation and load-shifting strategy. The shifts and deviations experienced for each data type are further described below.
Usage Data: Shifts in:
1. Customer demographic change, such as the kids go off to college, loss of income or work from home 2. House or major appliance upgrades
Weather Data: There were no issues observed in using weather data.
Engagement Data: Rapid and dramatic changes in usage patterns and conflicts with shared devices could cause experiences to mask behaviours the pilot is attempting to alter.
Survey Data: The pilot conducted the pre-pilot and mid-pilot surveys following the OEB’s guidelines. Data challenges are associated with the accuracy of the responses and response rate, likely due to the lengthy survey and lack of a desire to finish it.

19 © 2019 Publicis.Sapient. All rights reserved.
App Usage Data: There were instances of missing app usage data caused by grid and source system issues. Regular monitoring of the availability and quality of the data required automated reloading of usage data.
Participant Information: Participants provided inaccurate answers to questions. These inaccurate answers may be due to the lack of attention when reading the question, intentional misleading to avoid an actual profile or misunderstanding the question.
Message Response and Read Data: Mistyped/misleading/wrong contact information, such as wrong email address or contact phone number, creates challenges to manage profiles and optimize the delivery of information. Participants who enrolled in the program but did not register for Peak app or web portal get limited email and SMS communications. Also, approximately 800 participants with no contact information in Super-Peak TOU pricing group received only traditional bill inserts. Without email to leverage, the Super-Peak TOU group was the most challenging pilot to reach out to and increase the effectiveness of this program.
Direct Feedback Data: There have been instances where the user has reported that the pricing treatment is causing them to pay more than before the pilot. It has been a challenge to articulate the price-neutral design and have them realize that they would get the pricing benefits when they stay in the pilot program for the duration. Often, participant feedback reflected resentment about the government and the general price of electricity as opposed to the pilot.
Bill Usage vs. Hourly Usage: For 10% of the bills in every billing cycle, the total kWh on the electricity bill does not match the meter kWh as per MDM/R. It results from the fact that the ‘interval’ values for a billed period, despite in ‘validated’ status, do not add up to corresponding kWh on the bill. The kWh on the bill is a result of additional estimation and reconciliation work on MDM/R values. The Peak app actively handles this discrepancy.
Price Neutrality
The TOU plans for these pilots have been designed to be price neutral on a yearly basis. For the interim report, this analysis was done of the first six months of the pilot. The customers that are part of each of these three pilots are representative of single families in Oshawa. The each pilot group is structured as follows:
1. Seasonal TOU with Critical Peak Pricing (CPP) – An opt-in group of 500 customers who have access to the digital engagement tools, including the analytics-driven Peak app, and participate in a Seasonal TOU price plan plus Critical Peak Pricing (CPP), which includes 20 events per year with a four-hour duration. These events are split evenly between the summer and winter season.
2. Super-Peak TOU – An opt-out group of almost 2,000 customers automatically enrolled in the program with the ability to opt out who have access to the digital engagement tools, including the analytics-driven Peak app, and participate in a trial TOU price that is significantly higher during summer afternoons but is lower during off-peak times.
3. Information Only – An opt-in group of 500 customers who have access to the Peak app, but maintain traditional province-wide TOU pricing.
A key component of this pilot is that the pricing treatments alternative price structures were price neutral based on the status quo consumption profile of participants. As part of this mid-term assessment, Oshawa Power requested that its billing management services provider calculate costs for each treatment as well as control groups shown in Table 9 below. As shown, the Seasonal TOU with CPP treatment group consumed 2,392,225 kWh during the first six months of the pilot, generating revenues of $199,749 in electricity charges, as compared to $199,202 under the status quo TOU rates. The Super Peak TOU treatment group consumed 6,748,468 kWh during the first six months of the pilot generating revenues of $641,348 compares with $565,241 under status-quo TOU pricing. As shown,

20 © 2019 Publicis.Sapient. All rights reserved.
there is a less than 0.5% difference in total revenue generated for the Seasonal TOU with CPP treatment and a 13% higher revenue generated for the Super Peak TOU treatment, for the first six months of the pilot. However, due to the higher summertime rates embedded in the Super Peak TOU treatment; we would expect that on an annual basis this difference to be eliminated. This price plan has a very high on-peak price of 25.2₵ per kWh during the summer months, so it is expected that average participant bills would be higher. However, for the remaining 9 months, the TOU is a 2 period plan with 6.3₵ / kWh and 9.5₵ / kWh price periods, which is cheaper than the standard TOU. During these 9 months it is expected that the average customer bill would be lower than normal.
Table 9. TOU Pricing Comparison COLUMN REFERENCE A B C B/A C/A
PARTICIPANT GROUP CONSUMPTION VOLUMES IN KWH
REVENUES - PILOT PRICE PLAN ($)
REVENUES - STATUS-QUO TOU ($)
AVERAGE REVENUE - PILOT PRICE PLAN ($/KWH)
AVERAGE REVENUE - STATUS-QUO TOU ($/KWH)
PILOT PRICE PLAN / STATUS-QUO TOU (%)
SEASONAL TOU WITH CPP
2,392,225.42 $199,749.41 $199,202.10 0.083 0.083 100%
SUPER PEAK TOU 6,748,468.38 $641,348.75 $565,241.16 0.095 0.084 113% INFORMATION ONLY 2,285,304.68 N/A $187,851.46 N/A 0.082 N/A CONTROL - SEASONAL TOU WITH CPP
2,972,697.83 N/A $243,963.15 N/A 0.082 N/A
CONTROL - SUPER PEAK TOU
8,208,146.34 N/A $675,091.76 N/A 0.082 N/A
CONTROL - INFORMATION ONLY
3,330,114.00 N/A $273,842.33 N/A 0.082 N/A
The following tables show the average daily and monthly consumption by kWh for each pilot group. The first table is for the summer months and the second table is for the summer shoulder months.
Table 10. Average kWh Consumption for Summer Months PILOT GROUP PARTICIPANT AVERAGE DAILY CONSUMPTION PARTICIPANT AVERAGE MONTHLY CONSUMPTION
SEASONAL TOU WITH CPP 29.73 912.02 SUPER PEAK TOU 28.99 889.06 INFORMATION ONLY 32.90 1008.93
Table 11. Average kWh Consumption for Summer Shoulder Months
PILOT GROUP PARTICIPANT AVERAGE DAILY CONSUMPTION PARTICIPANT AVERAGE MONTHLY CONSUMPTION
SEASONAL TOU WITH CPP 23.146 709.84 SUPER PEAK TOU 22.40 687.08 INFORMATION ONLY 24.62 755.13

21 © 2019 Publicis.Sapient. All rights reserved.
The following graphs show the impact distribution across all participants.
Figure 4. Seasonal TOU with CPP
Figure 5. TOU Super-Peak
Figure 6. Information-Only

22 © 2019 Publicis.Sapient. All rights reserved.
Methodology In this section, we discuss the methodologies used in this study, from the experimental design to the treatment/control group selection to the quantitative impact analysis.
Experimental Design/Sampling
Treatment Groups Selection
There are three different treatments in the pilot, including two pricing treatments (Seasonal TOU with CPP and Super-Peak TOU) and one Information Only treatment (Peak app/web portal). The pilot used two methods to enroll pilot participants: an opt-in and an opt-out approach. The design of the Super-Peak TOU pricing plan is meant to simulate a replacement of the current default TOU pricing; thus, an opt-out approach. Participants had to actively opt out of the plan to prevent enrollment. On the other hand, the Information Only treatment and Seasonal TOU with CPP treatment is designed to give consumers choice to gain more control over their energy bills; therefore, an opt-in approach was used.
According to the pilot design, the quota of participants for the three treatments was as follows:
• Seasonal TOU with CPP Group: 500 • Super-Peak TOU Group: 2,000 • Information Only Group: 500
Prior to enrollment, the recruitment process took additional measures to control the bias of the opt-in and opt-out approaches therefore, not all Oshawa Power customers qualified for the pilot. Customers were excluded based on the following criteria:
1. Customers who are under other pilot programs. 2. Customers with fewer than three years of energy consumption history. 3. Customers who do not live in single-family houses.
Customers that are part of other programs have participated in other conservation and load shifting programs and do not represent the general population of Oshawa. Customers with fewer than three years of history do not have enough quality meter data to align with a control group or determine changes in energy consumption behaviors. Finally, customers that do not live in single-family homes represent a more challenging demographic to analyze as multiple people, appliances, and lifestyles need to be taken into account.
Recruitment Process
The pilot recruitment had three main challenges. The first was to get groups representative of the population. The second was to recruit for two opt-in treatment groups simultaneously. The final was to manage recruitment for both opt-out and opt-in customers.
Opt-in Recruitment: The opt-in in groups were the Information Only treatment and Seasonal TOU with CPP treatment. The recruitment plan included multiple channels that were methodically used as the opt-in treatment groups filled.
Opt-out Recruitment: The opt-out process selected participants at random before the start of the pilot. The opt-out group was the Super-Peak TOU treatment. Recruitment for the Super-Peak TOU group was a true opt-out process, where a set of customers was chosen from a mixed digital and traditional customer base, while also accounting for age and location. This group received the information package, including the entire contract through direct mail. They had three weeks to opt out if not interested in the pilot program.

23 © 2019 Publicis.Sapient. All rights reserved.
Each treatment’s recruitment leveraged the channels as shown in Figure 7. As shown below, there were numerous efforts executed for recruitment. Targeted marketing of the program was exclusive to each treatment group, and people were recruited based on different demographics to achieve a representative population of participants. General awareness was generated through broadcast messaging, such as press releases and radio.
Figure 7. Enrollment Efforts According to Opt-In and Opt-Out Groups
For two of the treatment groups (Information Only and Seasonal TOU with CPP groups), customers were invited to enroll in the program through an opt-in process. They were eligible if, at the time of recruitment, the customer had resided at the same address and on the same price structure for at least the last three years. Traditionally, programs administer information treatments as opt-out programs. However, in this case participants needed to download the Peak app, making the registration process more typical of opt in.
For the third treatment group, Super-Peak TOU, close to 2,000 customers received a price change notification. The group selection process identified these participants from the remaining bill cycles. Customers had three weeks to opt out of the program if they were not interested. Participants could also drop out of the pilot after the start.
During the recruitment process, email yielded the fastest uptake of opt-in participants. This behaviour may be attributable to the inherent bias of customers who provide emails, or it may be the inherent ease of transitioning to an online sign-up from online outreach.
B O T H O P T - O U T G R O U P
O P T - I N G R O U P S
• Call Support
• Emails
• Bill Insert
• News
• Press Release
• Digital Ads
• Radio
• Events
• Randomly Selected
• Direct Mail
• Info Package
• On-bill message

24 © 2019 Publicis.Sapient. All rights reserved.
Control Groups Selection
For each of the three treatment groups, the project team constructed a matched control group of the same size. For each pilot participant, we found a controlled customer with a similar energy consumption pattern before the pilot began. The objective of creating a matched control group was to facilitate a difference-in-difference analysis with minimal bias. The control group selection method adheres to a method in a previous Navigant Consulting Ltd. (Navigant) report1.
To begin with, we sought a matched control group for the same treatment group in each season to create a tight fit between the treatment and control groups. We partitioned a year into four seasons:
• Summer (June, July, August) • Summer Shoulder (May, September, October) • Winter (December, January, February) • Winter Shoulder (November, April, March)
The seasonal partitioning created the best fit for the control groups. Figure 9 provides a graph showing the fit for each control group.
For the interim report, we focused on the impact studies for the summer and summer shoulder seasons only. Next, we constructed a feature vector for each customer to identify the similarity between each pair of control and treatment customers. In the seasonal impact study, the feature vector should summarize the energy consumption pattern of a customer during the months of the season.
To illustrate the construction of a feature vector, we take the summer season as an example. The feature vector constructed to match treatment and control groups for the summer season is as follows:
First, we categorized all the summer days of the years 2015, 2016 and 2017 into five different day types. Let 𝑇𝑇𝑚𝑚𝑚𝑚𝑚𝑚𝑚𝑚 stand for the mean temperature of a day in Celsius, the five unique day types are defined as the following:
1. weekday & 𝑇𝑇𝑚𝑚𝑚𝑚𝑚𝑚𝑚𝑚 < 16
2. weekday & 16 ≤ 𝑇𝑇𝑚𝑚𝑚𝑚𝑚𝑚𝑚𝑚 < 20
3. weekday & 20 ≤ 𝑇𝑇𝑚𝑚𝑚𝑚𝑚𝑚𝑚𝑚 < 22.5
4. weekday & 22.5 ≤ 𝑇𝑇𝑚𝑚𝑚𝑚𝑚𝑚𝑚𝑚
5. weekend & holiday
1 Advantage Power Pricing Pilot Impact and Process Evaluation, Navigant Consulting Ltd., July 7, 2016. See Section 2.1.2 Control Group Selection: Winter 2015/2016 and Summer 2016.

25 © 2019 Publicis.Sapient. All rights reserved.
Figure 8 shows the distribution of Tmean in summer weekdays from 2015 to 2018, and 2018 stands out as a much warmer year than 2017. The graph also shows 2015 and 2016 data, as they are very helpful in formulating the true energy behaviour of the customers.
Figure 8. Histogram of Daily Mean Temperature of Summer Weekdays
According to the day-type partition criteria, we partitioned weekdays into four categories. The number of days that fit into the first four categories in the years 2015–2017 is in the order of 21, 76, 61, 34 days respectively. Similarly, the number of days that fit into the first four categories in the year 2018 is in the order of 3, 22, 14, 25 days respectively.
Second, to construct the final feature vector, we concatenated the mean hourly energy consumption of the five-day types, which leads to a 5 × 24 = 120 dimensional feature space. In other words, the final feature vector length for each consumer is 120.
Finally, the matched control group was generated by comparing the Euclidian distance of the feature vector of every pair of treatment and control customers and picking the best fitted matched customers.
As a visual proof to show the quality of the control group selection method, Figure 9 shows the total energy consumption profile of the treatment groups and matching groups. The plots include five different daily total energy profiles of each group during the summer season across all three treatment plans. In Figure 9, each row of graphs shows Information Only, Seasonal TOU with CPP, and Super-Peak TOU treatment, respectively, and each column presents the five different day types. From the figure, we can see that the control group follows the behaviours of the treatment group very well in all five different day types, from mean daily temperature under 16 degrees to higher than 22.5 degrees and on weekends and holidays.
21 1
22
14
12
6
21
2
43
9
16 16
5
34
6
11
14
20
6
21
9
13
8
21
6
0
5
10
15
20
25
0 < t <= 12 12 < t <= 14 14 < t <= 16 16 < t <= 18 18 < t <= 20 20 < t <= 22 22 < t <= 24 24 < t <= 26 26 < t <= 28
Num
ber o
f Day
s
Temperature Range
Y 2015 Y 2016 Y 2017 Y 2018

26 © 2019 Publicis.Sapient. All rights reserved.
Figure 9. Total Energy Consumption Profile of the Treatment Groups and Matching Groups
A similar method created the feature vector used for summer shoulder season, except that the threshold to cluster five-day types are as follows:
1. weekday & 𝑇𝑇𝑚𝑚𝑚𝑚𝑚𝑚𝑚𝑚 < 8
2. weekday & 8 ≤ 𝑇𝑇𝑚𝑚𝑚𝑚𝑚𝑚𝑚𝑚 < 15
3. weekday & 15 ≤ 𝑇𝑇𝑚𝑚𝑚𝑚𝑚𝑚𝑚𝑚 < 20
4. weekday & 20 ≤ 𝑇𝑇𝑚𝑚𝑚𝑚𝑚𝑚𝑚𝑚
5. weekend & holiday

27 © 2019 Publicis.Sapient. All rights reserved.
Price/Non-Price Impact Modelling Discussion
This section explains the different evaluation processes carried out on the pilot data. The first set of models described is to evaluate each treatment’s change in kWh. The first model used is the difference-in-difference analysis with fixed effect, which follows the RPP Roadmap Pilot Plan Technical Manual2. Secondly, we have covered Critical Peak Pricing Events Evaluation, which is an evaluation of the CPP events that occur only in most extreme conditions. Finally, we have Coincident Peak Hour Evaluation, which is also evaluating the treatment impact under the most severe conditions having only one coincident hour per month. The subsequent set of models described is to evaluate the price sensitivities. First, we have Aggregate own price elasticity which is the elasticity associated with a change in overall consumption due to change in average rates. Second is the Elasticity of Substitution Analysis, which is the elasticity, associated with the change in the ratio of usage due to change in the ratio of prices between two time periods.
Price/Non-Price Treatment Evaluation
The impact study method used is the difference-in-difference analysis with fixed effect, which follows the RPP Roadmap Pilot Plan Technical Manual3. For each treatment, we collected the usage data and incorporated day types (weekday, weekend and holidays) and weather (cooling THI and heating THI) for a fair and meaningful analysis.
Take the example of summer impact analysis4. We used the following regression model to estimate the hourly impact of each treatment on weekdays. This regression model would enable us to estimate the “would have consumed energy” among the treatment group if no treatment were in place. The regression uses both the control group and treatment group. We run the proposed regression model for two different day types: weekdays and weekends + holidays. For each day type, we run 24 regressions (one for each hour of a day). In total, 24x2=48 regression models are estimated for one pricing plan per season.
As we combine the difference-in-difference analysis with fixed effect, we no longer need to incorporate the term 𝐷𝐷𝑡𝑡𝑡𝑡𝑚𝑚𝑚𝑚𝑡𝑡𝑚𝑚𝑚𝑚𝑚𝑚𝑡𝑡,𝑖𝑖 , which has been considered in the fixed effect of each consumer. Similarly, we no longer need to incorporate the term 𝐷𝐷𝑝𝑝𝑝𝑝𝑝𝑝𝑡𝑡,𝑑𝑑, because it has been considered in the fixed effect of the year terms.
𝐿𝐿𝑖𝑖,ℎ,𝑑𝑑 = 𝛼𝛼𝑖𝑖,ℎ + � 𝛽𝛽𝑦𝑦,ℎ𝑦𝑦
∙ 𝑌𝑌𝑌𝑌𝑌𝑌𝑌𝑌𝑦𝑦 + � 𝛽𝛽𝑚𝑚,ℎ𝑚𝑚
∙ 𝑀𝑀𝑀𝑀𝑀𝑀𝑀𝑀ℎ𝑚𝑚 +
𝛽𝛽𝑐𝑐𝑝𝑝𝑝𝑝𝑐𝑐,ℎ ∙ 𝐶𝐶𝑀𝑀𝑀𝑀𝐶𝐶𝐶𝐶𝑀𝑀𝐶𝐶𝑇𝑇𝐶𝐶𝐶𝐶ℎ,𝑑𝑑 + 𝛽𝛽ℎ𝑚𝑚𝑚𝑚𝑡𝑡,ℎ ∙ 𝐶𝐶𝑌𝑌𝑌𝑌𝑀𝑀𝐶𝐶𝑀𝑀𝐶𝐶𝑇𝑇𝐶𝐶𝐶𝐶ℎ,𝑑𝑑 + 𝛽𝛽𝑡𝑡𝑝𝑝𝑐𝑐,ℎ ∙ 𝐷𝐷𝑡𝑡𝑡𝑡𝑚𝑚𝑚𝑚𝑡𝑡𝑚𝑚𝑚𝑚𝑚𝑚𝑡𝑡,𝑖𝑖 ∙ 𝐷𝐷𝑝𝑝𝑝𝑝𝑝𝑝𝑡𝑡,𝑑𝑑 +
𝛽𝛽𝑡𝑡𝑝𝑝𝑐𝑐,ℎ ∙ 𝐷𝐷𝑡𝑡𝑡𝑡𝑚𝑚𝑚𝑚𝑡𝑡𝑚𝑚𝑚𝑚𝑚𝑚𝑡𝑡,𝑖𝑖 ∙ 𝐷𝐷𝑝𝑝𝑝𝑝𝑝𝑝𝑡𝑡,𝑑𝑑 ∙ 𝐶𝐶𝑀𝑀𝑀𝑀𝐶𝐶𝐶𝐶𝑀𝑀𝐶𝐶𝑇𝑇𝐶𝐶𝐶𝐶ℎ,𝑑𝑑 + 𝛽𝛽𝑡𝑡𝑝𝑝ℎ,ℎ ∙ 𝐷𝐷𝑡𝑡𝑡𝑡𝑚𝑚𝑚𝑚𝑡𝑡𝑚𝑚𝑚𝑚𝑚𝑚𝑡𝑡,𝑖𝑖 ∙ 𝐷𝐷𝑝𝑝𝑝𝑝𝑝𝑝𝑡𝑡,𝑑𝑑 ∙ 𝐶𝐶𝑌𝑌𝑌𝑌𝑀𝑀𝐶𝐶𝑀𝑀𝐶𝐶𝑇𝑇𝐶𝐶𝐶𝐶ℎ,𝑑𝑑
Where, 𝐿𝐿𝑖𝑖,ℎ,𝑑𝑑 stands for the energy consumption of customer 𝐶𝐶 during hour ℎ on the day 𝑑𝑑, and ℎ ∈ {0,1,2, … 23};
𝛼𝛼𝑖𝑖,ℎ is the fixed effect of energy consumption of customer 𝐶𝐶 at hour ℎ during summer weekdays;
2 The Brattle Group report: RPP Roadmap Pilot Plan Technical Manual.
3 The Brattle Group report: RPP Roadmap Pilot Plan Technical Manual.
4 The summer shoulder impact also uses the same impact analysis method.

28 © 2019 Publicis.Sapient. All rights reserved.
𝑌𝑌𝑌𝑌𝑌𝑌𝑌𝑌𝑦𝑦 is a dummy variable and only takes the value of 1 if day 𝑑𝑑 is on the year y, and 0 otherwise where 𝑦𝑦 ∈{(2015), 2016, 2017, 2018}. Thus, 𝛽𝛽𝑦𝑦,ℎ stands for the energy consumption trend of each year in comparison to the year 2015. The term 𝑌𝑌𝑌𝑌𝑌𝑌𝑌𝑌𝑦𝑦 in the regression model covers the pre-post experiment trend effect.
Similarly, 𝑀𝑀𝑀𝑀𝑀𝑀𝑀𝑀ℎ𝑚𝑚 is a dummy variable and only takes the value of 1 if day 𝑑𝑑 is in month 𝑚𝑚, and 0 otherwise where 𝑚𝑚 ∈ {(𝐽𝐽𝐽𝐽𝑀𝑀𝑌𝑌), 𝐽𝐽𝐽𝐽𝐶𝐶𝑦𝑦,𝐴𝐴𝐽𝐽𝐶𝐶𝐽𝐽𝐴𝐴𝑀𝑀}. Thus, 𝛽𝛽𝑚𝑚,ℎ stands for the energy consumption trend of each month in comparison to June.
𝐶𝐶𝑀𝑀𝑀𝑀𝐶𝐶𝐶𝐶𝑀𝑀𝐶𝐶𝑇𝑇𝐶𝐶𝐶𝐶ℎ,𝑑𝑑 and 𝐶𝐶𝑌𝑌𝑌𝑌𝑀𝑀𝐶𝐶𝑀𝑀𝐶𝐶𝑇𝑇𝐶𝐶𝐶𝐶ℎ,𝑑𝑑 stands for the cooling and heating thermal humidity indices (THI), which are defined as follows:
𝐶𝐶𝑀𝑀𝑀𝑀𝐶𝐶𝐶𝐶𝑀𝑀𝐶𝐶𝑇𝑇𝐶𝐶𝐶𝐶ℎ,𝑑𝑑 = max (𝑇𝑇𝐶𝐶𝐶𝐶ℎ,𝑑𝑑 − 30,0)
𝐶𝐶𝑌𝑌𝑌𝑌𝑀𝑀𝐶𝐶𝑀𝑀𝐶𝐶𝑇𝑇𝐶𝐶𝐶𝐶ℎ,𝑑𝑑 = max (25 − 𝑇𝑇𝐶𝐶𝐶𝐶ℎ,𝑑𝑑 , 0)
𝑇𝑇𝐶𝐶𝐶𝐶ℎ,𝑑𝑑 = 17.5 + 0.55 × 𝐷𝐷𝑌𝑌𝑦𝑦 𝐵𝐵𝐽𝐽𝐶𝐶𝐵𝐵 𝑇𝑇𝑌𝑌𝑚𝑚𝑇𝑇 (°𝐶𝐶) + 0.2 × 𝐷𝐷𝑌𝑌𝐷𝐷 𝑃𝑃𝑀𝑀𝐶𝐶𝑀𝑀𝑀𝑀 𝑇𝑇𝑌𝑌𝑚𝑚𝑇𝑇 (°𝐶𝐶)
As a result, 𝛽𝛽𝑐𝑐𝑝𝑝𝑝𝑝𝑐𝑐,ℎ and 𝛽𝛽ℎ𝑚𝑚𝑚𝑚𝑡𝑡,ℎ stand for the cooling and heating load sensitivity for pilot participants at hour ℎ on summer weekdays.
𝐷𝐷𝑡𝑡𝑡𝑡𝑚𝑚𝑚𝑚𝑡𝑡𝑚𝑚𝑚𝑚𝑚𝑚𝑡𝑡,𝑖𝑖 is a dummy variable which takes value 1 if customer 𝐶𝐶 is under treatment, and 0 otherwise.
𝐷𝐷𝑝𝑝𝑝𝑝𝑝𝑝𝑡𝑡,𝑑𝑑 is a dummy variable which takes value 1 if day 𝑑𝑑 is after the treatment starting date, and 0 otherwise.
As a result, 𝛽𝛽𝑡𝑡𝑝𝑝𝑐𝑐,ℎ stands for the general treatment impact for hour ℎ; 𝛽𝛽𝑡𝑡𝑝𝑝𝑐𝑐,ℎ is the treatment impact on cooling sensitivities; and 𝛽𝛽𝑡𝑡𝑝𝑝ℎ,ℎ is the treatment impact on heating sensitivities.
The final hourly impact is computed from the smart meter measurements of the treatment group and the expected energy used from the control group-based regression model above. In this computation, we disable the treatment flags and predict the energy consumption of each treatment member as if no treatment were in place.
Similar to the weekday hourly impact study, we can perform the same analysis for weekends, holidays and other seasons of the year. The On-peak/Off-peak impacts are derived from the hourly impact study results. Please note that for seasonal TOU with CPP plan, we do not include the CPP days in this regression for hourly impact analysis. CPP impacts are studied separately. We also provided some raw regression results and coefficient interpretations in the appendix for reference.

29 © 2019 Publicis.Sapient. All rights reserved.
Critical Peak Pricing Events Evaluation
Unlike general On-peak/Off-peak impact studies, the CPP events occur only under the most extreme conditions. As a result, using the previous hourly impact model — which incorporates all summer days — will underestimate the impacts. Instead, for each event day we choose the top three most similar non-event days in 2018 summer to construct a fair comparison. The top three most similar days are chosen based on the weekday/weekend day type and temperature similarities to evaluate the impact. For example, 2018-06-29 was a CPP event day. For this day, we found the top three5 most similar non-CPP days in 2018 summer in terms of temperature to establish a basis for difference-in-difference evaluation as shown in Figure 10. After the topmost similar non-CPP event days were selected, we constructed a regression model similar to the hourly impact model using only the measurements collected on the CPP event day and selected non-CPP event days.
Figure 10. Daily Temperature of Top 3 Similar Days in CPP Event Evaluation
5 We choose the top three most similar non-CPP event days to balance the bias and variance. On the one hand, choosing one or two similar days will let our analysis expose to higher variance caused by the small number of similar days. On the other hand, choosing more than three similar days will increase the likelihood of incorporating days that are not similar to the CPP-event day. In fact, there are only around 65 business days in summer, and 55 days after removing the CPP event days. As a result, choosing a large number of similar non-CPP event days will introduce bias due to the fact that non-CPP event days are in general less extreme than CPP-event days.
15171921232527293133
0 1 2 3 4 5 6 7 8 9 10 11 12 13 14 15 16 17 18 19 20 21 22 23
Tem
prat
ure
In C
elsiu
s
Hour Of The Day
6/29/2018 7/3/2018 7/20/2018 8/15/2018

30 © 2019 Publicis.Sapient. All rights reserved.
Coincident Peak Hour Evaluation
Similar to critical peak events analysis, coincident peak hour studies also aim at evaluating the treatment impact under the most severe conditions. There is only one coincident hour per month. As a result, for each day that involves a system coincident peak in 2018, we decided to use the top three similar days from 2015 to 2017. For example, there is one system coincident hour at 3 p.m. on 2018-07-05. For the evaluation, we found the top three most similar days in the past to establish a fair basis for difference-in-difference analysis.
Figure 11. Daily Temperature of Top 3 Similar Days for Coincident Hour Evaluation
15171921232527293133
0 1 2 3 4 5 6 7 8 9 10 11 12 13 14 15 16 17 18 19 20 21 22 23
Tem
prat
ure
In C
elsiu
s
Hour Of The Day
7/5/2018 6/27/2016 8/11/2016 9/7/2016

31 © 2019 Publicis.Sapient. All rights reserved.
Aggregate Own Price Elasticity Analysis
Aggregate own price elasticity is elasticity associated with a change in overall consumption due to change in average rates. This study estimated the price elasticity using the method proposed in Section 2.2.4 of another Navigant report6. Instead of using the monthly average cost of electricity, we use daily average cost, which factors in the monthly fixed cost to estimate the own price elasticity. In this study, we factor the monthly fixed cost evenly to each day of the month and take one year as the study scope.
The estimated own price elasticity of electricity uses the following equation:
ln�𝐿𝐿𝑖𝑖,𝑡𝑡� = 𝛽𝛽𝑐𝑐𝑝𝑝𝑝𝑝𝑐𝑐 ∙ 𝐶𝐶𝑀𝑀𝑀𝑀𝐶𝐶𝐶𝐶𝑀𝑀𝐶𝐶𝑇𝑇𝐶𝐶𝐶𝐶𝑡𝑡 + 𝛽𝛽ℎ𝑚𝑚𝑚𝑚𝑡𝑡 ∙ 𝐶𝐶𝑌𝑌𝑌𝑌𝑀𝑀𝐶𝐶𝑀𝑀𝐶𝐶𝑇𝑇𝐶𝐶𝐶𝐶𝑡𝑡 + 𝜓𝜓ln (𝑃𝑃𝑌𝑌𝐶𝐶𝑃𝑃𝑌𝑌𝑖𝑖,𝑡𝑡)
Where, 𝐿𝐿𝑖𝑖,𝑡𝑡 stands for the daily average hourly energy consumption of customer 𝐶𝐶 at day 𝑀𝑀.
𝐶𝐶𝑀𝑀𝑀𝑀𝐶𝐶𝐶𝐶𝑀𝑀𝐶𝐶𝑇𝑇𝐶𝐶𝐶𝐶ℎ,𝑡𝑡 and 𝐶𝐶𝑌𝑌𝑌𝑌𝑀𝑀𝐶𝐶𝑀𝑀𝐶𝐶𝑇𝑇𝐶𝐶𝐶𝐶ℎ,𝑡𝑡 stands for the daily mean cooling and heating thermal humidity indices (THI) for day 𝑀𝑀. As a result, 𝛽𝛽𝑐𝑐𝑝𝑝𝑝𝑝𝑐𝑐 and 𝛽𝛽ℎ𝑚𝑚𝑚𝑚𝑡𝑡 stand for the cooling and heating load sensitivity for pilot participants.
𝑃𝑃𝑌𝑌𝐶𝐶𝑃𝑃𝑌𝑌𝑖𝑖,𝑡𝑡 is the daily average hourly price of customer 𝐶𝐶 at day 𝑀𝑀 in dollar per kWh. In other words, it is the average of the 24 hourly electricity rate at day 𝑀𝑀.
𝜓𝜓 is the parameter capture the effect of energy price on customer’s energy consumption.
After estimating this equation, we obtain the average aggregate own price elasticity of demand using the estimated 𝜓𝜓. Please note that, the regression analysis is run on both control and treatment groups during the pilot period from May 1st to Oct 31st 2018.
6 Time of Use Rates in Ontario, Part 1: Impact Analysis

32 © 2019 Publicis.Sapient. All rights reserved.
The Elasticity of Substitution Analysis
The definition of the elasticity of substitution in this report is the elasticity associated with the change in the ratio of usage due to change in the ratio of prices between two time periods. The process described here follows the technical direction provided by the OEB staff in December 2018.
For Seasonal TOU with CPP treatment, we compute the elasticity of substitution between the On-peak and Off-peak pricing periods and between CPP event On-peak and Off-peak pricing periods for the summer season. Because this treatment has a flat price for the shoulder seasons, there are no On-peak and Off-peak TOU periods to compute the elasticity of substitution.
For Super-Peak TOU treatment, we compute the elasticity of substitution between Super-peak and Off-peak pricing periods and between On-peak and Off-peak pricing periods for the summer season. Similarly, for the summer shoulder season, we compute the elasticity of substitution between On-peak and Off-peak pricing periods.
To compute the elasticity of substitution between the Super-peak and Off-peak pricing periods for the Super-Peak TOU treatment in the summer season, the following equation is used.
ln �super_peak_kWh
off_peak_kWh�𝑖𝑖,𝑑𝑑
= � 𝛽𝛽𝑚𝑚,𝑑𝑑𝑚𝑚
∙ 𝑀𝑀𝑀𝑀𝑀𝑀𝑀𝑀ℎ𝑚𝑚 +
𝛽𝛽ℎ𝑚𝑚𝑚𝑚𝑡𝑡 ∙ 𝐶𝐶𝑌𝑌𝑌𝑌𝑀𝑀𝐶𝐶𝑀𝑀𝐶𝐶𝑇𝑇𝐶𝐶𝐶𝐶_𝐷𝐷𝐶𝐶𝐷𝐷𝐷𝐷𝑑𝑑 + 𝛽𝛽𝑐𝑐𝑝𝑝𝑝𝑝𝑐𝑐 ∙ 𝐶𝐶𝑀𝑀𝑀𝑀𝐶𝐶𝐶𝐶𝑀𝑀𝐶𝐶𝑇𝑇𝐶𝐶𝐶𝐶_𝐷𝐷𝐶𝐶𝐷𝐷𝐷𝐷𝑡𝑡 + 𝜎𝜎 ∙ ln �super_peak_price
off_peak_price�𝑖𝑖,𝑑𝑑
Where, �super_peak_kWhoff_peak_kWh
�𝑖𝑖,𝑑𝑑
is the energy consumption ratio between super-peak period and off-peak period for
customer 𝐶𝐶 at day 𝑑𝑑;
𝐶𝐶𝑌𝑌𝑌𝑌𝑀𝑀𝐶𝐶𝑀𝑀𝐶𝐶𝑇𝑇𝐶𝐶𝐶𝐶_𝐷𝐷𝐶𝐶𝐷𝐷𝐷𝐷𝑑𝑑 is the difference of mean monthly heating THI between the two pricing periods in day 𝑑𝑑;
𝐶𝐶𝑀𝑀𝑀𝑀𝐶𝐶𝐶𝐶𝑀𝑀𝐶𝐶𝑇𝑇𝐶𝐶𝐶𝐶_𝐷𝐷𝐶𝐶𝐷𝐷𝐷𝐷𝑑𝑑 is the difference of mean monthly cooling THI between the two pricing periods in day 𝑑𝑑;
�super_peak_priceoff_peak_price
�𝑖𝑖,𝑑𝑑
is the ratio of mean unit prices between the two pricing periods for customer 𝐶𝐶 at day 𝑑𝑑, where
both fixed cost and usage-based cost are considered;
As a result, 𝜎𝜎 is the elasticity of substitution between the two pricing periods.

33 © 2019 Publicis.Sapient. All rights reserved.
Similarly, we estimate the elasticity of substitution between CPP event and Off-peak pricing periods using the following equation. This equation uses daily aggregated metrics.
ln �CPP_kWh
off_peak_kWh�𝑖𝑖,𝑑𝑑
= � 𝛽𝛽𝑚𝑚,𝑑𝑑𝑚𝑚
∙ 𝑀𝑀𝑀𝑀𝑀𝑀𝑀𝑀ℎ𝑚𝑚 +
𝛽𝛽ℎ𝑚𝑚𝑚𝑚𝑡𝑡 ∙ 𝐶𝐶𝑌𝑌𝑌𝑌𝑀𝑀𝐶𝐶𝑀𝑀𝐶𝐶𝑇𝑇𝐶𝐶𝐶𝐶_𝐷𝐷𝐶𝐶𝐷𝐷𝐷𝐷𝑑𝑑 + 𝛽𝛽𝑐𝑐𝑝𝑝𝑝𝑝𝑐𝑐 ∙ 𝐶𝐶𝑀𝑀𝑀𝑀𝐶𝐶𝐶𝐶𝑀𝑀𝐶𝐶𝑇𝑇𝐶𝐶𝐶𝐶_𝐷𝐷𝐶𝐶𝐷𝐷𝐷𝐷𝑑𝑑 + 𝜎𝜎 ∙ ln �CPP_price
off_peak_price�𝑖𝑖,𝑑𝑑
where, � CPP_kWhoff_peak_kWh
�𝑖𝑖,𝑑𝑑
is the energy consumption ratio between CPP period and Off-peak period for customer 𝐶𝐶 at
day d;
𝐶𝐶𝑌𝑌𝑌𝑌𝑀𝑀𝐶𝐶𝑀𝑀𝐶𝐶𝑇𝑇𝐶𝐶𝐶𝐶_𝐷𝐷𝐶𝐶𝐷𝐷𝐷𝐷𝑑𝑑 is the difference of mean monthly heating THI between the two pricing periods on day 𝑑𝑑;
𝐶𝐶𝑀𝑀𝑀𝑀𝐶𝐶𝐶𝐶𝑀𝑀𝐶𝐶𝑇𝑇𝐶𝐶𝐶𝐶_𝐷𝐷𝐶𝐶𝐷𝐷𝐷𝐷𝑑𝑑 is the difference of mean monthly cooling THI between the two pricing periods on day 𝑑𝑑;
and � CPP_priceoff_peak_price
�𝑖𝑖,𝑑𝑑
is the ratio of mean unit price between the two pricing periods for customer 𝐶𝐶 on day 𝑑𝑑.
Similar to the super-peak and off-peak elasticity of substitution formula, 𝜎𝜎 is the elasticity of substitution.
Deviation from the EM&V Plan
The team did not face any issues, and there was no deviation from the EM&V Plan.

34 © 2019 Publicis.Sapient. All rights reserved.
Preliminary Results In April 2018, the team successfully launched the pilot with the Peak app, an innovative mobile application that serves as the centerpiece of the pilot program. The Peak app helps pilot participants shift their energy usage to off-peak times and seeks to promote conservation behaviours through synthesizing various data inputs, including smart meter data, demographic information, weather forecasts and customer inputs to create a highly relevant, tailored experience for the user and their household. Additionally, machine-learning algorithms optimize the user experience. For example, clustering all pilot participants according to their energy consumption patterns creates relevant peer groups for social and competitive engagement. Pilot participants within the same peer group have similar energy consumption profiles and can check their energy consumption ranking against others.
Program Results
The first six months of the RPP pilot program demonstrated it is on track to hit all of the project goals. Each pricing group in this pilot has performed toward a common goal: evaluating the impact of the three treatment types on conservation and load shifting. Actual results are defined from page 41, but Key highlights from the pilot groups are:
Seasonal TOU with CPP: Participants subject to CPP demonstrated an average reduction in consumption of 10% during the four-hour CPP events (Table 20. Critical Peak Events Impact). Also, we see a reduction in on-peak period usage of more than 3% (Table 19. Summer Usage impacts as of August 31, 2018). Participants who leveraged the Peak app reduced their consumption over 2x more during the summer than those who did not (Table 12. Monthly Average Total Bill Impact and Monthly Usage Impact for the First Six Month).
Super-Peak TOU: This treatment group demonstrated load shifting by recognizing the price differences; however, the total usage increased as well as their bills. Only the participants who used the Peak app lowered their usage, while those who did not use the app increased their usage. This observation demonstrates that under the same pricing plan, the digitally engaged participants have a greater conservation response than those who are subject to price signals alone.
Information Only: This group had the highest engagement and demonstrated the most sophisticated understanding of when to use electricity. During the first six months, they flattened their load profile leveraging the lowest cost period.
Over 80% of the opt-in participants were actively using the digital engagement tools (i.e., the Peak app), and almost 50% of the opt-out group were using the Peak app or had registered an email address to receive communications. This report documents relevant statistics of the participants that actively engaged and leveraged the Peak app to highlight the differences. Analysis of the importance of this information will be presented in the final report that will benefit from one year’s worth of data.
Pilot Conservation and Load Shifting Results
At the mid-pilot mark, we have observed the usage and bill impacts below in Table 12 for each pilot group. The Interim Usage Impact and Dollar Impact columns highlight the energy and financial impact, as compared with the control groups, for the participants in this program. These impacts measured between May 1 and October 31 2018, of which June, July and August are summer months and May, September and October are summer shoulder months. The table also shows the subgroup of participants within each treatment group who have been digitally engaged through a combination of communications via the Peak app and the Peak web portal.

35 © 2019 Publicis.Sapient. All rights reserved.
From Table 12, we can see that the Seasonal TOU with CPP treatment demonstrated the greatest kWh savings and reduced their bills the most. The Super-Peak TOU demonstrated an increase in energy consumption except for the subgroup that leveraged the Peak app. This subgroup managed to reduce their usage, resulting in a smaller bill increase relative to “All Participants”. The Information Only group had the highest increase in kWh, yet still posted only modest bill increases. This increase in consumption and modest increase in costs may be related to a better understanding of the TOU rates, as the usage increases were in the lowest cost period. The Peak app provided all digitally engaged participants with personalized and prioritized conservation and load shifting strategies. The Information Only group did not have a price treatment, and this leads us to believe that the strategies employed lead to a greater understanding of the costs of using electricity. In this case, the lowest cost time period showed an increase in consumption. The increased awareness of energy costs is also supported by the pre-pilot and mid-pilot surveys shown later in this report.
Table 12. Monthly Average Total Bill Impact and Monthly Usage Impact for the First Six Month
SIX MONTHS IMPACT MONTHLY TOTAL BILL IMPACT MONTHLY USAGE IMPACT
$ % kWh % SEASONAL TOU WITH CPP (Opt-in)
ALL PARTICIPANTS -0.55 -0.50 -4.93 -0.61 DIGITALLY ENGAGED PARTICIPANTS -1.40 -1.28 -11.57 -1.42
SUPER-PEAK TOU (OPT-OUT) ALL PARTICIPANTS 8.19 7.76 -0.52 -0.07 DIGITALLY ENGAGED PARTICIPANTS 6.63 6.23 -9.87 -1.25
INFORMATION ONLY (OPT-IN) ALL PARTICIPANTS 2.69 2.37 27.60 3.25 DIGITALLY ENGAGED PARTICIPANTS 2.86 2.51 29.54 3.46
Note: The enrollment list considered for this calculation is the number of active participants at the end of October 2018. Positive values represent increases in consumption or bill amount, and negative values show a decrease in consumption or bill amounts.
The numbers in Table 12 are on an average monthly basis. From the numbers, we can state two things:
1. The Peak app makes pricing treatments more effective. For both the Seasonal TOU with CPP and the Super-Peak TOU treatment groups, digitally engaged participants reduced their consumption more than the broader set of All Participants. The numbers for Super-Peak TOU plan includes the high-priced Super-Peak summer pricing months, resulting in higher bills even with conservation. A full-year impact will best show the impact of the annual price-neutral pilot design.
2. The digital engagement tools have made participants more aware of the cost of electricity. When not combined with an alternative TOU price plan, the Information Only group used more energy with only a marginal increase in their monthly bills. These behaviours are noted, and they will be targeted with an increase in the importance of conservation during the winter months, showing the flexibility of Peak app implementation.
This report covers the first six months of the pilot, a limited amount of interpretation can be done on the relationship between the dollar impact, and usage impact can be made as the rates were set to be neutral on an annual basis.

36 © 2019 Publicis.Sapient. All rights reserved.
There are two sources of bias based on the type of enrollment/recruitment into the pilot program:
1. Opt-in enrollment will inevitably introduce a volunteer bias. The expression of bias is through two sets of actions that similarly affect pilot outcomes. First, people who care about energy consumption or people who will benefit from the new pricing treatment are more likely to enroll. Second, people who do not care about energy consumption or who are likely to pay more under the new pricing plan may actively choose to avoid joining the pilot.
2. Opt-out enrollment introduces another bias because there is no confirmation from customers to make sure they are aware of the new pricing treatment. Participants who we cannot confirm are digitally engaged may not be aware of information or pricing signals that would cause them to change their behaviours.
For additional clarity, because these two biases are dissimilar, readers should compare each treatment’s results against results from other pilots that follow the same opt-in or opt-out process.
Pilot Results by Segment
The change and effectiveness across the targeted segments are below in Table 13. The Low and Middle Income (LMI) segment is participants who enrolled in low-income programs and who have indicated on the survey that they have low income. The New House/Old House segment is participants who live in a house built in or after the year 2000/before 2000, respectively. The final segment is High-Energy Users who are the participants in the top 10% of energy users within each pricing group.
Table 13. Monthly Average Total Bill Impact and Monthly Usage Impact for segments SIX MONTHS
IMPACT MONTHLY TOTAL BILL IMPACT MONTHLY USAGE IMPACT
SIZE $ % kWh % SEASONAL TOU WITH CPP (Opt-in)
LMI GROUP 51 0.82 0.78 9.44 1.22 NEW HOUSE 48 -0.11 -0.10 -2.51 -0.29 OLD HOUSE 366 -0.51 -0.46 -4.51 -0.55 HIGH-ENERGY USERS 47 -4.88 -2.54 -43.87 -2.80
SUPER-PEAK TOU (Opt-out) LMI GROUP 73 6.46 6.84 -2.71 -0.40 NEW HOUSE 19 10.23 9.80 9.56 1.24 OLD HOUSE 1192 9.03 8.27 2.44 0.30 HIGH-ENERGY USERS 142 11.45 6.25 -35.64 -2.41
INFORMATION ONLY (Opt-in) LMI GROUP 44 8.79 8.26 82.21 10.50 NEW HOUSE 205 3.34 2.81 33.24 3.72 OLD HOUSE 229 2.62 2.40 27.06 3.35 HIGH-ENERGY USERS 50 1.98 1.00 22.89 1.43
Note: Positive values represent an increase in usage and bill amounts, and negative values represent a decrease in usage and bill amounts.
From the table, we can draw initial conclusions around the effectiveness of this pilot, summarized below. After the completion of the pilot, there will be an analysis of the full pilot year data set.
• LMI participants showed an increase in consumption for the opt-in programs and a decrease for opt-out program. The LMI designation here is self-reported, and further corroboration will be attempted with the full 12-month pilot data set.
• Participants in old houses have reduced their consumption or increased it less than those in new houses. • High-energy users have stood out by demonstrating consistent reduction in consumption across pricing
treatment groups and the lowest increase in energy consumption for the Information Only group.

37 © 2019 Publicis.Sapient. All rights reserved.
Two online surveys were conducted as part of the pilot, one before the start and the other one at the mid-pilot point (the mid-pilot survey ran from 10 Sep. 2018 to 14 Oct. 2018). These surveys captured results to understand better changes in behaviour, or the adoption of new technologies (e.g., a smart thermostat) due to participation.
Figure 12 and Figure 13 show an improvement in the percentage of participants that understand what the most effective methods to reduce their bill during the summer months.
Figure 12. Pre-Pilot Survey: Most Effective Way to Reduce Your Bill in the Summer
Figure 13. Mid-Pilot Survey: Most Effective Way to Reduce Your Bill in the Summer
46 4549
46
1721 20 17
28 2622
28
10 9 9 10
-10
10
30
50
70
Total Seasonal TOU with CPP TOU Super Peak Information Only
Raise the temperature on your A/C unit by 2 degrees Celsius between the hours of 1 p.m. and 7 p.m. during hot monthsMinimize your use of appliances that generate heat (oven, hair dryer, dishwasher)Close the blinds or curtains on the sunny side of your homeTurn off and unplug ‘silent energy users’ such as phone chargers and cable boxes, which draw electricity when not in use
57 5462
56
14 17 14 12
22 20 2026
7 95 6
0
20
40
60
80
Total Seasonal TOU with CPP TOU Super-Peak Information Only
Raise the temperature on your A/C unit by 2 degrees Celsius between the hours of 1 p.m. and 7 p.m. during hot monthsMinimize the use of appliances that generate heat (oven, hair dryer, dishwasher)Close the blinds or curtains on the sunny side of your homeTurn off and unplug ‘silent energy users’ such as phone chargers and cable boxes, which draw electricity when not in use

38 © 2019 Publicis.Sapient. All rights reserved.
The survey presented questions to the participants about what equipment they have in their homes, their understanding of electricity pricing and electricity management options, as well as their views on the pilot program. The mid-pilot survey results show that the participants have increased their knowledge as it relates to each question in the survey. As an example, participants in the Information Only group mentioned that they are pleased to be part of this pilot program. Figure 14 and Figure 15 show an increased percentage of participants that believe TOU pricing is fair.
Figure 14. Pre-Pilot Survey: Belief that TOU Pricing is Fair
Figure 15. Mid-Pilot Survey: Belief that TOU Pricing is Fair
2427
2420
33 32 33 34
43 42 4246
0
10
20
30
40
50
Total Seasonal TOU with CPP TOU Super-Peak Information Only
TRUE FALSE UNSURE
31 3328
3133 3128
3936 35
44
30
0
10
20
30
40
50
Total Seasonal TOU with CPP TOU Super-Peak Information Only
TRUE FALSE UNSURE

39 © 2019 Publicis.Sapient. All rights reserved.
Participant Engagement
The pilot called for two recruitment types: opt-in and opt-out. The efforts for getting to the final sample size were different for each. The strategy had to remove self-selection bias, which complicated recruitment. To remove this bias, each potential participant had to be unaware of the other pilot groups. A key part of the pilot was the information treatment, and each group had a different mechanism to encourage engagement with the digital tools. The information group was recruited based on access to more information. Pilot instructions invited the other two groups to use the tools as a benefit to pilot participation.
Figure 16 above shows the enrollment summary as of Oct. 31, 2018. The “total participants” number is all users who are involved in each pilot treatment. The first and last treatment groups enrolled through an opt-in approach, and the middle treatment group enrolled through an opt-out approach. These charts divide the total participant metric by how the users are interacting with key digital channels. Among the total participants, some participants have downloaded the Peak app (dark green) and logged in at least once to view the usage, and some participants have not downloaded the app but provided their email address (light green) instead. The dark green segment represents participants that are Digitally Engaged. Traditional mail inserts notified opt-out participants. Since there is no confirmation required for the opt-out plan, it is possible that some opt-out plan subjects are not aware of the new pricing plan. It is important to note that the statistical information presented in this report is on the analysis of all participants. A further description of the pilot drop-out is included in appendix F.
Figure 16. Pilot Enrollment Summary (Oct. 31, 2018)
460 Total Participants 1,330 Total Participants 495 Total Participants
Email contact only App users No digital contact with users
79%
21%
Seasonal with CPP (Opt In)
20%
24%56%
Super-Peak(Opt Out)
85%
15%
Information Only (Opt In)

40 © 2019 Publicis.Sapient. All rights reserved.
Table 14 demonstrates how participants leveraged different channels to receive communications over the first six months. Initially there was an equal preference for either all channels or just email and SMS. Over time, we observed that participants were becoming more familiar with the Peak app and choosing to participate in all channels of communication. The increase of participants using all communications channels is a result of the email and SMS group downloading and using the Peak mobile app. This, however, does not account for the full decrease in participants only using email and SMS. This decrease will be further investigated in the final report.
Table 14. Communication Groups by Month COMMUNICATION GROUPS MAY JUNE JULY AUG SEP OCT EMAIL, SMS AND APP NOTIFICATIONS 851 970 988 986 988 982 EMAIL AND SMS 941 644 643 620 594 587 EMAIL ONLY 23 11 14 10 9 9 SMS ONLY 714 714 706 698 696 688
Table 15 below depicts further detail about click through rates with different email types. When aligned with the channel preferences above it appears as though participants are becoming aware of the Peak app, downloading it, and attempting to leverage its capabilities. The increase in app use enables a more personalized experience and potentially enable better content prioritization, for example CPP notifications via SMS.
Table 15. Email Click Through Based on Message Type*
EMAIL MESSAGE TYPE JUN JUL AUG SEP OCT ALL EMAILS (INCLUDES ALL MENTIONED BELOW) 60% 59% 57% 51% 27% BILL READY EMAILS 61% 65% 63% 59% 21% CPP COMMUNICATION EMAILS 70% 55% 53% N/A N/A WEEKLY RECAP EMAILS 62% 60% 58% 53% 49% OTHER PROGRAM CAMPAIGNS (EX. DEAL DAYS) 51% 52% N/A N/A 18%
* Conservation and load shifting emails started after introductions and at the end of the first month of the pilot
A full year’s worth of pilot data will enable additional behavior hypotheses regarding the declining open rates. Some considerations are:
1. Bill ready emails: Pilot participants were more consistent in checking bill ready emails during the summer months when usage was high. During the summer shoulder months, the bill may not have been as much of a concern.
2. CPP Communications: CPP communications were sent through multiple channels. During the first CPP month, while participants were getting used to Peak App, they checked CPP emails more frequently. Once people were accustomed to Peak app, they may be more accustom to shorter SMS and push notifications. We will need to determine the trend for winter CPP months to understand this information better.
3. Weekly recap emails: This may be related to better leveraging the Peak app. Weekly recaps could be a reminder for information the participants already know through using the app. Recap content may not be as interesting to people that are better informed about their usage habits.

41 © 2019 Publicis.Sapient. All rights reserved.
Summer Price/Non-Price Impacts
Table 16 & Table 17 show the average hourly On-peak and Super-peak/CPP demand reduction and average daily conservation for all three treatment groups during the summer months. The On-peak demand reductions in Table 16 are measured on “per user per peak hour”. The Seasonal TOU with CPP group reduced their On-peak consumption by 3.33%, followed by Super-Peak TOU group which reduced their On-peak consumption by 2.04% and the Information Only group reduced their on-peak consumption by 0.40%. We also observe that average hourly reduction during CPP events for Seasonal TOU pricing group was at 10.13%, similarly for Super-peak hours the reduction was at 2.64%. The conservation impacts in Table 17 are measured using “per user per day”.
Table 16. Summer Peak Demand Reduction as of October 31st, 2018
Table 17. Summer Conservation Impact as of October 31st, 2018
Summer Usage and Pricing impacts for the months of June to August 2018, for each of the pricing treatment groups, are in Table 18. The table also shows the subgroup of participants who the pilot has been able to engage with digitally through the Peak app and the Peak web portal. We see that on average, participants in price treatment groups have paid more on a monthly basis due to the high-pricing TOU for these months in these plans.
It is interesting to note that Digitally Engaged Participants using the Peak app in the same pricing treatment have either reduced their consumption more or increased their consumtion less than All Particpants witin the same treatment group. It appears that price and information treatment is the most effective combination.
Participants in the Information Only group who have received only the information treatment have been shown to consume slightly more energy, presumably due to gain in knowledge of TOU pricing enabling them to use energy when it is cheaper. This group also demonstrates in Table 19 a modest load shift from On-peak to Off-peak periods.
AVERAGE HOURLY ON-PEAK DEMAND
REDUCTION AVERAGE HOURLY SUPER-PEAK/CPP DEMAND
REDUCTION
SUMMER kWh % 95% CONFIDENCE INTERVAL
kWh % 95% CONFIDENCE INTERVAL
LOWER UPPER SIGNIFICANT LOWER UPPER SIGNIFICANCE SEASONAL TOU WITH CPP -0.041 -3.33 -0.048 -0.035 TRUE -0.185 -10.13 -0.214 -0.157 TRUE SUPER PEAK TOU -0.021 -2.04 -0.025 -0.018 TRUE -0.038 -2.64 -0.042 -0.034 TRUE INFORMATION ONLY -0.006 -0.40 -0.014 0.002 FALSE NA NA NA NA NA
AVERAGE DAILY USAGE REDUCTION
SUMMER kWh % 95% CONFIDENCE INTERVAL
LOWER UPPER SIGNIFICANT SEASONAL TOU WITH CPP -0.244 -0.81 -0.801 0.312 FALSE SUPER PEAK TOU -0.106 -0.37 -0.501 0.290 FALSE INFORMATION ONLY 1.045 3.30 0.417 1.673 TRUE

42 © 2019 Publicis.Sapient. All rights reserved.
Table 18. Monthly Average Total Bill Impact and Monthly Usage Impact for the Summer Months
SUMMER SEASON IMPACT MONTHLY TOTAL BILL IMPACT MONTHLY USAGE IMPACT
$ % KWH % SEASONAL TOU WITH CPP (OPT-IN)
ALL PARTICIPANTS 0.82 0.68 -7.49 -0.82 DIGITALLY ENGAGED PARTICIPANTS -0.17 -0.14 -13.89 -1.50
SUPER-PEAK TOU (OPT-OUT) ALL PARTICIPANTS 21.66 18.54 -3.25 -0.37 DIGITALLY ENGAGED PARTICIPANTS 18.94 15.97 -17.36 -1.94
INFORMATION ONLY (OPT-IN) ALL PARTICIPANTS 2.98 2.33 32.04 3.30 DIGITALLY ENGAGED PARTICIPANTS 2.94 2.29 32.31 3.32
Note: Enrollment list considered for this calculation is the number of active participants at the end of August 2018.
An analysis of participant behavior through the summer months of the pilot is provided below in Table 19, which summarizes the key metrics of total participants under three different treatment groups: Information Only, Seasonal TOU with CPP and Super-Peak TOU. We introduced three control groups for each of the three treatment groups. Each impact study is compared with its respective control groups.
The numerical values in Table 19 are “per user per day,” except the metric for average conservation impact, where we show the impact in “per user per season.” For example, under the Seasonal TOU with CPP treatment, the summer On-Peak impact is -0.4948 kWh per user per day as shown in the table below. Since there are 12 on-peak hours in one day, the hourly reduction during the on-peak period should be −0.4948/12 = −0.0412 kWh per user. Similarly, under the Super-Peak TOU plan, the hourly energy consumption reduction during the Super-Peak hours is −0.2290/6 = −0.0382 kWh per user. This ‘per user per day” rule also apply to the system-coincident peak which only lasts one hour in one day.

43 © 2019 Publicis.Sapient. All rights reserved.
Table 19. Summer Usage impacts as of August 31, 2018
SEASONAL TOU WITH CPP
kWh % 95% CONFIDENCE INTERVAL
LOWER UPPER SIGNIFICANT SUMMER ON-PEAK IMPACT -0.4948 -3.33 -0.5749 -0.4146 TRUE SUMMER OFF-PEAK IMPACT (WEEKDAY) 0.1863 1.39 0.1151 0.2575 TRUE SUMMER OFF-PEAK IMPACT (WEEKEND) 0.0320 0.10 -0.1742 0.2383 FALSE SUMMER SYSTEM-COINCIDENT PEAK IMPACT -0.0731 -3.51 -0.1231 -0.0231 TRUE SUMMER AVERAGE CONSERVATION IMPACT -22.4811 -0.81 -73.6758 28.7136 FALSE
SUPER-PEAK TOU kWh %
95% CONFIDENCE INTERVAL LOWER UPPER SIGNIFICANT
SUMMER SUPER-PEAK IMPACT -0.2290 -2.64 -0.2536 -0.2018 TRUE SUMMER ON-PEAK IMPACT -0.1286 -2.04 -0.1497 -0.1074 TRUE SUMMER OFF-PEAK IMPACT (WEEKDAY) 0.1802 1.38 0.1423 0.2182 TRUE SUMMER OFF-PEAK IMPACT (WEEKEND) 0.0577 0.19 -0.0615 0.1770 FALSE SUMMER SYSTEM-COINCIDENT PEAK IMPACT -0.0339 -1.69 -0.0619 -0.0059 TRUE SUMMER AVERAGE CONSERVATION IMPACT -9.7362 -0.37 -46.1267 26.6544 FALSE
INFORMATION ONLY kWh %
95% CONFIDENCE INTERVAL LOWER UPPER SIGNIFICANT
SUMMER ON-PEAK IMPACT -0.0351 -0.40 -0.0812 0.0111 FALSE SUMMER MID-PEAK IMPACT 0.0506 0.63 0.0137 0.0875 TRUE SUMMER OFF-PEAK IMPACT (WEEKDAY) 0.8618 6.08 0.7971 0.9264 TRUE SUMMER OFF-PEAK IMPACT (WEEKEND) 1.4272 4.32 1.2201 1.6344 TRUE SUMMER SYSTEM-COINCIDENT PEAK IMPACT 0.0100 0.43 -0.0426 0.0626 FALSE SUMMER AVERAGE CONSERVATION IMPACT 96.1071 3.30 38.3231 153.8912 TRUE
The proposed hourly impact study for each treatment allows us to examine how different price/information treatments reshape customers’ energy consumption behaviour.
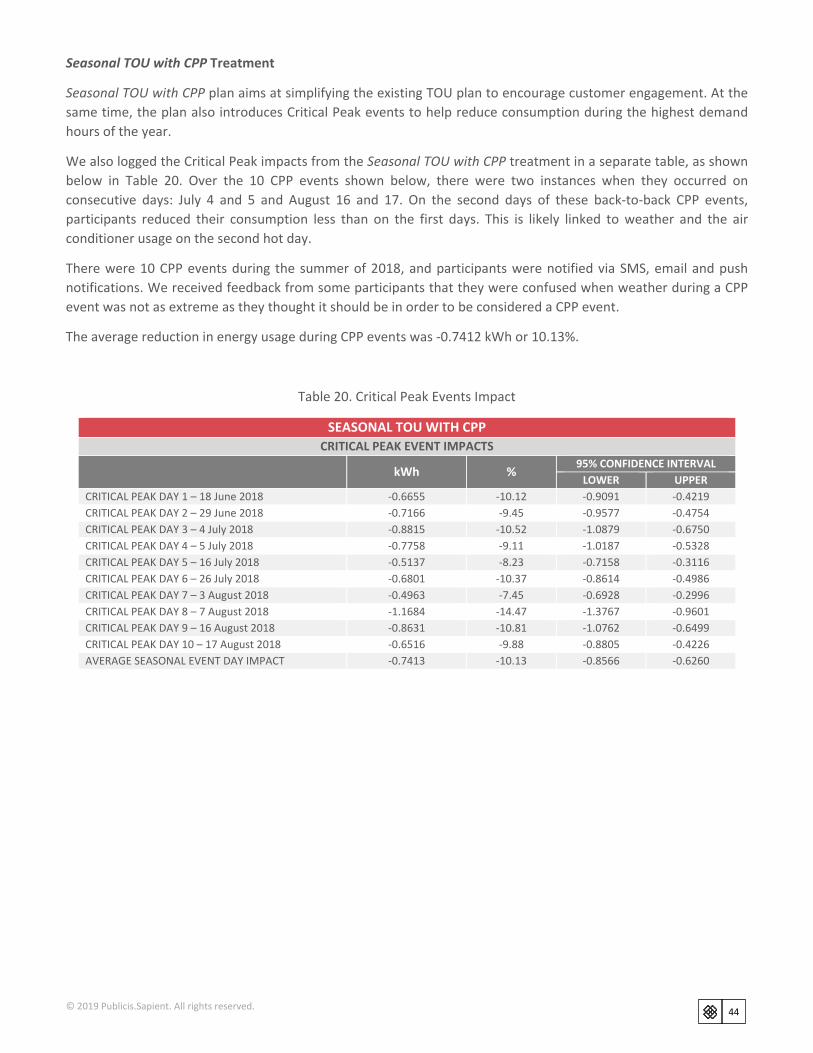
44 © 2019 Publicis.Sapient. All rights reserved.
Seasonal TOU with CPP Treatment
Seasonal TOU with CPP plan aims at simplifying the existing TOU plan to encourage customer engagement. At the same time, the plan also introduces Critical Peak events to help reduce consumption during the highest demand hours of the year.
We also logged the Critical Peak impacts from the Seasonal TOU with CPP treatment in a separate table, as shown below in Table 20. Over the 10 CPP events shown below, there were two instances when they occurred on consecutive days: July 4 and 5 and August 16 and 17. On the second days of these back-to-back CPP events, participants reduced their consumption less than on the first days. This is likely linked to weather and the air conditioner usage on the second hot day.
There were 10 CPP events during the summer of 2018, and participants were notified via SMS, email and push notifications. We received feedback from some participants that they were confused when weather during a CPP event was not as extreme as they thought it should be in order to be considered a CPP event.
The average reduction in energy usage during CPP events was -0.7412 kWh or 10.13%.
Table 20. Critical Peak Events Impact
SEASONAL TOU WITH CPP CRITICAL PEAK EVENT IMPACTS
kWh % 95% CONFIDENCE INTERVAL
LOWER UPPER CRITICAL PEAK DAY 1 – 18 June 2018 -0.6655 -10.12 -0.9091 -0.4219 CRITICAL PEAK DAY 2 – 29 June 2018 -0.7166 -9.45 -0.9577 -0.4754 CRITICAL PEAK DAY 3 – 4 July 2018 -0.8815 -10.52 -1.0879 -0.6750 CRITICAL PEAK DAY 4 – 5 July 2018 -0.7758 -9.11 -1.0187 -0.5328 CRITICAL PEAK DAY 5 – 16 July 2018 -0.5137 -8.23 -0.7158 -0.3116 CRITICAL PEAK DAY 6 – 26 July 2018 -0.6801 -10.37 -0.8614 -0.4986 CRITICAL PEAK DAY 7 – 3 August 2018 -0.4963 -7.45 -0.6928 -0.2996 CRITICAL PEAK DAY 8 – 7 August 2018 -1.1684 -14.47 -1.3767 -0.9601 CRITICAL PEAK DAY 9 – 16 August 2018 -0.8631 -10.81 -1.0762 -0.6499 CRITICAL PEAK DAY 10 – 17 August 2018 -0.6516 -9.88 -0.8805 -0.4226 AVERAGE SEASONAL EVENT DAY IMPACT -0.7413 -10.13 -0.8566 -0.6260

45 © 2019 Publicis.Sapient. All rights reserved.
Figure 17 shows the average hourly impact of Seasonal TOU with CPP treatment for all participants on non-CPP event weekdays. The solid lines are the energy consumption before and after the treatment, and the dotted lines are the hourly energy price before and after the treatment. The post-treatment usage curve is the observed usage, while the pre-treatment curve is the counterfactual estimate using the proposed regression model. The two solid lines show that pilot participants reduced their usage during high on-peak prices and increased usage during the following low off-peak period. This behaviour demonstrates load shifting, presumably due to understanding price differences and the ability to shift usage to lower cost periods.
Figure 17. Hourly Impact; Seasonal TOU with CPP; Non-CPP Event Summer Weekdays
Figure 18 shows the average CPP event impact on Seasonal TOU with CPP participants. As the figure shows, Critical Peak Price dramatically drops the energy consumption during the CPP hours. The average drop in energy consumption for the four-hour period is close to 10%. Also, we observe energy conservation starting even before the critical peak events, and the conservation continues for a short period after the critical peak event is over. The analysis does not show any significant load-shift effect across any period. The results show that participants simply conserved 10% of their energy consumption.
Figure 18. Hourly Impact; CPP Events; Summer Weekdays
0
5
10
15
20
25
30
0.4
0.6
0.8
1
1.2
1.4
1.6
1.8
2
0 1 2 3 4 5 6 7 8 9 10 11 12 13 14 15 16 17 18 19 20 21 22 23
kWh
/ hr
cent
/ kW
h
Hour of the daypre_weekday post_weekday TOU SeasonalCPP
0
5
10
15
20
25
30
0.4
0.6
0.8
1
1.2
1.4
1.6
1.8
2
0 1 2 3 4 5 6 7 8 9 10 11 12 13 14 15 16 17 18 19 20 21 22 23
kWh
/ hr
cent
/ kW
h
Hour of the daypre_weekday post_weekday TOU SeasonalCPP

46 © 2019 Publicis.Sapient. All rights reserved.
Super-Peak TOU Treatment
Super-Peak TOU treatment seeks to impose a much higher on-peak price to create a much higher demand response impact. The design of the treatment pricing structure is simple and easy to understand, as this is an opt-out pilot.
The next two plots show the average hourly impact during the summer months for all participants and the Digitally Engaged Participants, respectively. We see a change in energy consumption patterns for both groups. However, under the same pricing plan, the Digitally Engaged Participants have a more pronounced demand response compared to the average of all the participants under the plan.
Figure 19 agrees with Table 19 that the demand response during the Super Peak hours are not as high as we would expect. Our hypothesis is that three different potential factors may be responsible. To begin with, due to that Super-Peak TOU plan is an opt-out plan, we do not have an immediate feedback from the participants to confirm that everyone is aware of the price change. It is entirely possible that some of the users are not aware of the big change in the pricing plan or they simply forget about this since the pilot starts at May and Super Peak kicks in on June. As a result, these participants would act as usual, which is also something to be expected in many opt-out plans, when the message is not effectively delivered through mails. The second factor is the lower percentage of Digitally Engaged Participants. Compared with other two pricing plans, the opt-out plan has a much smaller group of Digitally Engaged Participants. Our hypothesis is Digitally Engaged Participants are more likely to respond to the price signals than average users who don’t have model app access. The last contributing factor could be the opt-in and opt-out bias. Compared to the other two plans which requires active opt-in, there is an inherent difference in the pilot population. In the opt-out plan where people are passively enrolled, we would include people who cares less about electricity bills or environmental impacts.
Figure 19. Hourly Impact; Super-Peak TOU; All Participants; Summer Weekdays
0
5
10
15
20
25
30
0.4
0.6
0.8
1
1.2
1.4
1.6
1.8
2
0 1 2 3 4 5 6 7 8 9 10 11 12 13 14 15 16 17 18 19 20 21 22 23
kWh
/ hr
cent
s / k
Wh
Hour of the day
pre_weekday post_weekday TOU SuperPeak

47 © 2019 Publicis.Sapient. All rights reserved.
Figure 20. Hourly Impact; Super-Peak; Digitally Engaged Participants ; Summer Weekdays
0
5
10
15
20
25
30
0.4
0.6
0.8
1
1.2
1.4
1.6
1.8
2
0 1 2 3 4 5 6 7 8 9 10 11 12 13 14 15 16 17 18 19 20 21 22 23
kWh
/ hr
cent
s/kW
h
Hour of the day
pre_weekday post_weekday TOU SuperPeak

48 © 2019 Publicis.Sapient. All rights reserved.
Information Only Treatment
Compared with the previous two pricing treatments, the Information Only treatment seeks to enhance customers’ understanding of the existing TOU pricing plan and let them gain more awareness of the potential impacts of their energy consumption behaviour.
The figure below shows the hourly impact for Information Only treatment group on weekdays. This agrees with Table 19 that participants under information treatment increased their energy consumption. In fact, the figure reveals that Information Only treatment hardly reduced the on-peak usage, but instead it encouraged consumers to use more energy during Off-peak hours when the price is low. This leads to an overall increase in customers’ daily energy consumption. Our hypothesis for this behavior is that many customers were not aware that electricity price is very low during off-peak hours before the information treatment. Once the TOU pricing plan is clear to the participants, they choose to take advantage of the price signal and use more energy during the Off-peak hours.
Through the Information Only treatment, the participants have become more aware of the lower prices during off-peak hours, and this information revealed the demand closer to the true demand under the lower energy price. In the mid-pilot survey, the Information Only participants indicated that they are strongly motivated to shift from On-Peak to Off-Peak, but not as interested when asked if a shorter more expensive On-peak was available.
% PARTICIPANTS THAT STRONGLY AGREE PRE-PILOT MID-PILOT
I TRY TO SHIFT MY USAGE FROM ON-PEAK TO OFF-PEAK TIME OF USE PRICING TO CONSERVE ENERGY AND MONEY N/A 65
I'M MORE LIKELY TO SHIFT MY ELECTRICITY USAGE IF THERE WAS SHORTER AND MORE EXPENSIVE ON-PEAK TIME N/A 35
I CHANGE MY ELECTRICITY USAGE DURING THE DAY DEPENDING ON HOW MUCH I'M BEING CHARGED AT THAT PARTICULAR TIME 44 60
I HAVE A GOOD UNDERSTANDING OF THE DIFFERENCE BETWEEN FLAT PRICING AND TIME-OF-USE PRICING 43 61
Figure 21. Hourly Impact; Information Only; Summer Weekday
0
5
10
15
20
25
30
00.20.40.60.8
11.21.41.61.8
22.22.4
0 1 2 3 4 5 6 7 8 9 10 11 12 13 14 15 16 17 18 19 20 21 22 23
Hour of the daypre_weekday post_weekday TOU

49 © 2019 Publicis.Sapient. All rights reserved.
Summer Shoulder Price/Non-Price Impacts
Below tables 21 & 22 show the average hourly On-peak and Super-peak/CPP demand reduction and average daily conservation for all three treatment groups during the summer shoulder months. The On-peak demand reductions in Table 21 are measured on “per user per peak hour”. The Seasonal TOU with CPP has no values as the pricing group had a flat rate for all 24hrs on all days. The Super-Peak TOU group which reduced their On-peak consumption by 1.58% and the Information Only group increased their on-peak consumption by 1.94%, which may be because of the gain in knowledge on the TOU charges. The conservation impacts in Table 22 are measured using “per user per day”.
Table 21. Summer Shoulder Peak Demand Reduction as of October 31st, 2018
Table 22. Summer Shoulder Conservation Impact as of October 31st, 2018
Summer shoulder usage and pricing impacts for the months of May, September and October 2018 with each of the pricing treatment groups are presented in Table 23. By observation, we see that on average customers in pricing treatment groups have paid less every month due to the flat pricing TOU for these months in these plans.
It is interesting to note that Digitally Engaged Particpants (i.e., using the Peak app) in the pricing treatment groups have reduced their energy usage more than All Participants. It appears that price combined with the information treatment is the most effective option again. On the contrary, participants in Information Only group — who have received only the information treatment — consume more energy due to gain in knowledge of TOU pricing and using the energy when it is cheaper during the day. The table also shows the subgroup of participants that the pilot has been able to engage with digitally through combinations of digital communications, the Peak app and the Peak web portal. Further analysis of this behaviour will occur with the full pilot data set.
AVERAGE HOURLY ON-PEAK DEMAND
REDUCTION AVERAGE HOURLY SUPER-PEAK/CPP
DEMAND REDUCTION
SUMMER SHOULDER kWh % 95% CONFIDENCE INTERVAL
kWh % 95% CONFIDENCE INTERVAL
LOWER UPPER SIGNIFICANT LOWER UPPER SIGNIFICANCE SEASONAL TOU WITH CPP NA NA NA NA NA NA NA NA NA NA SUPER PEAK TOU -0.015 -1.58 -0.018 -0.012 TRUE NA NA NA NA NA INFORMATION ONLY 0.019 1.94 0.012 0.026 TRUE NA NA NA NA NA
AVERAGE DAILY USAGE REDUCTION
SUMMER SHOULDER kWh % 95% CONFIDENCE INTERVAL
LOWER UPPER SIGNIFICANT
SEASONAL TOU WITH CPP -0.077 -0.33 -0.526 0.371 FALSE SUPER PEAK TOU 0.072 0.32 -0.223 0.366 FALSE INFORMATION ONLY 0.755 3.17 0.303 1.207 TRUE

50 © 2019 Publicis.Sapient. All rights reserved.
Table 23. Monthly Average Total Bill Impact and Monthly Usage Impact for Summer Shoulder Months
SUMMER SHOULDER SEASON IMPACT
MONTHLY TOTAL BILL IMPACT MONTHLY USAGE IMPACT $ % KWH %
SEASONAL TOU WITH CPP (OPT-IN) ALL PARTICIPANTS -1.92 -1.97 -2.37 -0.33 PARTICIPANTS DIGITALLY ENGAGED -2.63 -2.70 -9.24 -1.30
SUPER-PEAK TOU (OPT-OUT) ALL PARTICIPANTS -5.28 -5.60 2.20 0.32 PARTICIPANTS DIGITALLY ENGAGED -5.68 -6.02 -2.38 -0.35
INFORMATION ONLY (OPT-OUT) ALL PARTICIPANTS 2.41 2.42 23.16 3.18 PARTICIPANTS DIGITALLY ENGAGED 2.78 2.79 26.76 3.65
Notes: Enrollment list considered for this calculation is the number of active participants at the end of October 2018. Positive values represent increases in consumption or bill amounts, and negative values show a decrease in consumption or bill amounts.
An analysis of participant behaviour through the summer shoulder months of the pilot is provided below in Table 24, which summarizes the key metrics of total participants under three different treatment groups: Information Only, Seasonal TOU with CPP and Super-Peak TOU. We introduced a control group for each of the three treatment groups. Each impact study is between each respective pair of treatment and control groups. From the results in Table 23, we can make a few observations.
1. Seasonal TOU with CPP: The full group showed less conservation as the CPP events were over and weather was milder. However, the digitally engaged participants continued to demonstrate higher and more consistent conservation.
2. Super Peak: The short summer price period ended, and participants responded to the lower prices. The entire group consumed slightly more energy and the digitally engaged participants, while still conserving energy, did so at a much smaller amount than during the high summer prices.
3. Information Only: This pilot group demonstrated similar energy as during the summer months.

51 © 2019 Publicis.Sapient. All rights reserved.
The numerical values in Table 24 are “per user per day” except the metric for average conservation impact, where we show the impact in “per user per season,” as earlier.
Table 24. Summer Shoulder Usage Impacts as of Oct. 31, 2018
SEASONAL TOU WITH CPP
kWh % 95% CONFIDENCE INTERVAL
LOWER UPPER SIGNIFICANT SUMMER SHOULDER SYSTEM-COINCIDENT ON-PEAK IMPACT -0.0759 -4.02 -0.1128 -0.0391 TRUE SUMMER SHOULDER AVERAGE CONSERVATION IMPACT -7.1089 -0.33 -48.3689 34.1511 FALSE
TOU SUPER-PEAK
kWh % 95% CONFIDENCE INTERVAL
LOWER UPPER SIGNIFICANT SUMMER SHOULDER ON-PEAK IMPACT -0.1775 -1.58 -0.2167 -0.1383 TRUE SUMMER SHOULDER OFF-PEAK IMPACT (WEEKDAY) 0.1733 1.68 0.1368 0.2097 TRUE SUMMER SHOULDER OFF-PEAK IMPACT (WEEKEND) 0.2370 1.00 0.1246 0.3493 TRUE SUMMER SHOULDER SYSTEM-COINCIDENT PEAK IMPACT -0.0147 -0.81 -0.0358 0.0064 FALSE SUMMER SHOULDER AVERAGE CONSERVATION IMPACT 6.6072 0.32 -20.4763 33.6906 FALSE
INFORMATION ONLY kWh %
95% CONFIDENCE INTERVAL LOWER UPPER SIGNIFICANT
SUMMER SHOULDER ON-PEAK IMPACT 0.1142 1.94 0.0748 0.1536 TRUE SUMMER SHOULDER MID-PEAK IMPACT 0.1142 1.90 0.0813 0.1470 TRUE SUMMER SHOULDER OFF-PEAK IMPACT (WEEKDAY) 0.4946 4.48 0.4351 0.5541 TRUE SUMMER SHOULDER OFF-PEAK IMPACT (WEEKEND) 0.8252 3.21 0.6388 1.0116 TRUE SUMMER SHOULDER SYSTEM-COINCIDENT PEAK IMPACT 0.0278 1.32 -0.0107 0.0663 FALSE SUMMER SHOULDER AVERAGE CONSERVATION IMPACT 69.4757 3.17 27.8785 111.0728 TRUE
Notes: A similar hourly impact study is available for all three treatments for the summer shoulder season. Positive values represent increases in consumption or bill amounts, and negative values show a decrease in consumption or bill amounts.

52 © 2019 Publicis.Sapient. All rights reserved.
Seasonal TOU with CPP Treatment
In summer shoulder months, the Seasonal TOU with CPP plan offers a flat price for all hours and all-day types.
Figure 22 shows the average hourly impact of Seasonal TOU with CPP treatment for all participants on weekdays. The solid lines are the energy consumption before and after the treatment, and the dashed lines are the hourly energy price before and after the treatment. The post-treatment usage curve is the observed usage, while the pre-treatment curve is the counterfactual estimate using the proposed regression model. This graph shows that users maintained a normal usage pattern when flat rates were in effect. This behaviour presumably demonstrates that a participant will continue habitually using power when there is no motivation to change.
Figure 22. Hourly Impact; Seasonal TOU with CPP; Summer Shoulder Weekdays
4
5
6
7
8
9
10
11
12
13
14
0.4
0.6
0.8
1
1.2
1.4
1.6
1 2 3 4 5 6 7 8 9 10 11 12 13 14 15 16 17 18 19 20 21 22 23 24
Cent
s/kW
h
kWh/
hr
Hour of the day
post_weekday pre_weekday TOU SeasonalCPP

53 © 2019 Publicis.Sapient. All rights reserved.
TOU Super-Peak Treatment
During the summer shoulder season, the Super-Peak TOU Treatment provides a simple and easy-to-follow 12-hour peak and 12-hour Off-peak hours split plan. Figure 23 illustrates the average usage impacts among all pilot participants. We do not see a significant change in energy consumption regardless of the price differences. Figure 24 shows the average usage impacts among pilot participants who downloaded the app. We do see a slight reduction of energy consumption during the on-peak hours among the app user segment, despite the price is lower under the Super-Peak TOU price plan. Moreover, we also see a slight increase in energy consumption during the off-peak period.
Figure 23. Hourly Impact; Super-Peak TOU; All Participants; Summer Shoulder Weekdays
Figure 24. Hourly Impact; Super-Peak; Digitally Engaged Participants; Summer Shoulder Weekdays
4567891011121314
0.4
0.6
0.8
1
1.2
1.4
1.6
1 2 3 4 5 6 7 8 9 10 11 12 13 14 15 16 17 18 19 20 21 22 23 24
Cent
s/kW
h
kWh/
hr
Hour of the day
post_weekday pre_weekday TOU SuperPeak
4
5
6
7
8
9
10
11
12
13
14
0.4
0.6
0.8
1
1.2
1.4
1.6
1 2 3 4 5 6 7 8 9 10 11 12 13 14 15 16 17 18 19 20 21 22 23 24
Cent
s/kW
h
kWh/
hr
Hour of the day
post_weekday pre_weekday TOU SuperPeak

54 © 2019 Publicis.Sapient. All rights reserved.
Information Only Treatment
Similar to the summer season, we observe a similar increase in energy consumption during the Off-peak hours. Figure 25 shows the hourly impact for the Information Only treatment group on weekdays. Compared with other pricing treatments, the Information Only treatment group does not show a reduction of energy during peak hours. Instead, we observed a much-pronounced rise in energy consumption during the off-peak hours.
Figure 25. Hourly Impact; Information Only; Summer Shoulder Weekday
4
5
6
7
8
9
10
11
12
13
14
0.4
0.6
0.8
1
1.2
1.4
1.6
1 2 3 4 5 6 7 8 9 10 11 12 13 14 15 16 17 18 19 20 21 22 23 24
Cent
s/kW
h
kWh/
hr
Hour of the day
post_weekday pre_weekday TOU

55 © 2019 Publicis.Sapient. All rights reserved.
Price Elasticity Analysis
Own Price Elasticity
The aggregated own price elasticity measures how customers’ daily energy consumption may change due to the change of average unit price per kWh. Table 25 shows the price elasticity estimated across each treatment: as the daily electricity rate increases, the energy consumption decreases. From the table, we observe that the price elasticity of seasonal TOU with CPP plan is much larger in magnitude. We suspect this might be correlated to the higher pricing point during the CPP hours and the high digital engagement in the opt-in group.
Table 25. Price Elasticity Estimated Across Different Treatments
TREATMENT GROUP PRICE ELASTICITY UPPER BOUND LOWER BOUND
SEASONAL TOU WITH CPP -0.1730 -0.1500 -0.1961
TOU SUPER-PEAK -0.0456 -0.0334 -0.0578
Elasticity of Substitution
The table below shows the elasticity of substitution for Super-Peak TOU and Seasonal TOU with CPP plans. Each row has the elasticity between each pair of TOU periods for each treatment. These paring substitutions are according to the EM&V directions of the OEB and demonstrate that with bigger price gaps, the substitution effect is greater.
Based on our analysis, the elasticity of substitution is statistically insignificant for the Super-Peak TOU plan in both summer season and summer shoulder season. However, the analysis shows a negative elasticity of substitution for Seasonal TOU with CPP plan. This indicates that as the price ratio between the on-peak and off-peak periods increase, the relative hourly energy consumption ratio between the on-peak and off-peak periods decrease.
Table 26. Elasticity of Substitution for Super-Peak TOU and Seasonal TOU with CPP Plans
SEASON TREATMENT
GROUP PRICING PERIODS
ELASTICITY OF SUBSTITUTION
LOWER BOUND
UPPER BOUND
STATISTICALLY SIGNIFICANT
SUMMER SEASONAL TOU
WITH CPP CPP Vs.
OVERNIGHT OFF-PEAK -0.2969 -0.3346 -0.2593 YES
SUMMER SEASONAL TOU
WITH CPP ON-PEAK Vs.
OVERNIGHT OFF-PEAK -0.1391 -0.1784 -0.0998 YES
SUMMER SUPER-PEAK TOU SUPER-PEAK Vs.
OVERNIGHT OFF-PEAK -0.0081 -0.0170 0.0007 NO
SUMMER SHOULDER
SUPER-PEAK TOU ON-PEAK Vs.
OVERNIGHT OFF-PEAK 0.0358 -0.0040 0.0756 NO

56 © 2019 Publicis.Sapient. All rights reserved.
Digital Impact
This pilot provided an information treatment that was available to all participants. For the Information Only treatment group, this was the only benefit and remained on the standard TOU pricing. The information treatment consisted of the digital engagement tools, which included the Peak mobile app and web portal along with a platform that provided analytics to optimize the potential for the participants to take conservation action. This treatment is a journey that each participant is taking over the course of one year.
The figure above presents an overview of how participant data is combined with logic and participant responses to provide custom recommendation and drive conservation. The journey begins at a course level, with large groups going through the same experience with messages and using the Peak app. Over time the system learns and adapts to the user via characteristics of their home and the moments that best attract their attention. At a high level, this journey is a repetition of the following steps. First, identify clusters of participants to whom a conservation strategy would apply. Algorithms develop the clusters based on “why a particular conservation strategy would be beneficial.” Second, the system identifies the right channel and time to present this strategy. Finally, the system presents content that articulates why this specific strategy is relevant, inviting and encouraging to an individual. This process builds knowledge of the customer based on their responsiveness and educates the customer about conservation behaviour. Each time a participant takes another step in the journey, it gets more relevant and more unique to that individual.
Matching Conservation Strategies with Individuals
Conservation strategies have attributes that can be aligned with participants. These attributes are cost, savings, effort and category. Cost is defined as the potential expense for the customer (filter criteria : Free, below $10, Above $10). Savings is the timeline to savings on the bill (filter criteria : Immediate, Gradual). Effort is the effort required by the participant to accomplish the tasks (filter criteria : Low, Medium, High). Category is the nature of upgrade (filter criteria : One time, Recurring) respectively. Please refer Peak App Screenshots for relevant reference. Each individual has dozens of potential attributes. The algorithms that drive the campaigns and the Peak application match the conservation strategies with the individuals. These campaigns are prioritized based on events, time of year, impact, cost and effort. Early in the pilot, high-impact summer strategies were the first campaigns initialized. As the pilot progressed, each individual built his or her profile, and the available strategies self-optimized for that individual.
Figure 26. Publicis Sapient’ s Engagement Model

57 © 2019 Publicis.Sapient. All rights reserved.
The Peak app uses user and home attributes to match participants with strategies. These attributes are based on data from Oshawa Power, third-party sources and user responses to questions. In the first six months, 116 questions were asked of participants to develop their profile. Sample questions include “What temperature do you set your thermostat in the summer?” and “Do you clean your outside AC unit?”
Figure 27. Conservation Strategy Categorization
The above figure shows the distribution of conservation strategies programmed in Peak App based on cost savings, effort and category. The innermost circle represents the category, the circle after that represents cost, the next circle represents effort and the outermost circle represents savings.
All these strategies were further categorized into summer months, winter months and all-season strategies. The pilot has been able to deliver 68 different targeted campaigns based on individual profiles. At the start of the pilot, these campaigns focused on large clusters of participants for high-impact summer strategies such as “Close blinds on sun-facing windows.” As the pilot progressed, individuals received more targeted campaigns such as promoting the Ontario Electricity Support Program, aimed at high-probability low-income individuals and people who have outstanding bill amounts. The Save on Energy Heating & Cooling Program campaign targeted high-usage participants and homeowners with old AC or heating units.
The impact and relevance of strategies for individuals are further tuned by disaggregating usage into load profiles. These profiles aligned users to strategy groups such as AC and temperature management, high-usage appliances for maintenance and Energy Star ratings, and lighting profiles during the winter months.
Driving Engagement

58 © 2019 Publicis.Sapient. All rights reserved.
Making digital channels easy to understand and rewarding to use drives engagement. The Peak app shows relevant information when the participant can consume it. Optimal times were regularly reviewed and set according to shifting patterns. By driving to the right actions, we can measure engagement and then ultimately measure impact.
The application delivers an encouraging and personalized experience to keep participants engaged and conserving energy. The personalized experience is through:
1. Gamification: Showing how someone ranks against peers and how to accumulate achievement badges 2. Today Drawer: Highly relevant information for today, including top strategies that the user saved 3. Strategy Browsing: Ability to browse conservation strategies that are relevant to the user
Participants increasingly created highly personal experiences within the pilot by choosing any combination of communication channels: email, SMS, push notifications and within-app messaging. Based on participant preferences, specific targeted campaigns drove emails and in app messaging at a regular cadence. These campaigns contained specific messaging, personalized strategies and weekly summaries of their usage, progress on conservation and achievements and rankings in the app and compared to peer groups. Further highlighting the special experience are animated backdrops that rotate with the season and even a night mode to make it easier to read and spend time browsing.
Measuring Results
Results were measured based on energy savings (kWh) and the number of users engaged in specific actions. The Peak app records several interaction measurements for specific recommended conservation strategies. Two key metrics are who viewed the strategy within the app and who marked the strategy as completed. A sample of engagement by category is below.
Table 27. Strategy Engagement
# OF USERS ENGAGED STRATEGY CATEGORY EFFORT COST SAVINGS
1,198 APPLIANCE LOW FREE GRADUAL
645 APPLIANCE HIGH ABOVE $10 IMMEDIATE
529 COOLING LOW FREE GRADUAL
474 APPLIANCE LOW FREE IMMEDIATE
233 HEATING LOW FREE GRADUAL
188 ELECTRIC LOW UNDER $10 IMMEDIATE
186 ELECTRIC LOW ABOVE $10 GRADUAL
154 HEATING MEDIUM ABOVE $10 GRADUAL
149 COOLING MEDIUM FREE IMMEDIATE
112 ELECTRIC MEDIUM ABOVE $10 GRADUAL
More detailed statistics about communication channels and application features used can be found later in this section. These statistics show shifting user engagement as the pilot progresses. The final report will analyze the full set of data to determine the importance of the data collected.

59 © 2019 Publicis.Sapient. All rights reserved.
Peak App
All the participants in the pilot program have access to enhanced information using different digital and traditional channels, as mentioned above. The two most innovative communication channels tested through this pilot’s approach are the Peak app and Peak web portal. As described above, the pilot delivered messaging and information that encouraged participants to use the app and portal to understand further how they can make conservation and budget decisions when using electricity. For participants that do not have access to the Peak app, the Peak web portal has equivalent functionality, but naturally does not allow for the same variation in notification as the Peak app.
Figure 28. Peak App Screenshots
The key features of the Peak app/web portal are (refer to Peak App Screenshots section)
• Home Screen o Bold messaging to scold or reward an individual for previous day’s usage. o Asking quick questions to gather additional awareness, behaviour or household data o Easy access to personalized high-impact information:
Two key savings strategies – easy to digest and remember Weather forecast advice – what will work the best today TOU price right now – Showing how much they are paying right now Leaderboard – Entice them to compete with other participants on conserving Achievements – Badges to celebrate the effort to conserve electricity
o One-touch access to profile settings, messaging, usage analysis, billing, savings and help o Easy access to Message Center – inbox for the Peak app
• Usage o Daily, weekly and monthly usage and costs with TOU breakdown o Gamification with a peer-based leaderboard o Highlights high-usage hour of the day and day of the week o Comparison of energy used against the average

60 © 2019 Publicis.Sapient. All rights reserved.
• Billing o Summary and detailed bill for the month, with TOU breakdown o Ability to download actual bill PDF o “Did you know” and “Heads up” cards to provide education and tips
• Save o Enable engaged users to investigate ways to save, with an entire catalog of savings strategies and
learning articles o Save or mark strategies as complete, lifting additional relevant strategies to their attention o Facility to filter saving strategies based on strategy type (one time, recurring), savings (immediate,
gradual), cost and effort. • Help
o Listing top question asked amongst peers o The FAQ on the pilot program, bill and payments help, pilot support, administrative help, Peak app
help and other help topics
A detailed branding exercise determined how to present the content in the most appealing, user-friendly way that would also encourage persistent use of the tools. The resulting brand identity focuses on friendliness, encouragement and accessibility. To achieve this brand identity, the pilot project wrote and visually styled the application and communications to be both casual and motivational, ensuring participants are never made to feel guilty about their energy usage. Presentation of content is in stratified layers so that participants are never overwhelmed but can easily access increasing layers of information if a topic peaks interest. Participants are equally able to personalize content in the app, allowing them to cutout strategies that are not applicable. A significant amount of design experience to remove the complexities of energy usage created an overall effect that is a fun, highly relevant and usable set of digital tools.
The participants received messaging from multiple channels to create behavioural shifts that reduced energy consumption. These communication channels also kept participants engaged in the pilot program. The communication/messaging channels included emails, push notifications, in-app alerts, app inbox and SMS notifications. The monitoring and measurement of each message’s interest to the participant drove the preferred channel and timing. Pre-pilot inputs defined the initial communications delivered and then adapted based on engagement and preferences set within the application. The message communicated during the first six months are described below:
• Pre-planned Communications (one month in advance) o Weekly usage summary emails o Behavioural messaging through Peak app
Ways to save tips Targeted messaging
o Promotion of various active programs of the Ontario government o Communicate special days like Canada Day, Christmas, New Year and others o Pilot events and price change reminders o CPP communications
• Ad-hoc progressive communications o Pilot events and price change reminders o CPP communications o Weekly usage summary reminders

61 © 2019 Publicis.Sapient. All rights reserved.
The digital population figure below shows that the opt-in plans (Information Only and Seasonal TOU with CPP) have a higher amount of peak app downloads. This is a strong indicator that people in the opt-in treatments have a stronger desire to understand their energy consumption and bills through apps or email.
Figure 29. Digital Population in Different Treatment Groups
Peak App Usage
A selection of Peak app usage statistics are presented below. Many of the statistics enclosed here are also included in Appendix C Hourly Impact. A summary of the hourly analysis is:
• The usage page of the Peak app has been the most visited page. People have visited it 30 – 35% of the visits in a month. The users have consistently demonstrated the behaviour to check electricity usage.
• The home page is the second most visited page and consistently receives between 20 to 25% of the visits. The home page shows an electricity usage comparison summary and energy conservation tips. In May of 2018, the home page received 33% of visits to the app. This higher percentage in May is likely due to the launch of Peak app
• The message center has shown a progressive increase in visits by users, from 4.67% usage in May and increasing to 15.5% of the visits in October. The increase in visits to the message center demonstrate the effectiveness of the Peak engagement communication through the Peak app.
• Users visited the bill page almost 10% of the time. The “bill ready” messages and emails sent to the users’ mailboxes contain a link to the bill page, which drives them to look at the details of their monthly bill.
• The help page usage has shown a downward curve from May to October, indicating that users have more control now over the use of Peak app and have fewer queries.
• The use of the Saving Strategies feature is consistent at 8% to 9% of the time. However, there was a minor increase in visits over the first half of the pilot. Users are probably reading and either completing or disregarding the saving strategies.
• Users started visiting the Today's Drawer approximately 5% of the time starting in July.
Digital Programs
90
311
75
358
262
419
0
50
100
150
200
250
300
350
400
450
Seasonal TOU with CPP TOU Super-Peak Information Only
Email Users Digitally Engaged Participants

62 © 2019 Publicis.Sapient. All rights reserved.
Highlighted in this section are a few of the types of communication that participants in this pilot have progressively received.
Campaign Calendar: The pilot has a sophisticated campaign engine that delivered over 60 relevant campaigns to various participant groups via their preferred channels. Refer to Appendix I
Ontario Energy Programs: The pilot introduced various programs to qualifying participants by grouping them according to the eligibility criteria of the programs. This app sent digital communications to LMI participants about the Ontario Electricity Support Program and the Low-Income Energy Assistance Program (LEAP). Additionally, 350 – 400 participants with an outstanding balance on their bill received similar communications about these programs. Home Winter Proofing and Save on Energy Heating and Cooling programs were communicated only to participants who are high-usage customers living in a single-family house built before 2000. The Peak app would have sent information regarding other programs like Deal Days, Save on Energy Smart Thermostat and Affordability Fund Trust to specific groups at the appropriate time.
Weekly Email: The pilot sent out a weekly email with information relevant to the past week's achievements and upcoming events. Weekly emails are a way of summarizing weekly usage for a participant and keeping the morale on energy conservation high. These emails provide relevant conservation tips for the coming week-plus gamification to increase the motivation. Weekly emails go out every Tuesday at 7 a.m. A week’s usage ends on Sunday and is available on Monday; therefore, the app creates and sends the weekly emails on Tuesday. The most active participants read these emails shortly after 7 a.m. during the summer months. This active period changed to 10 a.m. during the winter months, and the production schedule changed to maintain a high open rate.
We have observed that weekly email open rates start at 55% and decline to 10% after two days. After two days, we can boost the open rate by 7% with an SMS reminder. As shown in the figure below, the weekly recap emails are opened at least 50% of the time across the months by the participants irrespective of the use of the digital tools.
Figure 30. Weekly Recap Open Rate
Ways to Save Push Messages: The pilot sent push messages to participants which demonstrated engagement through this mechanism. Ways to Save push messages are scheduled and targeted to relevant participants throughout the pilot program. As an example, a push message around air conditioner maintenance has gone out to only those who have air conditioning. Also, the messaging engine of the app determines and delivers suggestions

63 © 2019 Publicis.Sapient. All rights reserved.
through Peak App/Web portal on expensive appliance upgrades only for participants who own their house/unit and are not part of the LMI group.
On average, the app targets and publishes two push messages to pilot participants each week through Peak App/Web portal. The time of year and the participant’s active time of day determines the schedule for the push message.
Gamification: The participants are awarded ranking based on daily, weekly and monthly consumption within a similar peer group which can be tracked on Peak App/Web portal. The algorithms run on the app determines each peer group based on geography, usage and bill amount. The Peak app/Web portal highlights a participant’s rank on multiple screens to drive motivation in competitive participants. The app calculates, and Peak App/Web portal highlights the lifetime stats, and the Peak app highlights total energy savings to date, best month according to usage and many more key indicators. The Peak app displays these statistics to drive energy interest, pilot engagement and increased conservation. The participants are awarded achievement badges for attained milestones. The achievement engine identifies up to 10 badges and awards them for a particular milestone achievement by a participant individually. Push messages for gamification are teasers to drive conservation and education.

64 © 2019 Publicis.Sapient. All rights reserved.
Examples of the required milestones and badges awarded to the participants in the Peak App are shown below.
Table 28. Badges and milestone to achieve
BADGE NAME MILESTONE ACHIEVED
ELECTRIC STAR • Participant is part of Top 10% energy savers in the peer group.
LOAD SHIFT LEADER • Participant is in 50% of the top load shifters.
ENERGY INTEREST • Participant is Active using application • Participant opens the app at-least once a week and scans through different
screens specially usage summary and details and section.
ENERGY CONSERVER • Participant's energy usage is statistically lower for 10 consecutive days.
All the participants within each segment groups were awarded ranks on the leaderboard based on how they have performed w.r.t the energy conservation and $ save. Users of the Peak app obtained more top rankings on it compared to non-Digitally Engaged Participants, demonstrating the effectiveness of the Peak app as a communication tool to make participants more energy conscious. Depending on the badge, top ranking can be defined as participant, kWh change, or $ change.
Figure 31. Gamification Ranks Achieved by Digitally Engaged Participants vs. Non-Digitally Engaged Participants
Holidays: All participants are provided with communication around the holidays and relevant energy tips for conserving during the high-usage times due to a gathering or family events.
Learning Articles: Multiple learning articles about energy use, the definition of TOU rates, the importance of Energy Star rated appliances, etc. Learning articles are recommended to participants based on their energy usage profile and help raise the education level of participants.
Personal Profile: The Profile Builder asks participants questions to increase the knowledge about the person and the home.
0%
10%
20%
30%
40%
50%
60%
70%
80%
1 2 3 4 5 6 7 8 9 10 11 12 13 14 15 16 17 18 19 20
% ti
mes
rank
was
ach
ieve
d
Leaderboard RanksUse PEAK APP Do not use PEAK APP

65 © 2019 Publicis.Sapient. All rights reserved.
Strategies: Education content is planned for specific groups to raise their awareness of energy conservation and the costs and impacts of electricity generation. These strategies are customized for participants based on their individual and their home’s characteristics. These strategies contain specific actions that they can take to conserve energy or load shift.
Weather Based Tips: Participants with the Peak app had access to weather card, which is a conservation tip based on the weather at the postal code of each participant. Customized energy tips are provided on the home page and have a link to a corresponding way to save. This tip changes according to the type of energy usage pattern of every participant. For example, if the home does not appear to have air conditioning, they will not receive air conditioning tips. The Today’s Drawer highlights weather-sensitive saving strategies for the users.
CPP Events: The CPP pilot group has a unique communication plan. Each participant received a message at 2:00 p.m. on all channels the day ahead of an event. The broad communication approach was to ensure that at least one of the messages was received. Another blast communication occurs at 7:00 a.m. the day of the event, to remind people to consider the CPP event before starting their day, including some tips for reducing consumption. At 3:30 p.m., participants would get an additional conservation message via the quick delivery channels: push messaging, SMS and Peak app message. Finally, a push notification would go out at 8:00 p.m., informing them that the event is over.
Below graph shows the CPP event emails sent out to seasonal TOU with CPP participants across the summer months.
Figure 33. Summer Months CPP Email Statistics
2:00PM
App Inbox message informing CPP tomorrow 3:00PM
Email, Push Notification and SMS informing CPP
7:00AM
Email informing CPP today 3:30PM
App Inbox message, Push Notification and SMS informing CPP starts at 4:00 PM
4:00PM
8:00PM
CPP
Push Notification informing end of CPP
CPP Event DAY (n) Pre-CPP DAY (n-1)
Figure 32 Typical timeline CPP event day in Seasonal TOU with CPP plan
299
1779
1497
124
14231332
3 14 3
Jun Jul Aug
No
of e
mai
ls
Email delivered and opened Email delivered to mailbox Email bounced

66 © 2019 Publicis.Sapient. All rights reserved.
Information Treatment
Providing information, especially through the Peak app, is key for effective participant engagement. One disadvantage of the traditional time-of-use pricing is the high complexity of the tariff structure that makes it difficult for customers to adjust their energy consumption behaviours. In the Information Only treatment, we examine whether providing information alone may help customers understand the TOU structure in a more intuitive way and guide them to make decisions based on electricity price throughout the day.
According to Table 24, the Information Only treatment has demonstrated a statistically significant rise in energy consumption during Off-peak hours. This increased consumption during the Off-peak hours suggests that before the Information Only pilot, customers were not fully aware of the low energy price at night and thus failed to take advantage of the time-of-use price signal. This demonstrates that information can help change consumers usage profile by informing them of the best time to consume energy. Customers appear to be responding to an improved understanding of the low TOU price structure and the lower costs during Off-peak hours.
To highlight the impact of the Peak app, we provide a side-by-side impact comparison of All Participants vs Digitally Engaged Participants for each treatment7. The group of Digitally Engaged Participants is a subgroup of the All Participants group. As a result, the two groups are not independent groups. For example, in Table 29. Summer Digital Impact as of Aug 31st, 2018 the 506 All Participants of the information treatment pilot includes the 426 Digitally Engaged. The table shows that the information through the Peak app increase participants’ energy price response. The combination of pricing and an information treatment through the Peak app was the most effective way to reshape customers’ energy consumption behaviour.
The app download rate is important because the Peak app plays a critical role in reshaping customers’ energy consumption behaviour. We will show the impact of the Peak app by comparing the behaviour of the Digitally Engaged Participants vs. total participants.
7 We are unable to construct confidence intervals in this case because we are comparing the total population with a subset of it, which introduces correlation.
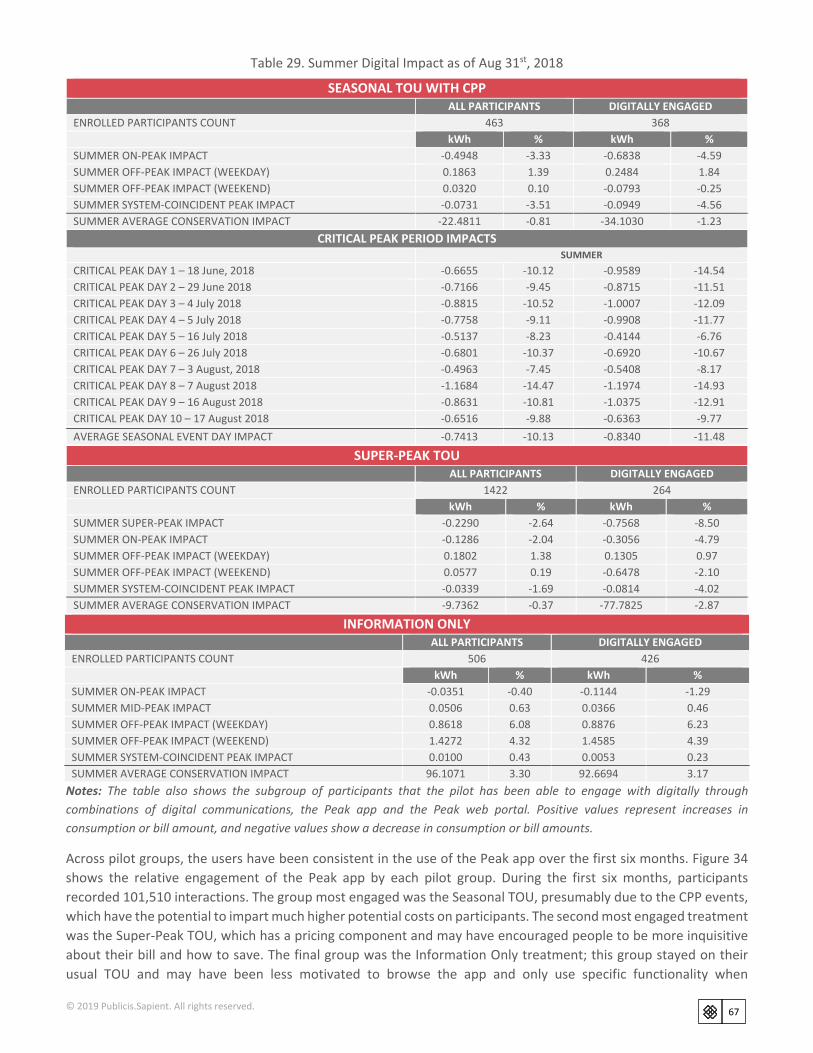
67 © 2019 Publicis.Sapient. All rights reserved.
Table 29. Summer Digital Impact as of Aug 31st, 2018
INFORMATION ONLY ALL PARTICIPANTS DIGITALLY ENGAGED ENROLLED PARTICIPANTS COUNT 506 426 kWh % kWh % SUMMER ON-PEAK IMPACT -0.0351 -0.40 -0.1144 -1.29 SUMMER MID-PEAK IMPACT 0.0506 0.63 0.0366 0.46 SUMMER OFF-PEAK IMPACT (WEEKDAY) 0.8618 6.08 0.8876 6.23 SUMMER OFF-PEAK IMPACT (WEEKEND) 1.4272 4.32 1.4585 4.39 SUMMER SYSTEM-COINCIDENT PEAK IMPACT 0.0100 0.43 0.0053 0.23 SUMMER AVERAGE CONSERVATION IMPACT 96.1071 3.30 92.6694 3.17
Notes: The table also shows the subgroup of participants that the pilot has been able to engage with digitally through combinations of digital communications, the Peak app and the Peak web portal. Positive values represent increases in consumption or bill amount, and negative values show a decrease in consumption or bill amounts.
Across pilot groups, the users have been consistent in the use of the Peak app over the first six months. Figure 34 shows the relative engagement of the Peak app by each pilot group. During the first six months, participants recorded 101,510 interactions. The group most engaged was the Seasonal TOU, presumably due to the CPP events, which have the potential to impart much higher potential costs on participants. The second most engaged treatment was the Super-Peak TOU, which has a pricing component and may have encouraged people to be more inquisitive about their bill and how to save. The final group was the Information Only treatment; this group stayed on their usual TOU and may have been less motivated to browse the app and only use specific functionality when
SEASONAL TOU WITH CPP ALL PARTICIPANTS DIGITALLY ENGAGED
ENROLLED PARTICIPANTS COUNT 463 368 kWh % kWh %
SUMMER ON-PEAK IMPACT -0.4948 -3.33 -0.6838 -4.59 SUMMER OFF-PEAK IMPACT (WEEKDAY) 0.1863 1.39 0.2484 1.84 SUMMER OFF-PEAK IMPACT (WEEKEND) 0.0320 0.10 -0.0793 -0.25 SUMMER SYSTEM-COINCIDENT PEAK IMPACT -0.0731 -3.51 -0.0949 -4.56 SUMMER AVERAGE CONSERVATION IMPACT -22.4811 -0.81 -34.1030 -1.23
CRITICAL PEAK PERIOD IMPACTS SUMMER
CRITICAL PEAK DAY 1 – 18 June, 2018 -0.6655 -10.12 -0.9589 -14.54 CRITICAL PEAK DAY 2 – 29 June 2018 -0.7166 -9.45 -0.8715 -11.51 CRITICAL PEAK DAY 3 – 4 July 2018 -0.8815 -10.52 -1.0007 -12.09 CRITICAL PEAK DAY 4 – 5 July 2018 -0.7758 -9.11 -0.9908 -11.77 CRITICAL PEAK DAY 5 – 16 July 2018 -0.5137 -8.23 -0.4144 -6.76 CRITICAL PEAK DAY 6 – 26 July 2018 -0.6801 -10.37 -0.6920 -10.67 CRITICAL PEAK DAY 7 – 3 August, 2018 -0.4963 -7.45 -0.5408 -8.17 CRITICAL PEAK DAY 8 – 7 August 2018 -1.1684 -14.47 -1.1974 -14.93 CRITICAL PEAK DAY 9 – 16 August 2018 -0.8631 -10.81 -1.0375 -12.91 CRITICAL PEAK DAY 10 – 17 August 2018 -0.6516 -9.88 -0.6363 -9.77 AVERAGE SEASONAL EVENT DAY IMPACT -0.7413 -10.13 -0.8340 -11.48
SUPER-PEAK TOU ALL PARTICIPANTS DIGITALLY ENGAGED
ENROLLED PARTICIPANTS COUNT 1422 264 kWh % kWh %
SUMMER SUPER-PEAK IMPACT -0.2290 -2.64 -0.7568 -8.50 SUMMER ON-PEAK IMPACT -0.1286 -2.04 -0.3056 -4.79 SUMMER OFF-PEAK IMPACT (WEEKDAY) 0.1802 1.38 0.1305 0.97 SUMMER OFF-PEAK IMPACT (WEEKEND) 0.0577 0.19 -0.6478 -2.10 SUMMER SYSTEM-COINCIDENT PEAK IMPACT -0.0339 -1.69 -0.0814 -4.02 SUMMER AVERAGE CONSERVATION IMPACT -9.7362 -0.37 -77.7825 -2.87

68 © 2019 Publicis.Sapient. All rights reserved.
encouraged. Interestingly, this treatment group shows signs of increasing digital engagement after six months. Further analysis of this trend will be available in the final report.
Figure 34. Digital Engagement Ratio Between Pilot Groups
All forms of communication are informed by the usage analysis, on each participants’ most active day of the week and the most active time of day.
Figure 35 depicts the shifting time of day patterns when users accessed the Peak app across six months.
• In May, most of the participants used the Peak app on Tuesdays. In June, in addition to Tuesdays most of the Peak app logins were observed on Fridays.
• In July, most of the Peak app logins were back to being on Tuesdays, with August showing a complete shift to Thursdays recording the highest number of logins.
• In October, there is a more uniform pattern seen except for Fridays, when usage is at its lowest. • The weekend usage has shown an upward trend across months showing the increasing effectiveness of Peak
engagement communications sent on Saturdays and Sundays.
We can see the following behavioural patterns after analyzing the use of the Peak App according to participant’s age and daily activity for the first six months of the pilot (see Figure 72).
• During August, a change in the preferred day to use the Peak app occurred in all age groups. All age groups (except 18–24) were using the Peak app most on Thursdays. Those 18–24 years old shifted to Wednesdays and demonstrated a jump of 15% in accessing the Peak app from the previous month.
• As shown in Figure 77 & Table 38, three quarters of the pilot participants are between the age of 25 to 54 and one third of the total population are between 25 to 34.
• Table 38 shows that the age distributions are similar across the pilot groups • During the initial months (May and June), Tuesdays remained as the preferred day of Peak app usage. • Peak app usage has increased on weekends in all age groups over the time of six months. • Monday is a slow day for everyone, including Digitally Engaged Participants. Only participants between 55–65
demonstrated a slight preference for Monday, but only in October. • Almost all age groups have shown a stable or upward trend in the use of the Peak app, except for those in the
35–44 age group. • Users in the 24–34 age group have shown a steep rise in the use of the Peak app, from 25% in September to 33%
in October.
18.44% 20.29% 20.21%17.88%
21.07%26.15%
60.40%
52.59%56.27% 55.91%
51.21% 50.24%
21.17%
27.12%23.52%
26.21% 27.72%23.61%
0.00%
10.00%
20.00%
30.00%
40.00%
50.00%
60.00%
70.00%
May June July August September October
Digi
tal E
ngag
emen
t Rat
io
Non-Pricing (500) TOU Seasonal + CPP (500) TOU Super Peak (500)

69 © 2019 Publicis.Sapient. All rights reserved.
The pattern in Figure 35 shows the use of the Peak app during the early hours of the day (between 7:00 a.m. and 10:00 a.m.). The shifted behaviour has helped to determine the time of Peak engagement communications so that energy savings campaigns are more effective.
Figure 35 Peak App Usage by Hour of the Day
0.00%
2.00%
4.00%
6.00%
8.00%
10.00%
12.00%
14.00%
00 01 02 03 04 05 06 07 08 09 10 11 12 13 14 15 16 17 18 19 20 21 22 23
Peak
app
Hour of the dayMay June July August September October

70 © 2019 Publicis.Sapient. All rights reserved.
Survey
At different intervals during the course of this pilot, online surveys collected information about participants including demographics and education levels around energy in Ontario. These surveys create a better understanding of the changes in behaviour, or the adoption of new technologies (e.g., a smart thermostat). Participants also provided information on what equipment they have in their homes, their understanding of electricity pricing and electricity management options, as well as their views on the pilot program.
To date, the pilot has administered two of the three surveys, as per the following timelines.
Table 30. Pilot Surveys Timelines
SURVEY TIMELINE
PRE-PILOT SURVEY APRIL 2018
MID-PILOT SURVEY OCTOBER 2018
POST-PILOT SURVEY MAY 2019
Survey Objectives
In general, the survey responses help with interpreting the data from this pilot. The survey objectives are to:
• Capture attitudes around energy pricing, the peak program and shifting usage
• Understand respondent knowledge of energy usage and pricing
• Find out the motivations behind changing energy usage
• Collect demographics and household characteristics
Survey Participation
The project team reached out to participants using a combination of digital and traditional means to maximize survey participation. Below are the participation numbers achieved for the pre-pilot and mid-pilot survey.
Table 31. Survey Participation Metrics
SURVEY PRE-PILOT SURVEY
COMPLETED % COMPLETED
MID-PILOT SURVEY COMPLETED
% COMPLETED
INFORMATION ONLY 493 96% 247 50%
SEASONAL TOU WITH CPP 395 77% 265 58%
SUPER-PEAK TOU 332 22% 193 15%
TOTAL 1,220 48.41% 705 31.3%

71 © 2019 Publicis.Sapient. All rights reserved.
Pre-Pilot Survey and Mid-Pilot Survey Comparison
A comparison between the pre-pilot and mid-pilot survey results has yielded the following insights regarding changes in behaviour and knowledge over the first six months of the pilot program. Below is a summary of the comparative results.
• Enthusiasm about the Peak Program increased — at the time of the second survey, more than half the people who responded to the survey said the program is helping them better understand the factors that impact electricity costs.
• Participants in the Information Only group are enjoying using the Peak app more than participants in the other groups.
• When it comes to motivations, people are still most interested in learning new ways to conserve energy and, ultimately, lower their electricity bill.
• Respondents have a 10% improved response about the use of a thermostat and setting it correctly to save energy. More specifically, “raising the temperature on your A/C unit during the summer is the most effective way to reduce your electricity bill.”
• More than a 10% improved response about how Ontario purchases and sells electricity to its neighboring provinces and the United States based on its current supply.
• There is an 8% improvement in Super-Peak TOU participants correctly answering that nuclear is the primary source of electric power in Ontario.
• About 15% more agree on whether time-of-use rates are fair.
• Most people still think reducing On-peak demand on the electric grid is the primary goal of this program
When it comes to electricity, people are still most interested in learning how to lower their own electricity bill. More than half are also interested in finding ways to conserve energy and lowering the cost to their community.
% Participants Who Strongly Agree
Information Only Seasonal TOU + CPP Super-Peak TOU
Pre-Pilot
Mid-Pilot
Pre-Pilot
Mid-Pilot
Pre-Pilot
Mid-Pilot
I'm interested in lowering the cost of my own household's electricity bill
91 93 88 98 100 100
I'm interested in learning about different ways to conserve electricity
73 72 57 77 69 69
I'm interested in lowering the cost of electricity to people in my community
61 59 54 63 59 59
I change my electricity usage during the day depending on how much I'm being charged at that particular time
44 49 47 60 62 63
I have a good understanding of the difference between flat pricing and time-of-use pricing
43 44 52 61 62 62
I have a good understanding of how electricity usage impacts the environment
34 41 39 41 47 48

72 © 2019 Publicis.Sapient. All rights reserved.
On the mid-pilot survey, more than half the participants agree that Peak app and the program is helping them save money on their electricity bill. More than 75% participants in Information only group agreed to this.
% Top Box Agreement (Strongly Agree) Information
Only Seasonal TOU
with CPP Summer Super
TOU
The Peak mobile app helps in saving money on my electricity bill 78 74 70
I enjoy participating in the Peak pilot program 90 79 79
The program is helping me better understand the factors that impact electricity costs
79 85 88
The program is helping me save money on my electricity bill 76 80 85
The program is worth my time and effort 78 82 79
Issues
The issues identified through the mid-pilot analysis were data related and identified in the data section of this document.
73 © 2019 Publicis.Sapient. All rights reserved.
Conclusion Preliminary Results Recap
In the first six months, there has been interesting observations in the pilot. The Seasonal CPP pilot group demonstrated an average of over 10% reduction in consumption across the CPP events and load shifting occurred for all pilot groups from during on-peak to off-peak periods. Participants that elected to use the mobile app are highly engaged. Also, their impact and engagement demonstrated how an analytics-driven Peak app dramatically improves the understanding and use of electricity. The voluntary participation of the CPP program with hassle-free digital communications has also shown to be an effective method of reducing peak period usage.
The pilot program is delivering on the pilot objectives and has measured high impact results during the first six months. Data gathered is beginning to show that the Peak app has played a pivotal role resulting in energy conservation.
This six-month report shows that pricing treatments are more effective when implemented with the help of an analytics-driven mobile application. The numbers from Super-Peak TOU group show a greater reduction in usage when using the Peak app than without the app. The final report will have more meaningful results for this treatment group, as it will benefit from an entire year of data.
The table below summarizes the interim dollar and usage impacts, covering the summer and summer shoulder months, where “All Participants” refers to all enrolled customers under each treatment and “Digitally Engaged Participants” refers to customers who downloaded the Peak app among “All Participants” within a given treatement group. The results are presented in both dollar and usage (kWh) for each of the three treatment groups. The table also shows the Digitally Engaged Participants subgroup. These results are for the period from May to October 2019 and are in comparison to the control groups.
1. Seasonal TOU with Critical Peak Pricing (CPP) (opt-in) – The Seasonal TOU demonstrated the greatest kWh savings and were the only treatment group that reduced their bills. Digitally Engaged Participants reduced their consumption two times more than All Participants within this treatment, or 1.66% reduction vs. a 0.78% reduction. This suggests that alternate price structures in connection with additional information and digital engagement can result in lower usage and bills.
2. Super-Peak TOU (opt-out) – Within the Super-Peak TOU treatment, both the All Participants and Digitally Engaged Participants saw an increase in their bills; however, the Digitally Engaged Participants did reduce their consumption, which demonstrates the benefits of the Peak app. This subgroup managed to reduce their consumption, resulting in a smaller bill increases relative to All Participants with the Super-Peak TOU treatment group.
3. Information Only (opt-in) – The Information Only group had the highest increase in kWh consumption yet still experienced only modest gain in costs. This result may be related to a better understanding of the TOU price structure that led to increased usage during lower-cost periods.

74 © 2019 Publicis.Sapient. All rights reserved.
Table 32. Interim price and non-price impact
SIX-MONTH IMPACT MONTHLY TOTAL BILL IMPACT MONTHLY USAGE IMPACT
$ % kWh %
SEASONAL TOU WITH CPP (Opt-in) All Participants -0.55 -0.50 -4.93 -0.61 Digitally Engaged Participants -1.40 -1.28 -11.57 -1.42
SUPER-PEAK TOU (Opt-out) All Participants 8.19 7.76 -0.52 -0.07 Digitally Engaged Participants 6.63 6.23 -9.87 -1.25
INFORMATION ONLY (Opt-in) All Participants 2.69 2.37 27.60 3.25 Digitally Engaged Participants 2.86 2.51 29.54 3.46
The Information Only group has shown that information treatment has enabled participants to use more energy due to a better understanding of TOU pricing and its bill impact. They have utilized energy when it is cheaper during the day causing a marginal increase in the monthly bill.
In the first six months, the pilot has already demonstrated the benefits of this type of outreach and engagement. Some pilot highlights in the first six months are:
1. Seasonal TOU with CPP: Critical Peak Pricing demonstrated a 10% average reduction in consumption during the CPP hours for the summer months. Also, we see a reduction in peak period usage of more than 3%. Participants who leveraged the Peak app showed over 2x higher reduction in consumption during the summer than those who did not.
2. Super-Peak TOU: This treatment group load shifted, but increased usage and bills. Only the digitally engaged participants both load shifted and conserved energy compared with the control group. We expect the average monthly bills to drop further with the lower non-summer rates.
3. Information Only: This group had the highest engagement and demonstrated the most sophisticated understanding of when to use electricity. During the first six months of the pilot, they flattened their load profile, leveraging the lowest cost period.
4. Low and Middle Income (LMI) participants showed an increase in consumption within the opt-in groups and a decrease within the opt-out group. An attempt to corroborate the self-reported LMI data will be part of the final report analysis.
5. Participants in older houses have shown higher conservation or lower increases than those in newer houses. 6. High-energy users, who are the top 10% energy users, have stood out by showing consistent conservation
across pricing groups and the lowest increase in energy consumption for participants in the information-only group.
7. The mid-pilot survey, given after the first six months, has shown an increase in knowledge with every question as compared to the start of pilot survey, such as a better understanding on how to use a smart thermostat to conserve energy and an increase in respondents believing that TOU pricing was fair.
8. Email outreach yielded faster and more effective results to both recruit people into the pilot and educate them about the benefits of participating in the information treatment.
9. Over 80% of the opt-in groups were actively using the mobile application, and almost 50% of the opt-out group was digitally engaged.
Oshawa Power’s RPP Pilot leverages various communication channels to create an impact on participant load shifting and conservation behaviour. The pilot algorithms analyze participant interactions with each communication and channel over time, to optimize messaging that drives conservation behaviours.

75 © 2019 Publicis.Sapient. All rights reserved.
As a result, the pilot has observed which channels have been more successful with individuals as well as the day-of-week and time-of-day participants are most receptive to pilot communications. Through these learnings, the pilot has also adapted different follow-up measures to drive pilot engagement on preferred channels. The Peak app has also been instrumental in measuring both initial engagement and response to messaging. The Peak app has also been an effective medium for any quick, actionable communication outreach to targeted customers.
Through the first six months (May 2018 through October 2018, inclusive) of the pilot program, measurements show a change in usage due to the pilot. Some pricing treatment participants who adopted the Peak app doubled the conservation and dollar impacts as compared with participants who have not opted to use the app. The app is acting as an instrument to convey knowledge of TOU pricing impacts and enable people to behave more effectively with the new pricing plans.
The pilot team is using these results to create improvements within the Peak app like, targeted communication by creating peer groups based on various factors which include Peak app behavioural study, gamification results, survey inputs, participant’s demographics to list a few. Accessibility to government launched programs like AFT, free weather proofing programs, notifications to users to use saving strategies through Peak app, linking Learning articles through app push notifications and messages in the message centre, profile questions, peer-to-peer comparison through rankings (leader board). These improvements should allow for increased effectiveness going into the winter season.

76 © 2019 Publicis.Sapient. All rights reserved.
Insights and Discussion
An analysis of the data provides three key insights into participant behaviour.
• Seasonal TOU with CPP – First six-months results demonstrates that the Seasonal TOU with CPP group achieved higher total energy conservation during the summer season (when critical pricing is in effect). Moreover, each CPP event has an average load reduction of 10% among enrolled customers. The analysis does not show any significant load-shift effect across any period. Instead, participants simply conserved their energy consumption. The strength of this effect likely comes from the interaction of the strong pricing signal with the use of the Peak app, which coaches’ customers through CPP events.
• Super-Peak TOU – First six-months results demonstrate that the Super-Peak TOU pricing plan has a modest effect on customer behaviour. The effect might be because it is an opt-out plan. What this means is that, there is no volunteer bias, many users have not downloaded the Peak app, and some users are not even aware of the change of pricing plan.
• Information Only Treatment group – First six-months results demonstrate a limited impact during peak hours and an increase in consumption in Off-peak hours. Likely, an increased understanding of low off-peak hour pricing contributed to these effects. In simple terms, off-peak, low pricing is perceived as “sale” pricing, whereby customers buy more when products are on sale. This behaviour leads to a higher total energy consumption per user.
Lessons Learned
1. Social Media can do better. More compelling creative with a stronger call-to-action would have helped Facebook ads perform better during program enrollment. The overall performance stood at:
• 20k Impressions • 200 URL clicks • 1% Click-thru Rate
2. Do not provide choice in a vacuum – customers have little experience comparing electricity rates. As utilities, we should be ready with print collateral that compares the options. Questions we received were:
What is the main difference with each charge period: Help explain hours of consumption x rates in each TOU category.
What are the rates for the current plan? Help explain standard TOU prices vs. new prices.
What will my bill be? Help customers conceptualize bill changes as related to lifestyle.
Is the new rate cheaper? Explain how it can be cheaper if they change their behaviour by load shifting or conserving.
3. Name pilots simply and descriptively
Naming our pilot something simple such as Shift ‘N Save would have more clearly communicated that you can save based on your time of use.

77 © 2019 Publicis.Sapient. All rights reserved.
4. Reaffirm the Ability to Choose Generally speaking, residential rate payers in the Province of Ontario are not used to choice when it comes to rate plans. A typical user will sign-up for an account and will, with the exception of special programs such as OESP or energy retailers, be subject to the Time of Use or Tiered rate plan. During the pilot, customers receiving outreach messages about Peak Performance Pricing often misunderstood that the pilot rates were akin to mandatory rate changes. The idea that the customer was free to choose between two different rate options was novel, and the team was forced to implement changes to outreach scripts, to ensure customers grasped the concept. Ultimately, highlighting that customers could either opt-in or out (depending on their outreach group) resulted in positive interactions; however customers typically then asked which rate was either “cheaper” or “better for them”. In terms of lessons learned, effectively communicating about choice is critical when it comes to protecting customer interests and relationships.
5. Concurrent Pilots in Medium-sized Service Territory There were delays with some of our outreach and communications. The communications could have been clearer to maintain the experimental integrity of the pilot within the relatively small service territory. Any utility our size or smaller should consider running pilots that allow customers to choose their price, to avoid this challenge.
6. Customer Reactions During a Heat Wave Oshawa Power received an increase in call volume regarding the program during summer heat waves. Participants found it challenging when there were Critical Peak Prices for multiple days in a row. It is not clear yet if this was a statistically significant response. After the summer heat waves, CPP customers understood weather patterns but not necessary how they contribute to system peak events. Customers provided negative feedback when the first winter CPP event was a relatively mild day.
7. Advanced Notice & Ways to Convey CPP Events
Oshawa Power received feedback that customers prefer approximately 24hr notice and on all the possible communication channels for any Critical Peak event. The notification allows them to “make arrangements” for the rise in the cost of electricity. Additional time was preferred if notified over a long weekend or holiday.
8. Learnings from Drop Out Surveys Customers pointed out that they did not support the program objective and their selected pricing plan. They pointed out that the TOU charges are expensive and not helpful in managing usage.
Considerations for Deployment at a Broader Scale
The OEB can have the Peak app deployed at a broader scale with some performance tuning of processes interacting with external systems like IESO. Since it is implemented using Amazon Web Services (AWS) cloud, there are no restrictions on the scalability of infrastructure. There are several ways to deploy the Peak app and cloud platform, and a few of them are here:
1. As a service with analytics and messaging infrastructure 2. As a white-labeled product 3. As an OEB official product 4. As a product endorsed by a third party
The project team will extrapolate the expected cost for a broader scale implementation at the end of the pilot when full costs and effectiveness are available.

78 © 2019 Publicis.Sapient. All rights reserved.
Appendix A. Pilot Surveys
Common Questions
Q1. Below are some factors regarding electricity that may or may not be important to you. For each one, please check the box to indicate whether, you strongly agree, somewhat agree, neutral, somewhat disagree or strongly disagree.
• Conserving electricity in order to help the environment • Conserving electricity in order to save money on my electricity bill • Shifting the times that my household uses electricity • Understanding the actions my household can take to save money on our electricity bill.
Q2. Please use the scale below to indicate how much you agree with each of the following statements. For each one, please check the box to indicate whether, you strongly agree, somewhat agree, neutral, somewhat disagree or strongly disagree.
• I have a good understanding of how electricity usage impacts the environment • I have a good understanding of the difference between flat pricing and time-of-use pricing • I change my electricity usage during the day depending on how much I’m being charged at that particular time • I’m interested in learning about different ways to conserve electricity • I’m interested in lowering the cost of electricity to people in my community • I’m interested in lowering the cost of my own household’s electricity bill
Q3. Next, you’ll see some ways in which an electricity company could potentially communicate with its customers. Please check the box next to each one that you believe customers would be interested in. [CHECK ALL THAT APPLY]
• Phone calls or voice mail notifications • E-mail notifications • Text notifications • Notifications or inserts in the electricity bill • None of the above
Q4. And, which of the following best describes the primary source of electric power in Ontario? [CHECK ONE]
• Dams that generate hydropower • Wind • Nuclear • Natural gas • Solar • Biomass • Purchases of electricity from other provinces and the U.S. • Coal • Unsure
Q5. Please select the option(s) that best describes Ontario’s Time-Of-Use pricing models [CHECK ALL THAT APPLY]
• There is a different charge for electricity depending on the time of day • There is a different charge for electricity depending on the day of the week • There is a different charge for electricity depending on the season
Q6. Next, you’ll see some statements about Time-Of-Use pricing for electricity. For each one, please check the box to indicate whether, in your opinion, it’s true, false or unsure.
• Power costs the same to generate at any hour of the day, so customers should pay the same price for electricity regardless of the time of day they’re using it
• Time-of-use rates are fairly priced • It is more expensive to make electricity available during times when everyone is using it the most • It costs more to maintain generators and transmission grids when they are operating at maximum capacity • Ontario purchases power from other provinces and U.S. states when customer usage exceeds generate capability. • Ontario sells power to other provinces and U.S. states when customer usage is below what is generated.
• Other • Unsure

79 © 2019 Publicis.Sapient. All rights reserved.
Q7. In your opinion, which of the following factors do you believe has the biggest impact on how much electricity people use? [CHECK ONE]
• Whether it’s daytime or nighttime • Whether it’s summer or winter • Whether it’s raining or not • The heaviness of cloud coverage • Whether it’s a weekday or weekend
Q8. Please select the top 3 household items that you believe consume the most electricity. [CHECK BOXES FOR THREE]
• Heating unit • Water heater • Dishwasher • Oven • Cooling unit • Lighting • TV • Computers/Laptops
• Fridge • Washing machine/Dryer • Microwave • Cable Box • Other
Q9. In your opinion, what do you think is the most effective way to reduce your electricity bill in the summertime? [
• Raise the temperature on your A/C unit by 2 degrees Celsius between the hours of 1 p.m. and 7 p.m. during hot months • Minimize your use of appliances that generate heat (oven, hairdryer, dishwasher) • Close the blinds or curtains on the sunny side of your home • Turn off and unplug ‘silent energy users’ such as phone chargers and cable boxes, which draw electricity when not in
use
Q10. Thinking about the Peak Program you’re involved in, what do you believe is the primary goal of the project?
• Optimize the times of day and year that electricity is being used • Reduce congestion on the electric grid • Reduce the need for the power company to build more facilities to generate electric power • Lower the cost of delivering electricity to the community
Q11. Please think about the Peak Program in which you’re participating in and indicate how much you agree with each of the following statements in relation to the Peak Program. For each one, please check the box to indicate whether, you strongly agree, somewhat agree, neutral, somewhat disagree or strongly disagree.
• The program will help me save money on my electricity bill / The program is helping me save money on my electricity bill.
• I'm looking forward to having a mobile app that helps me save money on my electricity bill / I'm having Peak mobile app that helps me save money on my electricity bill
• The program will be worth my time and effort / The program is worth my time and effort • The program will help me better understand the factors that impact electricity costs / The program is helping me better
understand the factors that impact electricity costs
• I'm excited to be participating in Oshawa Power's Peak Program / I enjoy participating in the Peak pilot program
Pre-Pilot Survey
Q12. Including yourself, how many adults, 18 or older, currently live in your household?
Q13. How many of these adults are over the age of 65?
• 0 • 1 • 2 • 3 • 4 • More than 4
• 0 • 1 • 2 • 3 • 4 • More than 4

80 © 2019 Publicis.Sapient. All rights reserved.
Q14. How many children under the age of 18 live in your household?
Q15. Last year, that is in 2017, what was your total household income from all sources, before taxes? [CHECK ONE]
Q16. What is the last grade or class you completed in school? [CHECK ONE]
• None, or grade 1-8 • Secondary (high) school incomplete • Secondary (high) school graduate • Registered Apprenticeship or other trades certificate or diploma • College or other non-university certificate or diploma • University certificate, diploma or degree • Post-graduate or professional schooling after university (e.g., Master’s degree or Ph.D.; law or medical school)
Q17. Please select the option that best describes your current employment status. [CHECK ONE]
Q18. At what time of day do you typically leave home to go to work?
DROP DOWN: 12AM, 1AM, 2AM, 3AM, 4AM, 5AM, 6AM, …..11AM, 12PM, 1PM….8PM, 9PM, 10PM, 11PM, Various
Q19. At what time of day do you typically get home from work?
DROP DOWN: 12AM, 1AM, 2AM, 3AM, 4AM, 5AM, 6AM, …..11AM, 12PM, 1PM….8PM, 9PM, 10PM, 11PM, Various
Q20. How many additional persons in your household, other than yourself, are currently working full-time (30 hours or more per week)?
• 0 • 1 • 2 • 3 • 4 • More than 4
Q21. At what time of day do they typically leave home to go to work?
DROP DOWN: 12AM, 1AM, 2AM, 3AM, 4AM, 5AM, 6AM, …..11AM, 12PM, 1PM….8PM, 9PM, 10PM, 11PM, Various
Q22. At what time of day do they typically get home from work?
DROP DOWN: 12AM, 1AM, 2AM, 3AM, 4AM, 5AM, 6AM, …..11AM, 12PM, 1PM….8PM, 9PM, 10PM, 11PM, Various
Q23. Is there someone home Monday to Friday during the day between 7am-7pm at least one day a week?
Q24. Below are some statements about the usage of mobile applications on your smartphone. Which statement best describes your personal usage of mobile applications?
• I use mobile applications on my smartphone every day and rely on them heavily • I regularly use mobile applications on my smartphone • I occasionally use mobile applications on my smartphone • I rarely use mobile applications on my smartphone • I never use mobile applications on my smartphone
• 0 • 1 • 2 • 3 • 4 • More than 4
• Less than $10,000 • $30,000 to less than $40,000 • $90,000 to less than $100,000 • $10,000 to less than $20,000 • $40,000 to less than $75,000 • $100,000 to less than $150,000 • $20,000 to less than $30,000 • $75,000 to less than $90,000 • $150,000 or more
• Employed full-time • Employed part-time • Self-employed • Unemployed • A student • Retired • Other
• Yes • No

81 © 2019 Publicis.Sapient. All rights reserved.
Mid-Pilot Survey
The pilot dropped the initial profile questions asked during the pilot start survey and added a few new questions.
Seasonal TOU with CPP group
Q12. Please think about CPP event and indicate how much you agree with each of the following statements in relation to the Peak Program. For each one, please check the box to indicate whether, you strongly agree, somewhat agree, neutral, somewhat disagree or strongly disagree.
• All the CPP notifications were communicated to me at least 24 hours in advance before the event start time • I understand that I was asked to conserve electricity with a CPP event for 3 consecutive days due to extreme heat
waves this summer which created stress on the power grid • I’m excited as it is flat price from Sep 1st till Nov 30th, 2018 • I think I can save more if there was a regular TOU pricing plan • All the CPP notifications were communicated to me at least 24 hours in advance before the event start time
Super-Peak TOU Group
Q12. Please think about TOU charges and its acceptance and indicate how much you agree with each of the following statements in relation to the Peak Program. For each one, please check the box to indicate whether, you strongly agree, somewhat agree, neutral, somewhat disagree or strongly disagree.
• I'm aware that I need to conserve electricity more during summer months as all non-summer months are cheaper TOU pricing
• I’m a senior citizen and I find this TOU charging more difficult to save electricity • I have a home office, this TOU pricing is more challenging for me to save electricity • I think I can save more if there was Regular TOU charges plan • I'm aware that I need to conserve electricity more during summer months as all non-summer months are cheaper TOU
pricing
Q13. Please think about the Peak app and indicate how much you agree to the following features about it. For each one, please check the box to indicate whether, you strongly agree, somewhat agree, neutral, somewhat disagree or strongly disagree.
• The Peak app/website has helped me to track my usage more effectively than earlier even when I'm out of town • Conservation of electricity & shifting my usage to non-peak time is easier with the Peak app/website alerts • I have followed electricity conservation tips and tricks from the Peak app/website and found them effective • I use the Peak app/website during the weekends more than the weekdays • I’m aware of the process of adding my family in to the Peak app to access electricity usage together • I’m aware of the new releases of the Peak app versions and I keep updating it to the latest
Information Only Group
Q12. Please think about the conservation of electricity and indicate how much you agree with each of the following statements in relation to the Peak Program. For each one, please check the box to indicate whether, you strongly agree, somewhat agree, neutral, somewhat disagree or strongly disagree.
• I try to shift my usage from On-peak to Off-peak Time Of Use pricing to conserve energy and money • I'm more likely to shift my electricity usage if there was shorter and more expensive On-peak time

82 © 2019 Publicis.Sapient. All rights reserved.
B. Peak App Screenshots
The section below depicts a few of the Peak app screens and communication mockups utilized as part of the information treatment to all the participants in the pilot program.
Home Screen:
Notifications:
Usage:

83 © 2019 Publicis.Sapient. All rights reserved.
Billing:

84 © 2019 Publicis.Sapient. All rights reserved.
Strategies, Ways to Save, and Learning:
Gamification:

85 © 2019 Publicis.Sapient. All rights reserved.
C. Hourly Impact
Summer 2018
The section below depicts the hourly impact on usage over the summer 2018 period for the participants in all the three treatment groups.
Seasonal TOU with CPP Treatment Group
Figure 36 Hourly Impact; Seasonal TOU with CPP; Non-CPP days; All Participants; Summer Weekdays
Figure 37 Hourly Impact; Seasonal TOU with CPP; Non-CPP days; Digitally Engaged Participants; Summer Weekdays
Figure 38 Hourly Impact; Seasonal TOU with CPP; Non-CPP days; All Participants; Summer Weekends
Figure 39 Hourly Impact; Seasonal TOU with CPP; Non-CPP days; Digitally Engaged Participants; Summer Weekends
0
5
10
15
20
25
30
0.4
0.6
0.8
1
1.2
1.4
1.6
1.8
2
0 2 4 6 8 10 12 14 16 18 20 22
kWh
/ hr
cent
/ kW
h
Hour of the daypre_weekday post_weekdayTOU SeasonalCPP
0
5
10
15
20
25
30
0.4
0.6
0.8
1
1.2
1.4
1.6
1.8
2
0 2 4 6 8 10 12 14 16 18 20 22
kWh
/ hr
cent
/ kW
h
Hour of the daypre_weekday post_weekdayTOU SeasonalCPP
0
5
10
15
20
25
30
0.4
0.6
0.8
1
1.2
1.4
1.6
1.8
2
0 2 4 6 8 10 12 14 16 18 20 22
kWh
/ hr
cent
/ kW
h
Hour of the daypre_weekendpost_weekendTOU_weekendSeasonalCPP_weekend
0
5
10
15
20
25
30
0.4
0.6
0.8
1
1.2
1.4
1.6
1.8
2
0 2 4 6 8 10 12 14 16 18 20 22
kWh
/ hr
cent
/ kW
h
Hour of the daypre_weekendpost_weekendTOU_weekendSeasonalCPP_weekend

86 © 2019 Publicis.Sapient. All rights reserved.
Figure 40 Hourly Impact; Seasonal TOU with CPP; CPP days; All Participants; Summer Weekday
Figure 41 Hourly Impact; Seasonal TOU with CPP; CPP days; Digitally Engaged Participants; Summer Weekday
0
5
10
15
20
25
30
0.4
0.6
0.8
1
1.2
1.4
1.6
1.8
2
0 2 4 6 8 10 12 14 16 18 20 22
kWh
/ hr
cent
/ kW
h
Hour of the daypre_weekday post_weekdayTOU SeasonalCPP
0
5
10
15
20
25
30
0.4
0.6
0.8
1
1.2
1.4
1.6
1.8
2
0 2 4 6 8 10 12 14 16 18 20 22
kWh
/ hr
cent
/ kW
h
Hour of the daypre_weekday post_weekdayTOU SeasonalCPP

87 © 2019 Publicis.Sapient. All rights reserved.
Super-Peak TOU Treatment Group
Figure 42 Hourly Impact; Super-Peak TOU; All Participants; Summer Weekdays
Figure 43 Hourly Impact; Super-Peak; Digitally Engaged Participants; Summer Weekdays
Figure 44 Hourly Impact; Super-Peak; All Participants; Summer Weekend
Figure 45 Hourly Impact; Super-Peak; Digitally Engaged Participants; Summer Weekends
0
5
10
15
20
25
30
0.4
0.6
0.8
1
1.2
1.4
1.6
1.8
2
0 2 4 6 8 10 12 14 16 18 20 22
kWh
/ hr
cent
n / k
Wh
Hour of the day
pre_weekday post_weekdayTOU SuperPeak
0
5
10
15
20
25
30
0.4
0.6
0.8
1
1.2
1.4
1.6
1.8
2
0 2 4 6 8 10 12 14 16 18 20 22
kWh
/ hr
cent
/ kW
h
Hour of the day
pre_weekday post_weekdayTOU SuperPeak
0
5
10
15
20
25
30
0.4
0.6
0.8
1
1.2
1.4
1.6
1.8
2
0 2 4 6 8 10 12 14 16 18 20 22
kWh
/ hr
cent
/ kW
h
Hour of the day
pre_weekendpost_weekendTOU_weekend
0
5
10
15
20
25
30
0.4
0.6
0.8
1
1.2
1.4
1.6
1.8
2
0 2 4 6 8 10 12 14 16 18 20 22
kWh
/ hr
cent
/ kW
h
Hour of the daypre_weekendpost_weekendTOU_weekend

88 © 2019 Publicis.Sapient. All rights reserved.
Information Only Treatment Group
Figure 46 Hourly Impact; Information Only; All Participants; Summer Weekdays
Figure 47 Hourly Impact; Information Only; All Participants; Summer Weekends
Figure 48 Hourly Impact; Information Only; Digitally Engaged Participants; Summer Weekdays
Figure 49 Hourly Impact; Information Only; Digitally Engaged Participants; Summer Weekends
0
5
10
15
20
25
30
0.4
0.6
0.8
1
1.2
1.4
1.6
1.8
2
0 2 4 6 8 10 12 14 16 18 20 22
cent
s/kW
h
kWh/
hr
Hour of the daypre_weekday post_weekday TOU
0
5
10
15
20
25
30
0.4
0.6
0.8
1
1.2
1.4
1.6
1.8
2
0 2 4 6 8 10 12 14 16 18 20 22
cent
/kW
h
kWh/
hr
Hour of the daypre_weekday post_weekdayTOU
0
5
10
15
20
25
30
0.4
0.6
0.8
1
1.2
1.4
1.6
1.8
2
0 2 4 6 8 10 12 14 16 18 20 22
cent
/kW
h
kWh/
hr
Hour of the daypre_weekend post_weekendTOU_weekend
0
5
10
15
20
25
30
0.4
0.6
0.8
1
1.2
1.4
1.6
1.8
2
2.2
0 2 4 6 8 10 12 14 16 18 20 22
Cent
s/kW
h
kWh/
hr
Hour of the daypre_weekend post_weekendTOU_weekend

89 © 2019 Publicis.Sapient. All rights reserved.
Summer Shoulder 2018
Seasonal TOU with CPP Treatment Group
Figure 50 Hourly Impact; Information Only; Digitally Engaged Participants; Summer Shoulder Weekends
Figure 51 Hourly Impact; Information Only; Digitally Engaged Participants; Summer Shoulder Weekends
Figure 52 Hourly Impact; Information Only; Digitally Engaged Participants; Summer Shoulder Weekends
Figure 53 Hourly Impact; Information Only; Digitally Engaged Participants; Summer Shoulder Weekends
Super-Peak TOU Treatment Group
4567891011121314
0.4
0.6
0.8
1
1.2
1.4
1.6
1 3 5 7 9 11 13 15 17 19 21 23
Cent
s/kW
h
kWh/
hr
Hour of the day
post_weekend pre_weekendTOU_weekend
4567891011121314
0.4
0.6
0.8
1
1.2
1.4
1.6
1 3 5 7 9 11 13 15 17 19 21 23
Cent
s/kW
h
kWh/
hrHour of the day
post_weekend pre_weekendTOU_weekend
4567891011121314
0.4
0.6
0.8
1
1.2
1.4
1.6
1 3 5 7 9 11 13 15 17 19 21 23
Cent
s/kW
h
kWh/
hr
Hour of the day
post_weekend pre_weekendTOU_weekend
4567891011121314
0.4
0.6
0.8
1
1.2
1.4
1.6
1 3 5 7 9 11 13 15 17 19 21 23
Cent
s/kW
h
kWh/
hr
Hour of the day
post_weekend pre_weekendTOU_weekend

90 © 2019 Publicis.Sapient. All rights reserved.
Figure 54 Hourly Impact; Super-Peak; All Participants; Summer Shoulder Weekdays
Figure 55 Hourly Impact; Super-Peak; Digitally Engaged Participants; Summer Shoulder Weekdays
Figure 56 Hourly Impact; Super-Peak; Digitally Engaged Participants; Summer Shoulder Weekdays
Figure 57 Hourly Impact; Super-Peak; Digitally Engaged Participants; Summer Shoulder Weekends
Figure 58 Hourly Impact; Super-Peak; No Info Participants; Summer Shoulder Weekends
Figure 59 Hourly Impact; Super-Peak; No Info Participants; Summer Shoulder Weekends
Information Only Treatment Group
4
6
8
10
12
14
0.4
0.6
0.8
1
1.2
1.4
1.6
1 3 5 7 9 11 13 15 17 19 21 23
Cent
s/kW
h
kWh/
hr
Hour of the daypost_weekday pre_weekdayTOU SuperPeak
4
6
8
10
12
14
0.4
0.6
0.8
1
1.2
1.4
1.6
1 3 5 7 9 11 13 15 17 19 21 23
Cent
s/kW
h
kWh/
hr
Hour of the daypost_weekday pre_weekday
TOU SuperPeak
4
6
8
10
12
14
0.4
0.6
0.8
1
1.2
1.4
1.6
1 3 5 7 9 11 13 15 17 19 21 23
Cent
s/kW
h
kWh/
hr
Hour of the daypost_weekday pre_weekdayTOU SuperPeak
4
6
8
10
12
14
0.4
0.9
1.4
1.9
1 3 5 7 9 11 13 15 17 19 21 23
Cent
s/kW
h
kWh/
hr
Hour of the daypost_weekendpre_weekend
4
6
8
10
12
14
0.4
0.6
0.8
1
1.2
1.4
1.6
1 3 5 7 9 11 13 15 17 19 21 23
Cent
s/kw
h
kWh/
hr
Hour of the daypost_weekday pre_weekdayTOU SuperPeak
4
9
14
0.4
0.9
1.4
1 3 5 7 9 11 13 15 17 19 21 23
Cent
s/kW
h
kWh/
hr
Hour of the daypost_weekendpre_weekend

91 © 2019 Publicis.Sapient. All rights reserved.
Figure 60 Hourly Impact; Information Only; All Participants; Summer Shoulder Weekdays
Figure 61 Hourly Impact; Information Only; Digitally Engaged Participants; Summer Shoulder Weekdays
Figure 62 Hourly Impact; Information Only; All Participants; Summer Shoulder Weekends
Figure 63 Hourly Impact; Information Only; Digitally Engaged Participants; Summer Shoulder Weekends
4
5
6
7
8
9
10
11
12
13
14
0.4
0.6
0.8
1
1.2
1.4
1.6
1 3 5 7 9 11 13 15 17 19 21 23Ce
nts/
kWh
kWh/
hr
Hour of the daypost_weekday pre_weekday TOU
4
5
6
7
8
9
10
11
12
13
14
0.4
0.6
0.8
1
1.2
1.4
1.6
1 3 5 7 9 11 13 15 17 19 21 23
Cent
s/kW
h
kWh/
hr
Hour of the daypost_weekday pre_weekdayTOU
4
5
6
7
8
9
10
11
12
13
14
0.4
0.6
0.8
1
1.2
1.4
1.6
1 3 5 7 9 11 13 15 17 19 21 23
cent
s/kW
h
kWh/
hr
Hour of the daypost_weekend pre_weekendTOU_weekend
4567891011121314
0.4
0.6
0.8
1
1.2
1.4
1.6
1 3 5 7 9 11 13 15 17 19 21 23
Cent
s/kW
h
kWh/
hr
Hour of the daypost_weekend pre_weekend
TOU_weekend

92 © 2019 Publicis.Sapient. All rights reserved.
D. Peak App Usage
• As described in Figure 64, the usage page of Peak has been the most visited page. People have visited it 30 - 35% of the time in a month. The users have consistently demonstrated the behaviour to check electricity usage.
• As described in Figure 65, the home page use is also consistent between 20 to 25%. The home page shows the electricity usage comparison summary and energy tip. It is the second most visited page. The month of May showed 33% of the time users visited the home page. This higher percentage in May would be due to the launch of Peak app.
• As described in Figure 66, Users started visiting Today's drawer approximately 5% times starting July. • As described in Figure 67, the importance and use of the message centre have shown a progressive improvement
for the users. The users only visited it 4.67% of the time in May; it showed a steep increase in usage of this functionality in August, September, and October topping up to 15.5% of the time. The use of the message centre also shows the effectiveness and response of the Peak engagement communications delivered to mobile. From July onwards, users started using the message centre, and it has consistently shown its usefulness and provides a direct way to reach participants more effectively.
• As described in Figure 68, users visited the bill page almost 10% of the time. The bill ready messages and emails sent to the users’ mailboxes have links to the bill page, which drives them to look at the details of the bill of the month.
• As described in Figure 69, the help page usage has shown a downward curve from May to October depicting users have more control now over the use of Peak app and have less FAQ and queries.
• As described in Figure 70, the use of Saving Strategies is consistent at 8% to 9%. However, there is a shift seen to higher side as months progress. Potentially uses are either marking strategies as complete or moving on to strategies with less and less impact.
Figure 64 % of visits when users viewed their usage in app
Figure 65 % of visits when users accessed the home page
28.89%30.50%
34.69%32.18%
33.98%35.84%
0.00%
5.00%
10.00%
15.00%
20.00%
25.00%
30.00%
35.00%
40.00%
May June July August September October
33.11%
25.64%22.46% 22.07% 22.20%
19.97%
0.00%
5.00%
10.00%
15.00%
20.00%
25.00%
30.00%
35.00%
40.00%
May June July August September October

93 © 2019 Publicis.Sapient. All rights reserved.
Figure 66 % of visits when users accessed Today's Drawer on app
Figure 67 % of visits when users accessed Message Centre
Figure 68 % visits when users accessed the billing page
Figure 69 % of visits when users accessed the help page
Figure 70 % of visits when users accessed Saving Strategies
2.36% 2.71%
6.27% 5.09% 5.06% 4.71%
0.00%
5.00%
10.00%
15.00%
20.00%
25.00%
30.00%
35.00%
40.00%
May June July August September October
4.67% 5.88%8.88%
15.48%
11.08%13.50%
0.00%
5.00%
10.00%
15.00%
20.00%
25.00%
30.00%
35.00%
40.00%
May June July August September October
10.34%12.24%
9.53% 9.03% 9.57%8.06%
0.00%
5.00%
10.00%
15.00%
20.00%
25.00%
30.00%
35.00%
40.00%
May June July August September October
4.27% 3.79% 3.28% 2.39% 2.83% 2.29%
0.00%
5.00%
10.00%
15.00%
20.00%
25.00%
30.00%
35.00%
40.00%
May June July August September October
7.41% 6.86% 6.99% 7.64% 8.02% 8.66%
0.00%
5.00%
10.00%
15.00%
20.00%
25.00%
30.00%
35.00%
40.00%
May June July August September October

94 © 2019 Publicis.Sapient. All rights reserved.
Figure 71 % of times Peak app was used by day of the week from month to month
Each age group in the pilot group has its trend of using the Peak app during the week and being engaged to it. Here are how different age groups in the pilot have used the peak app during the week.
We could see the following behavioural pattern after studying the day wise age group wise Peak app use patter across summer months, Figure 72
1. During the month of August, a change in the preferred day of Peak app usage occurs in all age groups. All age groups were using the Peak app most on Thursday except 18-24 years old. 18-24 years old shifted it to Wednesday and demonstrated a jump of 15% in accessing the Peak app from previous months.
2. During the initial months (May and June), Tuesday remained as the preferred day of Peak app usage. 3. Peak app usage has increased on weekends in all age groups over the time of 6 months. 4. Monday has never been the preferred day of Peak app usage except for 55-65 years old people have shown
an incline for Monday in the month of October
14.27%
24.59%
20.86%
14.25%
10.26%
7.02%8.75%
0.00%
5.00%
10.00%
15.00%
20.00%
25.00%
Monday Tuesday Wednesday Thursday Friday Saturday Sunday
May
17.44%
21.96%
15.20%
10.77%
15.73%
11.29%
7.60%
0.00%
5.00%
10.00%
15.00%
20.00%
25.00%
Monday Tuesday Wednesday Thursday Friday Saturday Sunday
June
15.98%
20.86%
15.71% 14.85%
10.62%8.38%
13.60%
0.00%
5.00%
10.00%
15.00%
20.00%
25.00%
Monday Tuesday Wednesday Thursday Friday Saturday Sunday
July
13.07%15.39%
17.89%
22.08%
14.30%
7.18%
10.07%
0.00%
5.00%
10.00%
15.00%
20.00%
25.00%
Monday Tuesday Wednesday Thursday Friday Saturday Sunday
August
16.23%
19.28%
15.26%13.49% 12.60%
10.78%12.37%
0.00%
5.00%
10.00%
15.00%
20.00%
25.00%
Monday Tuesday Wednesday Thursday Friday Saturday Sunday
September
15.25%
17.97% 17.77%
12.36%10.67%
12.91% 13.07%
0.00%
5.00%
10.00%
15.00%
20.00%
25.00%
Monday Tuesday Wednesday Thursday Friday Saturday Sunday
October

95 © 2019 Publicis.Sapient. All rights reserved.
Figure 72 Daily usage pattern of age groups
Figure 73 highlights the behavioural pattern found after studying the Peak app use across age groups,
0.00%
10.00%
20.00%
30.00%
May June July August September October
18-24 yrs old
Monday Tuesday Wednesday ThursdayFriday Saturday Sunday
0.00%
10.00%
20.00%
30.00%
May June July August September October
25-34 yrs old
Monday Tuesday Wednesday ThursdayFriday Saturday Sunday
0.00%
10.00%
20.00%
30.00%
May June July August September October
35-44 yrs old
Monday Tuesday Wednesday ThursdayFriday Saturday Sunday
0.00%
10.00%
20.00%
30.00%
May June July August September October
45-54 yrs old
Monday Tuesday Wednesday ThursdayFriday Saturday Sunday
0.00%
10.00%
20.00%
30.00%
May June July August September October
55-64 yrs old
Monday Tuesday Wednesday ThursdayFriday Saturday Sunday
0.00%
10.00%
20.00%
30.00%
May June July August September October
75 yrs or older
Monday Tuesday Wednesday Thursday
0.00%
10.00%
20.00%
30.00%
May June July August September October
65-74 yrs old
Monday Tuesday WednesdayThursday Friday Saturday

96 © 2019 Publicis.Sapient. All rights reserved.
• Almost all age groups have shown a stable or upward trend in the use of Peak app, except for the people in the age group of 35-44 years.
• Users in the age group 25-34 years have shown a steep rise in the use of Peak app from 25% in September to 33% in October.
Figure 73 % times Peak app was used by month for age groups
3.89% 4.11% 3.68% 4.38% 4.09% 3.06%
0.00%
10.00%
20.00%
30.00%
May June July August SeptemberOctober
18-24 years old
24.30%26.41% 27.90%
23.80% 25.08%
32.38%
0.00%
10.00%
20.00%
30.00%
May June July August September October
25-34 years old
26.55%
19.77% 19.19%17.05% 16.85% 17.19%
0.00%
10.00%
20.00%
30.00%
May June July August SeptemberOctober
35-44 years old
21.48%19.11% 18.36%
20.78% 19.59% 19.36%
0.00%
10.00%
20.00%
30.00%
May June July August September October
45-54 years old
13.62%15.78% 14.73% 15.93% 17.22%
14.23%
0.00%
10.00%
20.00%
30.00%
May June July August SeptemberOctober
55-64 years old
7.52%11.15% 11.89%
14.29%12.31% 10.82%
0.00%
10.00%
20.00%
30.00%
May June July August September October
65-74 years old
2.64% 3.68% 4.23% 3.77% 4.86%2.95%
0.00%
10.00%
20.00%
30.00%
May June July August SeptemberOctober
75+ years
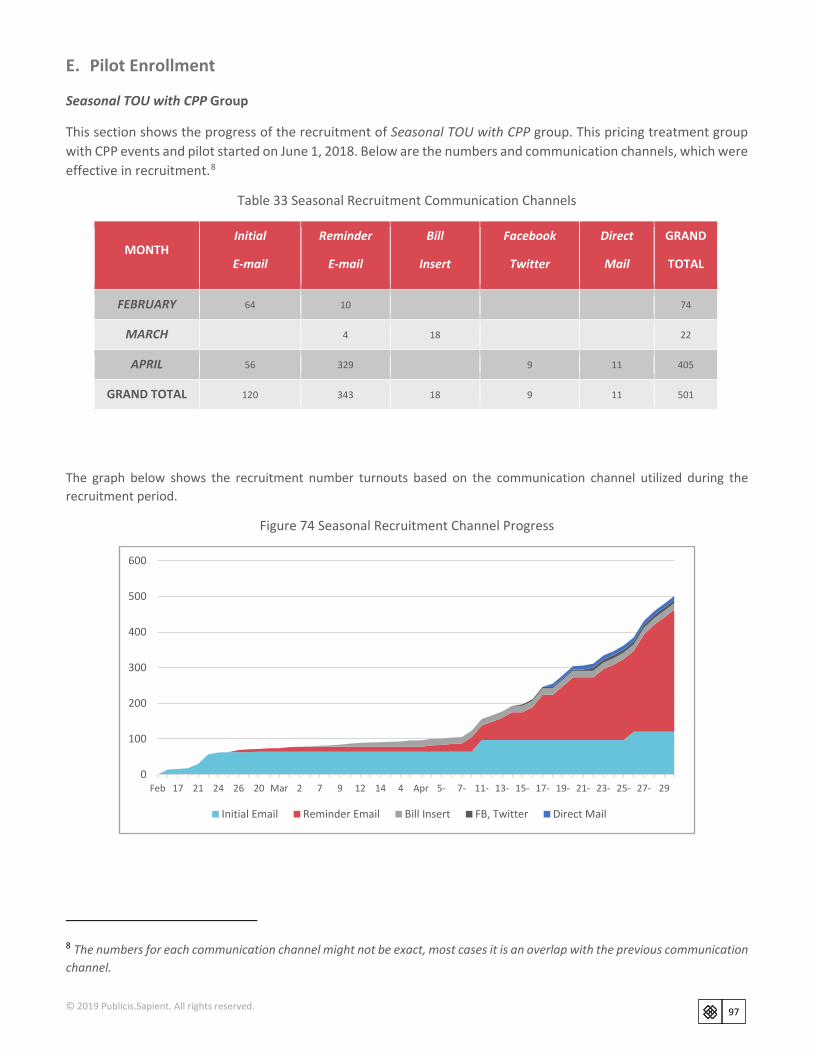
97 © 2019 Publicis.Sapient. All rights reserved.
E. Pilot Enrollment
Seasonal TOU with CPP Group
This section shows the progress of the recruitment of Seasonal TOU with CPP group. This pricing treatment group with CPP events and pilot started on June 1, 2018. Below are the numbers and communication channels, which were effective in recruitment.8
Table 33 Seasonal Recruitment Communication Channels
MONTH Initial
Reminder
Bill
Insert
Direct
GRAND
TOTAL
FEBRUARY 64 10 74
MARCH 4 18 22
APRIL 56 329 9 11 405
GRAND TOTAL 120 343 18 9 11 501
The graph below shows the recruitment number turnouts based on the communication channel utilized during the recruitment period.
Figure 74 Seasonal Recruitment Channel Progress
8 The numbers for each communication channel might not be exact, most cases it is an overlap with the previous communication channel.
0
100
200
300
400
500
600
Feb 17 21 24 26 20 Mar 2 7 9 12 14 4 Apr 5- 7- 11- 13- 15- 17- 19- 21- 23- 25- 27- 29
Initial Email Reminder Email Bill Insert FB, Twitter Direct Mail

98 © 2019 Publicis.Sapient. All rights reserved.
Super-Peak TOU Group
This section highlights recruitment for the Super-Peak TOU group, which is the single opt-out group of the pilot. The selection process identified close to 2,000 customers and informed them of their inclusion in the program through a rate change notice package. These customers had three weeks to opt-out of the program if they were not interested. Table 34 shows the pre-start stats on the participants count in this group.
Table 34 Super Peak Pre-Start stats
MONTH TOTAL SELECTED
CUSTOMERS WITH RETAILER
MOVE OUTS* OPT_OUTS** DROPOUTS** GRAND
TOTAL
MAY 1996 -90 -24 -258 -64 1560
* Pending Final Pilot Count: These are the account numbers which have moved to a new location, making the existing meter invalid for us.
**Opt-Out vs Dropout: Drop outs are those customers who have come in touch with the Peak Pilot support staff and have opted to move out of the pilot program, whereas Opt-out for super peak pricing plan is the number of customers who opted to move out of program before the start of Pilot.

99 © 2019 Publicis.Sapient. All rights reserved.
Information Only Group
This section highlights the progress of recruitment of Information Only group. This pilot group started on May 1st, 2018 with the Peak app and Web portal to support the pilot participants. Below are the numbers and communication channels that were effective in recruitment.9
Table 35 Information Only Recruitment Communication Channels
Month Initial
Reminder
Bill
Insert Twitter Facebook
GRAND
TOTAL
FEBRUARY 136 38 174
MARCH 97 151 20 268
APRIL 62 1 1 6 70
GRAND TOTAL 233 251 20 1 1 6 512
The graph below shows the recruitment number turnouts based on the communication channel utilized during the recruitment period.
Figure 75 Information Only Recruitment Channel Progress
9 The numbers for each communication channel might not be exact, most cases it is an overlap with the previous communication channel.
0
100
200
300
400
500
600
Facebook, Twitter Initial Email Reminder Email Bill Insert Facebook Twitter

100 © 2019 Publicis.Sapient. All rights reserved.
Recruitment Progress
The below table depicts the details around recruitment progress on a monthly basis of all the two opt-in pilot groups.
Table 36 Recruitment numbers per month
MONTH SEASONAL TOU WITH CPP INFORMATION ONLY
FEBRUARY 74 174
MARCH 96 442
APRIL 501 512
MAY 508 512

101 © 2019 Publicis.Sapient. All rights reserved.
F. Pilot Dropouts
Customers in the pilot program have an option to drop out any time during the pilot. The following table highlights the rate of attrition from the pilot program until December 21, 2018. The final report will contain further analysis on the dropouts.
Table 37 Dropout numbers per month as of December 21, 2018
MONTH
INFORMATION ONLY SEASONAL TOU WITH CPP SUPER-PEAK TOU
PILOT PARTICIP
ANTS
DROPOUTS
ATTRITION RATE
PILOT PARTICIPAN
TS
DROPOUTS
ATTRITION
RATE in %
PILOT PARTICIPA
NTS
DROPOUTS
ATTRITION RATE in
%
MAY 512 0 - 508 11 2.17 1560 74 4.74
JUNE 512 5 0.98 497 7 1.41 1486 62 4.17
JULY 507 1 0.20 490 27 5.51 1424 2 0.14
AUGUST 506 11 2.17 463 3 0.65 1422 92 6.47
OCTOBER 495 1 0.20 460 6 1.30 1330 22 1.65
NOVEMBER 494 2 0.40 454 2 0.44 1318 2 0.15
DECEMBER 492 - - 452 - - 1316 - -
The graph below shows the number of dropouts as compare with the total participant count.
Figure 76 Dropouts vs. active participants for all the three pricing groups in pilot
The number of dropouts from each pricing group is the total number of participants who either left the pilot program, moved, or are no longer Oshawa Power customers. Participants who chose not to continue in the pilot program had to either call, send a Peak app message, or email Oshawa Power; then they received a drop out questionnaire, which collected the reason for their decision. On average, the reason to leave the program was that they did not like the program objectives and their selected pricing plan. The CIS maintenance team regularly monitored participants who moved or switched providers and then marked as dropouts.
492 452 1316
20 56
254
0200400600800
10001200140016001800
Information-Only Seasonal TOU with CPP TOU Super-Peak
# of Participants Drop Outs

102 © 2019 Publicis.Sapient. All rights reserved.
G. Household Demographics and Characteristics
Below is the demographic information obtained by the pre-treatment survey. The numbers are in percentages and represent only the customers who have taken the survey which accounts for 57% of the entire pilot population. This excludes the dropouts and the population who did not take the survey.
Participant Age
Table 38. Household segments based on age of participants
AGE OF PARTICIPANTS
AVERAGE % INFORMATION ONLY SEASONAL TOU WITH
CPP SUPER-PEAK TOU
18-24 YEARS OLD 4 5 3 2
25-34 YEARS OLD 29 29 28 29
35-44 YEARS OLD 23 25 21 24
45-54 YEARS OLD 20 23 20 17
55-64 YEARS OLD 14 11 17 14
65-74 YEARS OLD 7 5 7 9
Figure 77 Segments based on household age of participants
5%
29%
25% 23%
11%
5%
1%3%
28%
21% 20%17%
7%4%
2%
29%
24%
17%14%
9%5%
0%
5%
10%
15%
20%
25%
30%
35%
18-24 25-34 35-44 45-54 55-64 65-74 >75
% o
f Peo
ple
Age Range
Information Only Seasonal TOU with CPP TOU Super Peak

103 © 2019 Publicis.Sapient. All rights reserved.
Household Income
Table 39 Segments based on household income of participants
INCOME OF HOUSEHOLDS AVERAGE % INFORMATION
ONLY SEASONAL TOU
WITH CPP SUPER-PEAK TOU
LESS THAN $40,000 18 12 19 22
$40,000 TO LESS THAN $75,000 26 23 30 26
$75,000 TO LESS THAN $90,000 13 15 13 12
$90,000 TO LESS THAN $100,000 10 10 9 10
$100,000 TO LESS THAN $150,000 20 22 19 18
$150,000 OR MORE 13 18 10 12
Number of Adults in Household
Table 40 Segments based on number of adults in each household
NO. OF ADULTS IN HOUSEHOLDS
AVERAGE % INFORMATION ONLY SEASONAL TOU WITH CPP SUPER-PEAK TOU
0 ADULTS 1 1 1 2
1 ADULT 14 10 14 19
2 ADULTS 55 57 53 55
3 ADULTS 17 18 18 14
4 ADULTS 10 11 11 7
5 OR MORE ADULTS 3 5 3 2

104 © 2019 Publicis.Sapient. All rights reserved.
Number of Adults Over 65 in Household
Table 41 Segments based on number of senior citizens in each household
SENIORS IN HOUSEHOLDS
AVERAGE % INFORMATION ONLY SEASONAL TOU WITH CPP SUPER-PEAK TOU
0 ADULTS OVER 65 78 81 78 74
1 ADULT OVER 65 11 10 10 14
2 ADULTS OVER 65 11 9 12 12
3 ADULTS OVER 65 0 1 0 1
4 ADULTS OVER 65 0 0 0 0
5 OR MORE ADULTS OVER 65
0 0 0 0
Education
Table 42 Segments based on education of participants
EDUCATION OF HOUSEHOLDS AVERAGE %
INFORMATION ONLY
SEASONALTOU WITH CPP
SUPER-PEAK TOU
SECONDARY (HIGH) SCHOOL GRADUATE OR LESS 22 16 23 26
REGISTERED APPRENTICESHIP OR OTHER TRADES
CERTIFICATE OR DIPLOMA 6 5 4 7
COLLEGE OR OTHER NON-UNIVERSITY CERTIFICATE OR DIPLOMA 36 37 35 37
UNIVERSITY CERTIFICATE, DIPLOMA OR DEGREE 26 31 25 21
POST-GRADUATE OR PROFESSIONAL SCHOOLING AFTER UNIVERSITY (E.G., MASTER’S DEGREE OR PH.D; LAW OR MEDICAL SCHOOL)
11 11 12 8

105 © 2019 Publicis.Sapient. All rights reserved.
H. Recruitment Outreach Calendar
Table 43 Recruitment outreach calendar
16th FEB Friday Emails sent to Super, CPP and Peak consumers 2191 people reached
21st FEB Wednesday Emails sent to Super, CPP and Peak consumers 3146 people reached
23rd FEB Friday Emails sent to Super, CPP and Peak consumers 3557 people reached
26th FEB Monday Emails sent to Super, CPP and Peak consumers 4369 people reached
1st MAR Thursday Emails sent to Super, CPP and Peak consumers 2692 people reached
3rd MAR Saturday Bill inserts to Peak and CPP 4939 people reached
6th MAR Tuesday Bill inserts to Peak 3156 people reached
7th MAR Tuesday Bill inserts to Super and CPP 5506 people reached
9th MAR Thursday Bill inserts 1957 people reached
14th MAR Wednesday Email communication 1892 people reached
19th MAR Monday Terms and conditions email 486 people reached
20th MAR Tuesday Terms and conditions email 6 people reached
21st MAR Wednesday Email to Peak consumers Terms and conditions email
694 people reached 323 people reached
20th MAR Tuesday Terms and conditions email 6 people reached
23rd MAR Friday Terms and conditions email 11 people reached
26th MAR Monday Terms and conditions email 183 people reached
29th MAR Thursday Outbound calls to Info Only group high potentials Email to peak consumers
172 people reached 4062 people reached
30th MAR Friday Outbound calls to Info Only group high potentials 172 people reached
2nd APR Monday Outbound calls to Info Only group high potentials 172 people reached
3rd APR Tuesday Outbound calls to Info Only group high potentials 172 people reached
4th APR Wednesday Email to Peak and CPP consumers 2226 people reached
6th APR Wednesday Email to CPP consumers 837 people reached
7th APR Saturday Outreach at retail locations during Deal Days 50+ Conversations

106 © 2019 Publicis.Sapient. All rights reserved.
9th APR Monday Outreach at retail locations during Deal Days Media Release – Oshawa Power and OEB Promotional tweet Promotional post to Facebook
50+ Conversations 65,000 readership 2,663 followers 743 followers
10th APR Tuesday Email to consumers 2100 people reached
11th APR Tuesday Email to consumers 1388 people reached
12th APR Thursday Promotional tweet Outreach Event with Durham Green Energy Doors Open Email sent to consumers
2,663 followers 15+ conversations 2290 people reached
13th APR Friday Durham Region News Story (digital and print) Email sent to consumers
30,000+ readers 1352 people reached
14th APR Saturday Outreach at retail locations during Deal Days Email sent to consumers
50+ Conversations 1653 people reached
15th APR Sunday Outreach at retail locations during Deal Days 50+ Conversations
16th APR Monday Email sent to consumers 1960 people reached
17th APR Tuesday Email sent to consumers 2319 people reached
18th APR Tuesday Email sent to consumers 1327 people reached
19th APR Thursday Outbound calls to Seasonal CPP High Potentials Promotional tweet Oshawa Express Article
167 people reached 2,663 followers 35,000+ readership
20th APR Friday Outbound calls to Seasonal CPP High Potentials Email sent to consumers
167 people reached 4181 people reached
21st APR Saturday Outreach Event with How to In Ten 50+ conversations
23rd APR Monday Direct Mail Follow-up to Seasonal Critical Bill Insert Recipients Outbound calls to Seasonal CPP High Potentials Email sent to consumers
Hundreds 167 people reached 3486 people reached
24th APR Tuesday Outbound calls to Seasonal CPP High Potentials Direct Mail Follow-up to Seasonal Critical Bill Insert Recipients Email sent to consumers
450 people reached Hundreds 712 people reached
25th APR Wednesday Promotional post to Facebook Full page ad – Oshawa This Week Durham Region News Digital Ad Durham Region News Digital Cell Phone Targeting Direct Mail Follow-up to Seasonal Critical Bill Insert Recipients Email sent to consumers
743 followers 30,000+ Readers 75,000+ Impressions 1,000+ Impressions Hundreds 2846 people reached

107 © 2019 Publicis.Sapient. All rights reserved.
26th APR Thursday Outbound calls to Seasonal CPP High Potentials CKDO 30 Second Ads x 8 KX96 30 Second Ads x 8 94.9 The Rock 30 Seconds Ads x 8 Email sent to consumers
450 people reached 44,600 listeners 169,000 listeners 103,600 listeners 1800 people reached
27th APR Friday Outbound calls to Seasonal CPP High Potentials CKDO 30 Second Ads x 8 KX96 30 Second Ads x 8 94.9 The Rock 30 Seconds Ads x 8 Email sent to consumers
450 people reached 44,600 listeners 169,000 listeners 103,600 listeners 6407 people reached
28th APR Saturday CKDO 30 Second Ads x 8 KX96 30 Second Ads x 8 94.9 The Rock 30 Seconds Ads x 8 Email sent to consumers
44,600 listeners 169,000 listeners 103,600 listeners 2570 people reached
29th APR Sunday CKDO 30 Second Ads x 8 KX96 30 Second Ads x 8 94.9 The Rock 30 Seconds Ads x 8 Email sent to consumers
44,600 listeners 169,000 listeners 103,600 listeners 1663 people reached
30th APR Monday Outbound calls to Seasonal CPP High Potentials 450 people reached

108 © 2019 Publicis.Sapient. All rights reserved.
I. Campaign Calendar
Pilot campaigns created different messaging content associated with each communication channel and delivered them to the pilot participants. Each communication was tailor-made and kept relevant to the participant who would be receiving it. Monthly calendars with the communications executed to date are below.
June 2018
Figure 78 June Communication Highlight
Peak Campaign Calendar
Jun-18
1 2 3 4 5 6 7 8 9 10
11
12
13
14
15
16
17
18
19
20
21
22
23
24
25
26
27
28
29
30
CPP Communications ✪ ✪ ✪ ✪
Summer Price Change Communication
✪
Weekly Email Communications ✪ ✪ ✪ ✪ ✪ ✪ ✪ ✪
App Download Campaign ✪ ✪ ✪ ✪
The pilot introduced summer pricing to the pricing treatment groups in June. For the Seasonal TOU with CPP group it was a month which also introduced them to CPP events. For the Super-Peak TOU pricing group it was a month which introduced them to Super-Peak TOU along with regular on-peak and off-peak TOU charges. Participants of these two-pricing treatment groups were aware of these changes by the start of the month. The first month had two CPP events and the participants received their notifications at least 24 hours in advance. The system delivered the notification by E-mail, SMS, push notification, and in app messaging.

109 © 2019 Publicis.Sapient. All rights reserved.
July 2018
Figure 79 July Communication Highlight
July 2018 was the first targeted communication month and when the Weekly Recap email was introduced for all the 3 treatment groups. More than 1200 participants received the Weekly Recap E-mail.
The pilot expected 4 CPP events this month, which is what occurred. These CPP events were on the 4th, 5th, 16th, and 26th. It was an interesting experience for the participants as the IESO called 2 consecutive CPP events for the 4th and 5th. In addition, there was a new engagement strategy, targeting participants with articles about ways to save. Finally, there was a Peak app download campaign, which introduced our users to Peak app and web portal.
August 2018
Figure 80 August Communication Highlight
Peak Campaign Calendar
Jul-18
1 2 3 4 5 6 7 8 9 10
11
12
13
14
15
16
17
18
19
20
21
22
23
24
25
26
27
28
29
30
31
CPP Communications
✪ ✪ ✪ ✪ ✪ ✪ ✪
Special Day Communications
✪
Weekly email communications
✪ ✪ ✪ ✪ ✪ ✪ ✪ ✪ ✪
Nudge to Save More
✪ ✪ ✪ ✪ ✪
App Download Campaign
✪ ✪ ✪ ✪ ✪
Peak Campaign Calendar
Aug-18
1 2 3 4 5 6 7 8 9 10
11
12
13
14
15
16
17
18
19
20
21
22
23
24
25
26
27
28
29
30
31
CPP Communications ✪ ✪ ✪ ✪ ✪ ✪ ✪
Weekly email communications ✪ ✪ ✪ ✪ ✪ ✪ ✪ ✪ ✪
Nudge to Save More ✪ ✪ ✪ ✪ ✪
App Download Campaign ✪ ✪ ✪ ✪
Summer Price Change Communication
✪

110 © 2019 Publicis.Sapient. All rights reserved.
In the month of August participants were getting engaged to the weekly recap emails, replies like “ Let this keep coming”, “Thank you for the feedback” and “ This is great info” makes it evident and highlights the effectiveness of such information to the user on weekly basis.
To keep the conservation and load shifting active, participants of individual peer groups received relevant ways to save action tips at definite interval all across the month on their Peak app. helping them to be on top of their usage.
As per pricing plan structure, Participants of Seasonal TOU with CPP were asked to help by conserving electricity during the four CPP events in this month, calling it an end of ten CPP events in the entire summer months.
End of this month also called for the end of summer pricing that two pricing treatment groups were on. Participants received this update saying No more CPP events until November, and they would be on Shoulder Peak pricing which is flat across the whole day whole month. For Super-Peak TOU group the update was around the end of Super-Peak TOU charge, and they would be moving into On-peak and Off-peak only TOU charges for the rest of the time in Pilot.
September 2018
Figure 81 September Communication Highlight
Moving into September, Participants were regularly receiving ways to save tips on the pre-planned dates and pre-decided groups to have high impact and lead to taking actions based on the tips.
The mid-pilot survey was also launched in this month as we were approaching six months into this pilot program. Reminders on taking up the survey were sent to participants of all the groups at pre-planned intervals.
Adding to this, programs like Affordability Fund Trust were also marketed to relevant participants who would be benefitted by this.
Also, participants were introduced to an additional feature of Peak app around getting their family on-boarded to using the app and save as a family. Every user was encouraged to get their additional family member added to the program, and by this, we did see a few interests popping up and taking advantage of this.
October 2018
Peak Campaign Calendar
Sep-18
1 2 3 4 5 6 7 8 9 10
11
12
13
14
15
16
17
18
19
20
21
22
23
24
25
26
27
28
29
30
Weekly email communications ✪ ✪ ✪ ✪ ✪ ✪ ✪ ✪
Nudge to Save More ✪ ✪ ✪ ✪ ✪ ✪ ✪ ✪
App Download Campaign ✪ ✪ ✪ ✪
Additional Family Member Campaign
✪ ✪
AFT (Affordability Fund Trust) Campaign
✪
Mid-Pilot survey ✪ ✪ ✪

111 © 2019 Publicis.Sapient. All rights reserved.
Figure 82 October Communication Highlight
October called for the end of six months into this pilot program for its participants. The mid-pilot survey was active, and participants were requested to take up and share their thoughts on the program.
However, this month also called for a Save On Energy Deal days program of which participants were informed to take advantage of utilizing the Peak app, to make it more engaging, the weekend of 13th and 20th participants were also provided a choice to meet directly with our representatives at retailers’ locations around Oshawa. This program was active from October 6th to November 5th.
Highlighting benefits of Affordability Fund Trust program was continued into this month too. Apart from this, users were treated with weekly recap emails with new tips for the upcoming winter seasons. Ways to save tips continued as a standard helping hand to relevant participants for a specific tip.
Peak Campaign Calendar
Oct-18
1 2 3 4 5 6 7 8 9 10
11
12
13
14
15
16
17
18
19
20
21
22
23
24
25
26
27
28
29
30
31
Weekly email communications ✪ ✪ ✪ ✪ ✪ ✪ ✪ ✪ ✪
Nudge to Save More ✪ ✪ ✪ ✪ ✪ ✪ ✪
App Download Campaign ✪ ✪ ✪ ✪ ✪
Additional Family Member Campaign
Save on Energy Deal Days ✪ ✪ ✪ ✪ ✪ ✪
AFT (Affordability Fund Trust) Campaign
✪
Mid-Pilot survey ✪ ✪ ✪ ✪ ✪ ✪ ✪ ✪ ✪

112 © 2019 Publicis.Sapient. All rights reserved.
J. Regression Raw Results Example:
In this section, we discuss how to interpret the hourly impact regression results. Because this study estimates hundreds of regression models, we only show a few sample examples to illustrate raw regression results.
In our first example, we show the regression results of a summer weekday at 4 PM in the figure below. The data used for the regression include both treatment and control groups under the seasonal TOU with CPP pricing plan during the summer season.
Figure 83 Regression results of a summer weekday at 4 PM
There are two groups of variables from the regression results.
The first group of variables includes SDP, Year, Month, and Cooling_THI. The pricing treatment has no relationship with these coefficients.
• SDP: SDP is the unique id used to identify a customer’s meter. Since the fixed effect is used for all customers, we hide the coefficients for all the fixed effects from the figure.
• Year: The year terms represent the annual consumption trend of each year in comparison to the year 2015. • Month: The month terms represent the monthly consumption trend in comparison of month June. • Cooling_THI: This term represents how energy consumption would change if the temperature increases by one
degree for an average customer. The positive sign of the coefficient shows that as the temperature increases, the energy consumption will also go up.
The second group of variables includes Treatment_post and Treatment_post_Cooling_THI. These two terms show how the pricing plan changes the energy consumption of a customer.
• Treatment_post: This term represents how the pricing plan changes the hourly consumption of an average enrolled customer. The negative sign shows that a customer under the seasonal TOU with CPP will consume less energy regardless of temperature changes.
• Treatment_post_Cooling_THI: This term represents the change of temperature sensitivity for customers under the pricing treatment. A negative sign shows that a customer’s energy consumption will be less sensitive to temperature raises under the new pricing plan.

113 © 2019 Publicis.Sapient. All rights reserved.
In the second example, we show the regression results of a summer weekday at 4 PM but under a different pricing plan. The data used for the regression include both treatment and control groups under the Super-Peak TOU plan during the summer season.
Figure 84 Regression results of a summer weekday at 4 PM under a second pricing plan
Similarly, there are two groups of variables from the regression results.
The first group of variables includes SDP, Year, Month, and Cooling_THI. The pricing treatment has no relationship with these coefficients, and they are the same as the previous regression model.
• SDP: SDP is the unique id used to identify a customer’s meter. Since the fixed effect is used for all customers, we hide the coefficients for all the fixed effects from the figure.
• Year: The year terms represents the annual consumption trend of each year in comparison to the year 2015. • Month: The month terms represents the monthly consumption trend in comparison of month June. • Cooling_THI: This term represents how energy consumption would change if the temperature increases by one
degree for an average customer. The positive sign of the coefficient shows that as the temperature increases, the energy consumption will also go up.
The second group of variables includes Treatment_post and Treatment_post_Cooling_THI. These two terms represent how the pricing plan changes the energy consumption of a customer.
• Treatment_post: This term represents how the pricing plan changes the hourly consumption of an average enrolled customer. The negative sign shows that customers under the Super-Peak TOU consume less energy regardless of temperature changes.
• Treatment_post_Cooling_THI: This term represents the change of temperature sensitivity for customers under the pricing treatment. A negative sign shows that a customer’s energy consumption will be less sensitive to temperature raises under the new pricing plan.
Please note that we ignored the Heating_THI variables in both summer impact studies. This is because, during the summer seasons, Heating_THI are mostly zeroes. Removing the heating terms will enhance the robustness of the regression models.