OSEP SPP/APR Online Submission Module - North Carolina · OSEP SPP/APR Online Submission Module...
44
OSEP SPP/APR Online Submission Module Part C Collection Tools Version 1.1 Released August 22, 2014
Transcript of OSEP SPP/APR Online Submission Module - North Carolina · OSEP SPP/APR Online Submission Module...

OSEP SPP/APR Online Submission Module Part C Collection Tools
Version 1.1
Released August 22, 2014
Preloaded historical data Prepopulated data from other sources Calculated
Explanatory text
v1.1 August 2014 2 Part C Indicator 1
Document Information
Title: Part C Collection Tools
Revision: Version 1.1
Issue Date: 8/22/2014
Filename: Part_C_Collection_Tools_v1.1
DOCUMENT HISTORY
Version Number
Date Summary of Change
1.0 8/21/2014 Initial Release
1.1 8/22/2014 Updates made as a result of discussion during 8/21/2014 release webinar.
Added introduction page
Added 100% targets to indicator 1 and 7
Corrected 8A, 8B, and 8C FFY 2013 data table, column three read ‘FFY 2012 Data’ updated to read FFY 2013 Data
Provided additional instruction for Y/N and check box questions.
Preloaded historical data Prepopulated data from other sources Calculated
Explanatory text
v1.1 August 2014 3 Part C Indicator 1
How to Read the Collection Tools
Fields in data tables can be prepopulated with data from other sources (EDFacts, eMAPS, etc), preloaded with data from previous SPP and APR submissions, calculated values, or blank fillable fields that will allow users to enter data. Cells throughout this document will be highlighted to indicate the type of field. White blank fields in data tables are fillable fields that allow users to enter data.
Preloaded historical data Prepopulated data from other sources Calculated
The system will have some built in business rules and calculations. This information is described in red italic font.
Explanatory text
Narrative fields will display as outlined boxes. These fields will accept rich text in the system.
Narrative field prompt
You will find a key at the bottom of each as you see in the footer of this page.

Preloaded historical data Prepopulated data from other sources Calculated
Explanatory text
v1.1 August 2014 4 Part C Indicator 1
Introduction
General Supervision System
The systems that are in place to ensure that IDEA Part C requirements are met, e.g., monitoring systems, dispute resolution systems.
The North Carolina Early Intervention Program’s general supervision system continues to function as previously described to OSEP. The program continues to implement components of the state’s web-based data system for monitoring purposes. Currently, child record review is the primary method for verifying the correction of noncompliance. The components of annual self-assessment, identification of noncompliance, correction of noncompliance, focused monitoring, data verification and desk audits continue as described in previous annual reports. Systemic noncompliance has been addressed across the state and procedures are in place to identify and correct individual instances of noncompliance.
CDSAs are required to complete child record review self-assessments annually. The EI Branch State Office collects self-assessment data at designated points and times each year for indicators 1, 7, 8a, 8b, and 8c. To continue to improve compliance in timeliness of services (Indicator 1), the State Office provides each CDSA with the names of all children enrolled in the program who had a new service added to their IFSP (newly enrolled children and children already receiving services) during a given month. To maintain compliance with transition indicators (Indicator 8 sub-components), the State Office provides the CDSAs with the names of all children who should have had a transition planning conference as of a specific date. Data are also collected to assure that: 1) there was a transition plan with steps and services in place; and 2) if a child was potentially eligible for preschool services, the Local Education Agency (LEA) and State Education Agency (SEA) were notified. Data and a data analysis report are submitted by each CDSA to the EI Branch State Office with reasons why any timeline is not being met and any unique data related to specifics regarding each individual child. Data verification occurs by the EI Branch State Office staff through an on-site verification visit.
If a finding is issued, the CDSA receives a written notification of the finding and a written corrective action plan within 30 days. Corrective Action Plans (CAPs) are issued when there is noncompliance and a finding is noted. Corrective action plans include strategies and required evidence of change. These CAPs are written by the EI Branch State Office staff in collaboration with the CDSAs. Required reporting occurs until noncompliance is corrected. The EI Branch verifies data throughout the CAP process to ensure the local program is correctly implementing the regulatory requirements of IDEA, correcting any child specific instances (although late), unless the child is not enrolled in the NC EI Program, and that the root cause of noncompliance has been addressed.
The CDSAs have an opportunity to correct noncompliance prior to the issuance of a written notification of a finding. The CDSA must provide updated data that demonstrates 1) CDSA is correctly implementing the specific regulatory requirements (i.e., achieved 100% compliance) based on a review of updated data and 2) CDSA has corrected each individual case of noncompliance, unless the child is no longer within the jurisdiction of the EI program, consistent with OSEP Memo 09-02. The EI Branch State Office staff verifies (through record reviews) that correction has occurred for both of these steps.
Improvement plans may be issued during monitoring activities. Improvement plans are generally related to performance and include measurable benchmarks over time. Improvement plan strategies and activities are written by the CDSA in partnership with or with direct guidance from the Early Intervention Branch State Office.
Throughout the year, activities are completed by the EI Branch State Office to verify the reliability, accuracy and timeliness of data reported by the CDSAs. Several methods for data verification are utilized, such as error reports, routine data reports, data reports summarizing contract performance and on-site data verification visits. Point in time data are routinely provided to CDSAs to ensure reliable, valid data for 619 data reporting.
Whenever a parent has a concern or disagreement related to their child’s early intervention services, the director of the Children’s Developmental Services Agency, or his designee, must immediately contact the parent and attempt to

Preloaded historical data Prepopulated data from other sources Calculated
Explanatory text
v1.1 August 2014 5 Part C Indicator 1
resolve the concern or disagreement informally through discussion and negotiation. CDSAs may consult with the Early Intervention Branch State Office, if necessary, during these informal negotiations with a parent. If agreement cannot be reached during this contact, the parent must be advised of the availability of and the procedure for requesting formal complaint resolution, including mediation and administrative due process hearing. Service Coordinators and other service providers are responsible also for informing parents of the availability of and the procedures for requesting formal complaint resolution. Additionally, an EI Branch State Office Consultant is assigned to coordinate all formal complaints.
Technical Assistance System
The mechanisms that the State has in place to ensure the timely delivery of high quality, evidenced based technical assistance and support to early intervention service (EIS) programs.
For FFY 2013, the State continued technical assistance (TA) activities for implementing the new IDEA regulations discussed in the FFY 2012 APR. The State’s policies and procedures were revised to reflect the new regulations. Training modules were developed and on-site technical assistance provided to the CDSAs to ensure consistent application of the new procedures. Full-scale implementation was completed January 1, 2014.
In many instances, opportunities to provide technical assistance arise from activities discussed as part of the General Supervision system – self-assessment, focused monitoring and data verification. TA is often a component of the Corrective Action Plan for CDSAs with findings of non-compliance, or improvement plans where performance issues have been identified. The regional consultants assigned to each CDSA assist with the technical assistance required by these plans, as well as supporting the CDSAs in identifying other local training needs. At the State Office level, a state-wide Planning and TA team is responsible for identifying more global training needs and developing training materials. The statewide Planning and TA Team develops and distributes information, TA tools, and training on topics and trends identified by the regional consultants as being prevalent statewide (and not specific to a specific CDSA or region) in order to clarify policies and procedures that should be applied consistently statewide, across all CDSAs.
During FFY 2013, the NC EI Program also continued its work on integrating child outcomes measurement with the complete early intervention process, from referral to transition/exit. The NC EI Program identified two CDSAs, serving a total of 13 counties, to pilot this effort. As part of the intensive TA provided to the pilots through the State Office, the pilots identified local implementation teams and used an implementation science framework to plan the communication, training, and logistics of integrating child outcomes measurement with the IFSP process locally. Feedback, questions, and other information are collected regularly from those directly involved in planning and implementation. This information is not only being used at the local level to assure quality and fidelity; it is also being used by state office staff to develop training materials and TA tools to prepare all CDSAs for state-wide implementation.
Professional Development System
The mechanisms the State has in place to ensure that service providers are effectively providing services that improve results for infants and toddlers with disabilities and their families.
The North Carolina EI program has a certification program for early intervention service providers. This certification requirement applies to early intervention service coordinators and providers of special instruction services. Continuing professional development of 10 contact hours (1.0 CEU) is required annually for all certificate holders. Contact hours/CEU credits must focus on infants and toddlers with or without disabilities, and their families. The Certificate is obtained at employment with a CDSA or CDSA-enrolled community based provider, and maintained throughout employment.
The NC EI program encourages staff and providers to stay abreast of evidence based practices in early childhood intervention. To that end, the NC EI program maintains a list of credible organizations and businesses that provide evidence based trainings that are relevant to infants and toddlers with or without disabilities, and their families. This list

Preloaded historical data Prepopulated data from other sources Calculated
Explanatory text
v1.1 August 2014 6 Part C Indicator 1
is updated quarterly and posted on the NC EI website. The NC EI program also develops and offers training opportunities as needs are identified.
CDSAs are responsible for ensuring that staff meet the continuing education requirement for Infant-Toddler certification, along with other specialized professional certifications. Service providers not employed at CDSAs (community direct service providers) are responsible for ensuring that their staff meet the requirement. Continuing education information for CDSA staff and community providers is provided to the Early Intervention State Office by the CDSAs, with periodic on-site document review to ensure the data provided are accurate.
CDSAs also periodically monitor direct service providers in their catchment areas through meetings, review of provider service notes and observations in natural environment settings. These methods are used to assure services are being delivered as noted in the IFSP and to gather information on how effective the interventions are at improving results for infants and toddlers and their families in the program. Targeted follow up technical assistance and training are given to providers, as needed, based on information gathered through observations and meetings.
Stakeholder Involvement
The mechanism for soliciting broad stakeholder input on targets in the SPP, including revisions to targets.
The NC EI Program continues to value and obtain broad input from several different stakeholder groups on a continuing basis. For the SPP/APR, the NC Interagency Coordinating Council (ICC) serves as the primary advisory board and provided feedback at a meeting held in October 2014, review of proposed targets in December 2014, and approval of final report in January 2015. The ICC, local lead agencies, providers, State Systemic Improvement Plan (SSIP) planning team members, and other stakeholders were provided with APR historical data trends over time, graphic representation of outcomes, analyses related to mean performance, and comparisons of the NC EI Program data to other states and territories. An online survey was also distributed broadly to stakeholders in order to seek input on the proposed targets. This information allowed for discussion of proposed targets and provided a mechanism for feedback from stakeholders.
Reporting to the Public
How the State will report annually to the public on the performance of EIS program or provider located in the State on the targets in the SPP/APR as soon as practicable, but not later than 120 days following the State’s submission of its APR as required by 34 CFR §303.702(b)(1)(i)(A).
The NC EI Program will disseminate the Annual Performance Report to stakeholders through the local lead agencies and post it on the program’s website (www.beearly.nc.gov /publications).
Preloaded historical data Prepopulated data from other sources Calculated
Explanatory text
v1.1 August 2014 7 Part C Indicator 1
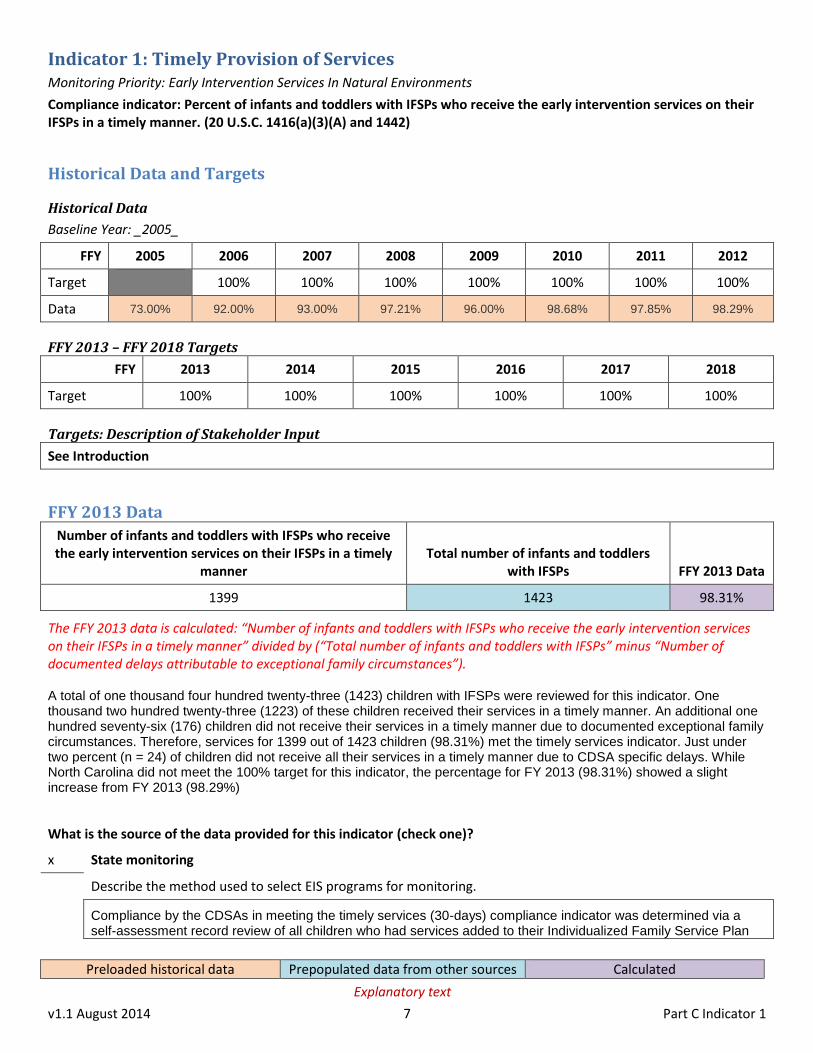
Indicator 1: Timely Provision of Services Monitoring Priority: Early Intervention Services In Natural Environments
Compliance indicator: Percent of infants and toddlers with IFSPs who receive the early intervention services on their IFSPs in a timely manner. (20 U.S.C. 1416(a)(3)(A) and 1442)
Historical Data and Targets
Historical Data
Baseline Year: _2005_
FFY 2005 2006 2007 2008 2009 2010 2011 2012
Target 100% 100% 100% 100% 100% 100% 100%
Data 73.00% 92.00% 93.00% 97.21% 96.00% 98.68% 97.85% 98.29%
FFY 2013 – FFY 2018 Targets
FFY 2013 2014 2015 2016 2017 2018
Target 100% 100% 100% 100% 100% 100%
Targets: Description of Stakeholder Input
See Introduction
FFY 2013 Data
Number of infants and toddlers with IFSPs who receive the early intervention services on their IFSPs in a timely
manner Total number of infants and toddlers
with IFSPs FFY 2013 Data
1399 1423 98.31%
The FFY 2013 data is calculated: “Number of infants and toddlers with IFSPs who receive the early intervention services on their IFSPs in a timely manner” divided by (“Total number of infants and toddlers with IFSPs” minus “Number of documented delays attributable to exceptional family circumstances”). A total of one thousand four hundred twenty-three (1423) children with IFSPs were reviewed for this indicator. One thousand two hundred twenty-three (1223) of these children received their services in a timely manner. An additional one hundred seventy-six (176) children did not receive their services in a timely manner due to documented exceptional family circumstances. Therefore, services for 1399 out of 1423 children (98.31%) met the timely services indicator. Just under two percent (n = 24) of children did not receive all their services in a timely manner due to CDSA specific delays. While North Carolina did not meet the 100% target for this indicator, the percentage for FY 2013 (98.31%) showed a slight increase from FY 2013 (98.29%)
What is the source of the data provided for this indicator (check one)?
x State monitoring
Describe the method used to select EIS programs for monitoring.
Compliance by the CDSAs in meeting the timely services (30-days) compliance indicator was determined via a self-assessment record review of all children who had services added to their Individualized Family Service Plan
Preloaded historical data Prepopulated data from other sources Calculated
Explanatory text
v1.1 August 2014 8 Part C Indicator 1
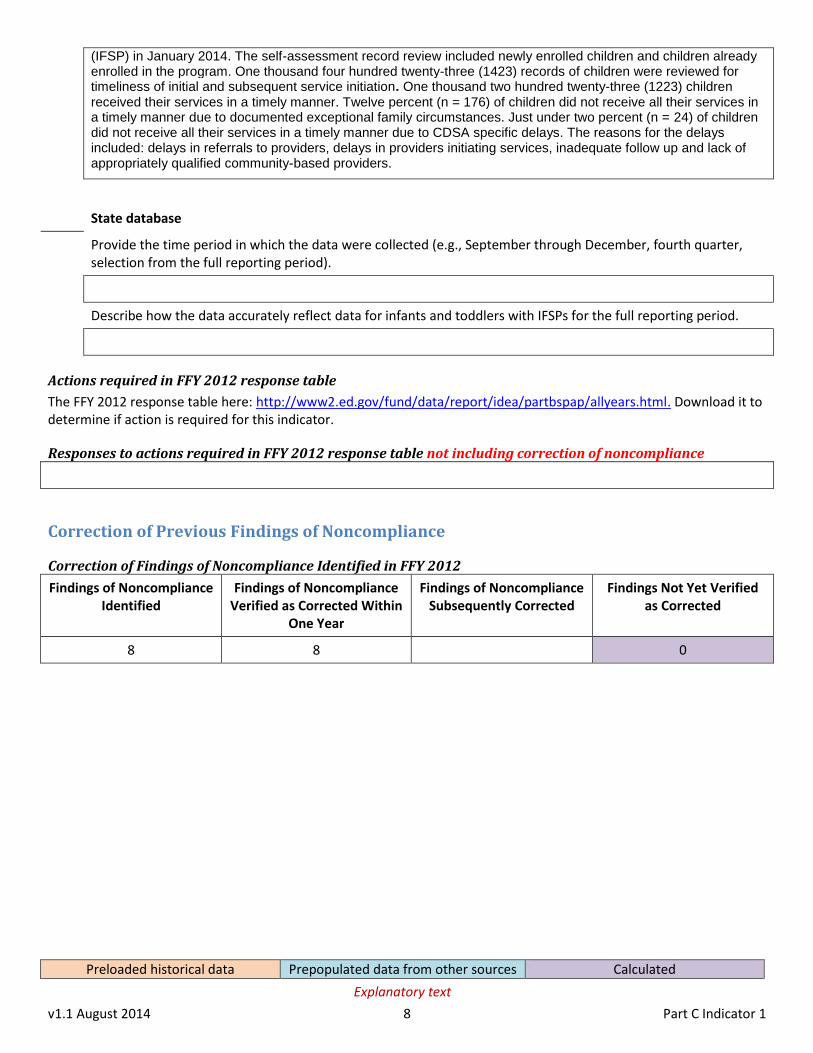
(IFSP) in January 2014. The self-assessment record review included newly enrolled children and children already enrolled in the program. One thousand four hundred twenty-three (1423) records of children were reviewed for timeliness of initial and subsequent service initiation. One thousand two hundred twenty-three (1223) children received their services in a timely manner. Twelve percent (n = 176) of children did not receive all their services in a timely manner due to documented exceptional family circumstances. Just under two percent (n = 24) of children did not receive all their services in a timely manner due to CDSA specific delays. The reasons for the delays included: delays in referrals to providers, delays in providers initiating services, inadequate follow up and lack of appropriately qualified community-based providers.
State database
Provide the time period in which the data were collected (e.g., September through December, fourth quarter, selection from the full reporting period).
Describe how the data accurately reflect data for infants and toddlers with IFSPs for the full reporting period.
Actions required in FFY 2012 response table
The FFY 2012 response table here: http://www2.ed.gov/fund/data/report/idea/partbspap/allyears.html. Download it to determine if action is required for this indicator.
Responses to actions required in FFY 2012 response table not including correction of noncompliance
Correction of Previous Findings of Noncompliance
Correction of Findings of Noncompliance Identified in FFY 2012
Findings of Noncompliance Identified
Findings of Noncompliance Verified as Corrected Within
One Year
Findings of Noncompliance Subsequently Corrected
Findings Not Yet Verified as Corrected
8 8 0
Preloaded historical data Prepopulated data from other sources Calculated
Explanatory text
v1.1 August 2014 9 Part C Indicator 1
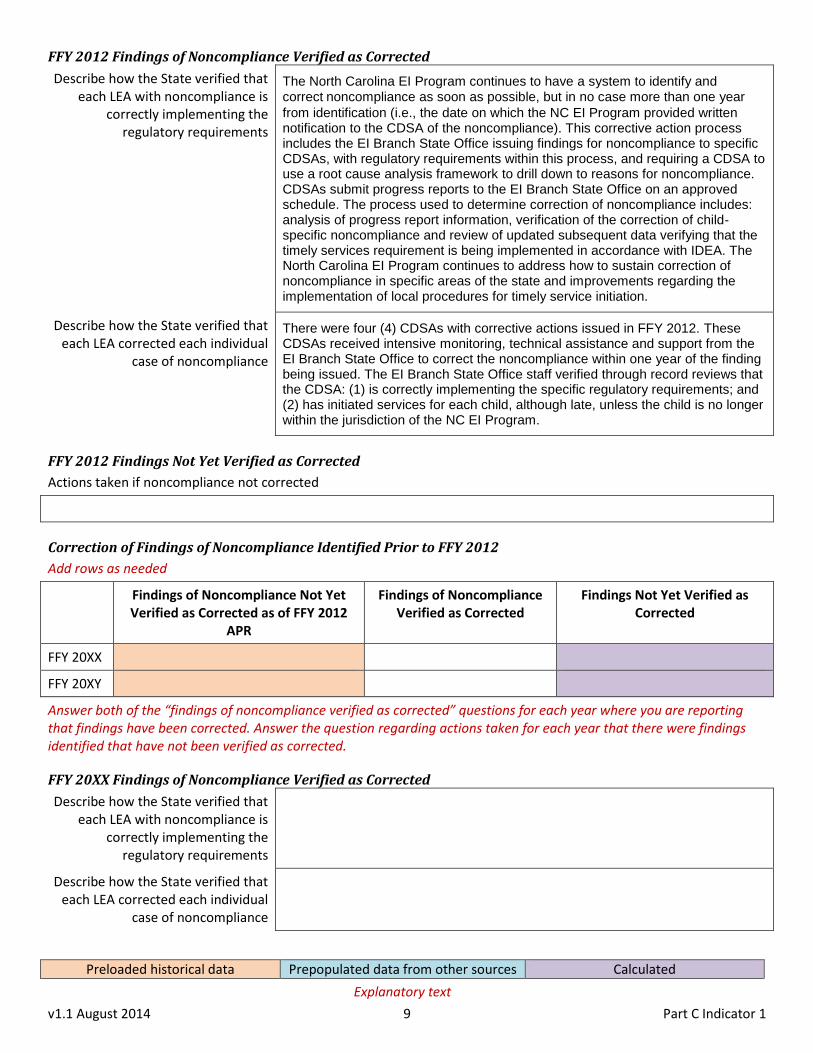
FFY 2012 Findings of Noncompliance Verified as Corrected
Describe how the State verified that each LEA with noncompliance is
correctly implementing the regulatory requirements
The North Carolina EI Program continues to have a system to identify and correct noncompliance as soon as possible, but in no case more than one year
from identification (i.e., the date on which the NC EI Program provided written notification to the CDSA of the noncompliance). This corrective action process includes the EI Branch State Office issuing findings for noncompliance to specific CDSAs, with regulatory requirements within this process, and requiring a CDSA to use a root cause analysis framework to drill down to reasons for noncompliance. CDSAs submit progress reports to the EI Branch State Office on an approved schedule. The process used to determine correction of noncompliance includes: analysis of progress report information, verification of the correction of child-specific noncompliance and review of updated subsequent data verifying that the timely services requirement is being implemented in accordance with IDEA. The North Carolina EI Program continues to address how to sustain correction of noncompliance in specific areas of the state and improvements regarding the implementation of local procedures for timely service initiation.
Describe how the State verified that each LEA corrected each individual
case of noncompliance
There were four (4) CDSAs with corrective actions issued in FFY 2012. These CDSAs received intensive monitoring, technical assistance and support from the EI Branch State Office to correct the noncompliance within one year of the finding being issued. The EI Branch State Office staff verified through record reviews that the CDSA: (1) is correctly implementing the specific regulatory requirements; and (2) has initiated services for each child, although late, unless the child is no longer within the jurisdiction of the NC EI Program.
FFY 2012 Findings Not Yet Verified as Corrected
Actions taken if noncompliance not corrected
Correction of Findings of Noncompliance Identified Prior to FFY 2012
Add rows as needed
Findings of Noncompliance Not Yet Verified as Corrected as of FFY 2012
APR
Findings of Noncompliance Verified as Corrected
Findings Not Yet Verified as Corrected
FFY 20XX
FFY 20XY
Answer both of the “findings of noncompliance verified as corrected” questions for each year where you are reporting that findings have been corrected. Answer the question regarding actions taken for each year that there were findings identified that have not been verified as corrected.
FFY 20XX Findings of Noncompliance Verified as Corrected
Describe how the State verified that each LEA with noncompliance is
correctly implementing the regulatory requirements
Describe how the State verified that each LEA corrected each individual
case of noncompliance

Preloaded historical data Prepopulated data from other sources Calculated
Explanatory text
v1.1 August 2014 10 Part C Indicator 1
FFY 20XY Findings Not Yet Verified as Corrected
Actions taken if noncompliance not corrected

Preloaded historical data Prepopulated data from other sources Calculated
Explanatory text
v1.1 August 2014 11 Part C Indicator 2
Indicator 2: Services in Natural Environments Monitoring Priority: Early Intervention Services In Natural Environments
Results indicator: Percent of infants and toddlers with IFSPs who primarily receive early intervention services in the home or community-based settings. (20 U.S.C. 1416(a)(3)(A) and 1442)
Historical Data and Targets
Historical Data
Baseline Year: _2005_
FFY 2005 2006 2007 2008 2009 2010 2011 2012
Target ≥ 96.5% 96.5% 97% 97.5% 98% 98% 98%
Data 97.00% 98.50% 98.90% 99.00% 99.00% 98.00% 98.50% 99.20%
FFY 2013 – FFY 2018 Targets
FFY 2013 2014 2015 2016 2017 2018
Target ≥ 98.00% 98.50% 98.50% 98.50% 98.50% 98.50%
Targets: Description of Stakeholder Input
See Introduction
FFY 2013 Data
Number of infants and toddlers with IFSPs who primarily receive early intervention services in the home or
community-based settings Total number of infants and toddlers with
IFSPs FFY 2013
Data
10148 10190 99.59%
FFY 2013 data is calculated: “Number of infants and toddlers with IFSPs who primarily receive early intervention services in the home or community-based settings” divided by “Total number of infants and toddlers with IFSPs” Data for this indicator is gathered from North Carolina’s statewide Health Information System (HIS) database. Data for FY 2013 was collected on all children on the December 1, 2013 headcount. Of the 10,190 children reviewed, 42 (0.4%) did not received services in the home or a community-based setting. The 99.6% of children who did received services in the home or community based setting is well above the State’s target of 98%.
Preloaded historical data Prepopulated data from other sources Calculated
Explanatory text
v1.1 August 2014 12 Part C Indicator 2
Required Actions
Actions required in FFY 2012 response table
The FFY 2012 response table here: http://www2.ed.gov/fund/data/report/idea/partbspap/allyears.html. Download it to determine if action is required for this indicator.
Responses to actions required in FFY 2012 response table

Preloaded historical data Prepopulated data from other sources Calculated
Explanatory text
v1.1 August 2014 13 Part C Indicator 3
Indicator 3: Early Childhood Outcomes Monitoring Priority: Early Intervention Services In Natural Environments
Results indicator: Percent of infants and toddlers with IFSPs who demonstrate improved:
A. Positive social-emotional skills (including social relationships); B. Acquisition and use of knowledge and skills (including early language/ communication); and C. Use of appropriate behaviors to meet their needs.
(20 U.S.C. 1416(a)(3)(A) and 1442)
Historical Data and Targets
Historical Data Baseline
Year FFY 2005 2006 2007 2008 2009 2010 2011 2012
A1 2008
Target ≥
71.20% 73.50% 73.50%
73.50%
Data 72.90% 72.30% 70.60% 69.20% 71.90%
A2 2008 Target ≥ 57.90% 59.60% 59.60% 59.60%
Data 59.00% 60.50% 61.30% 59.90% 62.00%
B1 2008 Target ≥ 76.40% 80.00% 80.00% 80.00%
Data 79.50% 77.70% 77.60% 77.40% 79.00%
B2 2008 Target ≥ 49.60% 51.10% 51.10% 51.10%
Data 50.50% 51.10% 51.30% 50.90% 53.30%
C1 2008 Target ≥ 75.20% 78.00% 78.00% 78.00%
Data 77.60% 77.70% 76.50% 75.50% 78.30%
C2 2008 Target ≥ 56.00% 57.80% 57.80% 57.80%
Data 57.20% 58.20% 59.30% 58.40% 60.50%
FFY 2013 – FFY 2018 Targets
FFY 2013 2014 2015 2016 2017 2018
Target A1 ≥ 73.50% 73.50% 73.50% 73.50% 73.50% 74.00%
Target A2 ≥ 59.60% 60.00% 60.00% 60.50% 60.50% 61.00%
Target B1 ≥ 80.00% 80.00% 80.00% 80.00% 80.00% 80.50%
Target B2 ≥ 51.10% 51.10% 51.40% 51.40% 51.40% 52.00%
Target C1 ≥ 78.00% 78.00% 78.00% 78.20% 78.20% 78.40%
Target C2 ≥ 57.80% 58.00% 58.00% 58.50% 58.60% 58.60%
Targets: Description of Stakeholder Input
See Introduction

Preloaded historical data Prepopulated data from other sources Calculated
Explanatory text
v1.1 August 2014 14 Part C Indicator 3
FFY 2013 Data
Number of infants and toddlers with IFSPs assessed 6250
If the State’s Part C eligibility criteria include infants and toddlers who are at risk of having substantial developmental delays (or “at-risk infants and toddlers”) under IDEA section 632(5)(B)(i), provide the numbers of all eligible children but exclude at-risk infants and toddlers (i.e., include just those infants and toddlers experiencing developmental delay (or “developmentally delayed children”) or having a diagnosed physical or mental condition that has a high probability of resulting in developmental delay (or “children with diagnosed conditions”). Complete the FFY 2013 Data (At Risk Infants and Toddlers) section for this indicator.
Outcome A: Positive social-emotional skills (including social relationships)
Number of children
a. Infants and toddlers who did not improve functioning 25
b. Infants and toddlers who improved functioning but not sufficient to move nearer to functioning comparable to same-aged peers 1141
c. Infants and toddlers who improved functioning to a level nearer to same-aged peers but did not reach it 1172
d. Infants and toddlers who improved functioning to reach a level comparable to same-aged peers 2001
e. Infants and toddlers who maintained functioning at a level comparable to same-aged peers 1911
Numerator Denominator
FFY 2013 Data
A1. Of those children who entered or exited the program below age expectations in Outcome A, the percent who substantially increased their rate of growth by the time they turned 3 years of age or exited the program
Expected calculation: (c+d)/(a+b+c+d)
3173 4339
73.13%
A2. The percent of infants and toddlers who were functioning within age expectations in each Outcome by the time they turned 3 years of age or exited the program
Expected calculation: (d+e)/(a+b+c+d+e)
3912 6250
62.59%
Explain your different calculation methodology, if applicable
Outcome B: Acquisition and use of knowledge and skills (including early language/communication)
Number of Children
a. Infants and toddlers who did not improve functioning 18
b. Infants and toddlers who improved functioning but not sufficient to move nearer to functioning comparable to same-aged peers 1154

Preloaded historical data Prepopulated data from other sources Calculated
Explanatory text
v1.1 August 2014 15 Part C Indicator 3
Number of Children
c. Infants and toddlers who improved functioning to a level nearer to same-aged peers but did not reach it 1716
d. Infants and toddlers who improved functioning to reach a level comparable to same-aged peers 2641
e. Infants and toddlers who maintained functioning at a level comparable to same-aged peers 721
Numerator Denominator
FFY 2013 Data
B1. Of those children who entered or exited the program below age expectations in Outcome A, the percent who substantially increased their rate of growth by the time they turned 3 years of age or exited the program
Expected calculation: (c+d)/(a+b+c+d)
4357 5529
78.80%
B2. The percent of infants and toddlers who were functioning within age expectations in each Outcome by the time they turned 3 years of age or exited the program
Expected calculation: (d+e)/(a+b+c+d+e)
3362 6250
53.79%
Explain your different calculation methodology, if applicable
Outcome C: Use of appropriate behaviors to meet their needs
Number of Children
a. Infants and toddlers who did not improve functioning 19
b. Infants and toddlers who improved functioning but not sufficient to move nearer to functioning comparable to same-aged peers 1077
c. Infants and toddlers who improved functioning to a level nearer to same-aged peers but did not reach it 1334
d. Infants and toddlers who improved functioning to reach a level comparable to same-aged peers 2773
e. Infants and toddlers who maintained functioning at a level comparable to same-aged peers 1047

Preloaded historical data Prepopulated data from other sources Calculated
Explanatory text
v1.1 August 2014 16 Part C Indicator 3
Numerator Denominator
FFY 2013 Data
C1. Of those children who entered or exited the program below age expectations in Outcome A, the percent who substantially increased their rate of growth by the time they turned 3 years of age or exited the program
Expected calculation: (c+d)/(a+b+c+d)
4107 5203
78.94%
C2. The percent of infants and toddlers who were functioning within age expectations in each Outcome by the time they turned 3 years of age or exited the program
Expected calculation: (d+e)/(a+b+c+d+e)
3820 6250
61.12%
Explain your different calculation methodology, if applicable
FFY 2013 child outcomes data indicate that the NC Early Intervention Program is continuing to make progress towards meeting its statewide targets. For Summary Statement 1, the agency met the target for Outcome C, and was within 1.2 percentage points of meeting the targets for the remaining outcomes. For Summary Statement 2, targets were met for all outcomes.
Summary Statements Statewide
Target Actual FFY
2012
Actual FFY 2013
Outcome A: Positive social-emotional skills (including social relationships)
1. Of those children who entered or exited the program below age expectations in Outcome A, the percent who substantially increased their rate of growth by the time they exited the program
73.50%
71.9%
73.13%
2. The percent of children who were functioning within age expectations in Outcome A by the time they exited the program
59.60%
62.0%
62.59%
Outcome B: Acquisition and use of knowledge and skills (including early language/communication and early literacy)
1. Of those children who entered or exited the program below age expectations in Outcome B, the percent who substantially increased their rate of growth by the time they exited the program
80.00%
79.0%
78.80%
2. The percent of children who were functioning within age expectations in Outcome B by the time they exited the program
51.10%
53.3%
53.79%
Outcome C: Use of appropriate behaviors to meet their needs
1. Of those children who entered or exited the program below age expectations in Outcome C, the percent who substantially increased their rate of growth by the time they exited the program
78.00%
78.3%
78.94%
Preloaded historical data Prepopulated data from other sources Calculated
Explanatory text
v1.1 August 2014 17 Part C Indicator 3
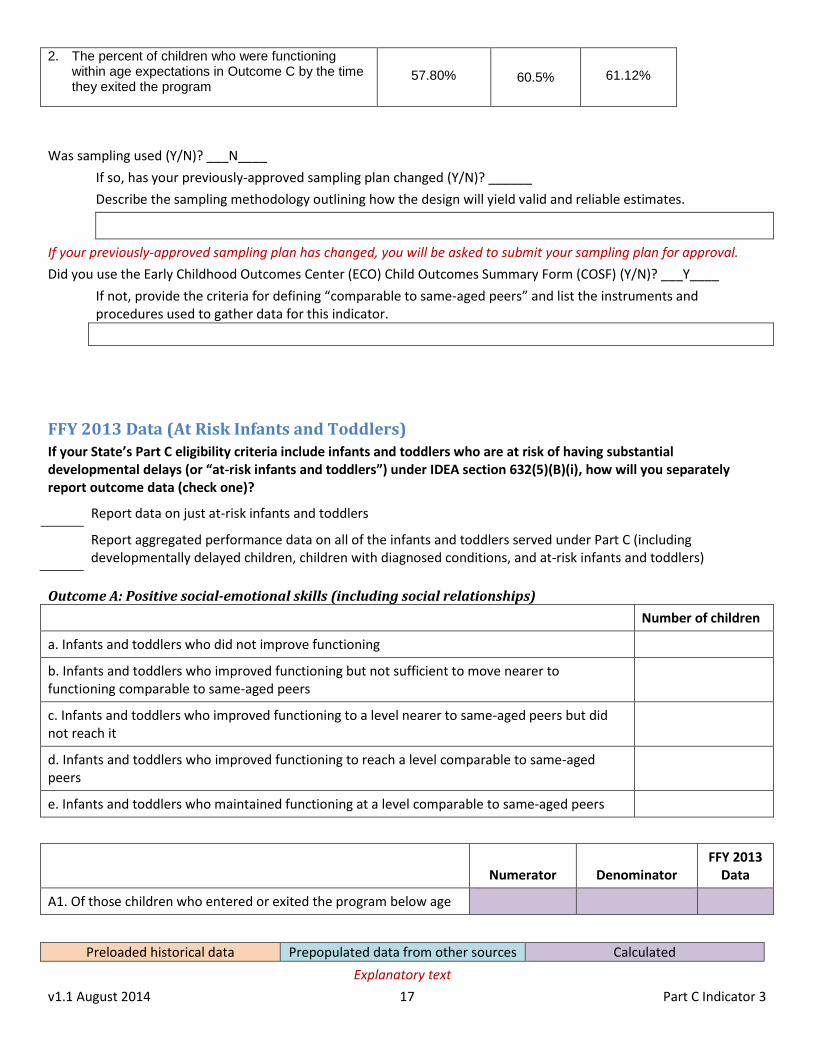
2. The percent of children who were functioning within age expectations in Outcome C by the time they exited the program
57.80%
60.5%
61.12%
Was sampling used (Y/N)? ___N____
If so, has your previously-approved sampling plan changed (Y/N)? ______
Describe the sampling methodology outlining how the design will yield valid and reliable estimates.
If your previously-approved sampling plan has changed, you will be asked to submit your sampling plan for approval.
Did you use the Early Childhood Outcomes Center (ECO) Child Outcomes Summary Form (COSF) (Y/N)? ___Y____
If not, provide the criteria for defining “comparable to same-aged peers” and list the instruments and procedures used to gather data for this indicator.
FFY 2013 Data (At Risk Infants and Toddlers)
If your State’s Part C eligibility criteria include infants and toddlers who are at risk of having substantial developmental delays (or “at-risk infants and toddlers”) under IDEA section 632(5)(B)(i), how will you separately report outcome data (check one)?
Report data on just at-risk infants and toddlers
Report aggregated performance data on all of the infants and toddlers served under Part C (including developmentally delayed children, children with diagnosed conditions, and at-risk infants and toddlers)
Outcome A: Positive social-emotional skills (including social relationships)
Number of children
a. Infants and toddlers who did not improve functioning
b. Infants and toddlers who improved functioning but not sufficient to move nearer to functioning comparable to same-aged peers
c. Infants and toddlers who improved functioning to a level nearer to same-aged peers but did not reach it
d. Infants and toddlers who improved functioning to reach a level comparable to same-aged peers
e. Infants and toddlers who maintained functioning at a level comparable to same-aged peers
Numerator Denominator
FFY 2013 Data
A1. Of those children who entered or exited the program below age
Preloaded historical data Prepopulated data from other sources Calculated
Explanatory text
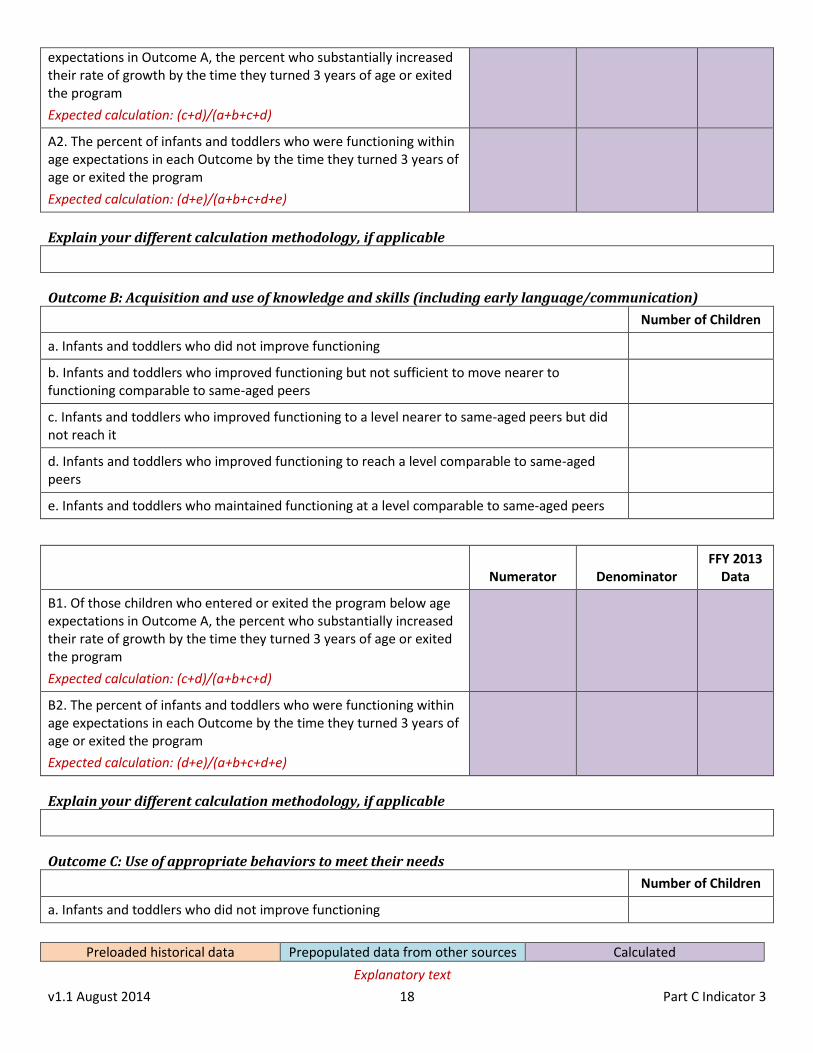
v1.1 August 2014 18 Part C Indicator 3
expectations in Outcome A, the percent who substantially increased their rate of growth by the time they turned 3 years of age or exited the program
Expected calculation: (c+d)/(a+b+c+d)
A2. The percent of infants and toddlers who were functioning within age expectations in each Outcome by the time they turned 3 years of age or exited the program
Expected calculation: (d+e)/(a+b+c+d+e)
Explain your different calculation methodology, if applicable
Outcome B: Acquisition and use of knowledge and skills (including early language/communication)
Number of Children
a. Infants and toddlers who did not improve functioning
b. Infants and toddlers who improved functioning but not sufficient to move nearer to functioning comparable to same-aged peers
c. Infants and toddlers who improved functioning to a level nearer to same-aged peers but did not reach it
d. Infants and toddlers who improved functioning to reach a level comparable to same-aged peers
e. Infants and toddlers who maintained functioning at a level comparable to same-aged peers
Numerator Denominator
FFY 2013 Data
B1. Of those children who entered or exited the program below age expectations in Outcome A, the percent who substantially increased their rate of growth by the time they turned 3 years of age or exited the program
Expected calculation: (c+d)/(a+b+c+d)
B2. The percent of infants and toddlers who were functioning within age expectations in each Outcome by the time they turned 3 years of age or exited the program
Expected calculation: (d+e)/(a+b+c+d+e)
Explain your different calculation methodology, if applicable
Outcome C: Use of appropriate behaviors to meet their needs
Number of Children
a. Infants and toddlers who did not improve functioning

Preloaded historical data Prepopulated data from other sources Calculated
Explanatory text
v1.1 August 2014 19 Part C Indicator 3
b. Infants and toddlers who improved functioning but not sufficient to move nearer to functioning comparable to same-aged peers
c. Infants and toddlers who improved functioning to a level nearer to same-aged peers but did not reach it
d. Infants and toddlers who improved functioning to reach a level comparable to same-aged peers
e. Infants and toddlers who maintained functioning at a level comparable to same-aged peers
Numerator Denominator
FFY 2013 Data
C1. Of those children who entered or exited the program below age expectations in Outcome A, the percent who substantially increased their rate of growth by the time they turned 3 years of age or exited the program
Expected calculation: (c+d)/(a+b+c+d)
C2. The percent of infants and toddlers who were functioning within age expectations in each Outcome by the time they turned 3 years of age or exited the program
Expected calculation: (d+e)/(a+b+c+d+e)
Explain your different calculation methodology, if applicable
Required Actions
Actions required in FFY 2012 response table
The FFY 2012 response table here: http://www2.ed.gov/fund/data/report/idea/partbspap/allyears.html. Download it to determine if action is required for this indicator.
Responses to actions required in FFY 2012 response table The State must report progress data and actual target data for FFY 2013 in the FFY 2013 APR. See additional info provided for FFY 2013 data
Preloaded historical data Prepopulated data from other sources Calculated
Explanatory text
v1.1 August 2014 20 Part C Indicator 4
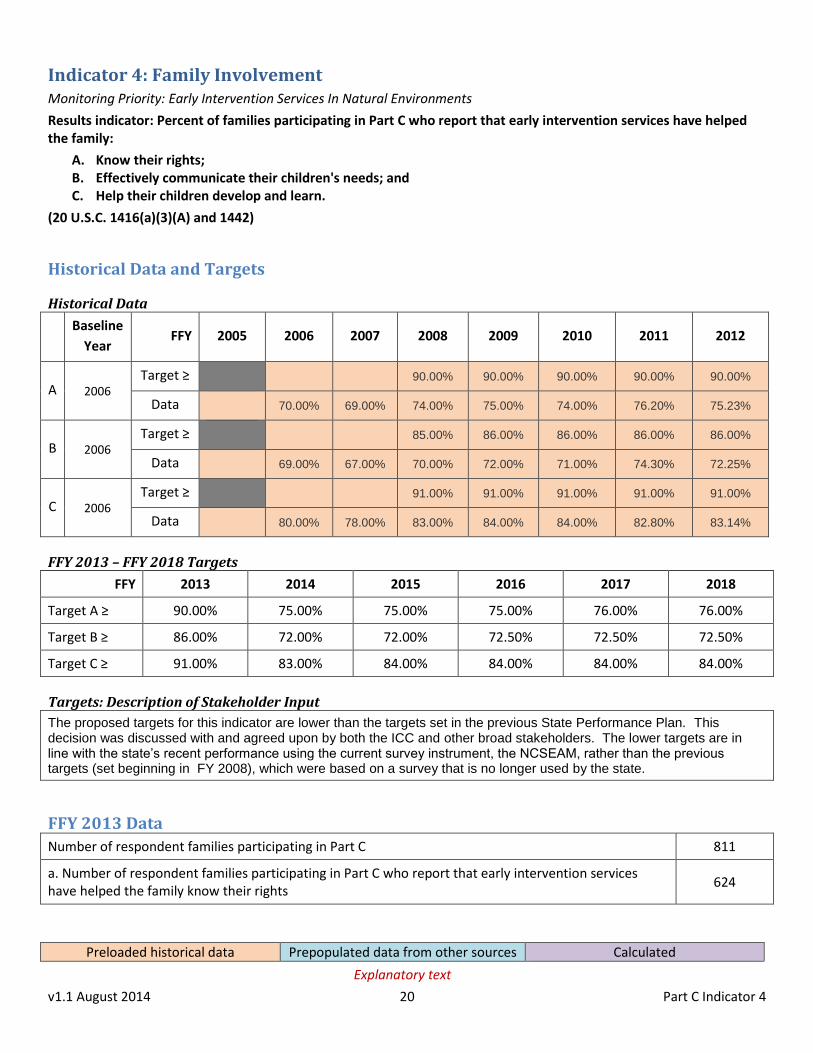
Indicator 4: Family Involvement Monitoring Priority: Early Intervention Services In Natural Environments
Results indicator: Percent of families participating in Part C who report that early intervention services have helped the family:
A. Know their rights; B. Effectively communicate their children's needs; and C. Help their children develop and learn.
(20 U.S.C. 1416(a)(3)(A) and 1442)
Historical Data and Targets
Historical Data
Baseline
Year FFY 2005 2006 2007 2008 2009 2010 2011 2012
A 2006 Target ≥ 90.00% 90.00% 90.00% 90.00% 90.00%
Data 70.00% 69.00% 74.00% 75.00% 74.00% 76.20% 75.23%
B 2006 Target ≥ 85.00% 86.00% 86.00% 86.00% 86.00%
Data 69.00% 67.00% 70.00% 72.00% 71.00% 74.30% 72.25%
C 2006 Target ≥ 91.00% 91.00% 91.00% 91.00% 91.00%
Data 80.00% 78.00% 83.00% 84.00% 84.00% 82.80% 83.14%
FFY 2013 – FFY 2018 Targets
FFY 2013 2014 2015 2016 2017 2018
Target A ≥ 90.00% 75.00% 75.00% 75.00% 76.00% 76.00%
Target B ≥ 86.00% 72.00% 72.00% 72.50% 72.50% 72.50%
Target C ≥ 91.00% 83.00% 84.00% 84.00% 84.00% 84.00%
Targets: Description of Stakeholder Input
The proposed targets for this indicator are lower than the targets set in the previous State Performance Plan. This decision was discussed with and agreed upon by both the ICC and other broad stakeholders. The lower targets are in line with the state’s recent performance using the current survey instrument, the NCSEAM, rather than the previous targets (set beginning in FY 2008), which were based on a survey that is no longer used by the state.
FFY 2013 Data
Number of respondent families participating in Part C 811
a. Number of respondent families participating in Part C who report that early intervention services have helped the family know their rights
624

Preloaded historical data Prepopulated data from other sources Calculated
Explanatory text
v1.1 August 2014 21 Part C Indicator 4
b. Number of respondent families participating in Part C who report that early intervention services have helped the family effectively communicate their children's needs
600
c. Number of respondent families participating in Part C who report that early intervention services have helped the family help their children develop and learn
691
FFY 2013 Data
A. Percent of families participating in Part C who report that early intervention services have helped the family know their rights
(a divided by the number of respondent families participating in Part C)
76.94%
B. Percent of families participating in Part C who report that early intervention services have helped the family effectively communicate their children's needs
(b divided by the number of respondent families participating in Part C)
73.98%
C. Percent of families participating in Part C who report that early intervention services have helped the family help their children develop and learn
(c divided by the number of respondent families participating in Part C)
85.20%
For FFY 2013, family outcomes data indicate that the NC Early Intervention Program is continuing to make progress towards meeting its statewide targets. The agency improved on its performance from FFY 2012 in all three components of this indicator. For the both “percent of families who report that early intervention services have helped their family know their rights” (76.9%) and “percent of families who report that early intervention services have helped the family help their children develop and learn” (85.2%), the agency’s FFY 2013 results were higher than in any previous year.
Was sampling used (Y/N)? ___N____
If so, has your previously-approved sampling plan changed (Y/N)? ______
Describe the sampling methodology outlining how the design will yield valid and reliable estimates.
If your previously-approved sampling plan has changed, you will be asked to submit your sampling plan for approval.
Was a collection tool used (Y/N)? ___Y____
If so, is it a new or revised collection tool (Y/N)? ___N___
Does the data accurately represent the demographics of the State? __N____
If it is a new or revised collection tool, you will be asked to submit a copy of the collection tool.
Describe how the State has ensured that any response data are valid and reliable, including how the data represent the demographics of the State.
The NCSEAM Family Survey – Early Intervention 47 rating scale items divided into two groups: “Family-Centered Services” and “Impact of Early Intervention Services on Your Family.”
Of the 5,576 surveys, 832 surveys were completed. The effective response rate was approximately 14.9%. An analysis of the responses to the survey’s Impact of Early Intervention (EI) Services on Families scale is used for reporting the State Performance Plan (SPP) / Annual Performance Report (APR) indicators 4a, 4b, and 4c. The data meet or exceed the National Center for Special Education Accountability Monitoring (NCSEAM) 2005 National Item Validation Study’s standards for the internal consistency, completeness, and overall quality.
A total of 832 surveys were completed, for an overall response rate of 14.9%. There was a decrease in the response rate from the last reporting year (16.5% in FFY 2012). The trend over the last several reporting years has also been of decreasing response rates, with the earlier years having 16.7% (FFY 2011) and 19.0% (FFY 2010). Families did use the

Preloaded historical data Prepopulated data from other sources Calculated
Explanatory text
v1.1 August 2014 22 Part C Indicator 4
option of completing the surveys online, with almost half (413 of the 832 or 49.6%) completing the online version. The remaining 50.4% of families completed the paper version with mailed return. The overall representativeness of responses is still significantly impacted by the low response rate. Proportions of returns by race/ ethnicity groups show that that White/Caucasian families were proportionally over-represented in the response pool by 9.9 percentage points, while Black/African American families were proportionally under-represented by 7.8 percentage points. Responses from Hispanic families were slightly under-represented by 2.3 percentage points. Proportions of responses among other subgroups showed minor differences. The NCSEAM Family Survey – Early Intervention Survey analysis of the responses to the survey’s Impact of Early Intervention (EI) Services on Families scale includes responses rated “strongly agree” or “very strongly agree”. Data suggest improvements need to continue to address areas such as survey response rates, representativeness of responses, and targeted activities for improving practices for some of the CDSAs. To improve survey response rates and overall representativeness of responses, an overview of the Family Outcome’s process and purpose along with handouts to use when talking with families, including results from the previous year’s survey, will be provided to the CDSAs prior to the start of the FFY 14 Family Outcome’s Survey Process. Additionally, families will continue to have the option of
completing the NCSEAM Family Survey – Early Intervention Survey online.
Required Actions
Actions required in FFY 2012 response table
The FFY 2012 response table here: http://www2.ed.gov/fund/data/report/idea/partbspap/allyears.html. Download it to determine if action is required for this indicator.
Responses to actions required in FFY 2012 response table In the FFY 2013 APR, the State must report whether its FFY 2013 data are from a group representative of the population, and, if not, the actions the State is taking to address this issue. See additional data provided for FFY 2013

Preloaded historical data Prepopulated data from other sources Calculated
Explanatory text
v1.1 August 2014 23 Part C Indicator 5
Indicator 5: Child Find (Birth to One) Monitoring Priority: Effective General Supervision Part C / Child Find
Results indicator: Percent of infants and toddlers birth to 1 with IFSPs compared to national data. (20 U.S.C. 1416(a)(3)(B) and 1442)
Historical Data and Targets
Historical Data
Baseline Year: _2005_
FFY 2005 2006 2007 2008 2009 2010 2011 2012
Target ≤ 1.00% 1.10% 1.10% 1.10% 1.10% 1.10% 1.10%
Data 0.78% 0.84% 0.89% 0.95% 1.04% 1.01% 1.12% 1.19%
FFY 2013 – FFY 2018 Targets
FFY 2013 2014 2015 2016 2017 2018
Target ≤ 1.10% 1.10% 1.10% 1.15% 1.15% 1.15%
Targets: Description of Stakeholder Input
See Introduction
FFY 2013 Data
Number of infants and toddlers birth to 1 with IFSPs Population of infants and toddlers birth to 1 FFY 2013 Data
1,446 119,697 1.21%
FFY 2013 data is calculated: “Number of infants and toddlers birth to 1 with IFSPs” divided by “Population of infants and toddlers birth to 1” For the past three fiscal years, North Carolina has met its target for percentage of children age birth-to-one served. Not only has the state met its target, it has seen year-to-year increases in the percent of children birth-to-one served. For FY 2013, the state saw a .06 percentage point increase from 1.15% served in FY 2012 to 1.21% served in FY 2013. These year-to-year increases have moved the state above the overall national percent served age birth-to-one.
NC - Target NC - Actual National -
Actual
Difference
FY 2009 1.10% 1.04% 1.13% -0.09
FY 2010 1.10% 1.01% 1.15% -0.14
FY 2011 1.10% 1.12% 1.16% -0.04
FY 2012 1.10% 1.15% 1.21% -0.06
FY 2013 1.10% 1.21% 1.11% +0.10

Preloaded historical data Prepopulated data from other sources Calculated
Explanatory text
v1.1 August 2014 24 Part C Indicator 5
Required Actions
Actions required in FFY 2012 response table
The FFY 2012 response table here: http://www2.ed.gov/fund/data/report/idea/partbspap/allyears.html. Download it to determine if action is required for this indicator.
Responses to actions required in FFY 2012 response table

Preloaded historical data Prepopulated data from other sources Calculated
Explanatory text
v1.1 August 2014 25 Part C Indicator 6
Indicator 6: Child Find (Birth to Three) Monitoring Priority: Effective General Supervision Part C / Child Find
Results indicator: Percent of infants and toddlers birth to 3 with IFSPs compared to national data. (20 U.S.C. 1416(a)(3)(B) and 1442)
Historical Data and Targets
Historical Data
Baseline Year: _2005_
FFY 2005 2006 2007 2008 2009 2010 2011 2012
Target ≤ 1.95% 1.95% 1.96% 1.98% 2.00% 2.00% 2.10%
Data 2.16% 2.03% 2.12% 2.33% 2.48% 2.62% 2.73% 2.79%
FFY 2013 – FFY 2018 Targets
FFY 2013 2014 2015 2016 2017 2018
Target ≤ 2.10% 2.70% 2.70% 2.70% 2.70% 2.75%
Targets: Description of Stakeholder Input
See Introduction
FFY 2013 Data
Number of infants and toddlers birth to 3 with IFSPs Population of infants and toddlers birth to 3 FFY 2013 Data
10,190 362,108 2.81%
FFY 2013 data is calculated: “Number of infants and toddlers birth to 3 with IFSPs” divided by “Population of infants and toddlers birth to 3” North Carolina has met its target for percentage of children age birth-to-three served for the last five fiscal years. Over that time, the state has been slowly increasing its target for the age group, and has continued to meet that target and see increases in percent served from year-to-year. For FY 2013, the state saw a .04 percentage point increase from 2.77% served in FY 2012 to 2.81% served in FY 2013.
Preloaded historical data Prepopulated data from other sources Calculated
Explanatory text
v1.1 August 2014 26 Part C Indicator 6
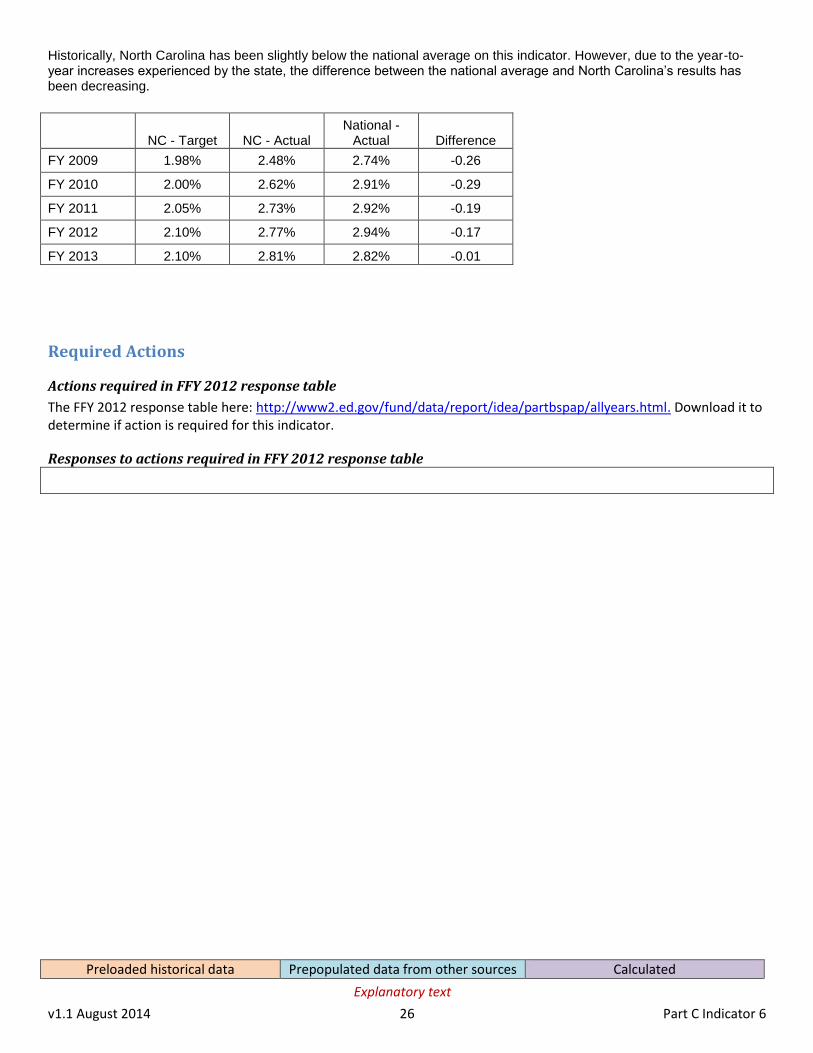
Historically, North Carolina has been slightly below the national average on this indicator. However, due to the year-to-year increases experienced by the state, the difference between the national average and North Carolina’s results has been decreasing.
NC - Target NC - Actual National -
Actual
Difference
FY 2009 1.98% 2.48% 2.74% -0.26
FY 2010 2.00% 2.62% 2.91% -0.29
FY 2011 2.05% 2.73% 2.92% -0.19
FY 2012 2.10% 2.77% 2.94% -0.17
FY 2013 2.10% 2.81% 2.82% -0.01
Required Actions
Actions required in FFY 2012 response table
The FFY 2012 response table here: http://www2.ed.gov/fund/data/report/idea/partbspap/allyears.html. Download it to determine if action is required for this indicator.
Responses to actions required in FFY 2012 response table

Preloaded historical data Prepopulated data from other sources Calculated
Explanatory text
v1.1 August 2014 27 Part C Indicator 7
Indicator 7: 45-day timeline Monitoring Priority: Effective General Supervision Part C / Child Find
Compliance indicator: Percent of eligible infants and toddlers with IFSPs for whom an initial evaluation and initial assessment and an initial IFSP meeting were conducted within Part C’s 45-day timeline. (20 U.S.C. 1416(a)(3)(B) and 1442)
Historical Data and Targets
Historical Data
Baseline Year: _2005_
FFY 2005 2006 2007 2008 2009 2010 2011 2012
Target 100% 100% 100% 100% 100% 100% 100%
Data 97.00% 98.90% 96.00% 97.25% 94.60% 99.77% 99.39% 99.03%
FFY 2013 – FFY 2018 Targets
FFY 2013 2014 2015 2016 2017 2018
Target 100% 100% 100% 100% 100% 100%
Targets: Description of Stakeholder Input
See Introduction
FFY 2013 Data
Number of eligible infants and toddlers with IFSPs for whom an initial evaluation and assessment and an initial
IFSP meeting was conducted within Part C’s 45-day timeline
Number of eligible infants and toddlers evaluated and assessed for whom an
initial IFSP meeting was required to be conducted FFY 2013 Data
590 655 100%
Number of documented delays attributable to exceptional family circumstances (this number will be subtracted from the number of eligible infants and toddlers evaluated and assessed for whom an initial IFSP meeting was required to be conducted when calculating the FFY 2013 Data)
65
FFY 2013 data is calculated: “Number of eligible infants and toddlers with IFSPs for whom an initial evaluation and assessment and an initial IFSP meeting was conducted within Part C’s 45-day timeline” divided by (“Number of eligible infants and toddlers evaluated and assessed for whom an initial IFSP meeting was required to be conducted” minus “Number of documented delays attributable to exceptional family circumstances”)

Preloaded historical data Prepopulated data from other sources Calculated
Explanatory text
v1.1 August 2014 28 Part C Indicator 7
Data on six hundred fifty-five (655) children were examined to verify the 45-day timeline for compliance. Five hundred ninety (590) children received an IFSP within 45 days of referral. The remaining sixty-five (65) children did not receive an IFSP in a timely manner due to documented exceptional family circumstances. Therefore, compliance with the 45-day timeline met the target of 100%. What is the source of the data provided for this indicator (check one)?
x State monitoring
Describe the method used to select EIS programs for monitoring.
Compliance by the CDSAs in meeting the 45-day timeline indicator was determined via a self-assessment record review of all children referred to the program between November 17, 2013 – December 17, 2013, who are children with IFSP due dates in January 2014. During FFY 2013, the EI Branch State Office provided each CDSA with a list of children (extracted from the state’s database) who were referred November 17, 2013 – December 17, 2013, for whom IFSPs were due in January 2014. The record review process is used to determine compliance or noncompliance including an account for untimely evaluations, assessments, and initial IFSP meetings, including the specific reasons for delays.
State database
Provide the time period in which the data were collected (e.g., September through December, fourth quarter, selection from the full reporting period).
Describe how the data accurately reflect data for infants and toddlers with IFSPs for the full reporting period.
Required Actions
Actions required in FFY 2012 response table
The FFY 2012 response table here: http://www2.ed.gov/fund/data/report/idea/partbspap/allyears.html. Download it to determine if action is required for this indicator.
Responses to actions required in FFY 2012 response table not including correction of noncompliance
Correction of Previous Findings of Noncompliance
Correction of Findings of Noncompliance Identified in FFY 2012
Findings of Noncompliance Identified
Findings of Noncompliance Verified as Corrected Within
One Year
Findings of Noncompliance Subsequently Corrected
Findings Not Yet Verified as Corrected
4 4 0
Preloaded historical data Prepopulated data from other sources Calculated
Explanatory text
v1.1 August 2014 29 Part C Indicator 7
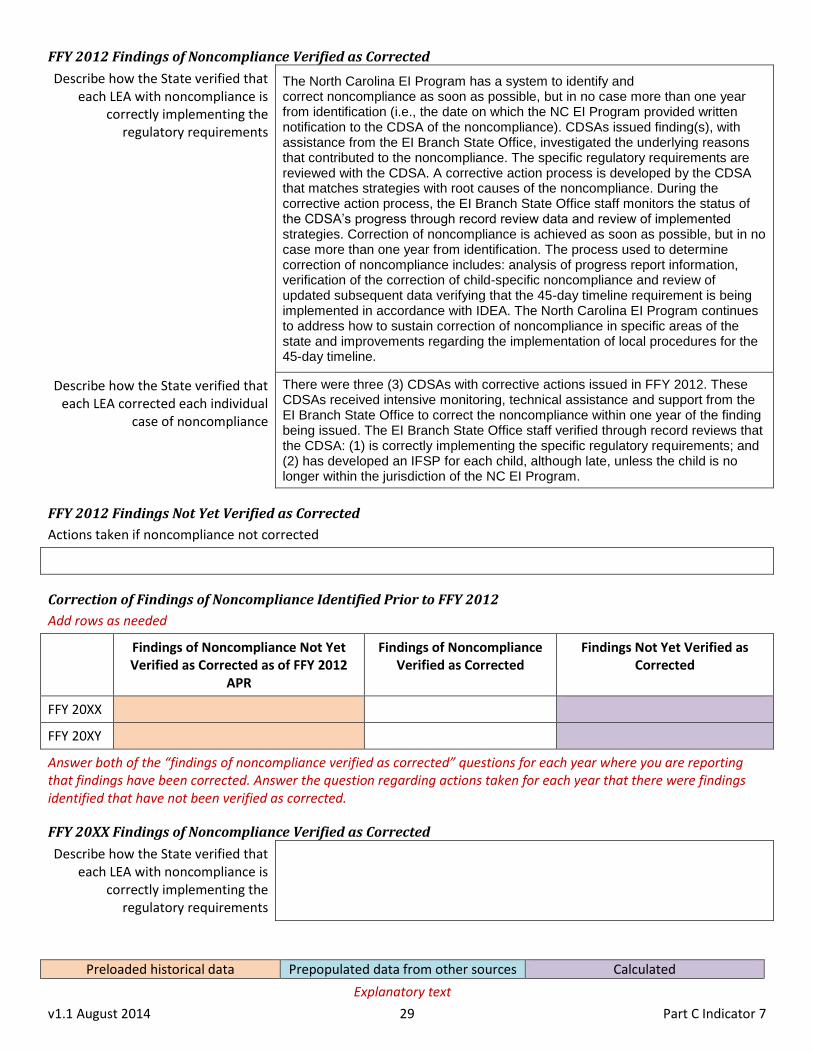
FFY 2012 Findings of Noncompliance Verified as Corrected
Describe how the State verified that each LEA with noncompliance is
correctly implementing the regulatory requirements
The North Carolina EI Program has a system to identify and correct noncompliance as soon as possible, but in no case more than one year from identification (i.e., the date on which the NC EI Program provided written notification to the CDSA of the noncompliance). CDSAs issued finding(s), with assistance from the EI Branch State Office, investigated the underlying reasons that contributed to the noncompliance. The specific regulatory requirements are reviewed with the CDSA. A corrective action process is developed by the CDSA that matches strategies with root causes of the noncompliance. During the corrective action process, the EI Branch State Office staff monitors the status of the CDSA’s progress through record review data and review of implemented strategies. Correction of noncompliance is achieved as soon as possible, but in no case more than one year from identification. The process used to determine correction of noncompliance includes: analysis of progress report information, verification of the correction of child-specific noncompliance and review of updated subsequent data verifying that the 45-day timeline requirement is being implemented in accordance with IDEA. The North Carolina EI Program continues to address how to sustain correction of noncompliance in specific areas of the state and improvements regarding the implementation of local procedures for the 45-day timeline.
Describe how the State verified that each LEA corrected each individual
case of noncompliance
There were three (3) CDSAs with corrective actions issued in FFY 2012. These CDSAs received intensive monitoring, technical assistance and support from the EI Branch State Office to correct the noncompliance within one year of the finding being issued. The EI Branch State Office staff verified through record reviews that the CDSA: (1) is correctly implementing the specific regulatory requirements; and (2) has developed an IFSP for each child, although late, unless the child is no longer within the jurisdiction of the NC EI Program.
FFY 2012 Findings Not Yet Verified as Corrected
Actions taken if noncompliance not corrected
Correction of Findings of Noncompliance Identified Prior to FFY 2012
Add rows as needed
Findings of Noncompliance Not Yet Verified as Corrected as of FFY 2012
APR
Findings of Noncompliance Verified as Corrected
Findings Not Yet Verified as Corrected
FFY 20XX
FFY 20XY
Answer both of the “findings of noncompliance verified as corrected” questions for each year where you are reporting that findings have been corrected. Answer the question regarding actions taken for each year that there were findings identified that have not been verified as corrected.
FFY 20XX Findings of Noncompliance Verified as Corrected
Describe how the State verified that each LEA with noncompliance is
correctly implementing the regulatory requirements

Preloaded historical data Prepopulated data from other sources Calculated
Explanatory text
v1.1 August 2014 30 Part C Indicator 7
Describe how the State verified that each LEA corrected each individual
case of noncompliance
FFY 20XY Findings Not Yet Verified as Corrected
Actions taken if noncompliance not corrected

Preloaded historical data Prepopulated data from other sources Calculated
Explanatory text
v1.1 August 2014 31 Part C Indicator 8
Indicator 8: Early Childhood Transition Monitoring Priority: Effective General Supervision Part C / Child Find
Compliance indicator: The percentage of toddlers with disabilities exiting Part C with timely transition planning for whom the Lead Agency has:
A. Developed an IFSP with transition steps and services at least 90 days, and at the discretion of all parties, not more than nine months, prior to the toddler’s third birthday;
B. Notified (consistent with any opt-out policy adopted by the State) the SEA and the LEA where the toddler resides at least 90 days prior to the toddler’s third birthday for toddlers potentially eligible for Part B preschool services; and
C. Conducted the transition conference held with the approval of the family at least 90 days, and at the discretion of all parties, not more than nine months, prior to the toddler’s third birthday for toddlers potentially eligible for Part B preschool services.
(20 U.S.C. 1416(a)(3)(B) and 1442)
FFY 2013 Data: All Indicator 8 Sections
Number of toddlers with disabilities exiting Part C 8959
Number of toddlers with disabilities exiting Part C who were potentially eligible for Part B 3066
8A Historical Data and Targets
Historical Data
Baseline Year: _2005_
FFY 2005 2006 2007 2008 2009 2010 2011 2012
Target 100% 100% 100% 100% 100% 100% 100%
Data 90.00% 99.26% 96.00% 99.50% 99.80% 100% 100% 99.83%
FFY 2013 – FFY 2018 Targets
FFY 2013 2014 2015 2016 2017 2018
Target 100% 100% 100% 100% 100% 100%
Targets: Description of Stakeholder Input
See Introduction
Preloaded historical data Prepopulated data from other sources Calculated
Explanatory text
v1.1 August 2014 32 Part C Indicator 8
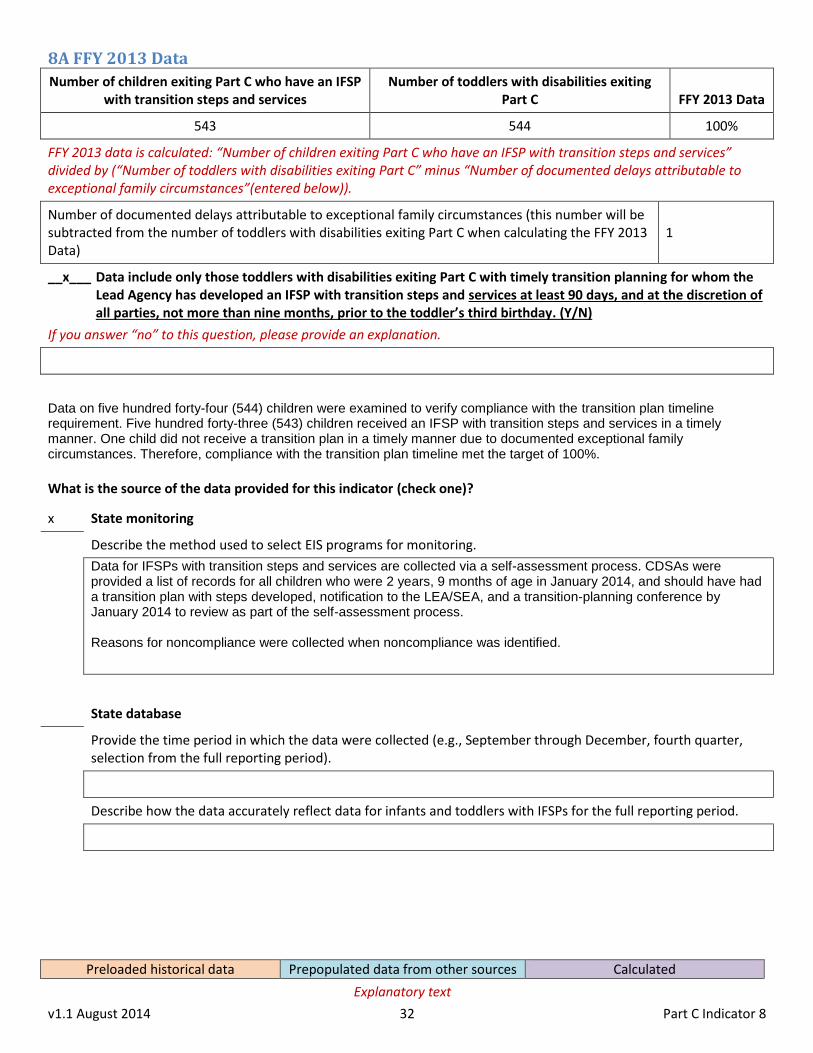
8A FFY 2013 Data
Number of children exiting Part C who have an IFSP with transition steps and services
Number of toddlers with disabilities exiting Part C FFY 2013 Data
543 544 100%
FFY 2013 data is calculated: “Number of children exiting Part C who have an IFSP with transition steps and services” divided by (“Number of toddlers with disabilities exiting Part C” minus “Number of documented delays attributable to exceptional family circumstances”(entered below)).
Number of documented delays attributable to exceptional family circumstances (this number will be subtracted from the number of toddlers with disabilities exiting Part C when calculating the FFY 2013 Data)
1
__x___ Data include only those toddlers with disabilities exiting Part C with timely transition planning for whom the Lead Agency has developed an IFSP with transition steps and services at least 90 days, and at the discretion of all parties, not more than nine months, prior to the toddler’s third birthday. (Y/N)
If you answer “no” to this question, please provide an explanation.
Data on five hundred forty-four (544) children were examined to verify compliance with the transition plan timeline requirement. Five hundred forty-three (543) children received an IFSP with transition steps and services in a timely manner. One child did not receive a transition plan in a timely manner due to documented exceptional family circumstances. Therefore, compliance with the transition plan timeline met the target of 100%.
What is the source of the data provided for this indicator (check one)?
x State monitoring
Describe the method used to select EIS programs for monitoring.
Data for IFSPs with transition steps and services are collected via a self-assessment process. CDSAs were provided a list of records for all children who were 2 years, 9 months of age in January 2014, and should have had a transition plan with steps developed, notification to the LEA/SEA, and a transition-planning conference by January 2014 to review as part of the self-assessment process. Reasons for noncompliance were collected when noncompliance was identified.
State database
Provide the time period in which the data were collected (e.g., September through December, fourth quarter, selection from the full reporting period).
Describe how the data accurately reflect data for infants and toddlers with IFSPs for the full reporting period.

Preloaded historical data Prepopulated data from other sources Calculated
Explanatory text
v1.1 August 2014 33 Part C Indicator 8
8A Required Actions
Actions required in FFY 2012 response table
The FFY 2012 response table here: http://www2.ed.gov/fund/data/report/idea/partbspap/allyears.html. Download it to determine if action is required for this indicator.
Responses to actions required in FFY 2012 response table not including correction of noncompliance
8A Correction of Previous Findings of Noncompliance
Correction of Findings of Noncompliance Identified in FFY 2012
Findings of Noncompliance Identified
Findings of Noncompliance Verified as Corrected Within
One Year
Findings of Noncompliance Subsequently Corrected
Findings Not Yet Verified as Corrected
1 1 0
FFY 2012 Findings of Noncompliance Verified as Corrected
Describe how the State verified that each LEA with noncompliance is
correctly implementing the regulatory requirements
The North Carolina EI Program has a system to identify and
correct noncompliance as soon as possible, but in no case more than one year
from identification (i.e., the date on which the NC EI Program provided written notification to the CDSA of the noncompliance). CDSAs issued finding(s), with assistance from the EI Branch State Office, investigated the underlying reasons that contributed to the noncompliance. The specific regulatory requirements are reviewed with the CDSA. A corrective action process is developed by the CDSA that matches strategies with root causes of the noncompliance. During the corrective action process, the EI Branch State Office staff monitors the status of the CDSA’s progress through record review data and review of implemented strategies. Correction of noncompliance is achieved as soon as possible, but in no case more than one year from identification. The process used to determine correction of noncompliance includes: analysis of progress report information, verification of the correction of child-specific noncompliance and review of updated subsequent data verifying that the transition plan timeline requirement is being implemented in accordance with IDEA. The North Carolina EI Program continues to address how to sustain correction of noncompliance in specific areas of the state and improvements regarding the implementation of local procedures for the transition plan timeline.
Describe how the State verified that each LEA corrected each individual
case of noncompliance
There was one (1) CDSA with a corrective action issued in FFY 2012. This CDSA received intensive monitoring, technical assistance and support from the EI Branch State Office to correct the noncompliance within one year of the finding being issued. The EI Branch State Office staff verified through record reviews that the CDSA: (1) is correctly implementing the specific regulatory requirements; and (2) has initiated services for each child, although late, unless the child is no longer within the jurisdiction of the NC EI Program.
FFY 2012 Findings Not Yet Verified as Corrected
Actions taken if noncompliance not corrected

Preloaded historical data Prepopulated data from other sources Calculated
Explanatory text
v1.1 August 2014 34 Part C Indicator 8
Correction of Findings of Noncompliance Identified Prior to FFY 2012
Add rows as needed
Findings of Noncompliance Not Yet Verified as Corrected as of FFY 2012
APR
Findings of Noncompliance Verified as Corrected
Findings Not Yet Verified as Corrected
FFY 20XX
FFY 20XY
Answer both of the “findings of noncompliance verified as corrected” questions for each year where you are reporting that findings have been corrected. Answer the question regarding actions taken for each year that there were findings identified that have not been verified as corrected.
FFY 20XX Findings of Noncompliance Verified as Corrected
Describe how the State verified that each LEA with noncompliance is
correctly implementing the regulatory requirements
Describe how the State verified that each LEA corrected each individual
case of noncompliance
FFY 20XY Findings Not Yet Verified as Corrected
Actions taken if noncompliance not corrected
Preloaded historical data Prepopulated data from other sources Calculated
Explanatory text
v1.1 August 2014 35 Part C Indicator 8
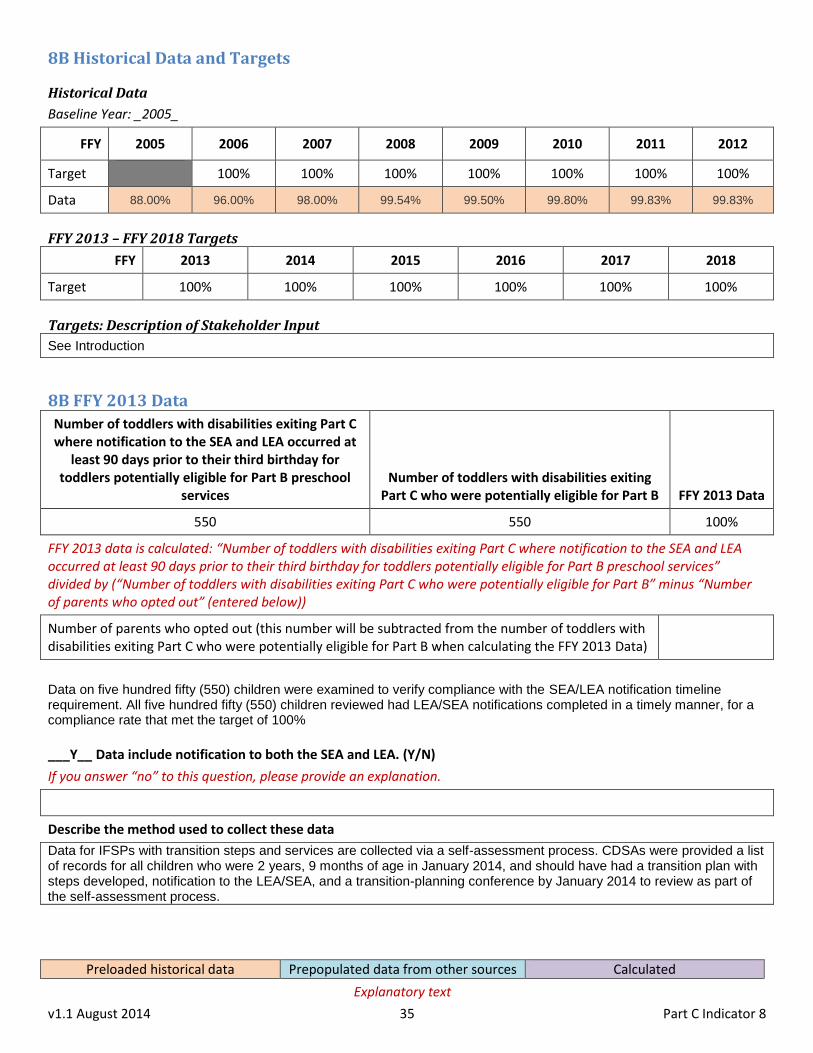
8B Historical Data and Targets
Historical Data
Baseline Year: _2005_
FFY 2005 2006 2007 2008 2009 2010 2011 2012
Target 100% 100% 100% 100% 100% 100% 100%
Data 88.00% 96.00% 98.00% 99.54% 99.50% 99.80% 99.83% 99.83%
FFY 2013 – FFY 2018 Targets
FFY 2013 2014 2015 2016 2017 2018
Target 100% 100% 100% 100% 100% 100%
Targets: Description of Stakeholder Input
See Introduction
8B FFY 2013 Data
Number of toddlers with disabilities exiting Part C where notification to the SEA and LEA occurred at
least 90 days prior to their third birthday for toddlers potentially eligible for Part B preschool
services Number of toddlers with disabilities exiting
Part C who were potentially eligible for Part B FFY 2013 Data
550 550 100%
FFY 2013 data is calculated: “Number of toddlers with disabilities exiting Part C where notification to the SEA and LEA occurred at least 90 days prior to their third birthday for toddlers potentially eligible for Part B preschool services” divided by (“Number of toddlers with disabilities exiting Part C who were potentially eligible for Part B” minus “Number of parents who opted out” (entered below))
Number of parents who opted out (this number will be subtracted from the number of toddlers with disabilities exiting Part C who were potentially eligible for Part B when calculating the FFY 2013 Data)
Data on five hundred fifty (550) children were examined to verify compliance with the SEA/LEA notification timeline requirement. All five hundred fifty (550) children reviewed had LEA/SEA notifications completed in a timely manner, for a compliance rate that met the target of 100% ___Y__ Data include notification to both the SEA and LEA. (Y/N)
If you answer “no” to this question, please provide an explanation.
Describe the method used to collect these data
Data for IFSPs with transition steps and services are collected via a self-assessment process. CDSAs were provided a list of records for all children who were 2 years, 9 months of age in January 2014, and should have had a transition plan with steps developed, notification to the LEA/SEA, and a transition-planning conference by January 2014 to review as part of the self-assessment process.

Preloaded historical data Prepopulated data from other sources Calculated
Explanatory text
v1.1 August 2014 36 Part C Indicator 8
Reasons for noncompliance were collected when noncompliance was identified.
n/a If you have a written opt-out policy, is it on file with the Department? (Y/N)
If your opt-out policy is not on file with the Department, you will be asked to attach it.
8B Required Actions
Actions required in FFY 2012 response table
The FFY 2012 response table here: http://www2.ed.gov/fund/data/report/idea/partbspap/allyears.html. Download it to determine if action is required for this indicator.
Responses to actions required in FFY 2012 response table not including correction of noncompliance
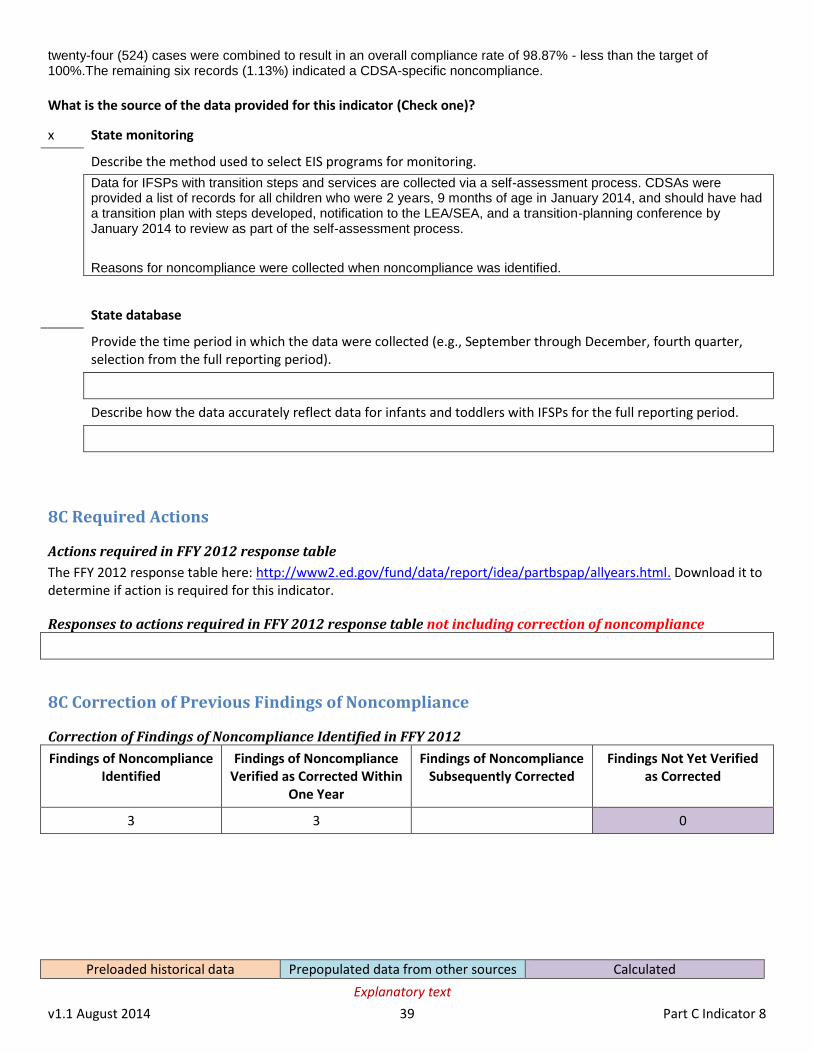
8B Correction of Previous Findings of Noncompliance
Correction of Findings of Noncompliance Identified in FFY 2012
Findings of Noncompliance Identified
Findings of Noncompliance Verified as Corrected Within
One Year
Findings of Noncompliance Subsequently Corrected
Findings Not Yet Verified as Corrected
1 1 0
FFY 2012 Findings of Noncompliance Verified as Corrected
Describe how the State verified that each LEA with noncompliance is
correctly implementing the regulatory requirements
The North Carolina EI Program has a system to identify and
correct noncompliance as soon as possible, but in no case more than one year
from identification (i.e., the date on which the NC EI Program provided written notification to the CDSA of the noncompliance). CDSAs issued finding(s), the CDSA with assistance from the EI Branch State Office, investigated the underlying reasons that contributed to the noncompliance. The specific regulatory requirements are reviewed with the CDSA. A corrective action process is developed by the CDSA that matches strategies with root causes of the noncompliance. During the corrective action process, the EI Branch State Office staff monitors the status of the CDSA’s progress through record review data and review of implemented strategies. Correction of noncompliance is achieved as soon as possible, but in no case more than one year from identification. The process used to determine correction of noncompliance includes: analysis of progress report information, verification of the correction of child-specific noncompliance and review of updated subsequent data verifying that the LEA/SEA notification timeline requirement is being implemented in accordance with IDEA. The North Carolina EI Program continues to address how to sustain correction of noncompliance in specific areas of the state and improvements regarding the implementation of local procedures for the LEA/SEA notification timeline.

Preloaded historical data Prepopulated data from other sources Calculated
Explanatory text
v1.1 August 2014 37 Part C Indicator 8
Describe how the State verified that each LEA corrected each individual
case of noncompliance
There was one (1) CDSA with a corrective action issued in FFY 2012. This CDSA received intensive monitoring, technical assistance and support from the EI Branch State Office to correct the noncompliance within one year of the finding being issued. The EI Branch State Office staff verified through record reviews that the CDSA: (1) is correctly implementing the specific regulatory requirements; and (2) has initiated services for each child, although late, unless the child is no longer within the jurisdiction of the NC EI Program.
FFY 2012 Findings Not Yet Verified as Corrected
Actions taken if noncompliance not corrected
Correction of Findings of Noncompliance Identified Prior to FFY 2012
Add rows as needed
Findings of Noncompliance Not Yet Verified as Corrected as of FFY 2012
APR
Findings of Noncompliance Verified as Corrected
Findings Not Yet Verified as Corrected
FFY 20XX
FFY 20XY
Answer both of the “findings of noncompliance verified as corrected” questions for each year where you are reporting that findings have been corrected. Answer the question regarding actions taken for each year that there were findings identified that have not been verified as corrected.
FFY 20XX Findings of Noncompliance Verified as Corrected
Describe how the State verified that each LEA with noncompliance is
correctly implementing the regulatory requirements
Describe how the State verified that each LEA corrected each individual
case of noncompliance
FFY 20XY Findings Not Yet Verified as Corrected
Actions taken if noncompliance not corrected

Preloaded historical data Prepopulated data from other sources Calculated
Explanatory text
v1.1 August 2014 38 Part C Indicator 8
8C Historical Data and Targets
Historical Data
Baseline Year: _2005_
FFY 2005 2006 2007 2008 2009 2010 2011 2012
Target 100% 100% 100% 100% 100% 100% 100%
Data 81.00% 99.26% 96.00% 98.09% 97.20% 95.20% 98.78% 99.12%
FFY 2013 – FFY 2018 Targets
FFY 2013 2014 2015 2016 2017 2018
Target 100% 100% 100% 100% 100% 100%
Targets: Description of Stakeholder Input
See Introduction
8C FFY 2013 Data
Number of toddlers with disabilities exiting Part C where the transition conference occurred at least 90 days, and at the discretion of all parties at least nine months prior to the toddler’s third birthday
for toddlers potentially eligible for Part B Number of toddlers with disabilities exiting
Part C who were potentially eligible for Part B FFY 2013 Data
524 530 98.87%
FFY 2013 data is calculated: “Number of children exiting Part C who have an IFSP with transition steps and services” divided by (“Number of toddlers with disabilities exiting Part C who were potentially eligible for Part B” minus “Number of toddlers for whom the parent did not provide approval for the transition conference” (entered below) minus “Number of documented delays attributable to exceptional family circumstances” (entered below)).
Number of toddlers for whom the parent did not provide approval for the transition conference (this number will be subtracted from the number of toddlers with disabilities exiting Part C who were potentially eligible for Part B when calculating the FFY 2013 Data)
Number of documented delays attributable to exceptional family circumstances (this number also will be subtracted from the number of toddlers with disabilities exiting Part C who were potentially eligible for Part B when calculating the FFY 2013 Data)
_x____ Data reflect only those toddlers for whom the Lead Agency has conducted the transition conference held with the approval of the family at least 90 days, and at the discretion of all parties, not more than nine months, prior to the toddler’s third birthday for toddlers potentially eligible for Part B preschool services. (Y/N)
If you answer “no” to this question, please provide an explanation.
Five hundred thirty (530) records were reviewed to examine the percentage of children potentially eligible for Part B for whom a timely transition-planning conference was held no later than 90 days before the child’s third birthday. Four hundred eighty (480) records (90.6%) denoted that a conference was held in a timely manner and 8.3% (44) were not held in a timely manner due to documented exceptional family circumstances or late referral to Part C. These five hundred
Preloaded historical data Prepopulated data from other sources Calculated
Explanatory text
v1.1 August 2014 39 Part C Indicator 8
twenty-four (524) cases were combined to result in an overall compliance rate of 98.87% - less than the target of 100%.The remaining six records (1.13%) indicated a CDSA-specific noncompliance. What is the source of the data provided for this indicator (Check one)?
x State monitoring
Describe the method used to select EIS programs for monitoring.
Data for IFSPs with transition steps and services are collected via a self-assessment process. CDSAs were provided a list of records for all children who were 2 years, 9 months of age in January 2014, and should have had a transition plan with steps developed, notification to the LEA/SEA, and a transition-planning conference by January 2014 to review as part of the self-assessment process.
Reasons for noncompliance were collected when noncompliance was identified.
State database
Provide the time period in which the data were collected (e.g., September through December, fourth quarter, selection from the full reporting period).
Describe how the data accurately reflect data for infants and toddlers with IFSPs for the full reporting period.
8C Required Actions
Actions required in FFY 2012 response table
The FFY 2012 response table here: http://www2.ed.gov/fund/data/report/idea/partbspap/allyears.html. Download it to determine if action is required for this indicator.
Responses to actions required in FFY 2012 response table not including correction of noncompliance
8C Correction of Previous Findings of Noncompliance
Correction of Findings of Noncompliance Identified in FFY 2012
Findings of Noncompliance Identified
Findings of Noncompliance Verified as Corrected Within
One Year
Findings of Noncompliance Subsequently Corrected
Findings Not Yet Verified as Corrected
3 3 0

Preloaded historical data Prepopulated data from other sources Calculated
Explanatory text
v1.1 August 2014 40 Part C Indicator 8
FFY 2012 Findings of Noncompliance Verified as Corrected
Describe how the State verified that each LEA with noncompliance is
correctly implementing the regulatory requirements
The North Carolina EI Program has a system to identify and correct noncompliance as soon as possible, but in no case more than one year
from identification (i.e., the date on which the NC EI Program provided written notification to the CDSA of the noncompliance). CDSAs issued finding(s), with assistance from the EI Branch State Office investigated the underlying reasons that contributed to the noncompliance. The specific regulatory requirements are reviewed with the CDSA. A corrective action process is developed by the CDSA that matches strategies with root causes of the noncompliance. During the corrective action process, the EI Branch State Office staff monitors the status of the CDSA’s progress through record review data and review of implemented strategies. Correction of noncompliance is achieved as soon as possible, but in no case more than one year from identification. The process used to determine correction of noncompliance includes: analysis of progress report information, verification of the correction of child-specific noncompliance and review of updated subsequent data verifying that the transition conference timeline requirement is being implemented in accordance with IDEA. The North Carolina EI Program continues to address how to sustain correction of noncompliance in specific areas of the state and improvements regarding the implementation of local procedures for the transition conference timeline.
Describe how the State verified that each LEA corrected each individual
case of noncompliance
There were three (3) CDSAs with corrective actions issued in FFY 2012. These CDSAs received intensive monitoring, technical assistance and support from the EI Branch State Office to correct the noncompliance within one year of the finding being issued. The EI Branch State Office staff verified through record reviews that the CDSA: (1) is correctly implementing the specific regulatory requirements; and (2) has initiated services for each child, although late, unless the child is no longer within the jurisdiction of the NC EI Program.
FFY 2012 Findings Not Yet Verified as Corrected
Actions taken if noncompliance not corrected
Correction of Findings of Noncompliance Identified Prior to FFY 2012
Add rows as needed
Findings of Noncompliance Not Yet Verified as Corrected as of FFY 2012
APR
Findings of Noncompliance Verified as Corrected
Findings Not Yet Verified as Corrected
FFY 20XX
FFY 20XY
Answer both of the “findings of noncompliance verified as corrected” questions for each year where you are reporting that findings have been corrected. Answer the question regarding actions taken for each year that there were findings identified that have not been verified as corrected.
FFY 20XX Findings of Noncompliance Verified as Corrected
Describe how the State verified that each LEA with noncompliance is
correctly implementing the regulatory requirements

Preloaded historical data Prepopulated data from other sources Calculated
Explanatory text
v1.1 August 2014 41 Part C Indicator 8
Describe how the State verified that each LEA corrected each individual
case of noncompliance
FFY 20XY Findings Not Yet Verified as Corrected
Actions taken if noncompliance not corrected

Preloaded historical data Prepopulated data from other sources Calculated
Explanatory text
v1.1 August 2014 42 Part C Indicator 9
Indicator 9: Resolution Sessions Monitoring Priority: Effective General Supervision Part C / General Supervision
Results indicator: Percent of hearing requests that went to resolution sessions that were resolved through resolution session settlement agreements (applicable if Part B due process procedures are adopted). (20 U.S.C. 1416(a)(3)(B) and 1442)
Historical Data and Targets
Historical Data
Baseline Data: _n/a_
FFY 2005 2006 2007 2008 2009 2010 2011 2012
Target ≥ 100% 100% 100% 100% 100% 100% 100%
Data n/a
FFY 2013 – FFY 2018 Targets
FFY 2013 2014 2015 2016 2017 2018
Target ≥ n/a n/a n/a n/a n/a n/a
Targets: Description of Stakeholder Input
See Introduction
FFY 2013 Data
FFY 2013 SPP/APR Data
3.1(a) Number resolutions sessions resolved through settlement agreements 3.1 Number of resolutions sessions FFY 2013 Data
0 0
The FFY 2013 data is calculated: “3.1(a) Number resolutions sessions resolved through settlement agreements” divided by “3.1 Number of resolutions sessions”
Required Actions
Actions required in FFY 2012 response table
The FFY 2012 response table here: http://www2.ed.gov/fund/data/report/idea/partbspap/allyears.html. Download it to determine if action is required for this indicator.
Responses to actions required in FFY 2012 response table

Preloaded historical data Prepopulated data from other sources Calculated
Explanatory text
v1.1 August 2014 43 Part C Indicator 10
Indicator 10: Mediation Monitoring Priority: Effective General Supervision Part C / General Supervision
Results indicator: Percent of mediations held that resulted in mediation agreements. (20 U.S.C. 1416(a)(3)(B) and 1442)
Historical Data and Targets
Historical Data
Baseline Data: _2005__
FFY 2005 2006 2007 2008 2009 2010 2011 2012
Target ≥ 100% 100% 100% 100% 100% 100% 100%
Data 100%
FFY 2013 – FFY 2018 Targets
FFY 2013 2014 2015 2016 2017 2018
Target ≥ n/a n/a n/a n/a n/a n/a
Targets: Description of Stakeholder Input
See Introduction
FFY 2013 Data
FFY 2013 SPP/APR Data
2.1.a.i Mediation agreements related to due process complaints
2.1.b.i Mediation agreements not related to due process complaints
2.1 Number of mediations held
FFY 2013 Data
0 0 0
The FFY 2013 data is calculated: (“2.1.a.i Mediation agreements related to due process complaints” + “2.1.b.i Mediation agreements not related to due process complaints”) divided by “2.1 Number of mediations held”
Required Actions
Actions required in FFY 2012 response table
The FFY 2012 response table here: http://www2.ed.gov/fund/data/report/idea/partbspap/allyears.html. Download it to determine if action is required for this indicator.
Responses to actions required in FFY 2012 response table

Part C State Annual Performance Report for FFY 2010Monitoring Priority Indicator 14 (OMB NO: 1820-0578/Expiration Date: 11/30/2012) Effective General Supervision Part C/General Supervision Page 1
Attachment 1
Part C State Annual Performance Report (APR) for FFY 2013
Findings not related to an Indicator
Indicator/Indicator Clusters
General Supervision
System Components
# of EIS Programs Issued Findings in FFY 2012 (7/1/12 through 6/30/13)
(a) # of Findings of noncompliance identified in FFY
2012 (7/1/12 through 6/30/13)
(b) # of Findings of
noncompliance from (a) for
which correction was verified no later than one
year from identification
OTHER AREAS OF NONCOMPLIANCE:
Procedural Safeguards/Accurate Data
Monitoring Activities: Self-Assessment/ Local APR, Data Review, Desk Audit, On-Site Visits, or Other
5
1. Charlotte 2. Fayetteville 3. Greenville 4. Raleigh 5. Wilmington
8 8
Dispute Resolution: Complaints, Hearings
0 0 0
All CDSAs received monitoring activities this year. These monitoring activities included on-site focused monitoring visits, desk audits/data review, self- assessment data submission and/or data verification visits.
In FY 2012, there were a total of eight (8) findings of noncompliance, not related to a specific APR indicator, identified in five (5) CDSAs (some CDSAs had multiple findings). All findings of noncompliance were corrected within one year of identification. The Early Intervention Program verified that each CDSA with findings of noncompliance identified in FY 2012 was correctly implementing the specific regulatory requirements, (i.e., achieved 100% compliance) based on a review of updated data. This subsequent data was collected through on-site monitoring or desk audits. The Early Intervention Program also verified that each CDSA had corrected each individual case of noncompliance, unless the child was no longer within the jurisdiction of the CDSA, consistent with OSEP Memo 09-02, dated October 17, 2008.