Ornl tm 5503
42
& -5-0 ORNL/TM-5503 Temperature Gradient Compatibility Tests of Some Refractory Metals and Alloys in Bismuth and Bismuth-Lithiun Solutions J. R. DiStefano 0. B. Cavin
-
Upload
the-e-generation -
Category
Documents
-
view
234 -
download
1
description
http://www.energyfromthorium.com/pdf/ORNL-TM-5503.pdf
Transcript of Ornl tm 5503
& -5-0 ORNL/TM-5503
Temperature Gradient Compatibility Tests of Some Refractory Metals and
Alloys in Bismuth and Bismuth-Lithiun Solutions
J. R. DiStefano 0. B. Cavin
i .-
I
I
National Technical Information Service U.S. Department of Commerce
5285 Port Royal Road, Springfield, Virginia 22161 Price: Printed Copy $4.00; Microfiche $2.25
This report was prepared as an account of work sponsored by the United States Government. Neither the United States nor the Energy Research and Development Admininrationlunited States Nuclear Regulatory Commission, nor any of their employees, nor any of their contractors, subcontractors, or their employees, makes any warranty, express or implied, or assumes any legal liability or responsibility for the accuracy, completeness or usefulness of any information, apparatus, product or process disclosed, or represents that i t s use would not infringe privately owned rights.
,
: -
A
ORNL/TM-5503 Distribution Category UC-76
Contract No. W-7405-eng-26
METALS AND CERAMICS DIVISION
TEMPERATURE GRADIENT COMPATIBILITY TESTS OF SOME REFRACTORY METALS AND ALLOYS IN BISMUTH AND BISMUTH-LITHIUM SOLUTIONS
J. R. DiStefano and 0. B. Cavin
I: ite Published: November 1976
I
OAK RIDGE NATIONAL LABORATORY Oak Ridge, Tennessee 37830
operated by UNION CARBIDE CORPORATION
for the ENERGY RESEARCH AND DEVELOPMENT ADMINISTRATION
DISTRIBUTION OF THIS DOCUMENT IS UNLIMITED


c
CONTENTS
Abstract . . . . . . . . . . . . . . . . . . . . . . . . . . . . . . 1
Introduction . . . . . . . . . . . . . . . . . . . . . . . . . . . 1
Results . . . . . . . . . . . . . . . . . . . . . . . . . . . . . . 11
Quartz Tests . Group 1 . . . . . . . . . . . . . . . . . . . . 11
Quartz Tests . Group 2 . . . . . . . . . . . . . . . . . . . . 15
Metal Loop Tests i n Bi-2.5% L i . Group 3 Summary and Conclusions . . . . . . . . . . . . . . . . . . . . . . 32
Acknowledgments . . . . . . . . . . . . . . . . . . . . . . . . . . 33
References . . . . . . . . . . . . . . . . . . . . . . . . . . . . . 33
. . . . . . . . . . . 30
.
.
iii

,
i

TEMPERATURE GRADIENT COMPATIBILITY TESTS OF SOME REFRACTORY MGTALS AND ALLOYS I N BISMUTH AND BISMUTH-LITHIUM SOLUTIONS
J. R. DiStefano and 0. B. Cavin
ABSTRACT
Quartz, T-111 and Mo thermal-convection loop tests w e r e conducted a t temperatures up t o 7OOOC (100OC A!l') to determine the compatibility of several refractory metals/alloys with bismuth and bismuth-lithium solut ions f o r molten sa l t breeder reac tor applications. change measurements, metallographic examination, chemical and electron microprobe analysis , and mechanical propert ies tests. Molybdenum, T-111, and Ta-10% W appear t o be the most promising containment materials, while niobium and iron-based a l loys are unacceptable.
Methods of evaluation included weight
INTRODUCTION
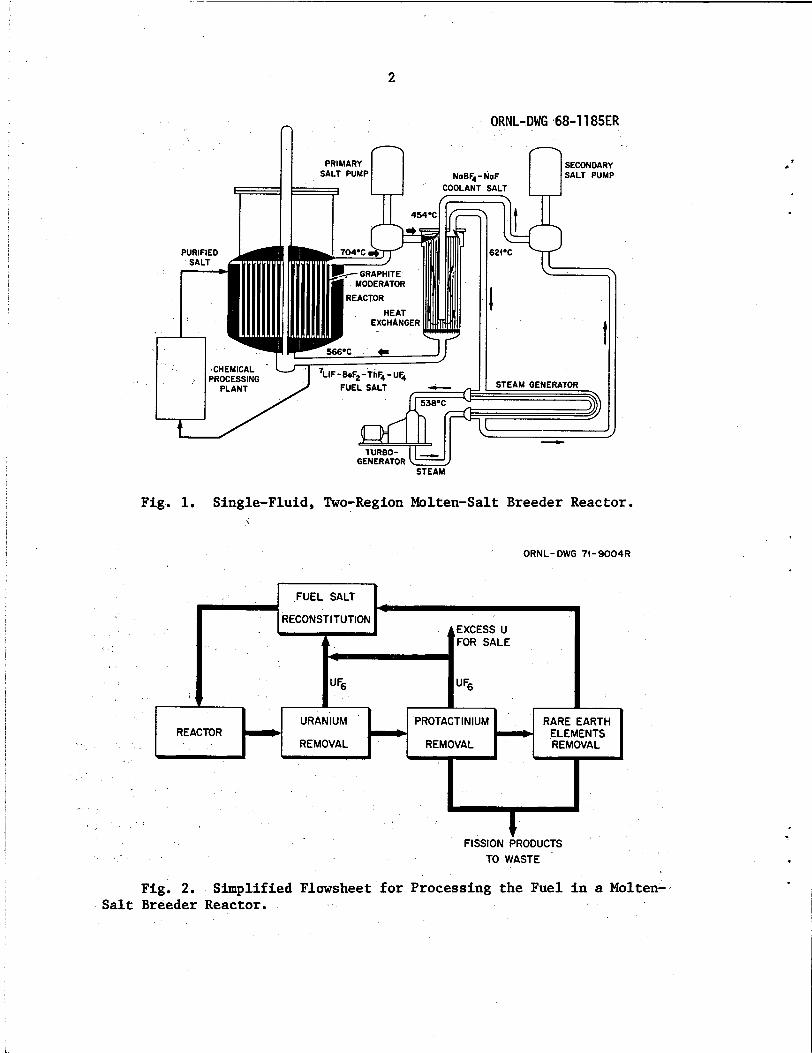
A key fea ture i n the conceptual design of the single-fluid molten sa l t breeder reactor (MSBR) is the connecting chemical processing p lan t t o continuously remove protactinium and f i s s i o n products from the f u e l sa l t (Fig. 1 ) . Protactinium, the intermediate element i n the breeding chain between thorium and 233U, has a s igni f icant neutron capture cross sec t ion and must be kept out of the core t o obtain a good breeding r a t i o . Rare-earth-element f i s s i o n products are a l so neutron poisons and so m u s t be s t r ipped from the fue l . A promising approach f o r MSBR f u e l processing uses l iqu id bismuth containing dissolved l i thium and thorium as reductants t o ex t r ac t protactinium and rare ea r th elements from fue l sa l t containing both uranium and thorium (Fig. 2). t h i s process was demonstrated. ' process is ident i fying materials t h a t are compatible with both molten f lour ide salts and bismuth-containing reductants. M d % Fe) has excel lent Compatibility with molten salts a t 50O-7oO0C; however, it does not have good compatibil i ty with bismuth. tes ted, graphite, tungsten, and molybdenum appear most promising (Table 1 ) and they are also compatible with molten f lour ide mixtures. invest igat ions of bismuth as a reactor coolant have shown t h a t i nh ib i to r s such as magnesium, titanium, and zirconium are often required t o reduce the high corrosion rates of conventional materials i n bismuth. However, these types of inh ib i to r s would not be readi ly acceptable f o r use i n the molten salt system because they would be eliminated from the bismuth stream by several of the proposed s teps i n processing.
In 1968 the chemical f e a s i b i l i t y of
One of the requirements f o r t he development of the reductive extract ion
Hastelloy N (Ni-7% Cr-16%
Of ten elements
Extensive
2-1
1
2
CHEMICAL PROCESSING
PLANT
ORNL-DWG '68-1 185ER
SECONDARY n SALT PUMP 1 PRIMARY n
SALT PUMP
, ' I 'LiF -BeF2-ThF, - UF, I
Fig. 1. Single-Fluid, Two-Region Molten-Salt Breeder Reactor. .;
' ORNL-DWG 74-9004R
FUEL SALT
RECONSTITUTION AEXCESS U
FOR SALE 4
" F6 F6
* URANIUM PROTACT IN IUM RARE EARTH
REMOVAL REMOVAL REACTOR 0 - ELEMENTS
REMOVAL '
\ \ L
1 FISSION ~RODUCTS
c
TO WASTE
Fig. 2. Simplified Flowsheet for Processing the Fuel in a Molten- Salt Breeder Reactor.
3
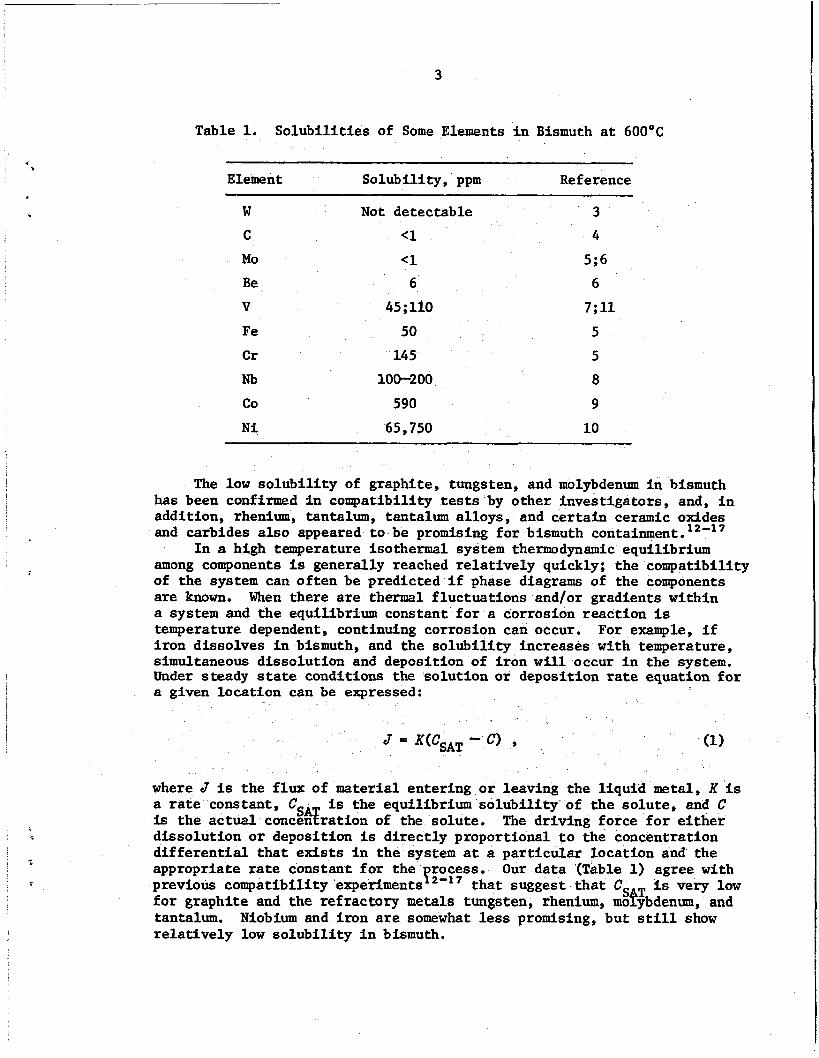
Table 1. So lub i l i t i e s of Some Elements i n Bismuth a t 6OOOC
, Element Solubi l i ty , ppm Reference
W C Mo Be V
~ ~ ~~~
Not detectable
<1
<1 6
45 ; 110
3 4
5;6 6
7;11
Fe 50 5 C r 14 5 5 Nb 100-200 8 co 590 9 N i 65,750 10
The low so lub i l i t y of graphite, tungsten, and molybdenum i n bismuth has been confirmed i n compatibility tests by other invest igators , and, i n addition, rhenium, tantalum, tantalum al loys, and ce r t a in ceramic oxides and carbides a l so appeared t o be promising f o r bismuth containment. 12-”
among components is generally reached r e l a t ive ly quickly; the compatibil i ty of the system can of ten be predicted i f phase diagrams of the components are known. When there are thermal f luc tua t ions and/or gradients within a system and the equilibrium constant f o r a corrosion react ion i s temperature dependent, continuing corrosion can occur. For example, i f i ron dissolves i n bismuth, and the so lub i l i t y increases with temperature, simultaneous dissolut ion and deposition of i ron w i l l occur i n the system. Under steady state conditions the so lu t ion o r deposit ion rate equation f o r a given locat ion can be expressed:
I n a high temperature isothermal system thermodynamic equilibrium
where J is the f l u x of material enter ing o r leaving the l i qu id metal, K is a rate constant, C is the ac tua l concgkbation of the solute. d i sso lu t ion o r deposit ion is d i r ec t ly proportional t o the concentration d i f f e r e n t i a l t h a t exists i n the system a t a par t icu lar locat ion and the appropriate rate constant f o r the rocess. Our data (Table 1) agree with previous eompatibil i ty experiments p2-17 t h a t suggest t h a t Cs for graphi te and the refractory metals tungsten, rhenium, mofybdenum, and tantalum. r e l a t ive ly low s o l u b i l i t y i n bismuth.
is the equilibrium so lub i l i t y ’o f the so lu te , and C The dr iving force f o r e i t h e r
I s very l o w
Niobium and i ron are somewhat less promising, but s t i l l show
4
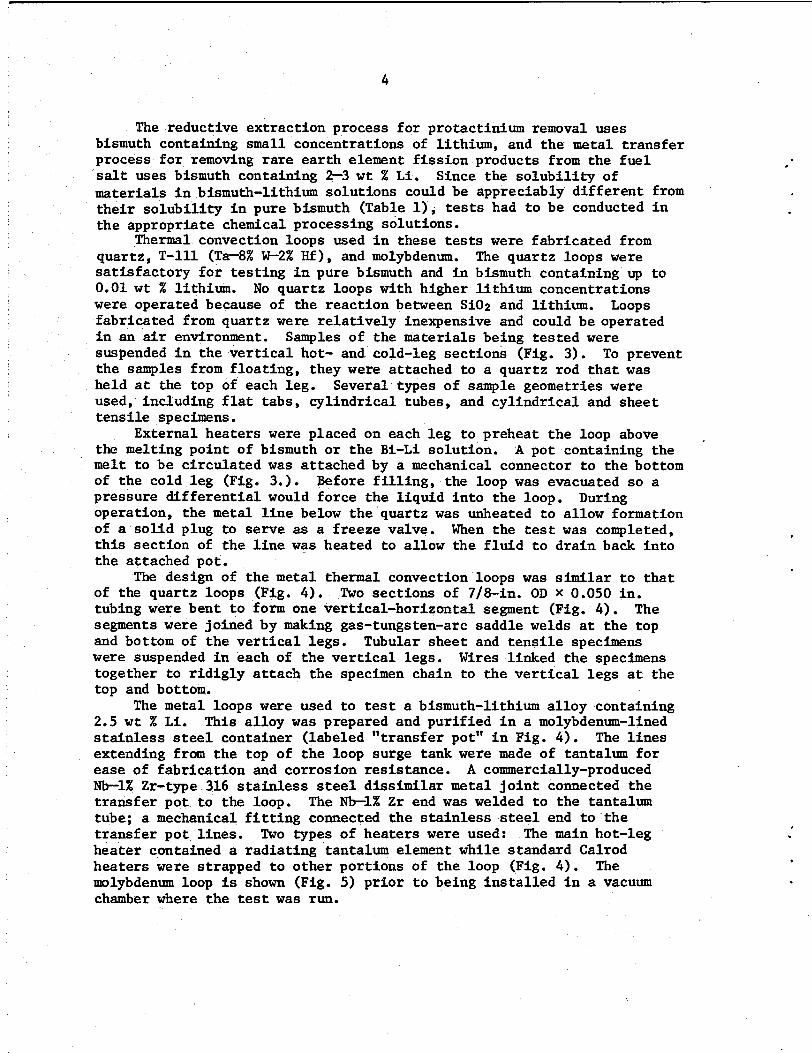
The reductive ex t rac t ion process f o r protactinium removal uses bismuth containing small concentrations of lithium, and t h e metal t r ans fe r process f o r removing rare ea r th element f i s s i o n products from the f u e l sa l t uses bismuth containing 2-3 w t % L i . materials i n bismuth-lithium so lu t ions could be appreciably d i f f e r e n t from t h e i r s o l u b i l i t y i n pure bismuth (Table l), tests had t o be conducted i n the appropriate chemical processing solutions.
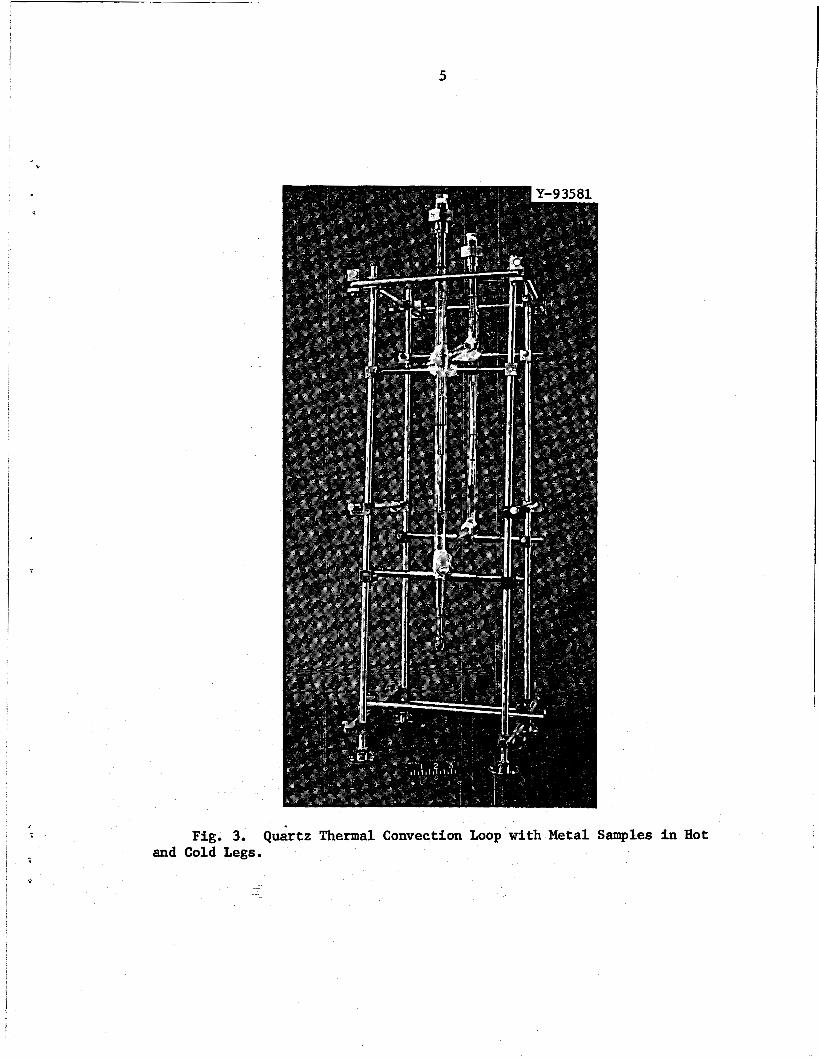
quartz, T-111 (Ta-8% W-2% Hf), and molybdenum. sa t i s f ac to ry f o r t e s t ing i n pure bismuth and i n bismuth containing up t o 0 . 0 1 w t % lithium. w e r e operated because of the reac t ion between S i 0 2 and lithium. fabricated from quartz were r e l a t i v e l y inexpensive and could be operated i n an a i r environment. suspended i n the vertical hot- and cold-leg sec t ions (Fig. 3). To prevent t he samples from f loa t ing , they were attached t o a quartz rod t h a t was held a t the top of each leg. used, including f l a t tabs , cy l ind r i ca l tubes, and cy l ind r i ca l and shee t t e n s i l e specimens.
External heaters were placed on each l eg t o preheat t h e loop above the melting poin t of bismuth o r t h e Bi-Li solut ion. m e l t t o be c i rcu la ted was attached by a mechanical connector t o t h e bottom of the cold l eg (Fig. 3.). Before f i l l i n g , the loop w a s evacuated so a pressure d i f f e r e n t i a l would force t h e l i q u i d i n t o the loop. operation, t h e m e t a l l i n e below t h e quartz w a s unheated t o allow formation of a s o l i d plug to serve as a f reeze valve. When the test w a s completed, t h i s sec t ion of the l i n e was heated t o allow the f l u i d t o dra in back i n t o the attached pot.
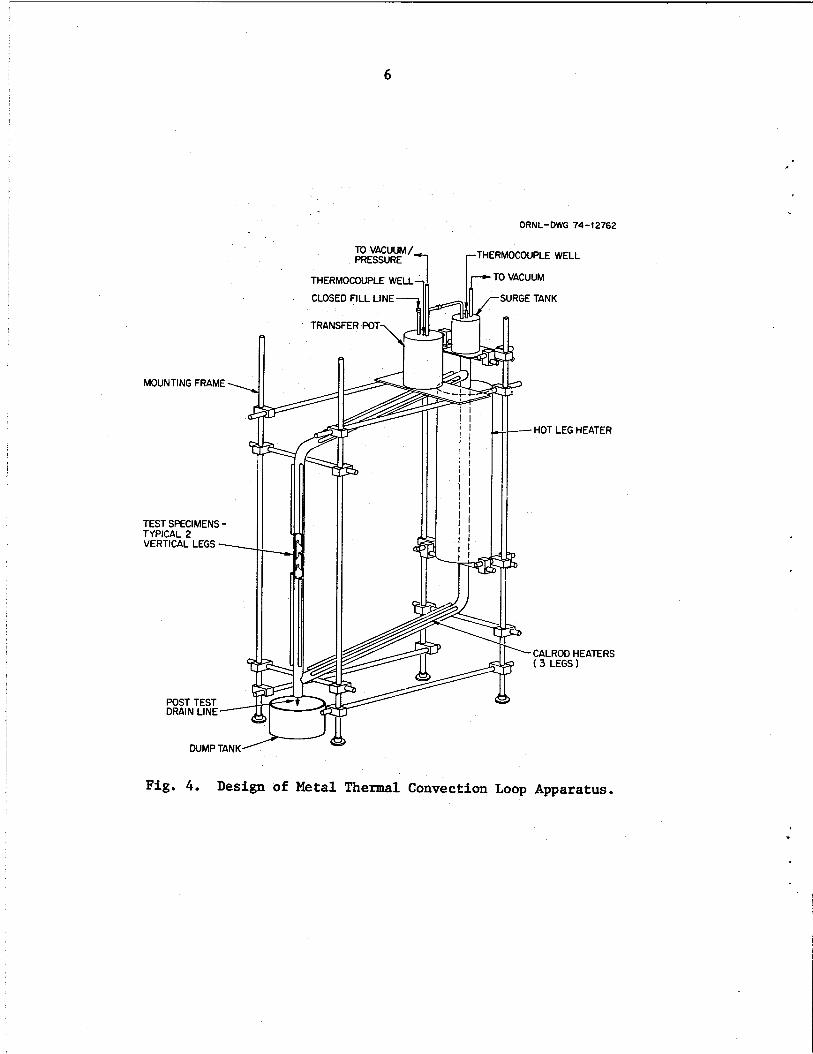
The design of t h e m e t a l thermal convection loops w a s similar t o t h a t of the quartz loops (Fig. 4). Two sect ions of 7/8-in. OD X 0.050 i n . tubing w e r e bent t o form one vertical-horizontal segment (Fig. 4). The segments were joined by making gas-tungsten-arc saddle welds a t t h e top and bottom of t h e vertical legs. w e r e suspended i n each of t he vertical legs. together t o r i d i g l y a t t ach the specimen chain t o the vertical l egs a t the top and bottom.
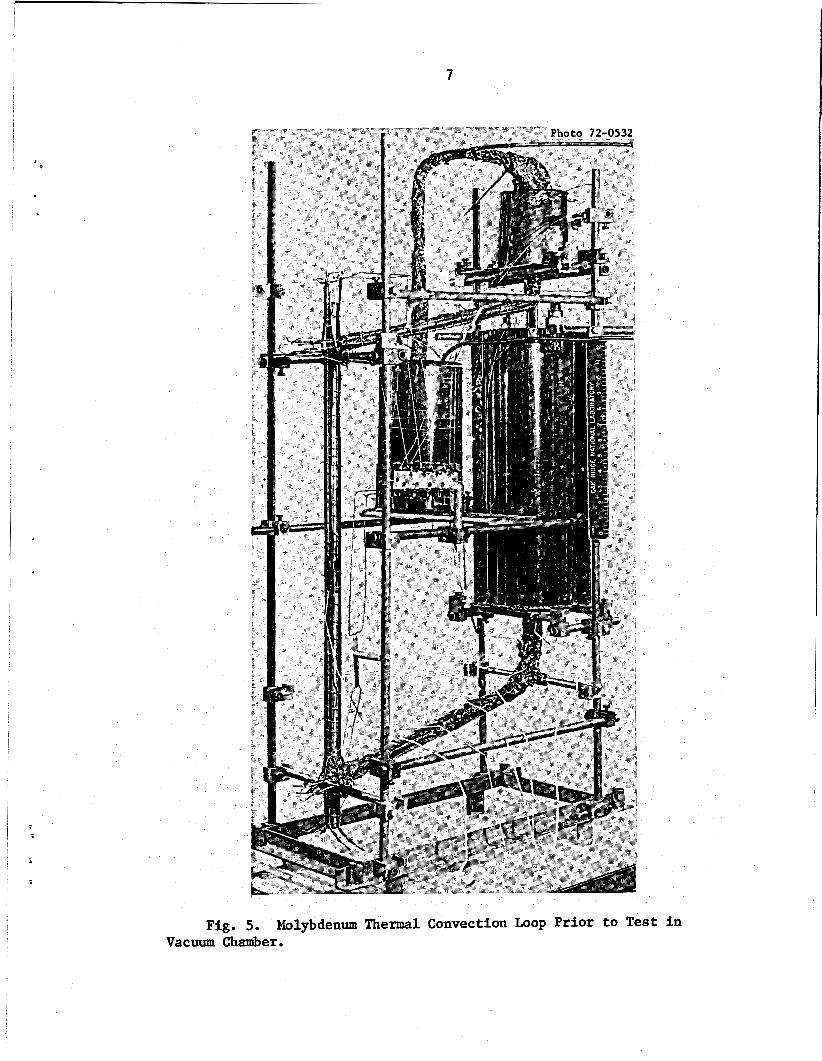
The metal loops were used t o test a bismuth-lithium a l loy containing 2.5 w t % L i . s t a i n l e s s steel container (labeled " t ransfer pot" i n Fig. 4). extending from t h e top of t h e loop surge tank were made of tantalum f o r ease of f ab r i ca t ion and corrosion resis tance. A commercially-produced Nb--l% Zr-type 316 s t a i n l e s s steel d iss imi la r metal j o i n t connected t h e t r ans fe r pot t o the loop. The N b 4 % Z r end w a s welded t o the tantalum tube; a mechanical f i t t i n g connected t h e stainless steel end t o t h e t r ans fe r po t l i nes . Two types of hea te rs w e r e used: The main hot-leg hea ter contained a rad ia t ing tantalum element while standard Calrod hea ters were strapped t o o ther portions of t h e loop (Fig. 4). The molybdenum loop is shown (Fig. 5) p r i o r t o being i n s t a l l e d i n a vacuum chamber where t h e test was run.
Since the s o l u b i l i t y of
Thermal convection loops used i n these tests were fabr ica ted from The quartz loops w e r e
No quartz loops with higher l i th ium concentrations Loops
Samples of the materials being t e s t ed w e r e
Several types of sample geometries were
A pot containing the
During
Tubular sheet and t e n s i l e specimens Wires linked t h e specimens
This a l l o y w a s prepared and pur i f ied i n a molybdenum-lined The l i n e s
.
I j
I I 1 I I
i i I i
I I I i
i
I I
I I ~
!
i
5
Fig. 3. Quartz Thermal Convection Loop with Metal Samples in Hot and Cold Legs.
6
ORNL-DWG 74-t2762
,
MOUNTING FRAME \
l a
4
TEST SPECIMENS - TYPICAL 2 VERTICAL LEGS ---,
9 I
POST TEST DRAIN LINE-
TO PRESSURE VACUUM/ 7 rTHERMOCOUPLE WELL
DUMP TANK 2
THERMOCOUPLE WELL--.
CLOSED FILL LINE
TRANSFERPOT
- - k
I i ! I I i i I I
i I I I I t
4
‘-CALROD HEATERS 7 (3 LEGS)
Fig. 4. Design of Metal Thermal Convection Loop Apparatus.
- I
7
Fig. 5. Molybdenum Thermal Convection Loop Prior to Test in Vacuum Chamber.
8
After evacuation and baking out of t h e vacuum chamber, the e n t i r e loop w a s heated t o 5OO0C, s ince t h e melting poin t of Bi-2.5 w t % L i is s l i g h t l y less than 5OO0C (Fig. 6). 6OO0C (900OC i n t h e case of t he molybdenum loop), t he loop was evacuated, and d i f f e r e n t i a l pressure w a s used t o t ransfer t he bismuth-lithium so lu t ion i n t o the loop. hot leg, but t he required temperature d i f f e r e n t i a l was maintained with l i t t l e o r no heat t o t h e rest of t h e loop from t h e Calrod heaters .
l i thium so lu t ion w a s allowed t o so l id i fy . t h e vacuum chamber was opened and t h e bottom of the cold l e g cu t o f f . d ra in tank was placed immediately under this por t ion of t h e cold l eg , t he chamber re-evacuated, and the loop heated t o approximately 6OO0C t o allow it t o drain.
dimensional measurements could be obtained. removed t h e bismuth o r Bi-Li t h a t adhered t o the samples. w e r e small, mechanically cleaning t h e samples was su f f i c i en t . s a t i s f ac to ry technique w a s t o amalgamate the bismuth by dipping the sample i n t o hot mercury (approximately 100-l5O0C) and then removing the amalgam mechanically.
American Corporation. Except f o r Quartz loops 1 and 2, t h e as-received material w a s f i r s t pu r i f i ed by bubbling hydrogen through the molten metal f o r two hours a t 350°C, i n a molybdenum-lined container. I n i t i a l l y the exit gas burned in t e rmi t t en t ly and had a reddish hue. Subsequently the gas burned continuously and was almost co lor less ind ica t ing t h a t reac t ion with hydrogen had ceased. I f an a l loy w e r e required, s o l i d l i thium w a s added t o so l id , pur i f ied bismuth, and t h e mixture w a s heated above the melting temperature of the al loy. temperature of the a l l o y varies with l i thium concentration (Fig. 6). Additionally, i n t he Group 1 series (see r e s u l t s sect ion) the bismuth o r bismuth-lithium so lu t ion w a s f i l t e r e d p r i o r t o introduction i n t o t h e loop through a type 316 s t a i n l e s s steel f i l t e r having openings of 10 pm. Determinations of various impuri t ies before and a f t e r t h e various treat- ments (Table 2) showed no s ign i f i can t improvement i n t h e pu r i ty of t h e bismuth; however, v i s u a l observations of t h e e x i t gas flame and t h e appearance of t h e bismuth indicated t h a t some pur i f i ca t ion had occurred during hydrogen f i r ing .
thermal convection loop tests w a s much more d i f f i c u l t because (1) t h e melting temperature of t h e a l loy is much higher, (2) t he bismuth-lithium reac t ion is strongly exothermic, and (3) during a l loy ing there is a tendency t o form L i 3 B i (Si+% L i ) , which m e l t s a t 1150OC. apparatus w a s used t o prepare Bi-2.5% L i f o r these tests (Fig. 7). Lithium w a s f i r s t pur i f ied by hot ge t t e r ing with zirconium f o i l a t 8OO0C, and the required amount t ransfer red i n t o a type 304 s t a i n l e s s steel container.
As t h e t r ans fe r pot was heated t o
During operation the tantalum hea ter heated the
To s top the test, t he hea ters were turned off and t h e bismuth- When the system had cooled,
A
Samples generally required cleaning before meaningful weight and Several d i f f e r e n t techniques
If t h e amount A more
Bismuth used i n these s tud ie s w a s Grade 69 obtained from Cominco
The phase diagram shows t h a t t he melting
The addition of more l i thium t o bismuth as required f o r the two metal
A spec ia l
Sequential s t eps were then as follows: 1. Solid bismuth w a s loaded i n t o a molybdenunr-lined s t a i n l e s s steel
container and t h e container was sealed under argon.
9
ORNL-DWG 75-9963
WEIGHT PERCENT BISMUTH 60 80 90 92 94 96 97 98 99
" 0 40 20 30 40 50 60 70 80 W < t O O Li ATOMIC PERCENT BISMUTH Bi
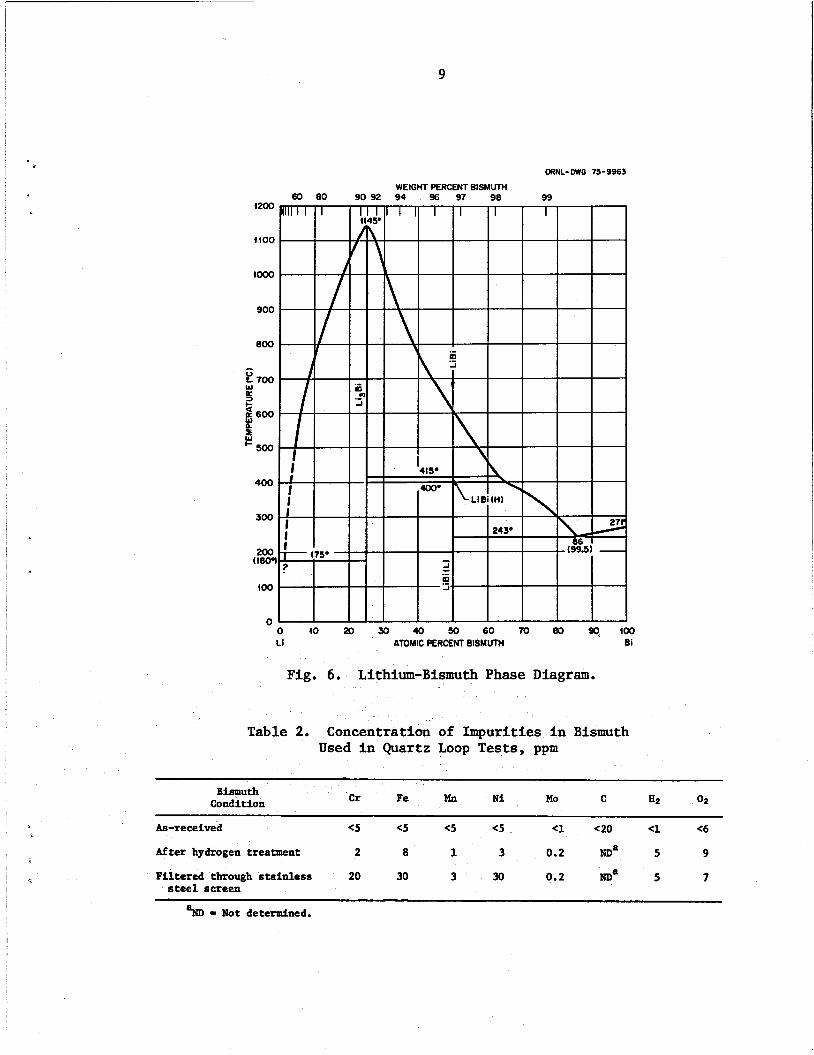
Fig. 6. Lithium-Bismuth Phase Diagram.
Table 2. Concentration of Impurities in Bismuth Used in Quartz Loop Tests, ppm
Bismuth Condition
As-received <5 <5 <5 <5 <1 <20 <1 <6
After hydrogen treatment 2 8 1 3 0.2 ma 5 9
Filtered through stainless 20 30 3 30 0.2 ma 5 7 steel screen
%I - Uot determined.
ORNL-DWG 74-12579
TO OIL BUBBLER-VENT
304SS LITHIUM FILL LINE AND BLOW BACK LINE
304ss
:’
f 304SS THERMOCOUPLE WELL
MOLYBDENUM TUBES
MOLYBDENUM LINER
L4in.d
v4 TO VACUUM
=r=- + TO ARGON
-304ss THERMOCOUPLE WELL
- 304ss
k- 2’12 in.
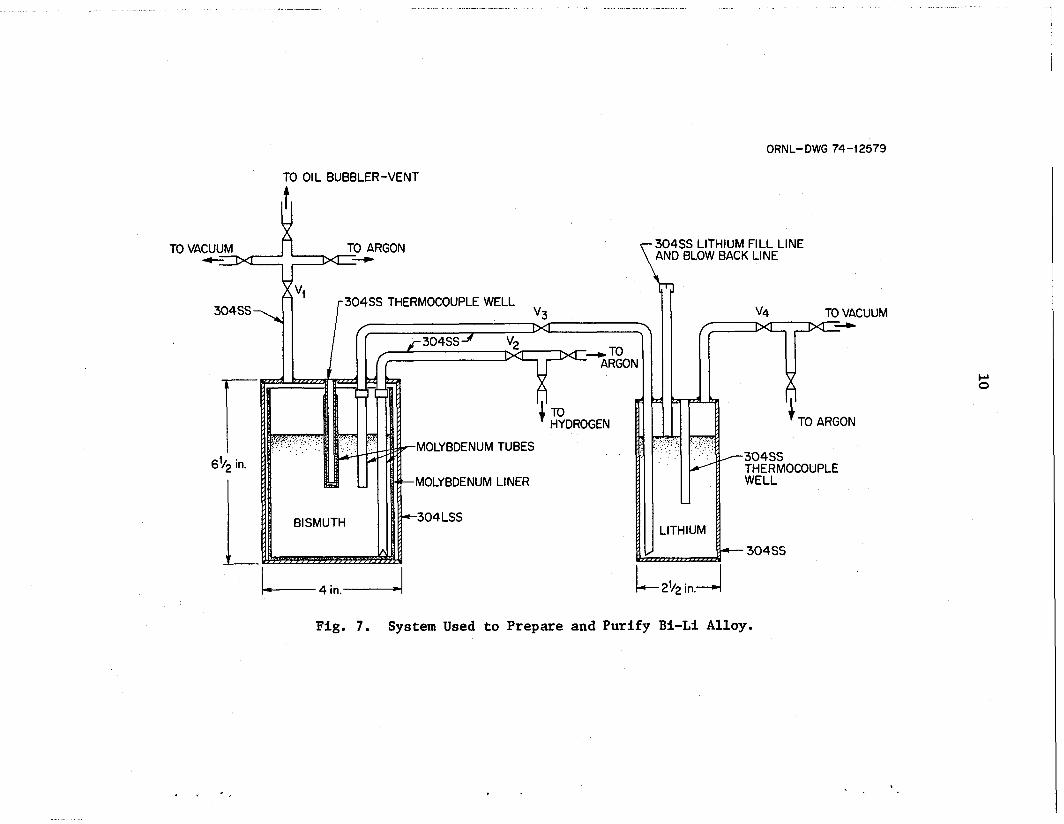
Fig. 7. System Used to Prepare and Purify Bi-Li Alloy.
I
I
1 - ! .
i *
11
2. 3.
4.
5 .
The bismuth container w a s evacuated and heated a t 650OC. Hydrogen was bubbled through the molten bismuth f o r approximately 24 hr. The temperature of the bismuth was ra i sed t o 700OC; the l i thium was heated t o 25OoC i n a separate container. Lithium w a s t ransferred i n t o the bismuth container by pressure d i f f e ren t i a l . bismuth surface (Fig. 7).
Molten l i thium was in jec ted below the l i qu id
After al loying a sample w a s taken and a typica l analysis w a s
Nominal operating conditions f o r a l l of t he loop tests w a s 7OOOC
For the quartz loop tests Cr-Al thermocouples were used; they
lithium-2.4%, hydrogen-14 ppm, and oxygen-90 ppm.
maximum hot l e g temperature and a minimum cold l e g temperature of 59U- 625OC. were located i n w e l l s protruding through the quartz i n to the l i qu id stream. Thermocouples made of P t , Pt-10% Rh were s imi la r ly inser ted i n t o w e l l s through the T-111 tubing w a l l t o measure temperature i n test CPML-1. I n test CPML-2 P t , Pt-10% Rh thermocouples w e r e again used, bu t they w e r e strapped to t h e outs ide surface of the molybdenum tubing.
A l l quartz loops were operated i n an ex terna l air environment. Refractory m e t a l loo s were operated i n a vacuum chamber a t pressures of 10-4 t o 10-5 Pa (lo-' t o 10-7 t o r r ) .
RESULTS
Compatibility results from these experiments can be grouped according t o the materials tes ted and the l i thium concentration of t he bismuth. Bismuth and Bi-O.Ol% L i so lu t ions (Groups 1 and 2) were c i rcu la ted i n quartz loops containing samples of various metals (Table 3). A so lu t ion of Bi-2,5% L i (Group 3) was c i rcu la ted i n a molybdenum loop (CPML-1) f o r 3000 h r and i n a T-111 loop (CPML-2) f o r 8700 hr. I n each case the loops contained samples of the same material as the loop i t s e l f . Alloys invest igated were based on molybdenum, tantalum, niobium, and iron. When Nb or Fe-based a l loys w e r e included, the tests operated f o r r e l a t i v e l y shor t times before the flow stopped (Quartz tests - Group 1). using only molybdenum a l loy o r tantalum a l loy samples completed t h e i r scheduled operating period (up t o 10,000 h r ) (Quartz tests - Group 2).
A l l tests
Quartz Tests - Group 1
Quartz loops 1 and 2 contained samples of TZM, tantalum, Nb-1 Z r and niobium and operated f o r 18 and 23 h r respect ively before flow stopped. I n loop 1 flow was stopped by a plug which formed a t the top of the cold leg. The samples remianed immersed i n bismuth, but the weight changes (Table 4) may reflect exposure t o air as w e l l as mass-transfer e f f ec t s .
did not f r a c t u r e the quartz. graphical ly and niobium was found t o be the major const i tuent of the plug.
The quartz f ractured a t t h i s point , exposing the bismuth to air.
Loop 2 - stopped flowing a f t e r 23 hr. Although a so l id plug had aga in formed, it
Samples of t he plug w e r e analyzed spectro-
I

12
Table 3. Summary of Quartz Loop Tests (700OC max, -1OOOC AT)
Loop Samples Fluid Time (hr)
3 6
10
1 7 7
11 12 13 18 15
Grow 1
TZMa/Ta/Nb/Nb-1% Z r B i TZM/Ta/Nb/Nb-1% Z r B i Nb/Nb-l% Z r B i Fe-5% Mo B i
Group 2
M ~ / T Z M ~ B i Ta/T-111 B i Mo brazed with B i
Ta-10% W B i MO/TZM B i 4 . O l % L i Mo B i - O . O l % L i T-111 B i - O . O l % L i Ta B i . . O l % L i Ta-10% W Bi-O.Ol% Li Mo Bi-fJ.Ol% L i
Fe-based alloys
423
3, OOOe 3,000:
3,O0Oe 2,100,
3,000, 3,000, 3,000,
3,000, 3,000,
3,000,
10,000
TZM is M d . 5 % T i 4 . 1 % Z r . a
bFlow stopped. C Terminated, samples dissolved.
d T - l l l i s Ta-8% W-2% Hf. e Completed .
Table 4. Weight Changes i n Samples From Quartz Loop la
Materia 1 Location Weight change (mg/cm2)
Corrosion rate (mg/cm2 yr)
Tantalum Hot leg TZM Hot leg -1% Z r Hot leg Niobium Hot leg Tantalum Cold leg TZM Cold leg
Nb-1% Z r Cold leg
4 . 4 -15.9 -54.3 -31.0
+O. 3 -11.0
-4.9
~~
-195
-7,738
UX46
-2 ; 38%
Niobium Cold leg -1.3 -633 a After 18 hr i n bismuth a t 700°C maximum temperature and 100°C
temperature different ia l .
13
X-ray d i f f rac t ion a l so indicated the presence of small amounts of Bi203-Nb205. bismuth might be responsible f o r these results, bismuth used i n subsequent group 1 tests was purif ied by bubbling hydrogen through the molten metal f o r 2 hr a t 35OoC and then f i l t e r i n g as described previously.
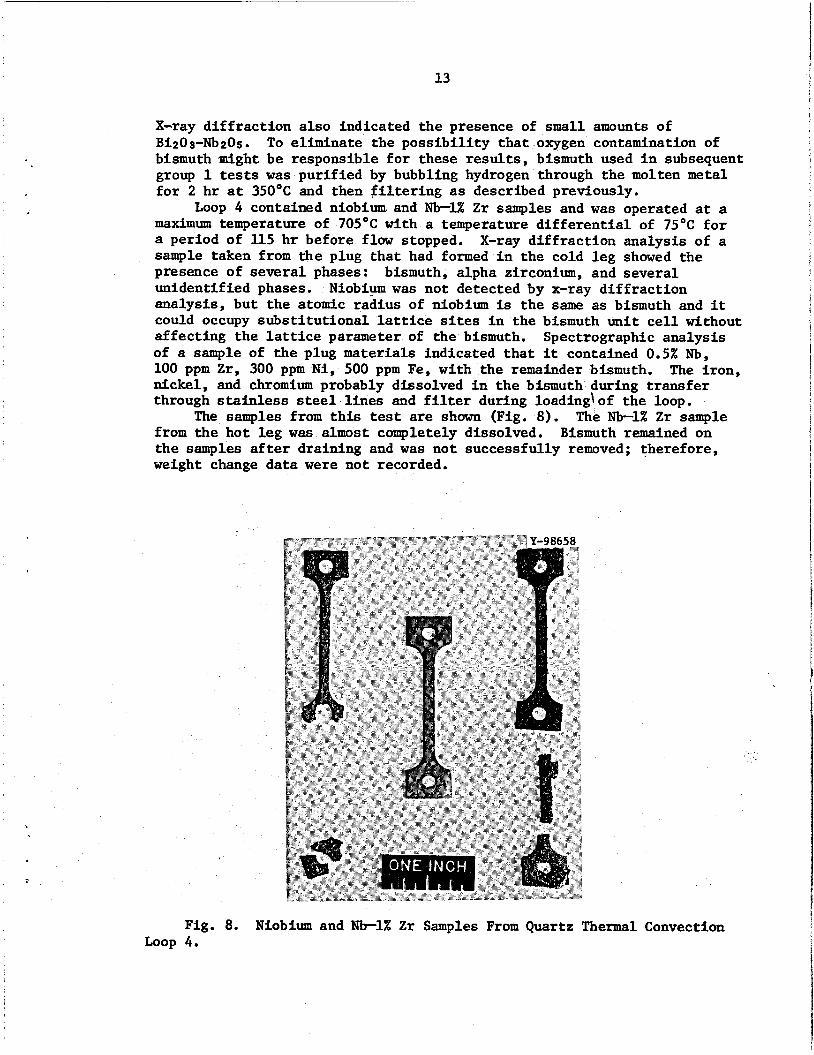
Loop 4 contained niobium. and -1% Z r samples and w a s operated a t a maximum temperature of 705'C with a temperature d i f f e ren t i a l of 75OC f o r a period of 115 hr before f l o w stopped. X-ray d i f f rac t ion analysis of a sample taken from the plug tha t had formed i n the cold l eg showed the presence of several phases: unidentified phases. analysis, but the atomic radius of niobium is the same as bismuth and it could occupy subs t i tu t iona l lat t ice sites i n the bismuth un i t cel l without affect ing the lattice parameter of the bismuth. Spectrographic analysis of a sample of the plug materials indicated tha t i t contained 0.5% Nb, 100 ppm Z r , 300 ppm N i , 500 ppm Fe, with the remainder bismuth. nickel, and chromium probably dissolved i n the bismuth during t ransfer through stainless steel l i nes and f i l t e r during loadingjof the loop.
from the hot l eg w a s almost completely dissolved. the samples a f t e r draining and w a s not successfully removed; therefore, weight change data w e r e not recorded.
To eliminate the poss ib i l i t y t h a t oxygen contamination of
bismuth, alpha zirconium, and several Niobiym was not detected by x-ray d i f f rac t ion
The i ron,
The samples from t h i s test are shown (Fig. 8). The -1% Z r sample Bismuth remained on
Fig. 8. Niobium and -1% Z r Samples From Quartz Thermal Convection Loop 4.
1 4
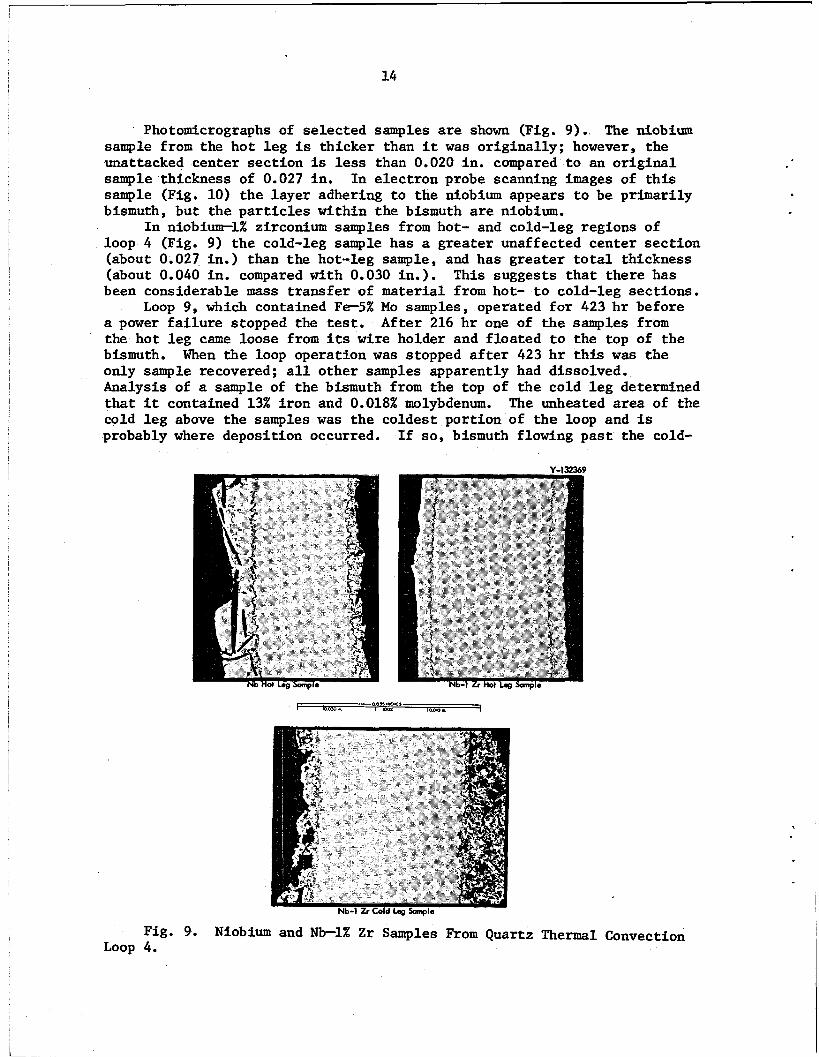
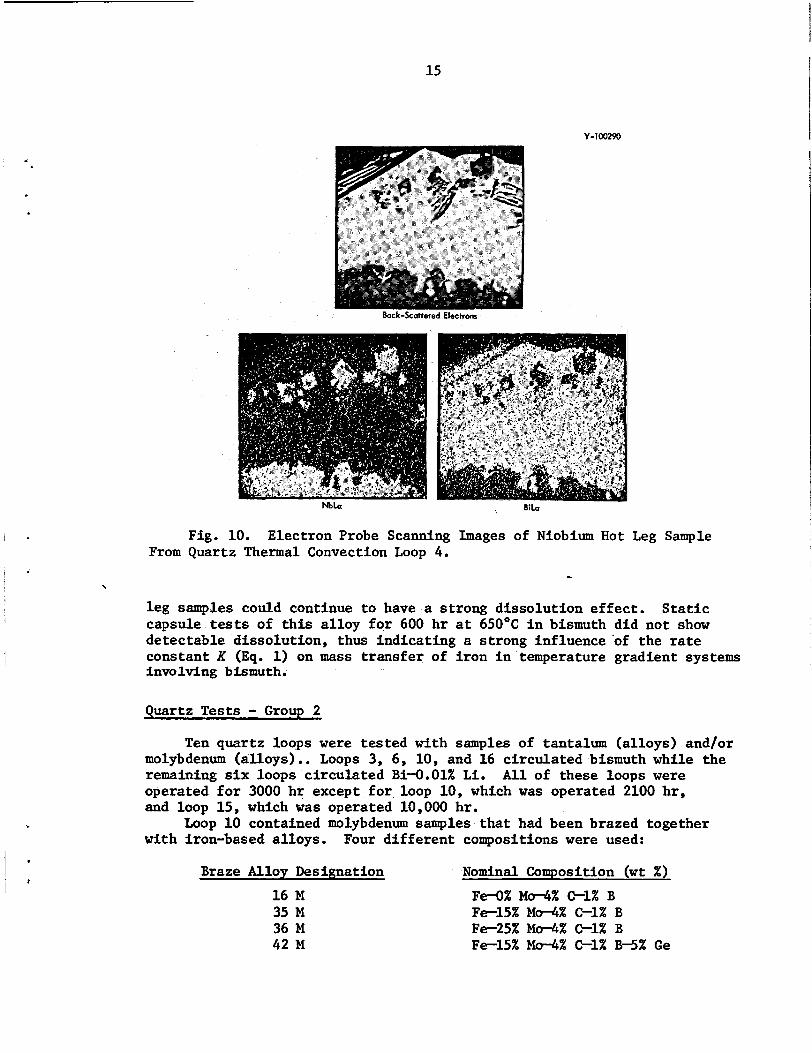
Photomicrographs of se lec ted samples are shown (Fig. 9) . The niobium sample from the hot l e g is thicker than i t was o r ig ina l ly ; however, the unattacked center sec t ion is less than 0.020 in . compared t o an o r ig ina l sample thickness of 0.027 in . In e lec t ron probe scanning images of t h i s sample (Fig. 10) the layer adhering t o the niobium appears t o be primarily bismuth, but the p a r t i c l e s within the bismuth are niobfum.
loop 4 (Fig. 9) t he cold-leg sample has a grea te r unaffected center sec t ion (about 0.027 in.) than the hot-leg sample, and has grea te r t o t a l thickness (about 0.040 in . compared with 0.030 in.) . This suggests t h a t there has been considerable mass t r ans fe r of material from hot- t o cold-leg sect ions.
Loop 9, which contained Fe-5% Mo samples, operated f o r 423 h r before a power f a i l u r e stopped the test. the hot l eg came loose from i ts wire holder and f loa ted t o the top of the bismuth. only sample recovered; a l l other samples apparently had dissolved. Analysis of a sample of the bismuth from the top of t he cold l e g determined t h a t it contained 13% i ron and 0.018% molybdenum. The unheated area of the cold l eg above the samples was t he coldest port ion of t h e loop and is probably where deposit ion occurred.
I n niobium-1% zirconium samples from hot- and cold-leg regions of
After 216 h r one of t he samples from
When the loop operation w a s stopped a f t e r 423 h r t h i s w a s t he
I f so, bismuth flowing pas t the cold-
Fig. 9. Niobium and -1% Z r Samples From Quartz Thermal Convection Loop 4.
L
15
Y-100290
,
, B i b
Fig. 10. Electron Probe Scanning Images of Niobium Hot Leg Sample From Quartz Thermal Convection Loop 4.
- \
l e g samples could continue t o have a strong d isso lu t ion e f f ec t . S ta t ic capsule tests of t h i s a l loy f o r 600 h r a t 65OOC i n bismuth did not show detectable dissolut ion, thus indicat ing a strong influence 'of the rate constant K (Eq. 1) on mass t ransfer of i ron i n temperature gradient systems involving bismuth.
Quartz T e s t s - Group 2
Ten quartz loops were tes ted with samples of tantalum (al loys) and/or molybdenum (alloys). . Loops 3, 6, 10, and 16 c i rcu la ted bismuth while the remaining s ix loops c i rcu la ted Bi-O.Ol% L i . A l l of these loops w e r e operated f o r 3000 hr except f o r loop 10, which was operated 2100 h r , and loop 15, which w a s operated 10,000 hr.
with iron-based al loys. Loop 10 contained molybdenum samples t h a t had been brazed together
Four d i f f e ren t compositions were used:
Braze Alloy Designation Nominal Composition (wt %)
16 M 35 M 36 M 42 M
F d % M d % -1% B Fe-15% Mo-4% C 1 X B Fe-25% M d % C1% B Fe-15% M d % C1% B S % G e

16
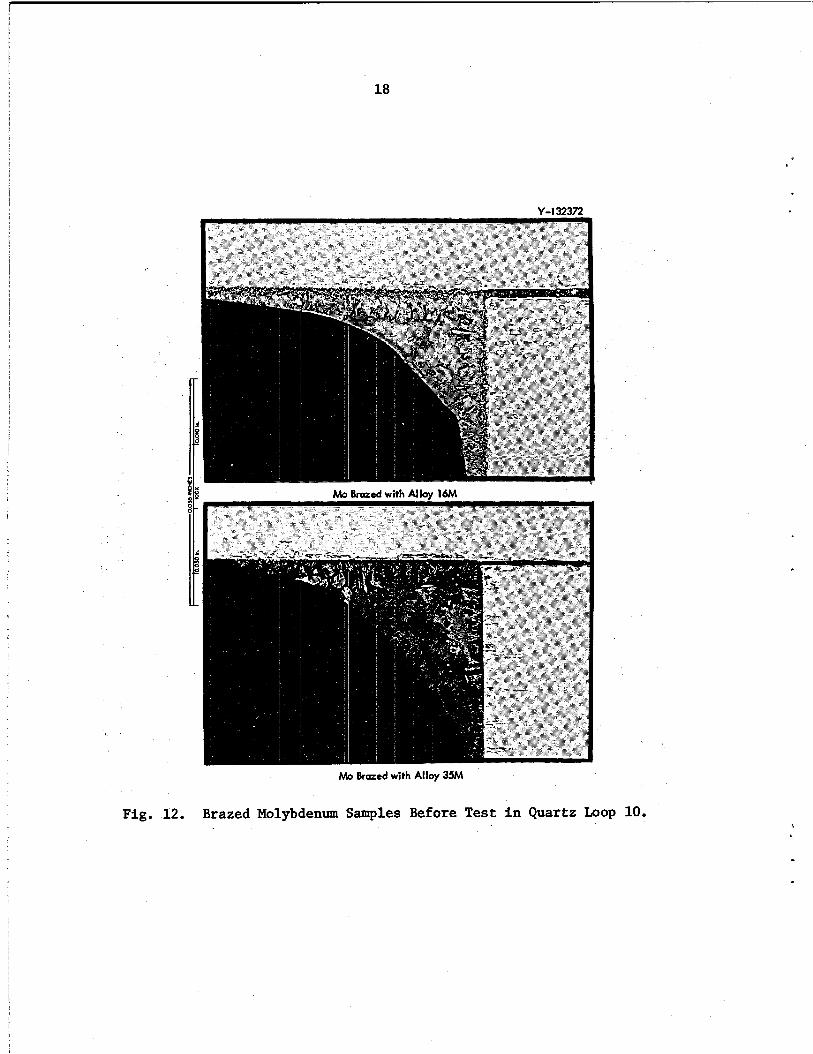
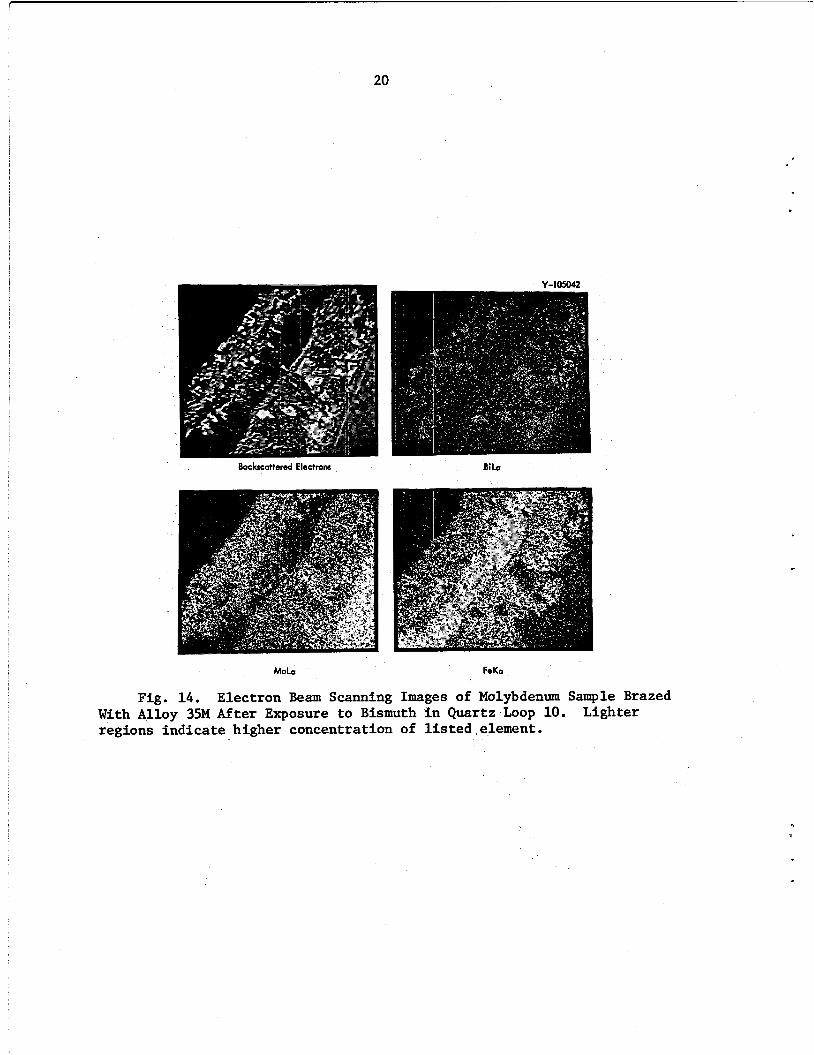
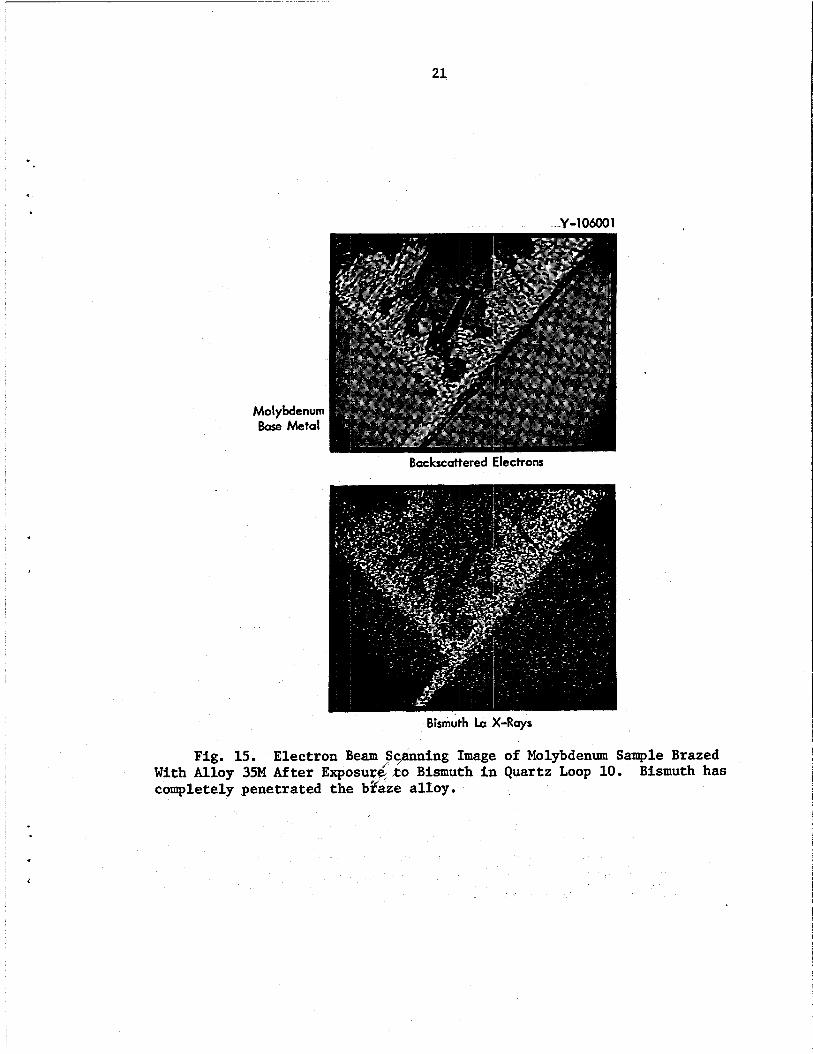
The loop operation was stopped after 2100 h r and weight changes of the samples were measured (Table 5). ana lys i s of t he bismuth gave l i t t l e evidence t h a t d i sso lu t ion had occurred. Iron and molybdenum concentrations were less than 3 ppm, and carbon w a s 8-13 ppm. braze a l loys contained an outer surface layer (Fig. 11). examination was made of t h e samples brazed with a l loys 16 M and 35 M. For t h e a l loys before test no outer surface layer was v i s i b l e (Fig. 12). An e lec t ron beam microprobe ana lys i s determined the d i s t r i b u t i o n of i ron , molybdenum, and bismuth i n the braze a f t e r test. I n a l loy 16 M t he outer surface l aye r w a s r i c h i n i ron; t h e whi te -par t ic les contained 88% bismuth, 5% molybdenum, and less than 0.5% i r o n (Fig. 13). the white p a r t i c l e s contained 41% bismuth, 23% molybdenum, and 4% i ron , while t he dark spots w e r e predominantly i r o n (about 70%). I n a l loy 35 M the surface layer appears t o be subdivided i n t o two segments (Fig. 14) with the outermost segment r i c h i n molybdenumand the inner segment predominantly i ron. Bismuth has completely penetrated t h e braze (Fig. 15). Thus, although there was l i t t l e evidence of mass t r ans fe r , bismuth d id react with the iron-based braze al loys.
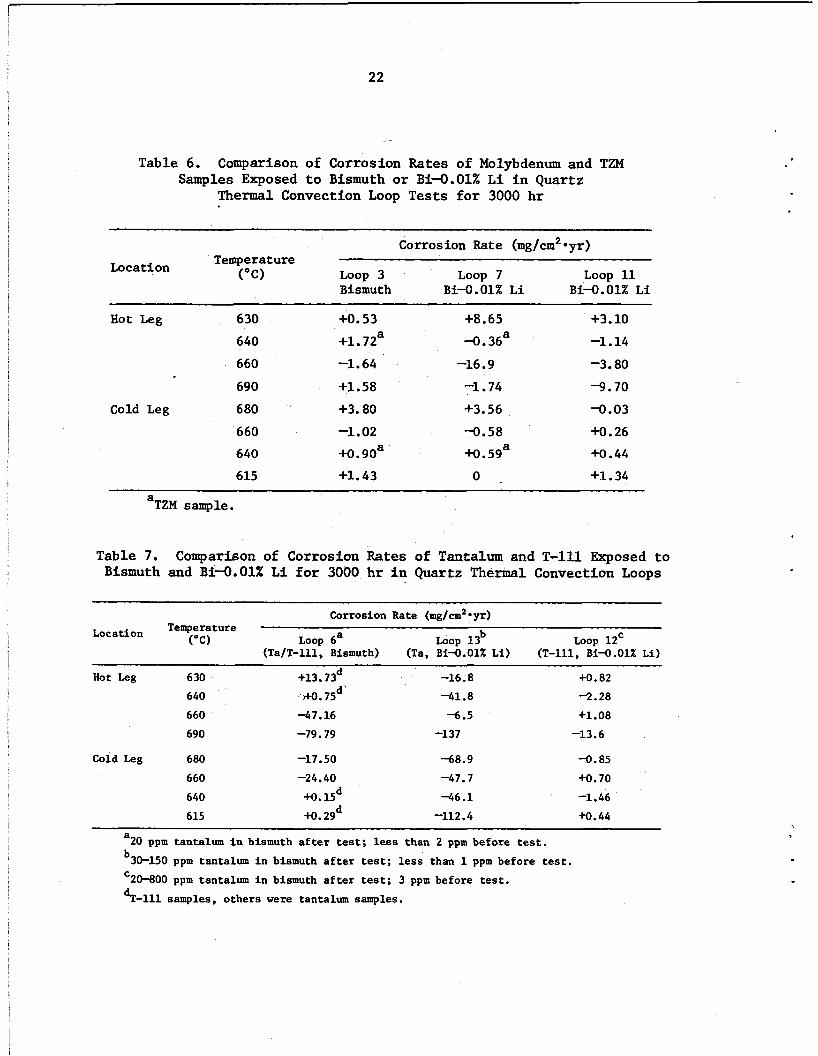
The e f f e c t of l i thium i n bismuth on the corrosion rates of Mo/TZM, Ta/T-111, and Ta-10% W is shown i n Tables 6, 7, and 8 . Maximum corrosion rate (weight l o s s ) of molybdenum i n B i - O . O l % L i w a s 16.9 mg/cm2-yr compared with 1.64 mg/cm2*yr i n pure bismuth. Tantalum and T-111 a l so showed higher rates of mass t r ans fe r i n Bi -O .Ol% L i , bu t Ta-10% W showed t h e opposite e f f e c t - a higher corrosion rate i n bismuth compared with Bi-O.Ol% L i , where a l l the samples exhibited small weight gains.
They were very small weight changes, and
However, metallographic examination showed t h a t each of t he A more de ta i led
An area adjacent t o
Table 5. Weight Ccanges i n Molybdenum-Braze Samples Exposed t o Bismuth i n Quartz Thermal Convection Loop T e s t s
Conditions: 7OOOC Max Hot Leg Temperature; 95OC Temperature Di f f e ren t i a l ~ ~~ ~~
Braze Alloy
~
Weight Change (mg)
Hot Leg Cold Leg
16 M ( F A % C1% B) -1.6 Sample not included
35 M ( F A % C1% B-15% Mo) -4.2 +12.2
36 M ( F e 4 % el% B-25% Mo) -16.6 +5.0
42 M (Fe-4% C-1% B-15% MaSX Ge) -0 .2 +2.2

17
I 1
7
18
Y-132372
%IS Ma Brazed with AIlw 16h4
h b Brazed with Alloy 35M
F i g . 12. Brazed Molybdenum Samples Before Test in Quartz Loop 10.

19
Y-106Wo -
Backscattered Electrons Fe k
BiLa
Fig. 13. Electron Beam Scanning Images of Molybdenum Sample Brazed '
With Alloy 16M After Exposure t o Bismuth i n Quartz Loop 10. regions indicate higher concentration of l i s t e d element.
Lighter
20
F i g .
Backscattered Electrons B i b
MoLa FeKa
14. Electron Beam Scanning Images of Molybdenum Sample Brazed With Alloy 35M After Exposure to Bismuth i n Quartz Loop 10. regions indicate higher concentration of l i s t e d element.
Lighter
21
Molybdenum Base Metal
-Y -1 0600 1
Backscattered Electrons
Bismuth Lo X-Rays
Fig. 15. Electron BeamFcymning Image of Molybdenum Sample Brazed With Alloy 35M After ExposurqRo Bismuth i n Quartz Loop 10. completely penetrated the bifaze al loy.
Bismuth has
22
Table 6. Comparison of Corrosion Rates of Molybdenum and TZM
Thermal Convection Loop Tests for 3000 hr Samples Exposed to Bismuth or Bi-O.Ol% Li in Quartz
Corrosion Rate (mg/cm*-yr) Temperature
("C) Loop 3 Loop 7 Loop 11 Location Bismuth Bi -O.Ol% L i Bi-O.Ol% L i
Hot Leg 6 30 640 660
690
Cold Leg 6 80
660 640
615
+O. 53 +l. 72a -1.64
+I. 58 +3.80 -1.02 +0.90a +l. 43
+8.65 -0. 36a
-16.9 -1.74 +3.56 -0.58 +o. 5ga
0 .
+3.10 -1.14 -3.80 -9.70
-0.03 +0.26 w.44 +I. 34
a TZM sample.
Table 7. Comparison of Corrosion Rates of Tantalum and T-13.1 Exposed to Bismuth and Bi-O.Ol% Li for 3000 hr in Quartz Thermal Convection Loops
Corrosion Rate (mg/cm2*yr) - Temperature
('C) Loop 6a Loop 13b Loop 12= Location
(Ta/T-111, Bismuth) (Ta, Bi4.01X L i ) (T-111, BI4.01X; Li)
Hot Leg 6 30 640
660
690
Cold Leg 680
660
640
615
+13. 73d
rH). 75d'
-47.16
-79.79
-17.50
-24.40
+O. 15d d +O. 29
~
-16.8
-41.8
-6.5 -137
-68.9
-47.7
-46.1
-112.4
~~
+0.82
-2.28
+1.08
-13.6
-0.85
+0.70
-1.46
+0.44 ~
a
b30-150 pprn tantalum in bismuth a f t e r test; less than 1 ppm before test.
2HOO ppm tantalum i n bismuth a f t e r test; 3 ppm before test.
d T - l l l samples, others w e r e tantalum samples.
20 ppm tantalum i n bismuth a f t e r test; less than 2 ppm before test.
C
23
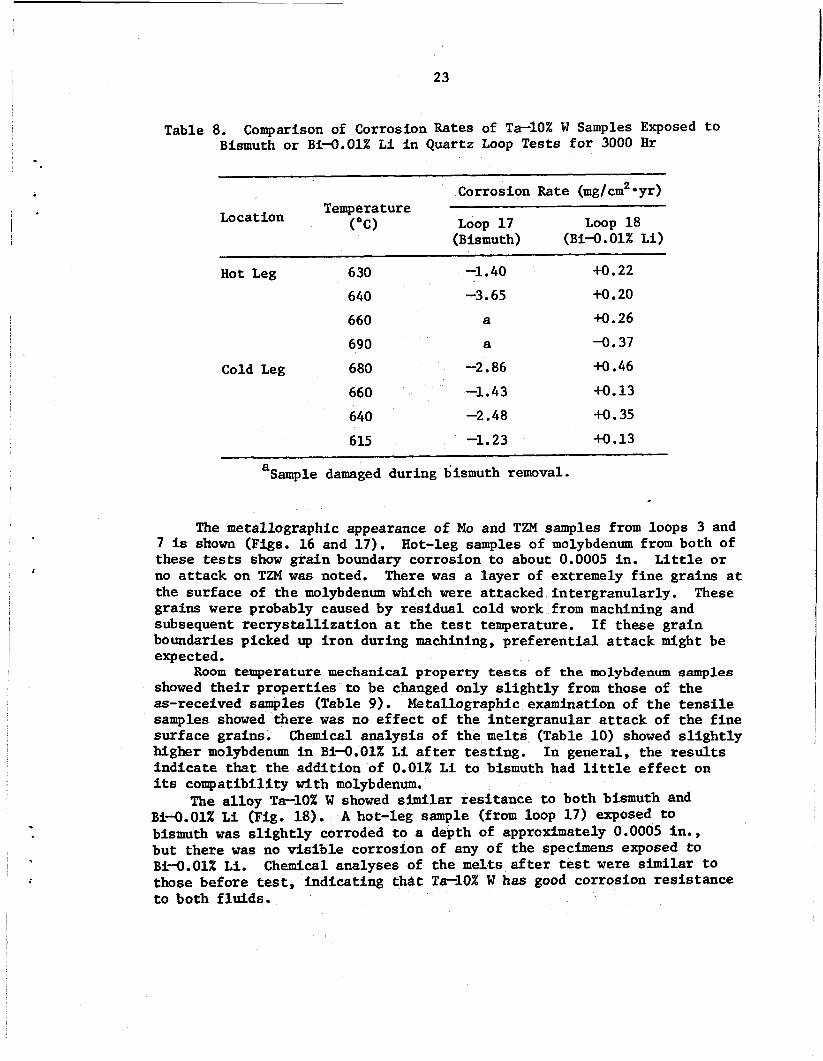
Table 8. Comparison of Corrosion Rates of Ta-lO% W Samples Exposed t o Bismuth or Bi -O .Ol% L i i n Quartz Loop T e s t s f o r 3000 H r
~~
Corrosion Rate (mg/cm2*yr) Temperature
("C) Loop 1 7 Loop 18 Location (Bismuth) (Bi-0.OlX Li)
. w
Hot Leg 6 30 -1.40 +o. 22
640 -3.65 +o 20
660 a +0.26
690 a -0.37
Cold Leg 680 -2.86 +O .46
660 -1.43 +o. 13
640 -2.48 +o. 35
615 -1.23 +O .13
a Sample damaged during bismuth removal.
The metallographic appearance of Mo and TZM samples from loops 3 and Hot-leg samples of molybdenum from both of
There was a layer of extremely f i n e grains a t
7 is shown (Figs. 16 and 17). these tests show grain boundary corrosion t o about 0.0005 in . no a t tack on TZM w a s noted. the surface of the molybdenum which were attacked intergranularly. grains w e r e probably caused by residual cold work from machining and subsequent r ec rys t a l l i za t ion a t the test temperature. boundaries picked up i ron during machining, p re fe ren t i a l a t tack might be expected.
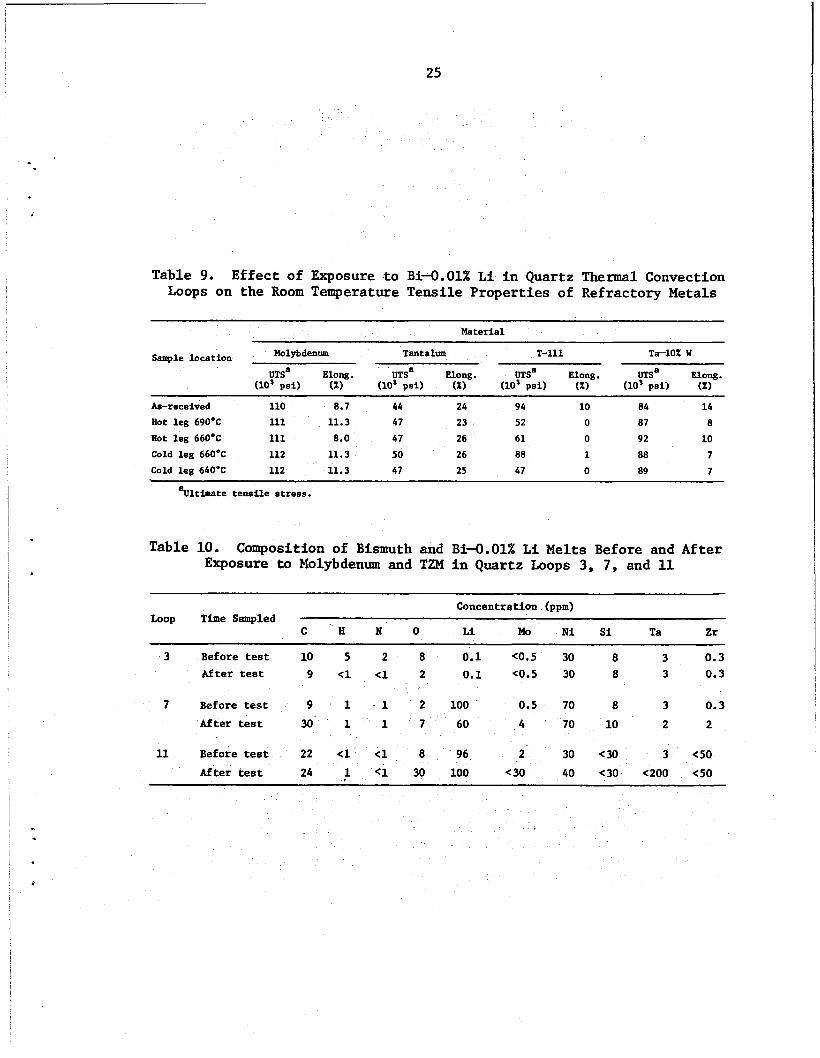
Room temperature mechanical property tests of the molybdenum samples showed t h e i r propert ies to be changed only s l i g h t l y from those of the as-received samples (Table 9 ) . Metallographic examination of t he t e n s i l e samples showed there was no e f f e c t of the intergranular a t tack of the f i n e surface grains. Chemical analysis of t he melts (Table 10) showed s l i g h t l y higher molybdenum i n Bi+I .Ol% L i a f t e r tes t ing . I n general, the results indica te that the addi t ion of 0.01% L i t o bismuth had l i t t l e e f f e c t on i t s compatibil i ty with molybdenum.
Bi-O.Ol% L i (Fig. 18). bismuth w a s s l i g h t l y corroded t o a depth of approximately 0.0005 in . , but there w a s no v i s i b l e corrosion of any of the specimens errposed t o Bi-O.Ol% Li . those before test, ind ica t ing tha t T e l O % W has good corrosion res i s tance
L i t t l e o r
These
I f these gra in
The a l loy Ta-10% W showed similar res i tance t o both bismuth and A hot-leg sample (from loop 17) exposed t o
Chemical analyses of the m e l t s a f t e r test were similar t o
to both f lu ids .

Y-99457 Cold lag
Fig. 16. Molybdenum and TZM Samples From Quartz Loop 3.
Fig. 17. Molybdenum and TZM Samples From Quartz Loop 7.
25
Table 9. Effect of Exposure to Bi-O.Ol% L i i n Quartz Thermal Convection Loops on the Room Temperature Tensile Properties of Refractory Metals
Material
Molybdenum Tantalum T-111 Ta-10% W Sample location
UTSa Elong . UTSa Elong . UTSa Elong. UTSa Elong . (10' psi) ( X ) (10' PSI) (I) (io3 Psi) ( x ) (10' psi) (%)
Hot l eg 69OoC ll1 11.3 47 23 52 0 a7 a Hot leg 660.C 111 8.0 47 26 61 0 92 10 Cold l e g 66OoC 112 11.3 50 26 aa 1 aa 7 Cold leg 64OoC 112 11.3 47 25 47 0 a9 7
As-received 110 a. 7 44 24 94 10 a4 14
%timate tensile stress.
Table 10. Composition of Bismuth and Bi-O.Ol% L i Melts Before and After Exposure to Molybdenum and TZM i n Quartz Loops 3, 7 , and 11
~~~~
Concentration (ppm) Loop Time Sampled
C H N O Li Mo Ni Si Ta Zr
3 Before test 10 5 2 8 0.1 C0.5 30 8 3 0.3 After test 9 <1 <1 2 0.1 <0.5 30 8 3 0.3
7 Before test 9 1 1 2 100 0.5 70 8 3 0.3
After test 3 0 1 1 7 4 70 10 2 2
11 Before test 22 <1 <1 8 96 2 30 <30 3 <SO
M ter test 24 1 <1 30 100 < 30 40 <30 <200 <50
26
Before Test
, MICRONS , 390 3!p M O Y
!m '90
Before Test Hot Leg: M.26 mg/cm2/yr Cold Leg: 40.13 mg/cm*/yr
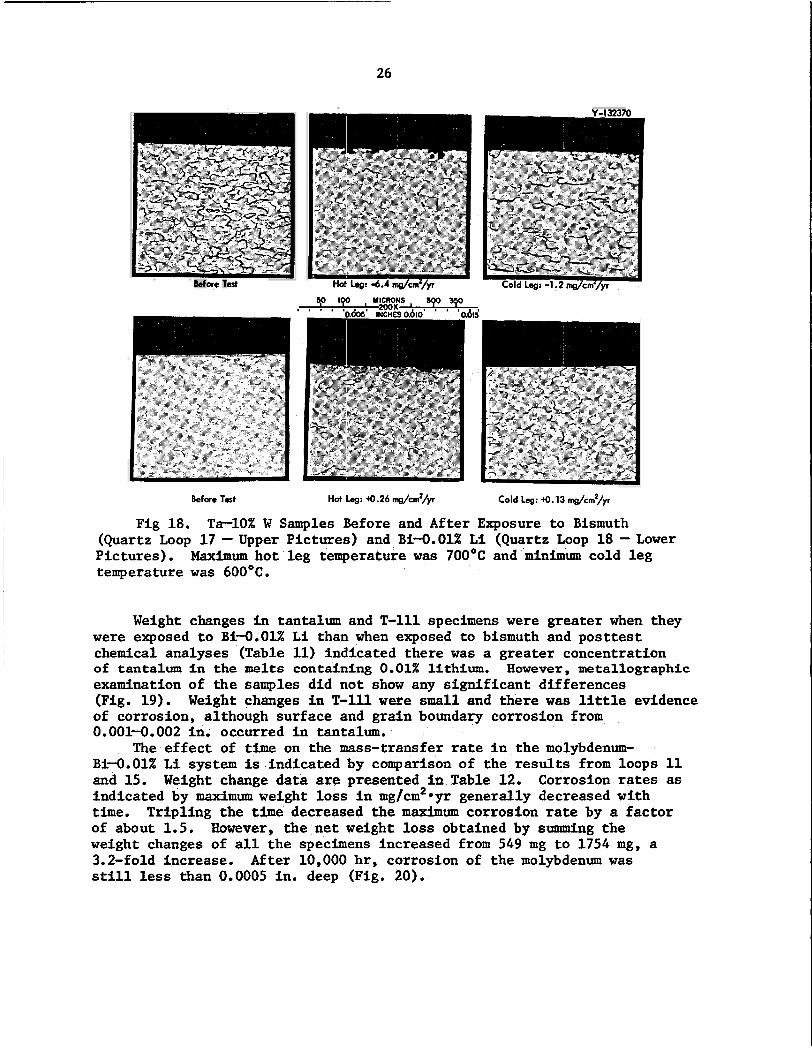
Fig 18. Ta-10% W Samples Before and After Exposure to Bismuth
Maximum hot leg temperature was 7OO0C and minimum cold leg (Quartz Loop 1 7 -Upper Pictures) and B i - O . O l % L i (Quartz Loop 18 -Lower Pictures). temperature w a s 60OoC.
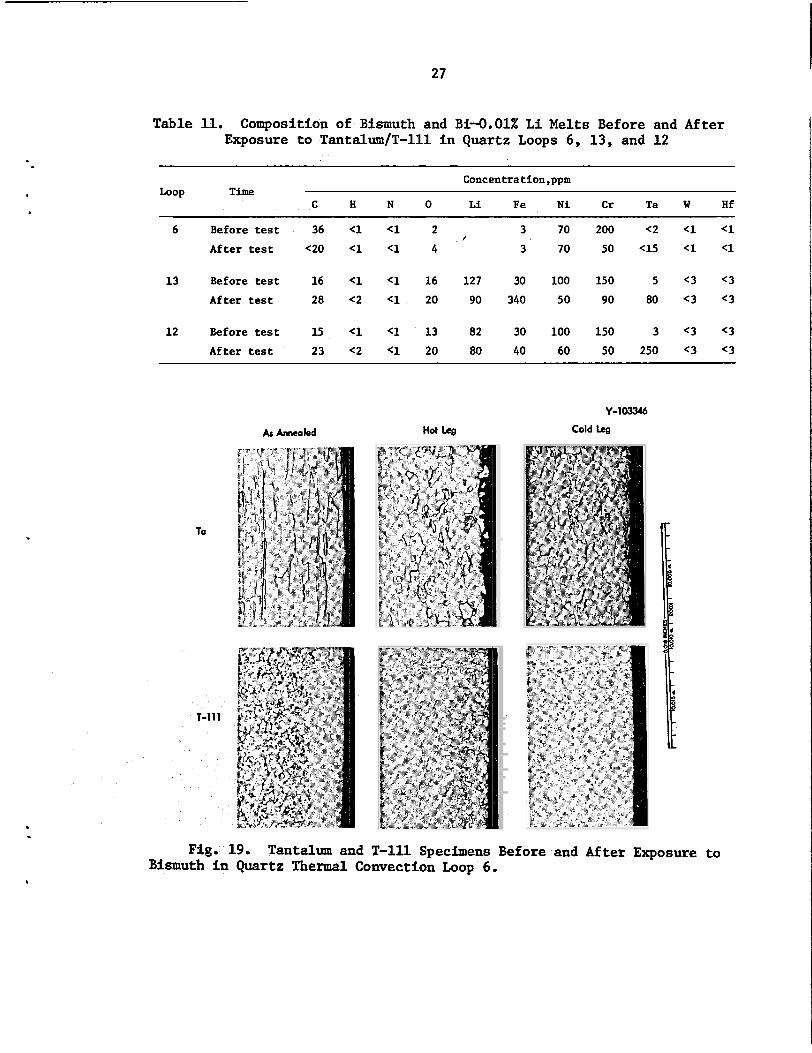
Weight changes i n tantalum and T-111 specimens were greater when they w e r e exposed t o Bi-O.Ol% L i than when exposed to bismuth and post tes t chemical analyses (Table 11) indicated there was a greater concentration of tantalum in the melts containing 0.01% lithium. However, metallographic examination of the samples did not show any s ignif icant differences (Fig. 19). of corrosion, although surface and grain boundary corrosion from 0.001-0.002 in. occurred i n tantalum.
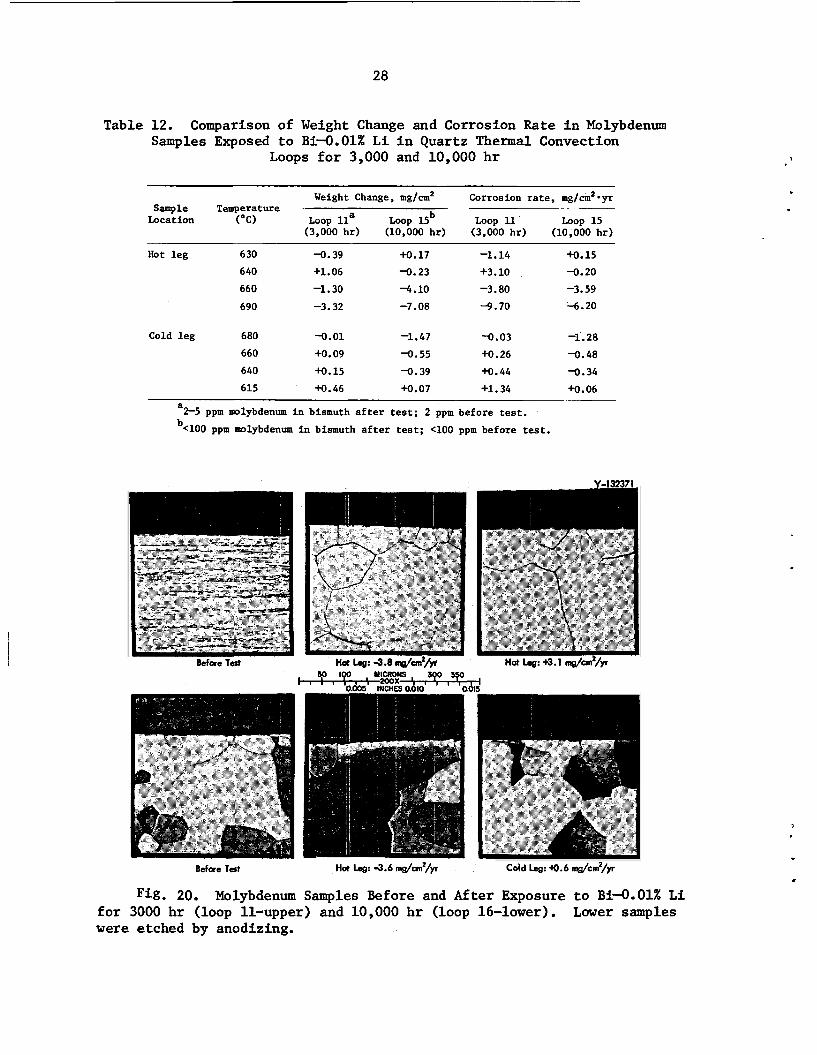
The ef fec t of time on the mass-transfer r a t e i n the molybdenum- B i - O . O l % L i system is indicated by comparison of the results from loops 11 and 15. Corrosion rates as indicated by maximum weight loss i n mg/cm2=yr generally decreased with time. of about 1.5. weight changes of a l l the specimens increased from 549 mg t o 1754 mg, a 3.2-fold increase. After 10,000 hr , corrosion of the molybdenum was s t i l l less than 0.0005 in. deep (Fig. 20).
Weight changes i n T-111 were small and there was l i t t l e evidence
Weight change data are presented i n Table 12.
Tripling the time decreased the maximum corrosion rate by a factor However, the net weight loss obtained by summing the
27
Table 11, Composition of Bismuth and Bi-O.Ol% Li Melts Before and After Exposure to Tantalum/T-111 in Quartz Loops 6, 13, and 12
Concentration,ppm Loop Time
C H N 0 Li Fe Ni Cr Ta W Hf
6 Before test 36 <1 <1 2 3 70 200 <2 <1 <1 After test <20 <1 <1 4 3 70 50 <15 <1 <1
/
13 Before test 16 <1 <1 16 127 30 100 150 5 <3 <3
12 Before test 15 <1 <1 13 82 30 100 150 3 <3 <3 After test 23 <2 <1 20 80 40 60 50 250 <3 <3
k Annealed
la 5
Hot leg
Y-103346
Cold leg
w
Fig. 19. Tantalum and T-1U. Specimens Before and After Exposure to Bismuth in Quartz Thermal Convection Loop 6.
L
28
Table 12. Comparison of Weight Change and Corrosion Rate i n Molybdenum Samples Exposed t o B i - O . O l % L i i n Quartz Thermal Convection
Loops f o r 3,000 and 10,000 h r
Weight Change, mg/cm2
b Sample Temperature La ca t ion ("C) Loop lla Loop 1 5
(3,000 h r ) (10,000 h r )
Ho t l e g 630 -0.39 +O. 17
640 + l . 06 -0.23
660 -1.30 -4.10
690 -3.32 -7.08
~~ ~
Corrosion rate, mg/cm2*yr
Loop 11 Loop 1 5 (3,000 h r ) (10,000 h r )
-1.14 +0.15
+3.10 -0.20
-3.80 -3.59 4 - 7 0 -6.20
Cold l e g 680 -0.01 -1.47 -0.03 -1'. 2 8
660 +o. 09 -0.55 +O. 26 -0.48
640 +o.15 -0.39 4.0.44 -0.34
615 M.46 4.0.07 +l. 34 +0.06
a2-5 ppm molybdenum i n bismuth after test; 2 ppm be fo re test.
b < l O O ppm molybdenum i n bismuth a f t e r test; <lo0 ppm be fo re test.
Befae Test Hot Lag: -3.6 ma/Un*/yr Cold Leg: 4.6 ma/cnf/Vr
Fig. 20. Molybdenum Samples Before and After Exposure t o B i - O . O l % L i fo r 3000 h r (loop 11-upper) and 10,000 h r (loop 16-lower). were etched by anodizing.
Lower samples
c
29
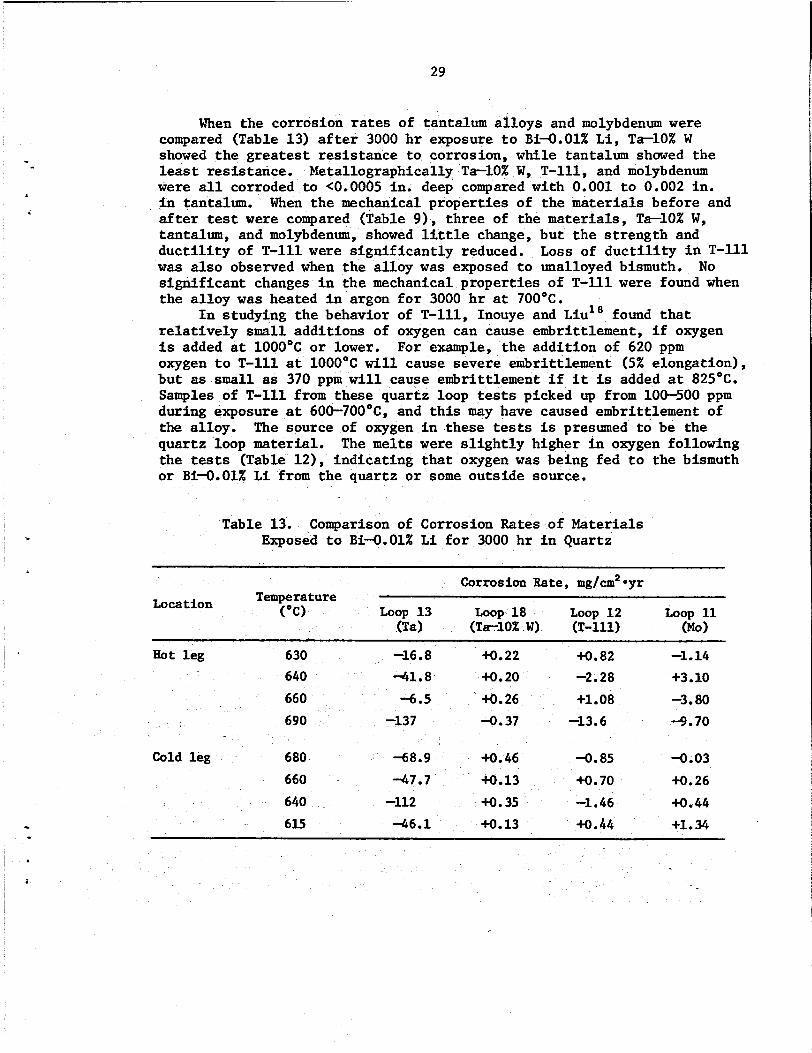
When the corrosion rates of tantalum a l loys and molybdenum were compared (Table 13) a f t e r 3000 h r exposure t o B i - O . O l % L i , T e l O % W showed the g rea t e s t r e s i s t ance t o corrosion, w h i l e tantalum showed the least resis tance. Metallographically Ta-10% W, T-111, and molybdenum w e r e a l l corroded to <0.0005 in . deep compared with 0.001 t o 0.002 in . i n tantalum. a f t e r test w e r e compared (Table 9), th ree of the materials, Ta-10% W, tantalum, and molybdenum, showed l i t t l e change, bu t t h e s t rength and d u c t i l i t y of T-111 were s i g n i f i c a n t l y reduced. was a l so observed when the a l loy was exposed t o unalloyed bismuth. s i g n i f i c a n t changes i n t h e mechanical proper t ies of T-111 were found when the a l loy w a s heated i n argon f o r 3000 h r a t 700OC.
In studying the behavior of T-111, Inouye and Liu18 found t h a t r e l a t i v e l y small addi t ions of oxygen can cause embrittlement, i f oxygen is added a t 1000°C o r lower. For example, t h e addi t ion of 620 ppm oxygen t o T-111 a t 1000°C w i l l cause severe embrittlement (5% elongation), but as small as 370 ppm w i l l cause embrittlement i f i t is added a t 825OC. Samples of T-111 from these quartz loop tests picked up from 100500 ppm during exposure a t 600-7OO0C, and t h i s may have caused embrittlement of the al loy. quartz loop material. The m e l t s were s l i g h t l y higher i n oxygen following the tests (Table 12) , ind ica t ing t h a t oxygen w a s being fed t o the bismuth o r Bi-O.01X L i from the quartz o r some outs ide source.
When the mechanical proper t ies of the materials before and
Loss of d u c t i l i t y i n T-111 No
The source of oxygen i n these tests is presumed t o be the
Table 13. Comparison of Corrosion Rates of Materials Exposed t o Bi-O.Ol% L i f o r 3000 h r i n Quartz
Corrosion Rate, mg/cm2 *yr
(Tal (TB~OX .W) (T-111) (Mol
Temperature ("0 Loop 13 Loop 18 Loop 12 Loop 11 Location
Hat leg
Cold leg
630 640 660 690
680 660 640 615
-16.8 +o. 22 M. 82 -61.8 M. 20 -2.28 -6.5 M.26 +l. 08
-137 -0.37 -13.6
-68.9 M.46 -0.85 -47.7 M.13 +0.70 -112 M. 35 -1.46 -46.1 M.13 4.0.44
-1.14 +3.10 -3.80 -9.70
-0.03 M.26 M.44 +l. 34
30
Metal Loop Tests i n Bi-2.5% L i - Group 3
Two all-metal loop tests w e r e operated with Bi-2.5% Li . One loop (of T-111) operated f o r 3000 hr while the second (of molybdenum) operated f o r 8700 hr. Maximum temperature was 7OOOC and the AT during operation was approximately 100°C. enclosure.
There w a s very s l i g h t (less than 0.0005 in. deep) metallographic evidence o r corrosion, and room-temperature t e n s i l e tests showed no changes i n mechanical propert ies of pos t t e s t samples compared with the s t a r t i n g material. The oxygen content of the T-111 samples averaged 240 pprn a f t e r test compared with 60 ppm before test. However, i n addi t ion t o bismuth exposure, t he T-111 samples and loop were both annealed i n vacuum f o r -2 h r a t 140OOC p r i o r t o test. a f t e r test suggests t ha t much of the oxygen increase occurred during the vacuum anneal. I n cont ras t t o t he e f f e c t on T-111 a t lower temperatures, the addi t ion of 100-200 ppm a t 140OoC did not embr i t t l e t he samples. l9 lower temperatures oxygen i n T-111 p re fe ren t i a l ly assoc ia tes with hafnium as extremely f i n e hafnium-oxygen zones that are coherent w i t h the matrix. zones i s sluggish, bu t at high temperatures coarsening readi ly occurs and t h e a l loy i s more duc t i l e i n t h i s condition. T-111 from the quartz loop tests were heat-treated f o r 1 h r at 140OoC and d u c t i l i t y was res tored as determined by room temperature bend tests, Specimens from the quartz loops w e r e 0.020-in.-thick f l a t samples compared with '0.125-in.-diam t e n s i l e bars i n t h i s test. homogeneously d is t r ibu ted i n the samples, specimen geometry probably did not contr ibute t o the difference i n d u c t i l i t y that w a s noted.
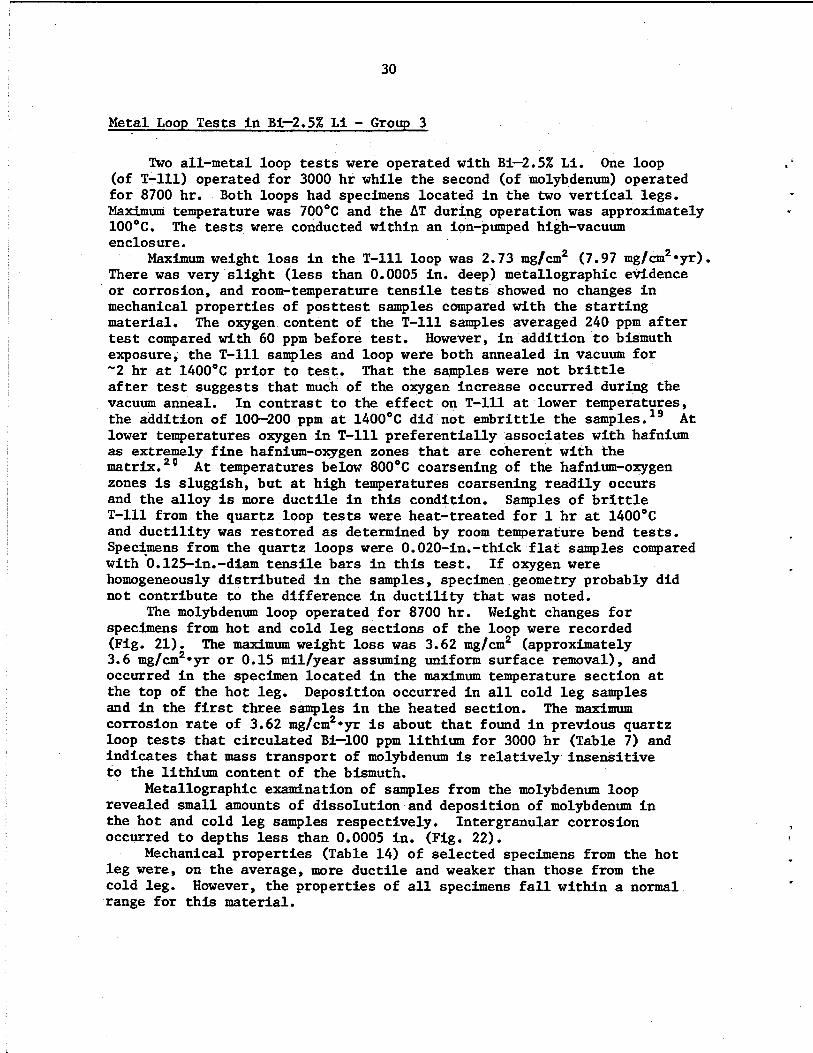
The molybdenum loop operated f o r 8700 hr . Weight changes f o r specimens from hot and cold l e g sect ions of the loop were recorded (Fig. 21). The maximum weight l o s s w a s 3.62 mg/cm2 (approximately 3.6 mg/cm2*yr o r 0.15 mil/year assuming uniform surface removal), and occurred i n the specimen located i n the maximum temperature sec t ion a t the top of the hot leg. and i n the f i r s t three samples i n the heated section. corrosion rate of 3.62 mg/cm2*yr i s about t h a t found i n previous quartz loop tests t h a t c i rcu la ted Bi-100 ppm l i thium f o r 3000 h r (Table 7) and ind ica tes that mass transport of molybdenum is r e l a t i v e l y in sens i t i ve t o the l i t h i u m content of the bismuth.
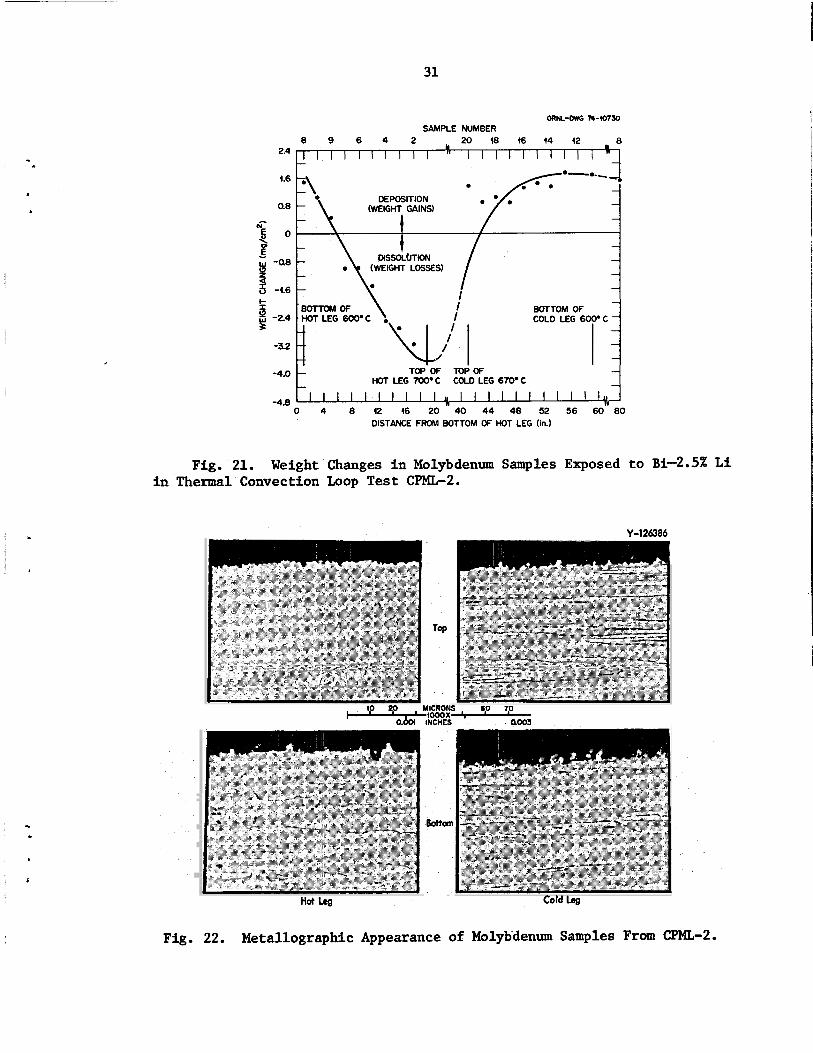
revealed small amounts of d isso lu t ion and deposit ion of molybdenum i n the hot and cold l eg samples respectively. occurred t o depths less than 0.0005 in . (Fig. 22).
l e g w e r e , on the average, more duc t i l e and weaker than those from the cold leg. range f o r t h i s material.
Both loops had specimens located i n t h e two vertical legs.
The tests were conducted within an ion-pumped high-vacuum
Maximum weight l o s s i n the T-111 loop w a s 2.73 mg/cm2 (7.97 mg/cm2*yr).
That t h e samples were not b r i t t l e
A t
A t temperatures below 8OO0C coarsening of the hafnium-oxygen
Samples of b r i t t l e
I f oxygen were
Deposition occurred i n sll cold l e g samples The maximum
Metallographic examination of samples from the molybdenum loop
Intergranular corrosion
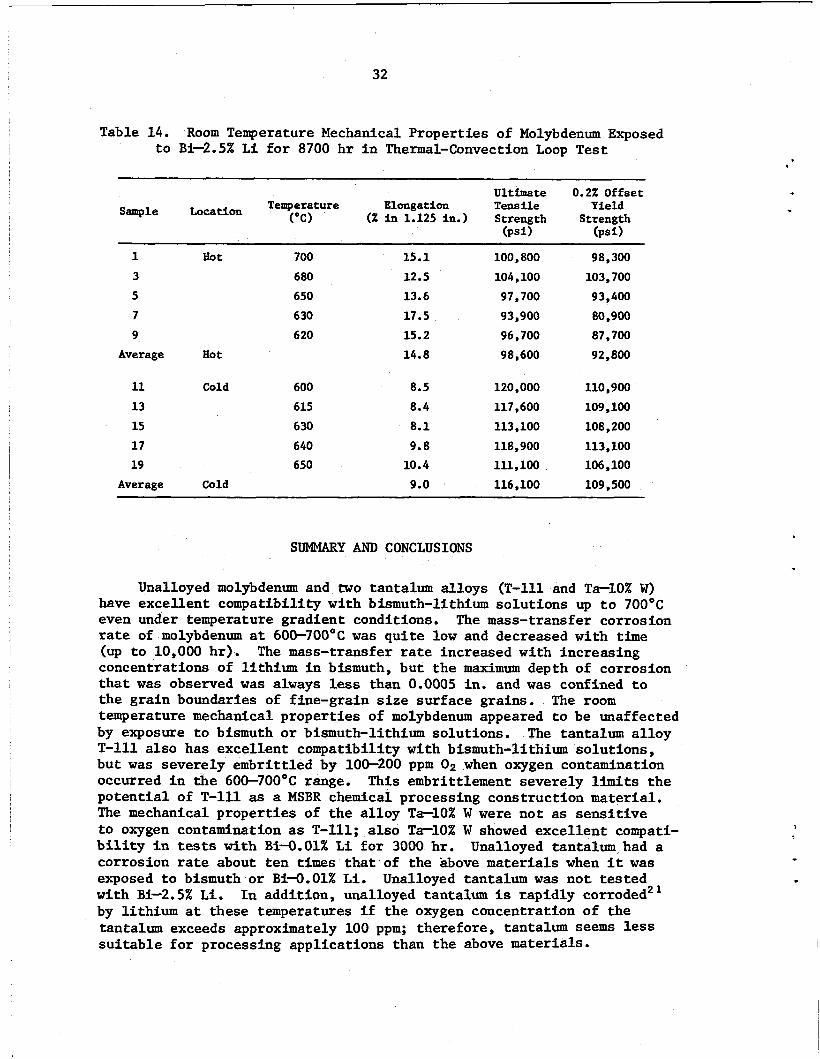
Mechanical proper t ies (Table 14) of selected specimens from the hot
However, the propert ies of a l l specimens f a l l within a normal
31
QRNL-DWG 79-10735 SAMPLE NUMBER
2.4
BOTTOM OF \ BOTTOM OF I- I 8 ~ -2.4 it HOT LEG 6 0 0 . C o ~ , / , COLD LEG 6 - i . ~
-32
-4.0 f TOP'OF TOPOF HOT LEG 700. C COLD LEG 670. C
0 4 8 42 46 20 40 44 48 52 56 60 80 DISTANCE FROM BOTTOM OF HOT LEG (in.)
Fig. 21. Weight Changes in Molybdenum Samples Exposed to Bi-2.5% Li in Thermal Convection Loop Test CPML-2.
, 9p 29 N,IICO;S , g0 79 0. INCHES Po03
Hot Lcg Cold Leg
Fig. 22. Metallographic Appearance of Molybdenum Samples From CPML-2.
32
Table 14. Room Temperature Mechanical Propert ies of Molybdenum Exposed t o Bi-2.5% L i f o r 8700 h r i n Thermal-Convection Loop T e s t
Ultimate 0.2% Offset Temperature Elongation Tensile Y i e l d
("C) (% i n 1.125 in.) Strength Strength Sample Location
1
3
5
7 9
Average
11
13
15
1 7 19
Average
Hot 700
680
650
630
620
Hot
Cold 600
615
630
640 650
Cold
15.1
12.5
13.6
17.5 15.2
14.8
8.5
8.4
8.1
9.8 10.4
9.0
100,800
104,100
97,700
93,900 96,700
98,600
120,000
117,600
113,100
118,900 111,100
116,100
SUMMARY AND CONCLUSIONS
98,300
103,700
93,400
80,900 87,700
92,800
110,900
109,100
108,200
113,100 106,100
109,500
Unalloyed molybdenum and two tantalum a l loys (T-111 and Ta-10% W) have excel lent compatibil i ty with bismuth-lithium so lu t ions up t o 7OOOC even under temperature gradient conditions. rate of molybdenum a t 600-7OO0C was qu i t e low and decreased with time (up t o 10,000 hr) . concentrations of l i thium i n bismuth, but t h e maximum depth of corrosion t h a t w a s observed w a s always less than 0.0005 in. and w a s confined t o the gra in boundaries of f ine-grain s i z e surface grains. temperature mechanical propert ies of molybdenum appeared t o be unaffected by exposure t o bismuth o r bismuth-lithium solut ions. T-111 a l so has excel lent compatibil i ty with bismuth-lithium solut ions, but w a s severely embrit t led by 100-200 ppm 0 2 when oxygen contamination occurred i n the 600-7OO0C range. po ten t i a l of T-111 as a MSBR chemical processing construction material. The mechanical propert ies of t he a l loy Ta-10% W w e r e not as sens i t i ve t o oxygen contamination as T - l l l ; a l s o Ta-10% W showed exce l len t compati- b i l i t y i n tests with Bi-O.Ol% L i f o r 3000 hr . corrosion rate about ten t i m e s t h a t of the above materials when i t w a s exposed t o bismuth o r Bi -O .Ol% L i . with Bi-2.5% Li. by l i thium a t these temperatures i f the oxygen concentration of the tantalum exceeds approximately 100 ppm; therefore , tantalum seems less su i t ab le f o r processing appl icat ions than the above materials=
The mass-transfer corrosion
The mass-transfer rate increased with increasing
The room
The tantalum a l loy
This embrittlement severely l i m i t s t he
Unalloyed tantalum had a
Unalloyed tantalum w a s no t tes ted I n addi t ion, unalloyed tantalum is rapidly corroded21
I

.
1
33
Iron, niobium, and several of t h e i r a l loys w e r e found t o be unacceptable materials f o r containing bismuth under temperature gradient conditions. Although the s o l u b i l i t y of these elements i n bismuth is low, rapid k ine t i c s of dissolut ion and deposition led t o plugging of quartz thermal convection loops a f t e r only a few hundred hours of operation. Molybdenum samples brazed with iron-based a l loys (Fe-C-B, and Fe-Mo-C-B) r e s i s t ed mass t ransfer , but t he braze a l loys were attacked by bismuth. i n bismuth a f t e r only a few hundred hours i n a quartz thermal convection
An a l loy of Fe5X Mo completely dissolved by mass t r ans fe r
loop.
ACKNOWLEDGMENTS
The work described i n t h i s report w a s supported by the Molten S a l t Reactor Program and was car r ied out over a period of several years. Construction and operation of t he quartz thermal convection loops w a s car r ied out under the d i r ec t ion of L. R. Trot ter . R. E. McDonald provided considerable ass is tance during fabr ica t ion of the T-111 and molybdenum thermal convection loop components. components w a s t he respons ib i l i ty of A. J. Moorhead and J. D. Hudson. B. W. McCullun, J. W. Hendricks, and J. L. G r i f f i t h w e r e responsible f o r construction and operation of t he test loop f a c i l i t i e s . G r i f f i t h edi ted and Susan Hanzelka prepared t h i s manuscript f o r reproduction.
w a s car r ied out under the d i rec t ion of H. E. McCoy. due him f o r the general and technical guidance t h a t was provided.
Joining these loop
George
These experiments were p a r t of an overa l l materials program t h a t Special thanks are
REFERENCES
1. M. E. Whatley and L, E. McNeese, Molten Salt Reactor Program Semiar#r. Prog. Rep. Feb. 29, 1968, Om-4254.
L. E. McNeese e t al., Program P h for Devebpment of Molten-Salt Breeder Reactors, ORNL-5018 (December 1974).
2.
3. C. L. Sargent, J. Am. chem. SOC. 22: 783-90 (1900).
4. C. B. G r i f f i t h and M. W. Mallett, J. Am. Chem. Soc. 75: 1832 (1953). I
5 . J. R. Weeks e t al., Proc. Intern. Conf. PeaceftrZ Uses A t . Energy, Geneva, 1955, Vol. 9, pp. 341-55, Columbia University Press, New York.
G. W. Horsley and J. T. Masjrey, J. Inst. Met. 86: 4 0 1 . 0 2 (1957- 58) . 6.
7. J. R. Weeks, A. Minardi, and S . Fink, Progress Report Ilhcctear E-n&neezdng D e @ . M a y I-Aug. 31, 1961, BNL-696, pp. 49-50.
i
34
8. G. W. Parry and L. W. Graham, Buzz. Inst. Met. 4: 125-26 (1959).
9. R. Dam, E. Scheil , and E. Wachtel, 2. MetaZZk. 53: 196-203 (1962).
10. C. J. Klamut et al., Proc. U.N. Intern. Conf. Peacefit Uses A t . Energy 2nd, Geneva, 1958, Vol. 7, pp. 17345 , United Nations, New York.
V. iJ. Elred, I n t e r a c t h Between Solid and L*id Metals and AZZoys, 11. AERE - X/R 1806 (1955).
12. J. F. Collins, Stmonary Report on the Sozubizity ofMetaZ8 and AZZoys in Pure Bismuth a t Temperatures up t o 2200°F, NEPA-1800 (April 1951).
T. A. Coultas, C o r r o s h of Refractodes by 2% and Bismuth, NAA-SR-192, (Sept. 15, 1952) . 13.
14. E. L. Reed, J. Am. Ceram. SOC. 37: 1 4 6 5 2 (1953).
15. J. W. Se i f ea t and A. L. Love, Jr., COrros&m 17; 475t-78t (October 1961).
W. J. Halleth and T. A. Coul tas , D y d ~ C O ~ S ~ of Graph<& by Liquid Bismuth, NAA-SR-188 (Sept. 22, 1952).
16.
17. R. W. F isher and G. R. Winders, i n L&pidMetaZ Technobgy, P a r t 1, Chem. Engr. Progr. Symp. Ser. No. 20, Vol. 50, American I n s t i t u t e of Chemical Engineers, New York, 1957.
18. M. Hansen, C o n s t i t u t h of B k n y AZbys, 2nd ed., p. 316, McGraw- H i l l , 1958.
19. H. Inouye and C. T. Liu, Law-Pressure Ox&?kth of T-111 and Effect on TensiZe Properties, ORNL-TM-4621 (August 1974).
C. T. Liu, H. Inouye, and R. W. Carpenter, Mechmriaaz Properties and Structure of Oxygen-Doped TanhZwn-Base AZZoy, ORNL-4839 (December 1972).
20.
21. R. L. Klueh, MetaZZ. !t’rans. 5: 87579 (April 1974).

35
ORNL/TM-5503 Distribution Category UC-76
INTERNAL DISTRIBUTION L
1
c
1-2. 3.
4-13. 14. 15. 16. 17. 18. 19. 20. 21.
22-26. 27. 28. 29. 30. 31.
32-36. 37. 38. 39 . 40. 41. 42. 43. 44. 45. 46. 47. 48. 49.
50-52. 53.
Central Research Library Document Reference Section Laboratory Records Department Laboratory Records, ORNL RC ORNL Patent Office C. F. Baes C. E. Bamberger E. S. Bettis R. B. Briggs C. R. Brinkman D. A. Canonico 0. B. Cavin S. Cantor J. L. Crmley F. L. Culler J. E. Cunningham J. H. DeVan J. R. DiStefano J. R. Engel G. G. Fee D. E. Ferguson L. M. Ferris A. P. Fraas G. M. Goodwin J. L. .Griffith W. R. Grimes A. G. Grindell R. H. Guymon P. N. Haubenreich J. L. Hendricks J. R. Hightower, Jr. M. R. Hill W. R. Huntley
54. 55. 56. 57. 58. 59. 60. 61. 62. 63. 64. 65. 66 . 67. 68. 69. 70. 71. 72. 73. 74. 75. 76. 77. 78. 79. 80. 81. 82. 83 . 84. 85. 86. 87.
J. R. Keiser 0. L. Keller A. D. Kelmers A. L. Lotts M. I. Lundin H. G. MacPherson R. E. MacPherson G. Mamantov D. L. Manning W. R. Martin C. L. Matthews L. Maya H. E. McCoy R. E. McDonald C. J. McHargue H. G. McDuffie L. E. McNeese A. J. Moorhead E. L. Nicholson H. Postma M. W. Rosenthal H. C. Savage J. E. Selle G. M. Slaughter A. N. Smith D. B. Trauger J. R. Weir, Jr. J. P. Young P. M. Brister (consultant) John Moteff (consultant) Hayne Palmour 111 (consultant) J. W. Prados (consultant) N. E. Promise1 (consultant) D. F. Stein (consultant)
, - ! I
J
36
EXTERNAL DISTRIBUTION
88-89. ERDA, Division of Nuclear Research and Applications, Washington, DC 20545
90-91. ERDA, Oak Ridge Operations Office, P.O. Box E , Oak Ridge, TN 37830
Director, Reactor Division Research and Technical Support Division
92-196. ERDA, Technical Information Center, P.O. Box 62, Oak Ridge, TN 37830
For distribution as shown i n TID-4500 Distribution Category, UC-76 (Molten-Salt Reactor Technology)
1
T .
’
.
Q US GOVERNMENT PRINTING OFFICE: 1976-748-189/28