Orland High School School Accountability Report Card ... SARC Report/2016_School... · School...
14
2015-16 School Accountability Report Card for Orland High School Page 1 of 14 Orland High School School Accountability Report Card Reported Using Data from the 2015-16 School Year Published During 2016-17 By February 1 of each year, every school in California is required by state law to publish a School Accountability Report Card (SARC). The SARC contains information about the condition and performance of each California public school. Under the Local Control Funding Formula (LCFF) all local educational agencies (LEAs) are required to prepare a Local Control and Accountability Plan (LCAP), which describes how they intend to meet annual school-specific goals for all pupils, with specific activities to address state and local priorities. Additionally, data reported in an LCAP is to be consistent with data reported in the SARC. • For more information about SARC requirements, see the California Department of Education (CDE) SARC Web page at http://www.cde.ca.gov/ta/ac/sa/. • For more information about the LCFF or LCAP, see the CDE LCFF Web page at http://www.cde.ca.gov/fg/aa/lc/. • For additional information about the school, parents/guardians and community members should contact the school principal or the district office. DataQuest DataQuest is an online data tool located on the CDE DataQuest Web page at http://dq.cde.ca.gov/dataquest/ that contains additional information about this school and comparisons of the school to the district and the county. Specifically, DataQuest is a dynamic system that provides reports for accountability (e.g., test data, enrollment, high school graduates, dropouts, course enrollments, staffing, and data regarding English learners). Internet Access Internet access is available at public libraries and other locations that are publicly accessible (e.g., the California State Library). Access to the Internet at libraries and public locations is generally provided on a first-come, first-served basis. Other use restrictions may include the hours of operation, the length of time that a workstation may be used (depending on availability), the types of software programs available on a workstation, and the ability to print documents. About This School Contact Information (School Year 2016-17) School Contact Information School Name------- Orland High School Street------- 101 Shasta Street City, State, Zip------- Orland, CA 95963 Phone Number------- (530) 865-1210 Principal------- Victor Perry E-mail Address------- [email protected] Web Site------- http://orlandhigh.orlandusd.net/ CDS Code 11754811135656
Transcript of Orland High School School Accountability Report Card ... SARC Report/2016_School... · School...

2015-16 School Accountability Report Card for Orland High School Page 1 of 14
Orland High School
School Accountability Report Card
Reported Using Data from the 2015-16 School Year
Published During 2016-17
By February 1 of each year, every school in California is required by state law to publish a School Accountability Report Card (SARC). The SARC contains information about the condition and performance of each California public school. Under the Local Control Funding Formula (LCFF) all local educational agencies (LEAs) are required to prepare a Local Control and Accountability Plan (LCAP), which describes how they intend to meet annual school-specific goals for all pupils, with specific activities to address state and local priorities. Additionally, data reported in an LCAP is to be consistent with data reported in the SARC. • For more information about SARC requirements, see the California Department of Education (CDE) SARC Web page at
http://www.cde.ca.gov/ta/ac/sa/. • For more information about the LCFF or LCAP, see the CDE LCFF Web page at http://www.cde.ca.gov/fg/aa/lc/. • For additional information about the school, parents/guardians and community members should contact the school principal or
the district office. DataQuest DataQuest is an online data tool located on the CDE DataQuest Web page at http://dq.cde.ca.gov/dataquest/ that contains additional information about this school and comparisons of the school to the district and the county. Specifically, DataQuest is a dynamic system that provides reports for accountability (e.g., test data, enrollment, high school graduates, dropouts, course enrollments, staffing, and data regarding English learners). Internet Access Internet access is available at public libraries and other locations that are publicly accessible (e.g., the California State Library). Access to the Internet at libraries and public locations is generally provided on a first-come, first-served basis. Other use restrictions may include the hours of operation, the length of time that a workstation may be used (depending on availability), the types of software programs available on a workstation, and the ability to print documents.
About This School Contact Information (School Year 2016-17)
School Contact Information
School Name------- Orland High School
Street------- 101 Shasta Street
City, State, Zip------- Orland, CA 95963
Phone Number------- (530) 865-1210
Principal------- Victor Perry
E-mail Address------- [email protected]
Web Site------- http://orlandhigh.orlandusd.net/
CDS Code 11754811135656

2015-16 School Accountability Report Card for Orland High School Page 2 of 14
District Contact Information
District Name------- Orland Unified School District
Phone Number------- (530) 865-1200
Superintendent-------
Ken Geisick
E-mail Address------- [email protected]
Web Site------- http://www.orlandusd.net
School Description and Mission Statement (School Year 2016-17)
Orland High School has adopted a professional learning community approach to preparing our students for the many opportunities that await them after high school. Whether the student plans to proceed directly to a four year institution, attend a two-year associate program, pursue vocational training or join the military, the OHS team works hard to ensure that our graduates a prepared for whatever path they choose. In the fall semester of the 2015-2016 school year, the OHS staff revisited the OHS Vision and Mission Statements and the Schoolwide Learner Outcomes (SLO’s), formerly called the Expected Schoolwide Learning Results (ESLR’s). These all needed revision due to new WASC guidelines and because of the implementation of the Common Core/CASP standards/test scores. At the faculty meeting on Wednesday, December 9th, we amended the Vision Statement. At the faculty WASC meeting on Wednesday, March 2, 2016, we formally approved the amended Vision and Schoolwide Learner Outcomes. The PBIS committee rewrote the Mission Statement to include the new PBIS goals which was approved by the OUSD school board in 2016. OHS Mission Statement Guided by a focus on our four Orland High School imperatives (A.R.M.Y.), we will strive to achieve academic and personal success for all students. In doing this we will create students who are accountable, respectful, motivated citizens with a sense of pride in themselves, their school, and their community. OHS Vision Statement Faculty and staff will foster a collaborative teaching and learning environment where students take part in high quality instruction. Orland High School’s quality, balanced program will produce graduates who advance into colleges, trade schools and businesses with an appreciation for lifelong learning. Schoolwide Learner Outcomes Orland High School will prepare graduates who possess the following characteristics: 1. Educated individuals who: a) Develop proficiency in individual content areas including core academics, CTE, foreign language, the arts, and PE b) Demonstrate the ability to utilize different types of resources and references c) Utilize advanced technology for home, recreation, and career purposes The skills in this area will be measured by the following: Graduation rate, performance on community service project and oral presentation, transcripts, CAASPP scores, percent of students completing A-G requirements, course grades, performance on ACT/SAT/ASVAB, and college acceptance rates. 2. Productive and responsible citizens who: a) Demonstrate knowledge of a healthy lifestyle b) Demonstrate respect for self and others c) Demonstrate social and behavioral skills to enable them to positively interact with others d) Demonstrate responsibility and accountability for their own actions e) Demonstrate respect for environment and property The skills in this area will be measured by the following: Discipline records, attendance records, involvement in school clubs and events 3. Effective communicators who: a) Speak, read, and write the English language proficiently b) Read, interpret, and comprehend a wide variety of materials available in everyday life

2015-16 School Accountability Report Card for Orland High School Page 3 of 14
c) Are able to listen effectively d) Form viewpoints/opinions and be able to express them in a diplomatic manner The skills in this area will be measured by: Successful completion of community service project and oral presentation, English class persuasive essays and grades, CELDT test results, senior portfolios 4. Cooperative individuals who: a) Sustain a good work ethic b) Are capable of encouraging and adapting to change c) Set achievable standards and goals applicable to the work force d) Are able to demonstrate tolerance towards all individuals The skills in this area will be measured by: Discipline records, attendance records, involvement in school clubs and events, reports from organizations outside OHS including local businesses, ROP and feeder schools (Mill/FV student aides) 5. Critical thinkers who: a) Define, gather, analyze, and evaluate data b) Demonstrate all critical thinking levels c) Apply mastered skills in everyday life situations d) Understand and solve problems in group setting as well as individually Student Enrollment by Grade Level (School Year 2015-16)
Grade Number of
Level Students
Grade 9 186
Grade 10 162
Grade 11 173
Grade 12 173
Total Enrollment 694
Student Enrollment by Group (School Year 2015-16)
Student Percent of
Group Total Enrollment
Black or African American 0.1
American Indian or Alaska Native 0.3
Asian 2.6
Filipino 0.3
Hispanic or Latino 58.9
Native Hawaiian or Pacific Islander 0.1
White 37
Two or More Races 0.4
Socioeconomically Disadvantaged 62.2
English Learners 10.2
Students with Disabilities 10.2
Foster Youth 0.4

2015-16 School Accountability Report Card for Orland High School Page 4 of 14
A. Conditions of Learning
State Priority: Basic The SARC provides the following information relevant to the Basic State Priority (Priority 1): • Degree to which teachers are appropriately assigned and fully credentialed in the subject area and for the pupils they are
teaching; • Pupils have access to standards-aligned instructional materials; and • School facilities are maintained in good repair. Teacher Credentials
Teachers School District
2014-15 2015-16 2016-17 2016-17
With Full Credential 31 31
Without Full Credential 0 2
Teaching Outside Subject Area of Competence (with full credential) 0 0
Teacher Misassignments and Vacant Teacher Positions
Indicator 2014-15 2015-16 2016-17
Misassignments of Teachers of English Learners 1 1
Total Teacher Misassignments * 1 1
Vacant Teacher Positions 0 0 Note: “Misassignments” refers to the number of positions filled by teachers who lack legal authorization to teach that grade level, subject area, student group, etc. * Total Teacher Misassignments includes the number of Misassignments of Teachers of English Learners. Core Academic Classes Taught by Highly Qualified Teachers (School Year 2015-16)
Location of Classes Percent of Classes In Core Academic Subjects
Taught by Highly Qualified Teachers Not Taught by Highly Qualified Teachers
This School 96.1 3.9
All Schools in District 96.7 3.3
High-Poverty Schools in District 96.7 3.3
Low-Poverty Schools in District 0.0 0.0 Note: High-poverty schools are defined as those schools with student eligibility of approximately 40 percent or more in the free and reduced price meals program. Low-poverty schools are those with student eligibility of approximately 39 percent or less in the free and reduced price meals program. Quality, Currency, Availability of Textbooks and Instructional Materials (School Year 2016-17) Year and month in which data were collected: January 2015 Each department at Orland High School is completing the work to create new curriculum aligned to the Common Core State Standards. Departments that have not had an adoption are continuing to use their old curriculum until the new curriculum is available; however, they are implementing best practices, increasing informational text, and writing across the curriculum. (Social Science 2015-2016; Science 2016-2017) English

2015-16 School Accountability Report Card for Orland High School Page 5 of 14
The Orland High School English Department has worked collaboratively to implement meaningful changes in our curriculum that establish and promote an environment where all students can successfully learn. For each of the grade levels, we have developed comprehensive curriculum guides that clearly delineate the literature and essays to be read and the essential standards and writing types to be taught. These curriculum guides are aligned to the Common Core State Standards (CCSS), and they are living documents we are continuously working to fine-tune. We dedicated several weekends in the spring and days over the summer of 2013 in department collaboration of the rewriting process. As a group, we identified the need to continue our efforts to increase literacy at every grade level, particularly in the area of expository texts. OHS adopted a new text, 50 Essays: A Portable Anthology Third Edition, edited by Samuel Cohen, for use in all four grade levels. We also have a Chromebook carts so we can increase the technological literacy of all students and further help prepare them for the 21st Century work world. Math Over the course of the last several years, the OHS math department has focused its efforts on providing the best math curriculum and instruction possible. We are currently in the transition process from a traditional math sequence of Algebra 1, Geometry, Algebra 2, to Integrated Math 1, 2, and 3. The Integrated Math Sequence will use Common Core curriculum. 2014-2015 is the 1st year for implementation of Integrated 1 with incoming freshmen and students who have not yet mastered Algebra 1. Each year for three years the department will introduce another step in the Integrated Sequence until the process is complete in 2016/17. We have adopted Core Connections/Integrated I, II, III – CPM – 2014 by CPM Educational Program. Science We are exploring Next Generation Science Standards (NGSS) and are expected to be fully implemented by the 2016-2017 school year. The OHS science teachers are currently reviewing and evaluating their current curriculum in order to incorporate these new standards. Once the textbook publishers develop modified textbooks, we will be purchasing new textbooks that reflect the new science standards. Social Studies The Social Studies department continues efforts to give students high quality exposure not only to state history standards, but also to events currently unfolding in the world. Our World and U.S. History teachers have been implementing a standards based curriculum and have utilized a common summative assessment system even before the OHS PLC process made these techniques a high priority. CTE (Career and Technical Education) The Career and Technical Education (CTE) are working with the standards already written that are aligned to the Common Core. The standards specify learning goals in 58 career pathways organized around 15 industry sectors. Building on the previous CTE Standards, the revised draft standards were created with input from more than 300 representatives from business, industry, labor, postsecondary, and secondary education and reviewed by others in the education community. The draft standards are written to demand high quality coursework for students to complete on their way to a future career and are aligned with the Common Core State Standards in English-Language Arts and mathematics. Career Pathways currently at OHS Welding Building and Construction Transportation Agri-Science Interior Design Child Development Health Science and Medical Technology
Subject Textbooks and Instructional Materials/
Year of Adoption
From Most Recent
Adoption?
Percent of Students Lacking Own
Assigned Copy
Reading/Language Arts All core subject textbooks are current, and aligned to the California Common Core State Standards.
Yes 0
Mathematics All core subject textbooks are current, and aligned to the California Common Core State Standards.
Yes 0
Science All core subject textbooks are current, and aligned to the California State Content Standards. Examining new textbooks for NGSS.
Yes 0

2015-16 School Accountability Report Card for Orland High School Page 6 of 14
Subject Textbooks and Instructional Materials/
Year of Adoption
From Most Recent
Adoption?
Percent of Students Lacking Own
Assigned Copy
History-Social Science All core subject textbooks are current, and aligned to the California State Content Standards.
Yes 0
Foreign Language All core subject textbooks are current, and aligned to the California State Content Standards.
Yes 0
Health All core subject textbooks are current, and aligned to the California State Content Standards.
Yes 0
Visual and Performing Arts All core subject textbooks are current, and aligned to the California State Content Standards.
Yes 0
Science Laboratory Equipment (grades 9-12)
Modernized in 2012 Yes 0
School Facility Conditions and Planned Improvements (Most Recent Year)
Orland High School was constructed at the current site in 1918. The majority of the original high school was demolished in 1974, when the current main building and administration office were constructed. The cafeteria, gymnasium, and home economics wing were constructed from 1951 to 1954. Our campus has many beautiful trees and grass areas. With funds from a variety of sources including a bond passed in 2008, OHS has demolished and rebuilt the entire football stadium and sports complex. We've also added 8 new modular buildings to replace aging "portable" buildings installed in the 70's. The two-story science, technology and library building is slated to open it's doors in February of 2012. This new building, boasting three brand new science classrooms, a new computer lab, a new library/media center, conference room, a new home economics room with 6 state of the art kitchens, a new interior design room and two standard classrooms will be the most technologically advanced educational establishment in Glenn County. Our school includes 15 buildings. On an average day, over 700 students and staff occupy our beautiful campus. School Facility Good Repair Status (Most Recent Year)
School Facility Good Repair Status (Most Recent Year) Year and month of the most recent FIT report: 10/05/2016
System Inspected Repair Status Repair Needed and
Action Taken or Planned Good Fair Poor
Systems: Gas Leaks, Mechanical/HVAC, Sewer
X
Interior: Interior Surfaces X
Cleanliness: Overall Cleanliness, Pest/ Vermin Infestation
X
Electrical: Electrical X
Restrooms/Fountains: Restrooms, Sinks/ Fountains
X
Safety: Fire Safety, Hazardous Materials X
Structural: Structural Damage, Roofs X
External: Playground/School Grounds, Windows/ Doors/Gates/Fences
X
Overall Facility Rating (Most Recent Year)
Year and month of the most recent FIT report: 10/05/2016
Overall Rating Exemplary Good Fair Poor
X
2015-16 School Accountability Report Card for Orland High School Page 7 of 14
B. Pupil Outcomes
State Priority: Pupil Achievement The SARC provides the following information relevant to the State priority: Pupil Achievement (Priority 4): • Statewide assessments (i.e., California Assessment of Student Performance and Progress [CAASPP] System, which includes the
Smarter Balanced Summative Assessments for students in the general education population and the California Alternate Assessments [CAAs] for English language arts/literacy [ELA] and mathematics given in grades three through eight and grade eleven. The CAAs have replaced the California Alternate Performance Assessment [CAPA] for ELA and mathematics, which were eliminated in 2015. Only eligible students may participate in the administration of the CAAs. CAA items are aligned with alternate achievement standards, which are linked with the Common Core State Standards [CCSS] for students with significant cognitive disabilities); and
• The percentage of students who have successfully completed courses that satisfy the requirements for entrance to the University of California and the California State University, or career technical education sequences or programs of study
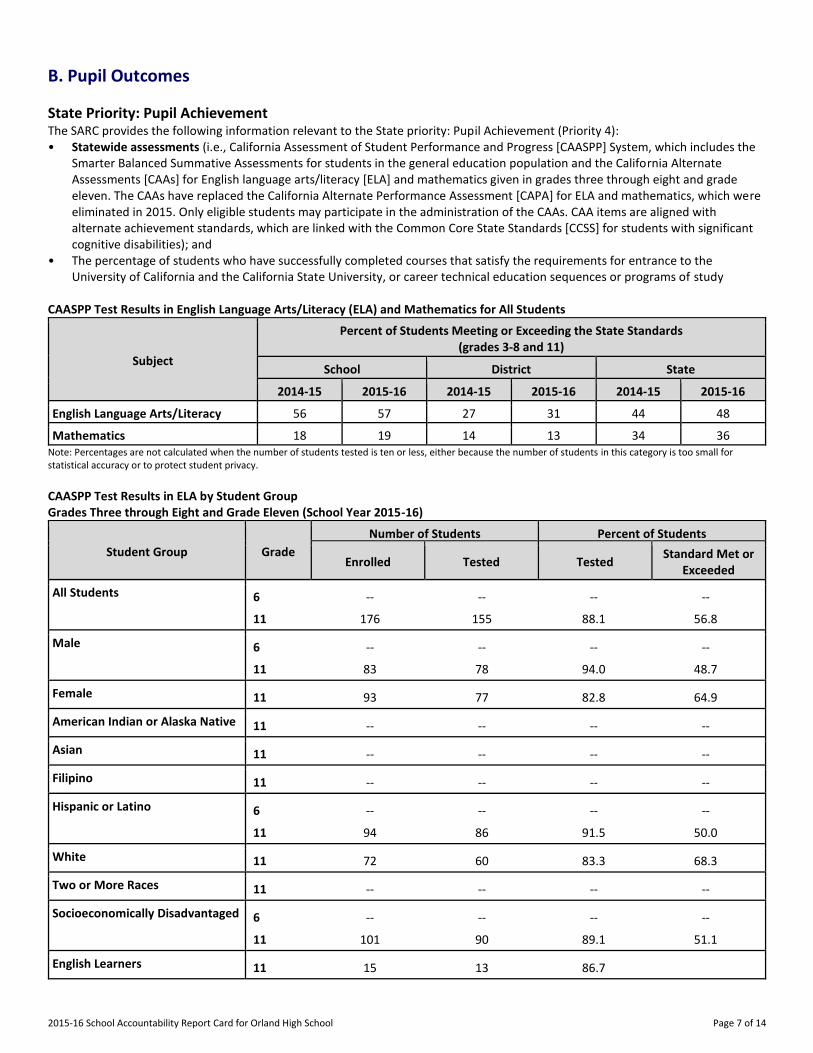
CAASPP Test Results in English Language Arts/Literacy (ELA) and Mathematics for All Students
Subject
Percent of Students Meeting or Exceeding the State Standards (grades 3-8 and 11)
School District State
2014-15 2015-16 2014-15 2015-16 2014-15 2015-16
English Language Arts/Literacy 56 57 27 31 44 48
Mathematics 18 19 14 13 34 36 Note: Percentages are not calculated when the number of students tested is ten or less, either because the number of students in this category is too small for statistical accuracy or to protect student privacy.
CAASPP Test Results in ELA by Student Group Grades Three through Eight and Grade Eleven (School Year 2015-16)
Student Group Grade
Number of Students Percent of Students
Enrolled Tested Tested Standard Met or
Exceeded
All Students 6 -- -- -- --
11 176 155 88.1 56.8
Male 6 -- -- -- --
11 83 78 94.0 48.7
Female 11 93 77 82.8 64.9
American Indian or Alaska Native 11 -- -- -- --
Asian 11 -- -- -- --
Filipino 11 -- -- -- --
Hispanic or Latino 6 -- -- -- --
11 94 86 91.5 50.0
White 11 72 60 83.3 68.3
Two or More Races 11 -- -- -- --
Socioeconomically Disadvantaged 6 -- -- -- --
11 101 90 89.1 51.1
English Learners 11 15 13 86.7

2015-16 School Accountability Report Card for Orland High School Page 8 of 14
Student Group Grade
Number of Students Percent of Students
Enrolled Tested Tested Standard Met or
Exceeded
Students with Disabilities 6 -- -- -- --
11 19 16 84.2 12.5
Students Receiving Migrant Education Services
11 -- -- -- --
Foster Youth 6 -- -- -- --
11 -- -- -- --
Note: ELA test results include the Smarter Balanced Summative Assessment and the CAA. The “Percent Met or Exceeded” is calculated by taking the total number of students who met or exceeded the standard on the Smarter Balanced Summative Assessment plus the total number of students who met the standard on the CAAs divided by the total number of students who participated in both assessments. Double dashes (--) appear in the table when the number of students is ten or less, either because the number of students in this category is too small for statistical accuracy or to protect student privacy. Note: The number of students tested includes all students who participated in the test whether they received a score or not; however, the number of students tested is not the number that was used to calculate the achievement level percentages. The achievement level percentages are calculated using only students who received scores.
CAASPP Test Results in Mathematics by Student Group Grades Three through Eight and Grade Eleven (School Year 2015-16)
Student Group Grade
Number of Students Percent of Students
Enrolled Tested Tested Standard Met or
Exceeded
All Students 6 -- -- -- --
11 176 156 88.6 18.6
Male 6 -- -- -- --
11 83 78 94.0 20.5
Female 11 93 78 83.9 16.7
American Indian or Alaska Native 11 -- -- -- --
Asian 11 -- -- -- --
Filipino 11 -- -- -- --
Hispanic or Latino 6 -- -- -- --
11 94 86 91.5 12.8
White 11 72 60 83.3 28.3
Two or More Races 11 -- -- -- --
Socioeconomically Disadvantaged 6 -- -- -- --
11 101 90 89.1 14.4
English Learners 11 15 14 93.3
Students with Disabilities 6 -- -- -- --
11 19 16 84.2
Students Receiving Migrant Education Services
11 -- -- -- --
Foster Youth 6 -- -- -- --

2015-16 School Accountability Report Card for Orland High School Page 9 of 14
Student Group Grade
Number of Students Percent of Students
Enrolled Tested Tested Standard Met or
Exceeded
11 -- -- -- --
Note: Mathematics test results include the Smarter Balanced Summative Assessment and the CAA. The “Percent Met or Exceeded” is calculated by taking the total number of students who met or exceeded the standard on the Smarter Balanced Summative Assessment plus the total number of students who met the standard on the CAAs divided by the total number of students who participated in both assessments. Double dashes (--) appear in the table when the number of students is ten or less, either because the number of students in this category is too small for statistical accuracy or to protect student privacy. Note: The number of students tested includes all students who participated in the test whether they received a score or not; however, the number of students tested is not the number that was used to calculate the achievement level percentages. The achievement level percentages are calculated using only students who received scores.
CAASPP Test Results in Science for All Students
Subject
Percent of Students Scoring at Proficient or Advanced (meeting or exceeding the state standards)
School District State
2013-14 2014-15 2015-16 2013-14 2014-15 2015-16 2013-14 2014-15 2015-16
Science (grades 5, 8, and 10) 50 54 49 39 44 36 60 56 54 Note: Science test results include California Standards Tests (CSTs), California Modified Assessment (CMA), and California Alternate Performance Assessment (CAPA) in grades five, eight, and ten. Note: Scores are not shown when the number of students tested is ten or less, either because the number of students in this category is too small for statistical accuracy or to protect student privacy.
CAASPP Test Results in Science by Student Group Grades Five, Eight, and Ten (School Year 2015-16)
Student Group
Total Enrollment
# of Students with Valid Scores
% of Students with Valid Scores
% of Students Proficient or
Advanced
All Students 163 156 95.7 48.7
Male 83 81 97.6 49.4
Female 80 75 93.8 48.0
Hispanic or Latino 102 100 98.0 45.0
White 54 50 92.6 58.0
Socioeconomically Disadvantaged 103 100 97.1 45.0
English Learners 20 20 100.0 15.0
Students with Disabilities 15 14 93.3 42.9 Note: Science test results include CSTs, CMA, and CAPA in grades five, eight, and ten. The “Proficient or Advanced” is calculated by taking the total number of students who scored at Proficient or Advanced on the science assessment divided by the total number of students with valid scores. Note: Scores are not shown when the number of students tested is ten or less, either because the number of students in this category is too small for statistical accuracy or to protect student privacy.
Career Technical Education Programs (School Year 2015-16)
Career Technical Education (CTE) in the Orland Unified School District is a program of study involving a sequence of courses that integrates core academic knowledge with technical skills. The program provides students with multiple pathways to college and careers. Students complete a career pathway, which includes foundation, intermediate, and capstone (Regional Occupational Program or ROP) courses in a single, defined field of study. The career pathways are organized around 15 different industry sectors, which have been identified as the growth industry sectors for the local economy. Students are encouraged to complete an internship in their chosen industry sector prior to completing their senior year. CTE programs of study often fulfill the “a–g” subject-area requirements of the University of California and the California State University and may lead to community college credit, an industry-recognized credential, a certificate, or a degree at the post secondary level.

2015-16 School Accountability Report Card for Orland High School Page 10 of 14
Orland High has an extensive Career Technical Education (CTE) program. Our CTE classes provide comprehensive training in many of the most in-demand careers at this time. Our auto, construction, and welding, and Agricultural mechanics shops have recently undergone a million dollar renovation to bring all equipment and facilities up to industry standard. Our teachers have extensive real world experience in the subjects they now teach. OHS has an award winning agriculture program. Our agriculture students receive hands on training in the cultivation of our orchard land, crop land, and we are currently have three school barns on the OUSD agriculture land to the north of campus. These are state of the art facilities that include pens where students can raise their own farm animals, thus opening the industry to students who live in the city, and have no room at home for ag. and raising farm animals. The animals are then sold at the Glenn County Fair via our FFA program. The following is a list or our current classes: Intro. to Agriculture I, Agriculture II, Animal Science, Horticulture, Agriculture Leadership, Agriculture Community, Agriculture Business, Family & Child Development, Careers with Children, Retail Training, Welding I, II and III, Wood I, II, & III, Auto I, II, & III, Life Skills, Fashion and Textile Design, Survival/Single, Interior Design--2014-2015 OHS added a Health and Medical Pathway. Career Technical Education Participation (School Year 2015-16)
Measure CTE Program Participation
Number of pupils participating in CTE 501
% of pupils completing a CTE program and earning a high school diploma 22%
% of CTE courses sequenced or articulated between the school and institutions of postsecondary education 32%
Courses for University of California (UC) and/or California State University (CSU) Admission
UC/CSU Course Measure Percent
2015-16 Pupils Enrolled in Courses Required for UC/CSU Admission 96.52
2014-15 Graduates Who Completed All Courses Required for UC/CSU Admission 15.4
State Priority: Other Pupil Outcomes The SARC provides the following information relevant to the Other Pupil Outcomes State Priority (Priority 8): • Pupil outcomes in the subject areas of physical education. California Physical Fitness Test Results (School Year 2015-16)
Grade Level
Percent of Students Meeting Fitness Standards
Four of Six Standards Five of Six Standards Six of Six Standards
---9--- 20.9 20.9 47.2 Note: Percentages are not calculated when the number of students tested is ten or less, either because the number of students in this category is too small for statistical accuracy or to protect student privacy.
C. Engagement
State Priority: Parental Involvement The SARC provides the following information relevant to the Parental Involvement State Priority (Priority 3): • Efforts the school district makes to seek parent input in making decisions for the school district and each schoolsite. Opportunities for Parental Involvement (School Year 2016-17)
Parent Involvement

2015-16 School Accountability Report Card for Orland High School Page 11 of 14
Orland High School has an active School Site Council comprised of parents, students, teachers, and administrators, English Learner Advisory Committee, a strong Alumni group, a Sober Grad parent group, an Athletic Booster Club, and parent involvement on our Positive Behavior Interventions and Supports (PBIS). Our school’s annual “Single Plan for Student Achievement (SSPA)” with it’s corresponding budget go through the scrutiny of both our School Site Council and the OUSD governing board. The English Language Advisory Committee (ELAC) is a forum that supports our program to help English earners progress toward English proficiency. OHS parents on the ELAC are also elected and provide input to the District Language Advisory Committee (DLAC). Our parents also volunteer at the school by chaperoning events and field trips and helping with the leadership class. They also participate in back to school night and open house. Other examples of community/parental involvement include a working relationship with the City of Orland Recreation Department (facilities and programs) a city-wide Ministerial Group that coordinates the annual Baccalaureate Ceremony. The school communicates with students, parents and the community in a variety of ways. Students and parents are apprised of their current grades instantly using the online "Parent Connect", an online program allowing parents to view the gradebooks of each of their student’s teachers as well as attendance, discipline and transcript information. The implementation of this program has dramatically improved parental access to student grades and progress towards graduation. Other forms of communication include: Parent Involvement Policy and Compact, parent and student surveys, parent and student orientations, flyers, letters home to parents on specific subjects, parent presentations from the counseling department, in alternating years “Career Day” and “Job Fair”, an Orland High School website with current information, and a Facebook page for Orland High School To find out how you can volunteer at our school, please contact our school office at (530) 865-1210.
State Priority: Pupil Engagement The SARC provides the following information relevant to the Pupil Engagement State Priority (Priority 5): • High school dropout rates; and • High school graduation rates. Dropout Rate and Graduation Rate (Four-Year Cohort Rate)
Indicator School District State
2012-13 2013-14 2014-15 2012-13 2013-14 2014-15 2012-13 2013-14 2014-15
Dropout Rate 3.00 1.40 0.60 7.90 3.00 3.80 11.40 11.50 10.70
Graduation Rate 96.97 97.97 99.42 90.73 95.76 96.15 80.44 80.95 82.27
Completion of High School Graduation Requirements - Graduating Class of 2015 (One-Year Rate)
Group Graduating Class of 2015
School District State
All Students 98 97 86
Black or African American 100 100 78
American Indian or Alaska Native 100 75 78
Asian 90 90 93
Filipino 0 0 93
Hispanic or Latino 96 93 83
Native Hawaiian/Pacific Islander 0 0 85
White 100 100 91
Two or More Races 0 0 89
Socioeconomically Disadvantaged 87 100 66
English Learners 62 50 54
Students with Disabilities 97 95 78

2015-16 School Accountability Report Card for Orland High School Page 12 of 14
State Priority: School Climate The SARC provides the following information relevant to the School Climate State Priority (Priority 6): • Pupil suspension rates; • Pupil expulsion rates; and • Other local measures on the sense of safety. Suspensions and Expulsions
Rate School District State
2013-14 2014-15 2015-16 2013-14 2014-15 2015-16 2013-14 2014-15 2015-16
Suspensions------- 7.4 5.2 6.8 7.8 6.9 5.6 4.4 3.8 3.7
Expulsions------- 0.3 0.0 0.0 0.2 0.1 0.0 0.1 0.1 0.1
School Safety Plan (School Year 2016-17)
We update our school safety plan annually and it is taken to the School Site Council (SSC) every year prior to March 1st for their approval. We conduct earthquake, fire, and intruder drills each semester. This plan meets the state requirements described in California Education Code Sections 35294–35297. The safety plan includes disaster procedures, procedures for safe entry and exit of students, procedures for serious disciplinary problems, a sexual harassment policy, child abuse reporting procedures, school dress codes, and school discipline policies. Under the direction of the principal, school staff members implement specific school-building security procedures. In addition, district offices support schools by reviewing and disseminating safety requirements and information, coordinating safety-related services, and providing safety training and assistance. Our principal, assistant principal, teachers and staff monitor the school grounds before and after school and during breaks. Counselors provide additional help.We also have a leadership class in which seniors are paired up with freshmen to ease transitions. Orland High School has a Crisis Response Box that includes its state-mandated comprehensive school safety plan. The students are involved with peer mediation and conflict resolution programs ensure a safe and responsible environment.
D. Other SARC Information
The information in this section is required to be in the SARC but is not included in the state priorities for LCFF. Federal Intervention Program (School Year 2016-17)
Indicator School District
Program Improvement Status In PI
First Year of Program Improvement 2009-2010
Year in Program Improvement* Year 3
Number of Schools Currently in Program Improvement N/A 2
Percent of Schools Currently in Program Improvement N/A 100.0 Note: Cells with N/A values do not require data.
Average Class Size and Class Size Distribution (Secondary)
Subject
2013-14 2014-15 2015-16
Avg. Class Size
Number of Classrooms Avg. Class Size
Number of Classrooms Avg. Class Size
Number of Classrooms
1-22 23-32 33+ 1-22 23-32 33+ 1-22 23-32 33+
English------- ----------
22 13 22 2 20 19 21 20 19 21
Mathematics ----------
22 9 20 1 25 4 12 25 4 12
Science------- ----------
26 2 18 27 2 13 1 27 2 13 1
Social Science ----------
24 8 13 1 25 5 18 1 25 5 18 1 Note: Number of classes indicates how many classrooms fall into each size category (a range of total students per classroom). At the secondary school level, this information is reported by subject area rather than grade level.

2015-16 School Accountability Report Card for Orland High School Page 13 of 14
Academic Counselors and Other Support Staff (School Year 2015-16)
Title Number of FTE
Assigned to School Average Number of Students per
Academic Counselor
Academic Counselor------- 1.5 350
Counselor (Social/Behavioral or Career Development) 1 N/A
Library Media Teacher (Librarian) .25 N/A
Library Media Services Staff (Paraprofessional) 1 N/A
Psychologist------- .5 N/A
Social Worker------- N/A
Nurse------- .25 N/A
Speech/Language/Hearing Specialist .25 N/A
Resource Specialist------- N/A
Other------- N/A Note: Cells with N/A values do not require data. *One Full Time Equivalent (FTE) equals one staff member working full time; one FTE could also represent two staff members who each work 50 percent of full time.
Expenditures per Pupil and School Site Teacher Salaries (Fiscal Year 2014-15)
Level
Expenditures Per Pupil Average Teacher Salary Total
Supplemental/ Restricted
Basic/ Unrestricted
School Site------- 7594 759 6835 54382
District------- N/A N/A 8624 $60,669
Percent Difference: School Site and District N/A N/A -20.7 -10.4
State------- N/A N/A $5,677 $67,348
Percent Difference: School Site and State N/A N/A 20.4 -19.3 Note: Cells with N/A values do not require data.
Types of Services Funded (Fiscal Year 2015-16)
In addition to regular funding and regular grants, our community is very generous with scholarships and awards. Last year the Orland community donated approximately $100,000 in scholarships to our graduating seniors. Local businesses support specific programs with donations, and our band, choir, agricultural program and other departments hold fund-raising events and/or performances. Teacher and Administrative Salaries (Fiscal Year 2014-15)
Category District Amount State Average for Districts In Same Category
Beginning Teacher Salary $42,208 $42,063
Mid-Range Teacher Salary $57,315 $64,823
Highest Teacher Salary $78,073 $84,821
Average Principal Salary (Elementary) $83,292 $101,849
Average Principal Salary (Middle) $87,106 $107,678
Average Principal Salary (High) $97,849 $115,589
Superintendent Salary $159,694 $169,152
Percent of Budget for Teacher Salaries 34% 35%
Percent of Budget for Administrative Salaries 6% 6% For detailed information on salaries, see the CDE Certificated Salaries & Benefits Web page at http://www.cde.ca.gov/ds/fd/cs/.

2015-16 School Accountability Report Card for Orland High School Page 14 of 14
Advanced Placement (AP) Courses (School Year 2015-16)
Subject Number of AP Courses Offered* Percent of Students In AP Courses
Computer Science N/A
English------- 2 N/A
Fine and Performing Arts N/A
Foreign Language 1 N/A
Mathematics 1 N/A
Science------- N/A
Social Science 3 N/A
All courses 6 .7 Cells with N/A values do not require data. *Where there are student course enrollments of at least one student.
Professional Development (Most Recent Three Years)
Our leadership team and principal work together to implement effective professional development. All core subject teachers have been trained to use the Professional Learning Communities collaborative model. Our focus is on student learning and accountability. All core departments have aligned their curriculum to the California state standards and have developed extensive pacing guides to ensure the standards are covered prior to state testing in March and April. Common interim assessments for each core subject have been implemented, and teachers use the data these tests provide to implement interventions, reteaching, and modifications for the next year's instruction. This year in addition to continuing teaching to the current standards our teachers are beginning the transition to the California Common Core State Standards. Teachers use the minimum days and after school time to develop their curriculum and interventions collaboratively. The District provides two optional Professional Development Days for all teachers outside of the instructional student days. This year’s Professional Development offerings will support teachers to strengthen literacy skills for students, further deepen teacher work with the Common Core standards by identifying ‘priority standards’ for grade level mastery, and promote instructional technology and increased student access to computer devices. All staff are encouraged to attend content and researched based staff development institutes that will support increased student achievement. All staff development requests are reviewed by the administration to check for alignment to content standards and professional needs that meet the requirements for staff development in NCLB.