
ORIOR GROUP HALF YEAR REPORT 2018 · ORIOR GROUP HALF YEAR REPORT 2018 Letter to Shareholders...
20
EXCELLENCE IN FOOD ORIOR GROUP HALF YEAR REPORT 2018
Transcript of ORIOR GROUP HALF YEAR REPORT 2018 · ORIOR GROUP HALF YEAR REPORT 2018 Letter to Shareholders...

EXCELLENCE IN FOOD
ORIOR GROUPHALF YEAR REPORT
2018


3
ORIOR GROUP
H A L F Y E A R R E P O R T 2 0 1 8
1
ORIOR – Excellence in Food
Contents
ORIOR is an internationally active Swiss food and beverage group that combines crafts-manship with a pioneering spirit and thrives on entrepreneurship and strong values. The centres of competence have established leading positions in fast-growing niches in Switzerland and abroad. With Rapelli, Biotta, Ticinella, Albert Spiess, Fürstenländer Spezialitäten, Fredag, Le Patron, Pastinella, Culinor and Vaco’s Kitchen, ORIOR has built an impressive portfolio of brands and companies.
ORIOR’s goal is to steadily create value for all stakeholders. Market intimacy, strong partnerships, and a lean, agile group structure provide the framework from which ORI-OR is shaping and driving the market landscape with innovative products, concepts and services. Motivated employees who take pride in their work and who assume respon-sibility for themselves and for what they do are the key for creating the extraordinary.
We are striving for uniqueness and offer best quality in order to surprise our consumers time and again with enjoyable food moments. Our ambition is nothing less than Excel-lence in Food.
Letter to Shareholders 2
Interim Consolidated Financial Statements 2018 4
Notes to the Interim ConsolidatedFinancial Statements 2018 9
Share information 17

ORIOR GROUP
H A L F Y E A R R E P O R T 2 0 1 8
Letter to Shareholders
Dear Shareholders
ORIOR Group generated revenues of CHF 273.7 million du-ring the first half of 2018, up from CHF 259.1 million in the first half of the previous year. This revenue growth of 5.6 % stemmed from good organic growth of 2.1 %, acquisition-led growth of 1.6 % and a positive currency effect of 2.0 %. The good organic growth rate was fuelled by numerous initiati-ves and a steady focus on innovation, brands and customer relationship management. EBITDA decreased to CHF 27.2 million from CHF 27.7 million in the first half of 2017, which is attributed to acquisition-related transaction and extraordi-nary costs; excluding these non-recurring costs, EBITDA rose by 3.7 % year-on-year to CHF 28.7 million and the EBITDA margin declined slightly by 19 basis points to 10.5 %. This pri-marily reflects the gross profit margin, which was impacted during the period under review by high meat prices, higher commodity and packaging materials costs, and the weake-ning of the Swiss franc. A strict focus on efficiency gains made a positive contribution to operating performance. Adjusted net profit for the period rose by 3.2 % year-on-year to CHF 15.3 million and the corresponding profit margin declined slightly by 13 basis points.
The strategically important acquisition of Biotta is part of the Convenience and International segments for reporting pur-poses. The related acquisition costs are therefore also alloca-ted to these two segments.
The new shares issued in early March to finance part of the Biotta acquisition, equivalent to nearly 10 % of total share ca-pital, were successfully absorbed by the market.
The mandatory adoption of the new IFRS 15 standard regar-ding the recognition of revenue led to a reduction in recognis-ed revenue of CHF 22.8 million for the period under review and a concurrent reduction in cost of goods and materials. Neither adjustment had an impact on net profit, the conso-lidated balance sheet or the cash flow statement. The figures for the prior-year period were accordingly restated with CHF 22.2 million.
ORIOR Switzerland The challenging environment in Switzerland, especially in the retail sector, is slowly stabilising. Minor ongoing consolidati-on in the market and persisting intense competitive pressure were offset by strong innovation and positive brand as well as customer relationship developments. This led to a good, broadly based growth.
The ORIOR Convenience segment performed very well du-ring the period under review. It reported strong revenues of 94.1 million, up 9.2 % from CHF 86.2 million in the prior-year period. This growth reflects high organic growth of 5.7 % and an acquisition effect of 3.6 %. Innovative new ultra-fresh me-als and meal components, vegetarian specialities and positive customer relationship trends were the primary drivers of this good performance. Segment EBITDA was impacted by the allocation of transaction and extraordinary costs. Adjusted EBITDA rose from CHF 12.1 million in the first half of 2017 to CHF 13.4 million in the period under review and the corres-ponding margin improved by 23 basis points.
The ORIOR Refinement segment performed well during the first half of 2018. Attention is drawn to innovations such as “My Energy Beef”, which was rolled out nationwide, and the ongoing pleasing developments at the “Rapelli” and “Ticinel-la” brands. The Refinement segment increased its revenues in the first half of 2018 by 3.6 % to CHF 125.9 million. Market developments – continued high meat prices due to tight sup-ply, which only heightened competition on the procurement front – continued to affect this segment. Its EBITDA declined by 7.3 % to CHF 9.8 million (1H 2017: CHF 10.6 million) and the EBITDA margin came in at 7.8 %, 92 basis points below the level reported for the prior-year period.
ORIOR InternationalThe ORIOR International segment performed well in line with expectations. Segment revenues totalled CHF 65.5 mil-lion compared to CHF 58.6 million in the prior-year period, an increase of 11.7 %. This revenue growth stemmed from
ORIOR, the internationally active Swiss food and beverage Group that combines craftsmanship with a pioneering spirit underpinned by entrepreneurship and strong values, achieved good results in the first half of 2018. The ORIOR 2020 strategy is clearly gaining traction and progress is being made towards all the given goals.
2

ORIOR GROUP
H A L F Y E A R R E P O R T 2 0 1 8
Letter to Shareholders
Daniel Lutz CEO ORIOR Group
Rolf U. SutterChairman of the Board of Directors
organic growth of 0.8 %, an acquisition effect of 2.2 % from Biotta subsidiary Gesa in Germany, and a currency transla-tion effect of 8.7 %. Culinor Food Group experienced strong demand for its “Lovely Meals” line of ultra-fresh meals, its new “Pure” product line and its meal home delivery services. Exports of Bündnerfleisch showed strong growth thanks to new customers. Factoring out the allocated transaction costs, EBITDA amounted to CHF 5.6 million and the corre-sponding margin declined slightly by 11 basis points due to changes in the product mix.
Compensation CommitteeFor the vacant position in the Compensation Committee the Board of Directors of ORIOR AG appointed Walter Lüthi for the remainder of the current term of office, which extends to the next ordinary general meeting of shareholders.
OutlookThe ORIOR 2020 strategy confirmed in June of 2018 will continue to be steadfastly implemented. A variety of mea-sures and projects within ORIOR’s strategic goals and its group-wide Champion Model are the key elements of this strategy. ORIOR reiterates the targets it has set out to achieve with the strategy and will continue to steadily cre- ate value for all stakeholders. We expect a good second half year.
Thank you We thank our shareholders for their trust and interest. ORI-OR presented a good set of results for the first half of 2018 and made significant progress towards its strategic goals. This is only possible with the support of its many enthusi-astic and loyal customers and shareholders and its extraor-dinary employees, who make a difference and are motivated to do their best every day and go the extra mile. That is proof of their strong identification with the company, for which we are truly grateful.
3

4
ORIOR GROUP
H A L F Y E A R R E P O R T 2 0 1 8
Key figures
in CHF thousand Jan – Jun 2018 ∆ in %Jan – Jun 2017
Restated1
Revenues 273 742 +5.6 % 259 110
EBITDA 27 224 –1.8 % 27 712as % of revenues 9.9 % 10.7 %
EBITDA adjusted 2 28 749 +3.7 % 27 712as % of revenues 10.5 % 10.7 %
Profit before tax adjusted 2 18 699 +11.3 % 16 796as % of revenues 6.8 % 6.5 %
Profit for the period adjusted 2 15 308 +3.2 % 14 833as % of revenues 5.6 % 5.7 %
Operating cash flow 20 836 –26.8 % 28 467Equity ratio 53.5 % 47.1 %
Net debt / EBITDA ratio 2.27x 2.10x
Avg. number of employees (FTE) 1 598 +1.5 % 1 575
Market capitalisation at 30.06. 555 291 +23.0 % 451 485
1 See Note 12 Excludes acquisition-related transaction and extraordinary costs
January to June 2018
– Successful first half with broad growth from all segments.
– ORIOR 2020 strategy gaining traction; management remains committed to the rigorous execution of this strategy and confirms the given objectives.
– Successful acquisition of Biotta; its integration as an independent competence centre
within ORIOR Group is on track. – First-half revenues up 5.6 % at CHF 273.7 million thanks to good organic growth of
2.1 %, an acquisition effect of 1.6 % and a currency translation effect of 2.0 %. – Adjusted EBITDA increased 3.7 % to CHF 28.7 million and the corresponding profit
margin showed a slight decline of 19 basis points to 10.5 %. – Good second half year expected.

5
ORIOR GROUP
H A L F Y E A R R E P O R T 2 0 1 8
Consolidated Income Statement
in CHF thousand Note Jan – Jun 2018 ∆ in %Jan – Jun 2017
Restated1)
Revenues l 4 273 742 +5.6 % 259 110
Raw materials / goods and services purchased –154 734 –140 965
Changes in inventories 2 634 –740
Personnel expense –56 849 –54 457
Other operating income 548 534
Other operating expense –38 116 –35 769
EBITDA Earnings before interest, taxes, depreciation and amortisation 27 224 –1.8 % 27 712as % of revenues 9.9 % 10.7 %
Depreciation - property, plant and equipment –7 566 –7 254
Amortisation - intangible assets –1 853 –1 928
EBIT Earnings before interest and taxes 17 806 –3.9 % 18 530as % of revenues 6.5 % 7.2 %
Financial income l 12 1 328 253
Financial expense –1 959 –1 988
Profit before taxes 17 175 +2.3 % 16 796as % of revenues 6.3 % 6.5 %
Income tax expense l 10 –3 087 –1 963
Profit for the period 14 087 –5.0 % 14 833as % of revenues 5.1 % 5.7 %
Earnings per share in CHF
Basic earnings per share 2.25 2.51
Diluted earnings per share 2.25 2.51
Weighted Ø number of shares outstanding in '000 6 273 5 9051 See Note 1
Consolidated Statement of Comprehensive Income
in CHF thousand Note Jan – Jun 2018 ∆ in % Jan – Jun 2017
Profit for the period 14 087 –5.0 % 14 833
Exchange differences on translation of foreign operations –1 665 1 772
Items that are or may be reclassified subsequently to income statement, net of tax –1 665 1 772
Revaluation of pension plan l 11 2 063 8 692
Taxes on other comprehensive income –388 –1 408
Items that will not be reclassified to income statement, net of tax 1 675 7 284
Other comprehensive income for the period, net of tax 10 9 056
Total comprehensive income for the period, net of tax
14 097 –41.0 % 23 889

6
ORIOR GROUP
H A L F Y E A R R E P O R T 2 0 1 8
Consolidated Balance Sheet
in CHF thousand Note 30.06.2018 in % 31.12.2017 in % 30.06.2017 in %
Cash and cash equivalents 20 291 38 191 41 205
Current financial assets l 5 287 301 308
Trade accounts receivable 58 259 67 426 50 179
Other current receivables 4 233 3 202 4 479
Inventories and work in progress 89 597 71 953 76 368
Current income tax assets 589 150 150
Prepaid expenses / accrued income 5 527 1 862 3 365
Current assets 178 783 29.5 % 183 085 33.2 % 176 054 32.7 %
Property, plant and equipment l 6 134 988 111 501 108 544
Intangible assets l 7 290 993 256 534 252 818
Long-term financial assets 635 320 350
Deferred tax assets 113 20 159
Non-current assets 426 728 70.5 % 368 375 66.8 % 361 871 67.3 %
Total assets 605 512 100.0 % 551 460 100.0 % 537 925 100.0 %
Derivative financial instruments l 5 88 0 6
Current financial liabilities 997 61 157
Trade accounts payable 53 308 52 795 44 141
Other current payables 5 299 4 509 3 810
Current income tax liabilities 2 644 2 838 1 228
Accrued liabilities 22 980 21 897 23 736
Current portion of provisions 977 1 791 1 847
Current liabilities 86 292 14.3 % 83 891 15.3 % 74 926 13.9 %
Non-current financial liabilities – third parties 149 249 140 691 159 787
Defined benefit obligations l 11 1 060 2 187 6 762
Provisions 3 555 2 887 2 944
Deferred tax liabilities 41 595 41 551 40 017
Non-current liabilities 195 459 32.3 % 187 316 34.0 % 209 510 38.9 %
Total liabilities 281 751 46.5 % 271 207 49.2 % 284 436 52.9 %
Share capital l 9 26 070 23 700 23 700
Additional paid-in capital l 8 41 287 0 0
Treasury shares –2 348 –2 063 –2 308
Retained earnings l 8 254 020 252 219 231 888
Foreign currency translation 4 732 6 397 209
Total equity 323 761 53.5 % 280 253 50.8 % 253 489 47.1 %
Total liabilities and equity 605 512 100.0 % 551 460 100.0 % 537 925 100.0 %

7
ORIOR GROUP
H A L F Y E A R R E P O R T 2 0 1 8
Consolidated Statement of Equity
in CHF thousand NoteShare
capitalAdditional
paid-in capitalTreasury
sharesRetained earnings
Foreign currency
translation Total equity
Balance as at 01.01.2017 23 700 0 –699 222 069 –1 564 243 506
Profit for the period 14 833 14 833
Other comprehensive income for the period 7 284 1 772 9 056
Total comprehensive income for the period 0 0 0 22 117 1 772 23 889
Dividends / repayment of capital contributions l 8 –12 335 –12 335
Share-based payments 52 52
Movement in treasury shares –1 609 –15 –1 623
Balance as at 30.06.2017 23 700 0 –2 308 231 888 208 253 489
Balance as at 01.01.2018 23 700 0 –2 063 252 219 6 397 280 253
Profit for the period 14 087 14 087
Other comprehensive income for the period 1 675 –1 665 10
Total comprehensive income for the period 0 0 0 15 762 –1 665 14 097
Issue of share capital l 9 2 370 41 287 43 657
Dividends l 8 –14 083 –14 083
Share-based payments 36 36
Movement in treasury shares –285 85 –199
Balance as at 30.06.2018 26 070 41 287 –2 348 254 020 4 732 323 761

8
ORIOR GROUP
H A L F Y E A R R E P O R T 2 0 1 8
Consolidated Cash Flow Statement
in CHF thousand Note Jan – Jun 2018 Jan – Jun 2017
Profit for the period 14 087 14 833
Taxes l 10 3 087 1 963
Depreciation / amortisation 9 419 9 182
Share-based payments 36 52
Other non-cash transactions l 13 –335 651
Change in value adjustments and provisions –1 323 –513
Gain from disposal of fixed assets –136 –5
Interest income –8 –5
Dividend income –15 –8
Interest expense 620 805
Increase (+) / decrease (–) of accrued pension cost –757 –891
Change in working capital 1 063 6 722
– Trade accounts receivable and other current receivables 12 560 14 885
– Inventories and work in progress –4 900 1 496
– Trade accounts payable and other current payables –2 921 –4 414
– Other –3 676 –5 245
Interest paid –225 –212
Taxes paid –4 676 –4 107
Cash flow from operating activities 20 836 28 467
Purchase of
– property, plant and equipment l 6 –7 097 –6 113
– intangible assets –431 –144
– Investments 0 –200
Proceeds from sale of
– property, plant and equipment 211 90
Acquisition of subsidiaries, net of cash acquired –58 687 0
Interest received 8 5
Dividends received 15 8
Cash flow from investing activities –65 982 –6 355
Increase in financial liabilities 68 824 0
Repayments of financial liabilities –70 623 –7 108
Grant of loan –265 0
Payment of finance lease liabilities –15 –54
Issue of share capital l 9 44 734 0
Transaction costs capital increase –1 077 0
Dividends / repayment of capital contributions l 8 –14 083 –12 335
Sale of treasury shares 1 588 2 286
Purchase of treasury shares –1 787 –3 910
Cash flow from financing activities 27 296 –21 120
Net increase (+) / decrease (–) in cash and cash equivalents
–17 849 992
Foreign exchange differences on cash and cash equivalents –50 83
Cash and cash equivalents as at 01.01. 38 191 40 130
Cash and cash equivalents as at 30.06. 20 291 41 205

9
ORIOR GROUP
H A L F Y E A R R E P O R T 2 0 1 8
Notes
Notes to the Interim Consolidated Financial Statements
Basis of presentation
This interim report comprises the consolidated financial statements of ORIOR AG and its subsidiaries for the interim period ended 30 June 2018. The interim consolidated financial statements 2018 were prepared in compliance with IAS 34 – Interim Financial Reporting and should be read in conjunction with the annual financial statements 2017. The Board of Directors approved the interim consolidated report on 21 August 2018.
In preparing the interim financial statements, management is required to make esti-mates and assumptions that affect the reported amounts of revenues, expenses, assets and liabilities as well as the reported contingent liabilities at the close of the interim reporting period. If in the future such estimates and assumptions, which are based on management’s best judgement at the date of the interim financial statements, deviate from the actual circumstances, the estimates and assumptions for the period in which the circumstances change will be modified as appropriate.
Principal accounting policiesThe principal accounting policies applied in the preparation of the interim financial statements 2018 are consistent with those used in preparing the annual financial state-ments 2017, with the exception of the new or amended accounting standards and inter-pretations adopted as of 1 January 2018:
– Amendment to IFRS 2 – Clarifications of classification and measurement of share based payment transactions
– Amendment to IFRS 4 – Applying IFRS 9 Financial Instruments with IFRS 4 Insu- rance Contracts
– IFRS 9 – Financial Instruments– IFRS 15 – Revenue from Contracts with Customers– IFRIC 22 – Foreign Currency Transactions and Advance Consideration– Amendment to IAS 40 – Transfers of Investment Property
IFRS 9 Financial Instruments includes requirements for recognition and measurement, derecognition and hedge accounting. The application of IFRS 9 has been analysed in detail. No material impact on classification and measurements of financial assets and liabilities has arisen. The above revised IFRS standards, with the exception IFRS 15, did not have a significant impact on the accounting policies or the presentation of ORIOR Group’s assets, liabili-ties, financial position and earnings. The effect of IFRS 15 are disclosed below. IFRS 15 - Revenue from Contracts with CustomersIFRS 15 was issued in May 2014 by the IASB and applies to an annual reporting period beginning on or after 1 January 2018. The standard provides a single, principles based five-step model to be applied to all contracts with customers. This standard supersedes IAS 18 Revenue Recognition as well as the relevant interpretations.
The Group has applied the standard retrospectively in full as per 1 January 2018. The implementation of the new standard has the following effects. A few cases have been identified in which ORIOR qualifies as the agent rather than the principal. Both revenue and cost of goods sold decreased accordingly. The adoption doesn’t have any effect on the net result, on the consolidated balance sheet and on the cash flow statement for the year 2017.

10
ORIOR GROUP
H A L F Y E A R R E P O R T 2 0 1 8
Notes
in CHF thousandReported
Jan – Jun 2017 AdjustmentRestated
Jan – Jun 2017
Revenues 281 303 –22 193 259 110
Raw materials / goods and services purchased –163 158 22 193 –140 965
EBITDA Earnings before interest, taxes, depreciation and amortisation 27 712 0 27 712as % of revenues 9.9% 10.7%
EBIT Earnings before interest and taxes 18 530 0 18 530as % of revenues 6.6% 7.2%
Profit for the period 14 833 0 14 833as % of revenues 5.3% 5.7%
Seasonality of operations
Due to its broad product portfolio and high degree of product diversification, the ORIOR Group experiences a generally stable course of business with little seasonal variation. The only exception is the increase in revenues in the month of December, which is attributable to greater demand in the run-up to Christmas and New Year’s Eve.
Changes in the scope of consolidation
The Group acquired 98.4 % of the shares of Thurella AG as per 17 May 2018. Thurella’s product and brand portfolio is built on concepts with well-known brands: “Biotta”, “Traktor”; “Vivitz” and “C-ICE”. With this acquisition, ORIOR is strengthening its posi-tion beyond the traditional food market and entering the premium niche of organic beverages, a growing market both in Switzerland and abroad. The remaining 1.6 % of the shares will be purchased by the end of the third quarter 2018 under the squeeze-out procedure.
in CHF thousand Fair value recognised on acquisition
Cash and cash equivalents 435
Current financial assets 10
Trade accounts receivable 3 645
Other current receivables 800
Inventories and work in progress 12 738
Current income tax assets 61
Prepaid expenses / accrued income 401
Property, plant and equipment 23 825
Intangible assets 9 628
Long-term financial assets 50
Deferred tax assets 41
Assets 51 634

11
ORIOR GROUP
H A L F Y E A R R E P O R T 2 0 1 8
Notes
in CHF thousand Fair value recognised on acquisition
Current financial liabilities –514
Trade accounts payable –2 753
Other current payables –1 179
Current income tax liabilities –141
Accrued liabilities –1 299
Current portion of provisions –13
Long-term financial liabilities –11 165
Defined benefit obligations –1 702
Provisions –783
Deferred tax liabilities –690
Liabilities –20 239
Net assets 31 395
Goodwill arising on acquisition 27 727
Total consideration 59 122
Purchase consideration:
Cash paid (Investing activities) 59 122
Cash and cash equivalents in subsidiary acquired (Investing activities) –435
Transaction costs of the acquisition (Operating activities) 1 083
Cash outflow on acquisition 59 770
ORIOR has performed a provisional purchase price allocation within the half-year results. The goodwill recognised above was attributed to the expected synergies and other benefits from combining business activities. Goodwill was allocated to the ORIOR Convenience segment (kCHF 7 538) and the ORIOR International segment (kCHF 20 189). The goodwill was not tax deductible.
Net trade receivables amounted to kCHF 3 645 as at the acquisition date and it is expec-ted that the full amount can be collected.
From the date of acquisition, Thurella AG generated revenues in the amount of kCHF 4 344 and contributed kCHF –363 to the net profit of the Group. If the combination had taken place at the beginning of the year 2018, the profit would have been kCHF –1 275 and revenue would have been kCHF 17 859.
The transaction costs were expensed and were included in other operating expense.

12
ORIOR GROUP
H A L F Y E A R R E P O R T 2 0 1 8
Notes
Segment information
For management purposes, the Group is structured along the three operating segments ORIOR Convenience, ORIOR Refinement and ORIOR International. The operating segments are characterised by a clear focus on specific product categories.
– ORIOR Convenience and its competence centres Fredag, Pastinella, Le Patron and Biotta operate five processing facilities in the German-speaking part of Swit-zerland. Besides fresh convenience products such as ready-made meals, patés and terrines, fresh pasta, vegetarian and vegan specialities as well as cooked poultry and meat products, the Convenience segment also produces all-natural organic vegetable and fruit juices. Its products are mainly sold through retail and food service channels in Switzerland. The Convenience segment consists of four operating segments. These operating segments have been aggregated because their long-term financial performance is similar. The type of product and the way these products are made as well as the client groups are also similar, and in some cases identical.
– ORIOR Refinement and its three competence centres Rapelli, Albert Spiess and Möfag operate five processing and refining facilities in the cantons of Grisons, Ticino and St. Gallen. The segment is characterised by a clear focus on refined and processed meat products and produces traditional premium meat products as well as new interpretations in various categories from Bündnerfleisch and ham to salami and Mostbröckli. The products are mainly sold through retail and food service channels in Switzerland. The Refinement segment includes three main operating segments. These operating segments have been aggregated because their long-term financial performance is similar. The type of product and the way these products are made as well as the client groups are also similar, and in some cases identical.
– ORIOR International consists of the operating units of the Culinor Food Group, which has five production plants in Belgium, the activities of Gesa, a sub-sidiary of Biotta that operates a production plant in Germany, and the export activities from Switzerland to neighbouring countries – and thus represents all business conducted by ORIOR beyond the Swiss borders. The Culinor Food Group centre of competence produces high-quality ready-made meals and meal components, most of which are supplied to retailers and food services companies. Gesa specialises in producing organic vegetable juices for beverage and food pro-cessors. Products that are made by the Swiss centres of competence and exported to neighbouring countries are also included in the International segment.
Segment performance is evaluated based on operating profit (EBITDA, EBIT), which is measured in line with the principles applied in the consolidated financial statements. Transfer prices between operating segments are on an arm’s length basis in a manner similar to transactions with third parties.

13
ORIOR GROUP
H A L F Y E A R R E P O R T 2 0 1 8
Notes
Segment overview January – June 2018
in CHF thousandORIOR
ConvenienceORIOR
RefinementORIOR
International
Adjustments and
eliminations Consolidated
External customer sales 94 947 117 455 65 777 278 180
Inter-segment sales 1 082 10 294 344 –11 720 1 0
Sales of goods / rendering of services 96 030 127 749 66 121 –11 720 278 180
Reduction in gross sales –1 893 –1 894 –651 –4 438
Revenues 94 136 125 856 65 471 –11 720 273 742
Earnings before interest, taxes, depreciation and amortisation (EBITDA) 12 253 9 832 5 234 –95 27 224
Depreciation / impairment – tangible assets –2 778 –2 972 –1 817 –7 566
Amortisation – intangible assets –281 –488 –1 084 –1 853
Profit (EBIT) 9 194 6 373 2 333 –95 17 806
Net financial expense –631
Profit before taxes 17 175
Investments in non-current assets 1 527 4 509 1 492 0 2 7 528
1 Revenues as well as intercompany profits are eliminated on consolidation.2 Cash outflow from investments in property, plant and equipment as well as intangible assets.
Segment overview January – June 2017
in CHF thousandORIOR
Convenience3
ORIOR Refinement3
ORIOR International
Adjustments and
eliminationsConsolidated
Restated1, 3
External customer sales 87 179 117 314 59 299 0 263 792
Inter-segment sales 968 6 184 0 –7 151 1 0
Sales of goods / rendering of services 88 147 123 497 59 299 –7 151 263 792
Reduction in gross sales –1 965 –2 055 –662 0 –4 682
Revenues 86 182 121 442 58 637 –7 151 259 110
Earnings before interest, taxes, depreciation and amortisation (EBITDA) 12 096 10 609 5 061 –54 27 712
Depreciation / impairment – tangible assets –2 671 –3 053 –1 530 0 –7 254
Amortisation – intangible assets –119 –645 –1 163 0 –1 928
Profit (EBIT) 9 305 6 911 2 368 –54 18 530
Net financial expense –1 734
Profit before taxes 16 796
Investments in non-current assets 1 583 3 667 1 007 0 2 6 258
1 Revenues as well as intercompany profits are eliminated on consolidation.2 Cash outflow from investments in property, plant and equipment as well as intangible assets.3 See Note 1

14
ORIOR GROUP
H A L F Y E A R R E P O R T 2 0 1 8
Notes
Geographic information
in CHF thousand Jan – Jun 2018Jan – Jun 2017
Restated1
Switzerland 207 817 200 272
Belgium 33 487 31 494
Netherlands 19 860 19 653
France 10 573 7 061
Germany 858 199
Austria 224 152
Scandinavia 117 0
USA 109 0
Great Britain 104 0
Spain 103 0
Other 491 279
Revenues 273 742 259 110
1 See Note 1 The revenue information above is based on the location of the customer.
Property, plant, equipment and intangible assets
in CHF thousand 30.06.2018 31.12.2017 30.06.2017
Switzerland 288 874 254 901 254 970
Belgium 109 976 112 965 106 206
Germany 26 990 0 0
France 141 169 186
Total property, plant, equipment and intangible assets 425 981 368 035 361 362
Financial assets and liabilities at fair value
The following tables provide an overview of the financial instruments as per 30 June 2018, 31 December 2017 and 30 June 2017. There have been no significant changes in the applied valuation methods since the last annual report.
in CHF thousand 30.06.2018 Level 1 Level 2 Level 3
Financial assets measured at FVTPL
Current financial assets at FV through profit and loss 287 70 217 0
Financial liabilities measured at FVTPL
Derivative financial instruments –88 0 –88 0
in CHF thousand 31.12.2017 Level 1 Level 2 Level 3
Financial assets measured at FVTPL
Current financial assets at FV through profit and loss 301 94 207 0

15
ORIOR GROUP
H A L F Y E A R R E P O R T 2 0 1 8
Notes
in CHF thousand 30.06.2017 Level 1 Level 2 Level 3
Financial assets measured at FVTPL
Current financial assets at FV through profit and loss 308 101 207 0
Financial liabilities measured at FVTPL
Derivative financial instruments –6 0 –6 0
Liability from earn-out agreements –150 0 0 –150
The fair value of financial liabilities is estimated by the Group based on discounted future cash flows using interest rates currently available for debt on similar terms, credit risk and remaining maturities. Specified targets form the basis for earn-out payments.
Fixed assets
During the period from 1 January to 30 June 2018 the Group acquired assets in the amount of kCHF 7 808 (2017: kCHF 6 988), which resulted in a cash outflow of kCHF 7 097 (2017: kCHF 6 113).
Intangible assets
Intangible assets comprise the following items:
in CHF thousand 30.06.2018 31.12.2017 30.06.2017
Goodwill 162 450 135 632 132 835
Brands 60 737 55 528 55 528
Customer base 65 697 63 169 62 169
Software 2 109 2 205 2 286
Total intangible assets 290 993 256 534 252 818
Intangible assets with indefinite useful life are normally tested for impairment annually and when circumstances indicate the carrying amounts may be impaired. As of 30 June 2018 there were no such impairment indicators.
Dividend
The dividend for 2017 was paid in April 2018 in conformity with the decision taken at the Annual General Meeting on 12 April 2018. Shareholders approved the proposed dividend of CHF 2.17 per share, resulting in a total dividend of kCHF 14 083 (2017: kCHF 12 335).
Share capital
In March ORIOR placed 592 499 new shares at CHF 75.50 per new share. The net pro-ceeds from the placement amount to CHF 43.7 million after deducton of the relevant capital increase costs. The net proceeds from the capital increase has been used to finance the acquisition of Thurella AG. The placed shares were sourced from ORIOR’s existing authorised share capital.

16
ORIOR GROUP
H A L F Y E A R R E P O R T 2 0 1 8
16
Notes
Income taxes
The major components of income tax expense are:
in CHF thousand Jan – Jun 2018 Jan – Jun 2017
Current income taxes –3 958 –2 061
Movements of deferred taxes 871 98
Total –3 087 –1 963
Total income taxes increased by kCHF 1 124. The difference in particular results on the one side from the use of tax loss carryforwards in a company in the prior-year and on the other side from higher income taxes due to the omission of a tax privilege of a company.
Revaluation of pension plan / Defined benefit obligations
The pension plans qualify as defined benefit plans under IAS 19. The decrease of the defined benefit obligation is mainly due to the updated discount rate.
Other non-cash transactions
The other non-cash transactions in the cash flow statement are related to the valuation of our long-term bank liabilities in EUR. Whereas the CHF/EUR exchange rate increa-sed during the prior-year period, it decreased during the reporting period.
Financial income
The higher financial income in comparison with the prior-year period is driven by higher foreign exchange gains on foreign currency positions.
Events after the balance sheet date
At its meeting on 21 August 2018 the Board of Directors passed a resolution to change the Group's accounting standard from IFRS to Swiss GAAP FER. Swiss GAAP FER is an officially recognised accounting standard that will likewise provide an accurate repre-sentation of the company’s financial position. A formal request to change the corres-ponding regulatory standard on the stock exchange will be submitted to SIX Exchange Regulation in the coming days. ORIOR intends to use the new Swiss GAAP FER accoun-ting standard to prepare its annual financial statements for the year ended 31 December 2018.
17
ORIOR GROUP
H A L F Y E A R R E P O R T 2 0 1 8
Share information
Share information
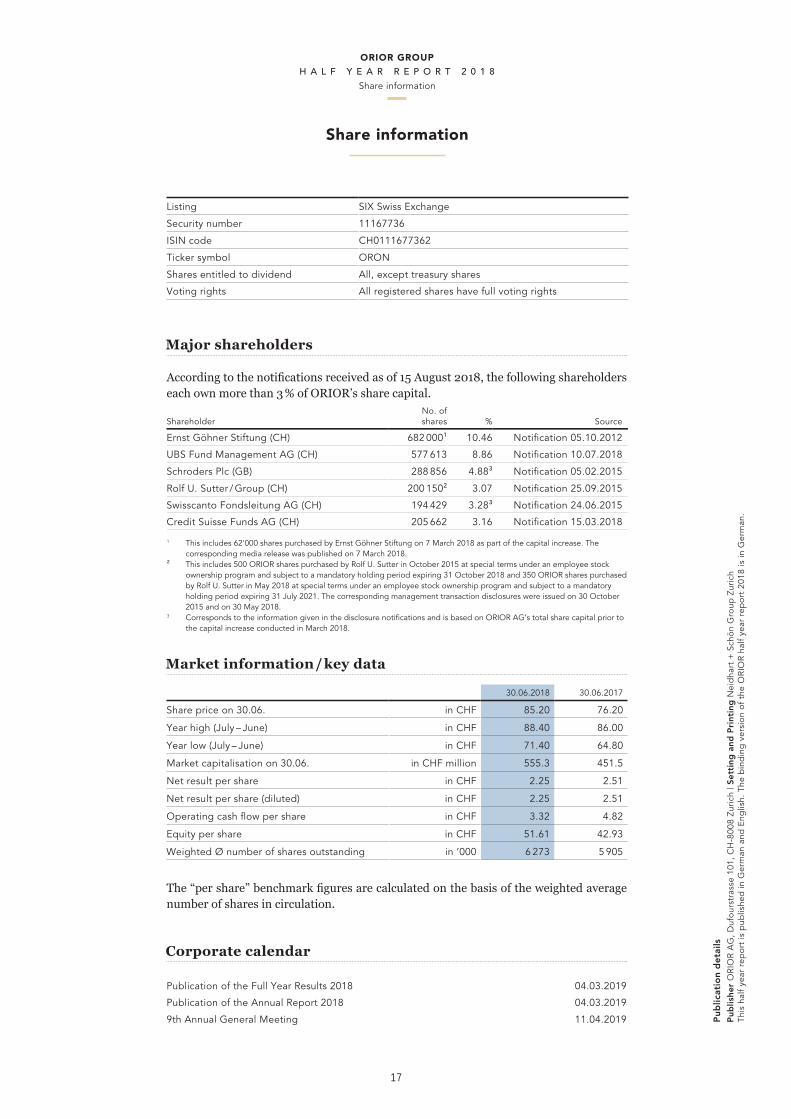
Listing SIX Swiss Exchange
Security number 11167736
ISIN code CH0111677362
Ticker symbol ORON
Shares entitled to dividend All, except treasury shares
Voting rights All registered shares have full voting rights
Major shareholders
According to the notifications received as of 15 August 2018, the following shareholders each own more than 3 % of ORIOR’s share capital.
ShareholderNo. of shares % Source
Ernst Göhner Stiftung (CH) 682 000¹ 10.46 Notification 05.10.2012
UBS Fund Management AG (CH) 577 613 8.86 Notification 10.07.2018
Schroders Plc (GB) 288 856 4.88³ Notification 05.02.2015
Rolf U. Sutter / Group (CH) 200 150² 3.07 Notification 25.09.2015
Swisscanto Fondsleitung AG (CH) 194 429 3.28³ Notification 24.06.2015
Credit Suisse Funds AG (CH) 205 662 3.16 Notification 15.03.2018
1 This includes 62'000 shares purchased by Ernst Göhner Stiftung on 7 March 2018 as part of the capital increase. The corresponding media release was published on 7 March 2018.
² This includes 500 ORIOR shares purchased by Rolf U. Sutter in October 2015 at special terms under an employee stock ownership program and subject to a mandatory holding period expiring 31 October 2018 and 350 ORIOR shares purchased by Rolf U. Sutter in May 2018 at special terms under an employee stock ownership program and subject to a mandatory holding period expiring 31 July 2021. The corresponding management transaction disclosures were issued on 30 October 2015 and on 30 May 2018. 3 Corresponds to the information given in the disclosure notifications and is based on ORIOR AG’s total share capital prior to the capital increase conducted in March 2018.
Market information / key data
30.06.2018 30.06.2017
Share price on 30.06. in CHF 85.20 76.20
Year high (July – June) in CHF 88.40 86.00
Year low (July – June) in CHF 71.40 64.80
Market capitalisation on 30.06. in CHF million 555.3 451.5
Net result per share in CHF 2.25 2.51
Net result per share (diluted) in CHF 2.25 2.51
Operating cash flow per share in CHF 3.32 4.82
Equity per share in CHF 51.61 42.93
Weighted Ø number of shares outstanding in ’000 6 273 5 905
The “per share” benchmark figures are calculated on the basis of the weighted average number of shares in circulation.
Corporate calendar
Publication of the Full Year Results 2018 04.03.2019
Publication of the Annual Report 2018 04.03.2019
9th Annual General Meeting 11.04.2019 Pub
licat
ion
det
ails
Pu
blis
he
r O
RIO
R A
G, D
ufo
urst
rass
e 10
1, C
H-8
008
Zuri
ch |
Se
ttin
g a
nd
Pri
nti
ng
Nei
dha
rt +
Sch
ön
Gro
up Z
uric
hTh
is h
alf
year
rep
ort
is p
ublis
hed
in G
erm
an a
nd E
nglis
h. T
he b
ind
ing
ver
sio
n o
f th
e O
RIO
R h
alf
year
rep
ort
201
8 is
in G
erm
an.

ORIOR AGDufourstrasse 101CH-8008 ZurichTel: +41 44 308 65 [email protected]
Rapelli SA
Via Laveggio 13CH-6855 StabioTel: +41 91 640 73 [email protected]
Albert Spiess AG
Dorfstrasse 65 CH-7220 SchiersTel: +41 81 308 03 08of� [email protected]
Mösli Fleischwaren AG
Industriestrasse 9 CH-9524 Zuzwil Tel: +41 71 944 11 [email protected]
Fredag AG
Oberfeld 7CH-6037 RootTel: +41 41 455 57 [email protected]
ORIOR Menu AGPastinella
Industriestrasse 40CH-5036 OberentfeldenTel: +41 62 737 28 [email protected]
ORIOR Menu AGLe Patron
Rohrmattstrasse 1CH-4461 BöcktenTel: +41 61 985 85 [email protected]
Culinor NV
Houtstraat 46B-9070 DestelbergenTel: +32 9 229 05 [email protected]
Biotta AG
P� anzbergstrasse 8 CH-8274 TägerwilenTel: +41 71 466 48 48of� [email protected]


