ORIGINAL RESEARCH Open Access Wind tunnel … RESEARCH Open Access Wind tunnel testing and numerical...
14
ORIGINAL RESEARCH Open Access Wind tunnel testing and numerical simulation on aerodynamic performance of a three-bladed Savonius wind turbine Khandakar Niaz Morshed 1 , Mosfequr Rahman 2* , Gustavo Molina 2 and Mahbub Ahmed 3 Abstract The purpose of this research work is to investigate experimentally and computationally the feasibility of improving the performance of the vertical-axis Savonius wind turbine. The authors first performed a series of wind tunnel investigations on semi-cylindrical three-bladed Savonius rotor scale models with different overlap ratios and without overlap. These experiments were conducted in front of a low-speed subsonic wind tunnel at different Reynolds numbers. Pressures around the concave and convex surfaces of each blade, as well as the static torque for the rotor models, were measured. Using these experimental data, the authors calculated aerodynamic characteristics such as drag coefficients, static torque coefficients, and power coefficients. The authors then performed computational fluid dynamics (CFD) simulations using the commercial CFD software FLUENT and GAMBIT to analyze the static rotor aerodynamics of those models. The experimental and computational results were then compared for verification. Three different models with different overlap ratios were designed and fabricated for the current study to find the effect of overlap ratios. The results from the experimental part of the research show a significant effect of overlap ratio and Reynolds number on the improvement of aerodynamic performance of the Savonius wind turbine. At higher Reynolds number, the turbine model without overlap ratio gives better aerodynamic coefficients, and at lower Reynolds number, the model with moderate overlap ratio gives better results. Keywords: Savonius wind turbine, Aerodynamic performance, Torque coefficient, Power coefficient, Angle of rotation, Overlap ratio Background Background of Savonius wind turbine Vertical-axis wind turbines (VAWTs) include both a drag-type configuration, such as the Savonius rotor, and a lift-type configuration, such as the Darrieus rotor. The simplest type of vertical-axis wind turbine is the Savonius rotor, the operation of which depends on the difference in drag force when the wind strikes either the convex or concave part of its semi-cylindrical blades. Savonius rotors are good at self-starting and work independently of wind direction. However, its ef- ficiency is relatively lower than that of the lift-type VAWTs. Due to its simple design and low construction cost, Savonius rotors are primarily used to pump water and generate wind power on a small scale, and its large starting torque makes it suitable for starting other types of wind turbines that have inferior starting characteris- tics, such as the Darrieus rotor and Gyro mill [1]. Re- cently, some generators with high torque at low rotational speed, suitable for small-scale wind turbines, have been developed, suggesting that Savonius rotors may yet be used to generate electric power [1]. Wind turbine aerodynamics must be designed for opti- mal output to exploit the wind energy in a specific loca- tion. Diaz et al. [2] analyzed the drag and lift coefficients of a Savonius wind turbine to quantify the aerodynamic performance of the rotor. They found that maximum ef- ficiency, in terms of power coefficient, occurs at a tip speed ratio of λ = 1, and the drag coefficient decreases sharply when the tip speed ratio increases or decreases * Correspondence: [email protected] 2 Mechanical Engineering Department, Georgia Southern University, Statesboro, GA 30460, USA Full list of author information is available at the end of the article © 2013 Morshed et al.; licensee Springer. This is an Open Access article distributed under the terms of the Creative Commons Attribution License (http://creativecommons.org/licenses/by/2.0), which permits unrestricted use, distribution, and reproduction in any medium, provided the original work is properly cited. Morshed et al. International Journal of Energy and Environmental Engineering 2013, 4:18 http://www.journal-ijeee.com/content/4/1/18
-
Upload
nguyennguyet -
Category
Documents
-
view
226 -
download
3
Transcript of ORIGINAL RESEARCH Open Access Wind tunnel … RESEARCH Open Access Wind tunnel testing and numerical...
Morshed et al. International Journal of Energy and Environmental Engineering 2013, 4:18http://www.journal-ijeee.com/content/4/1/18
ORIGINAL RESEARCH Open Access
Wind tunnel testing and numerical simulation onaerodynamic performance of a three-bladedSavonius wind turbineKhandakar Niaz Morshed1, Mosfequr Rahman2*, Gustavo Molina2 and Mahbub Ahmed3
Abstract
The purpose of this research work is to investigate experimentally and computationally the feasibility of improvingthe performance of the vertical-axis Savonius wind turbine. The authors first performed a series of wind tunnelinvestigations on semi-cylindrical three-bladed Savonius rotor scale models with different overlap ratios andwithout overlap. These experiments were conducted in front of a low-speed subsonic wind tunnel at differentReynolds numbers. Pressures around the concave and convex surfaces of each blade, as well as the static torque forthe rotor models, were measured. Using these experimental data, the authors calculated aerodynamiccharacteristics such as drag coefficients, static torque coefficients, and power coefficients. The authors thenperformed computational fluid dynamics (CFD) simulations using the commercial CFD software FLUENT andGAMBIT to analyze the static rotor aerodynamics of those models. The experimental and computational resultswere then compared for verification. Three different models with different overlap ratios were designed andfabricated for the current study to find the effect of overlap ratios. The results from the experimental part of theresearch show a significant effect of overlap ratio and Reynolds number on the improvement of aerodynamicperformance of the Savonius wind turbine. At higher Reynolds number, the turbine model without overlap ratiogives better aerodynamic coefficients, and at lower Reynolds number, the model with moderate overlap ratio givesbetter results.
Keywords: Savonius wind turbine, Aerodynamic performance, Torque coefficient, Power coefficient, Angle ofrotation, Overlap ratio
BackgroundBackground of Savonius wind turbineVertical-axis wind turbines (VAWTs) include both adrag-type configuration, such as the Savonius rotor, anda lift-type configuration, such as the Darrieus rotor.The simplest type of vertical-axis wind turbine is theSavonius rotor, the operation of which depends on thedifference in drag force when the wind strikes eitherthe convex or concave part of its semi-cylindricalblades. Savonius rotors are good at self-starting andwork independently of wind direction. However, its ef-ficiency is relatively lower than that of the lift-typeVAWTs. Due to its simple design and low construction
* Correspondence: [email protected] Engineering Department, Georgia Southern University,Statesboro, GA 30460, USAFull list of author information is available at the end of the article
© 2013 Morshed et al.; licensee Springer. This iAttribution License (http://creativecommons.orin any medium, provided the original work is p
cost, Savonius rotors are primarily used to pump waterand generate wind power on a small scale, and its largestarting torque makes it suitable for starting other typesof wind turbines that have inferior starting characteris-tics, such as the Darrieus rotor and Gyro mill [1]. Re-cently, some generators with high torque at lowrotational speed, suitable for small-scale wind turbines,have been developed, suggesting that Savonius rotorsmay yet be used to generate electric power [1].Wind turbine aerodynamics must be designed for opti-
mal output to exploit the wind energy in a specific loca-tion. Diaz et al. [2] analyzed the drag and lift coefficientsof a Savonius wind turbine to quantify the aerodynamicperformance of the rotor. They found that maximum ef-ficiency, in terms of power coefficient, occurs at a tipspeed ratio of λ = 1, and the drag coefficient decreasessharply when the tip speed ratio increases or decreases
s an Open Access article distributed under the terms of the Creative Commonsg/licenses/by/2.0), which permits unrestricted use, distribution, and reproductionroperly cited.

Morshed et al. International Journal of Energy and Environmental Engineering 2013, 4:18 Page 2 of 14http://www.journal-ijeee.com/content/4/1/18
from this value. They also found that the most import-ant region of Savonius rotor operation occurs at a tipspeed ratio around λ = 1, where the lift coefficient re-mains as a constant 0.5. Sawada et al. [3] studied themechanism of rotation of a Savonius rotor with twosemi-cylindrical blades and found that a rotor with a gapratio of 0.21 produces positive static torque at all angles.They also found that lift force contributes significantlyto dynamic torque, while the rotor angle is between α =240° and α = 330°. Aldoss and Obeidat [4] used thediscrete vortex method to analyze the performance oftwo Savonius rotors running side-by-side at differentseparations. They compared their computational resultson torque and power coefficients with their experimentalresults for verification. Fujisawa and Gotoh [5] studiedthe aerodynamic performance of a Savonius rotor bymeasuring pressure distribution on the blade surfaces atvarious rotor angles and tip speed ratios. Torque andpower performance, evaluated by integrating the pressure,were in close agreement with direct torque measurements.Rahman et al. [6-8] experimentally studied aero-
dynamic characteristics, such as the torque and drag co-efficients, of a three-bladed Savonius rotor model bymeasuring the pressure difference between the convexand concave surfaces of each semi-cylindrical blade ofthe stationary rotor at different rotor angles and thevariation of the separation point with the increase ofrotor angle. They used the static coefficients for dynamicprediction and compared the findings in terms of powercoefficients for different tip speed ratios with experimen-tal results for the two-bladed Savonius rotor. Rahmanet al. [9] conducted both experimental investigations andcomputational fluid dynamic (CFD) simulations to es-tablish the feasibility of improving the performance of asimple, three-bladed Savonius VAWT. The normal dragcoefficient, tangential drag coefficient, and torque coeffi-cient were calculated both experimentally and numeric-ally, and the results were compared. In each case, thecalculations matched well. The numerical results weremore accurate and gave positive values for combineddrag coefficients and the total static torque coefficient.Gupta et al. [10] compared a three-bucket Savonius
wind turbine with a three-bucket Savonius-Darrieuswind turbine. They found that the power coefficient ofthe combined turbine decreases as the overlap ratio in-creases. The maximum power coefficient of 51% wasfound where there was no overlap. They claimed thatthe combined rotor without overlap, which showed 51%efficiency, was the highest efficiency of a Savonius windturbine at any overlap condition under these test condi-tions. Altan et al. [11] did some experimental studies toimprove the performance of the Savonius wind turbineusing a curtain. They placed the curtain arrangementin front of the rotor in a configuration capable of
preventing the negative torque that affects the convexblade surface of the Savonius wind turbine.Sargolzaei and Kianifar [12] simulated a Savonius wind
turbine using artificial neural networks (ANNs) to esti-mate power ratio and torque. They experimentally inves-tigated seven prototype Savonius wind turbines andcompared the experimental results with their predictedANN results. Their predicted results were in good agree-ment with their experimental results. They found thatincreased wind speed causes torque increase. For alltheir models, they found that maximum torque was at60° and minimum torque was at 120°. Altan and Atilgan[13] numerically simulated their experimental workusing FLUENT 6.0 and GAMBIT 2.0. Their model wastwo-dimensional, and they used a standard k-ε turbulencemodel. To calculate pressure and velocity distribution,they used a semi-implicit method for pressure-linkedequation (SIMPLE) analysis algorithm. By comparing thenumerical and experimental results, they concluded thatthe curtain improved the performance of Savonius windturbines.Saha et al. [14] fabricated a two-stage Savonius wind
turbine by inserting valves on the concave side of theblades. They compared its performance to a conven-tional Savonius wind turbine and found that withvalves on a three-bladed turbine, the power coefficientwas higher compared to a two-bladed turbine for bothsemi-circular and twisted blades. Without valves, airstrikes the blades and rotates them in a negative direc-tion. Saha et al. also varied the number of stages in aSavonius wind turbine and found that while the powercoefficient increased from one to two stages, it de-creased from two to three stages due to increased iner-tia. They tested the twisted blades of one, two, andthree stages and found that the three stages had a bet-ter power coefficient, and the twisted blades showedbetter performance.To decrease the variation in static torque in conven-
tional Savonius rotors at a 0° to 360° rotor angle, Kamojiand Kedare [15] tested a helical rotor with a twist of 90°.They conducted experiments in an open-jet wind tunnelat gap ratios of 0.0, 0.05, and 0.08 to study the effect ofgap ratio and Reynolds number on its performance andevaluated static torque, dynamic torque, and power coef-ficients. They compared its performance with and with-out a shaft between the end plates at different gap ratios.A helical rotor without a shaft was also compared withthe performance of the conventional Savonius rotor.They found that all helical rotors have a positive coeffi-cient of static torque at all rotor angles, but the rotorswith a shaft had a lower power coefficient than thosewithout. The coefficient of power of the rotor without ashaft with a 0.0 gap ratio was marginally less than theconventional Savonius rotor.

Figure 1 Subsonic wind tunnel.
Morshed et al. International Journal of Energy and Environmental Engineering 2013, 4:18 Page 3 of 14http://www.journal-ijeee.com/content/4/1/18
Gupta et al. [16] investigated the performance of two-bladed Savonius turbine with five overlaps of 16.2%,20%, 25%, 30%, and 35%. Among them, 16.2% overlapcondition showed maximum power extraction. The pres-sure drop across the rotor from upstream to down-stream as well as the maximum pressure differenceacross the returning bucket is displayed in the same con-dition. Qasim et al. [17] worked with impeller scoop-frame type with movable vanes wind turbine (VAWT).The objective was to maximize the drag factor by closingthe vanes on convex shape and opening when air hitsthe concave part. Due to the movement of vanes for andagainst the wind, a higher drag factor is worked on theimpeller scoop-frame type with movable vanes and hashigher efficiency than flat vanes.Ghatage and Jyeshtharaj [18] have done an experiment
by changing the shape of the blade as well as the bladenumber. They have studied with both regular curvedblade and twisted curved blade. The experiment con-cluded that the two blades with twist enhance the effi-ciency of turbine. In their experiment, the 30°-twistedtwo-bladed turbine gave the better power coefficient. Itcan be concluded that the twisted blade attributes rela-tively higher drag over the turbine surface.Kumbernuss et al. [19] studied two-staged Savonius-
type turbines with different number of blades, the shapeof the blades, the overlap ratio, and the phase shift angle.The wind turbine was tested under four different windspeeds of 4, 6, 8, and 10 m/s. There were three turbineswith the overlap ratios of 0, 0.16, and 0.32. The overlapratio of 0.16 produced the better performance amongthe three, followed by the 0.32 overlap ratio. At lowerand higher air velocities, the larger and smaller phaseshift angles, respectively, will produce better perform-ance of the turbines.Carrigan et al. [20] had the objective to introduce and
demonstrate a fully automated process for optimizingthe airfoil cross section of a vertical-axis wind turbine.The objective was to maximize the torque while enfor-cing typical wind turbine design constraints such astip-speed ratio, solidity, and blade profile. This worksuccessfully demonstrated a fully automated process foroptimizing the airfoil cross section of a VAWT.Researchers from different parts of the world have
been investigating the aerodynamic characteristics ofSavonius wind turbines and trying to identify theoptimum design in order to achieve better performancecompared to horizontal-axis wind turbines. Althoughmuch research has been going on experimentally andnumerically on Savonius wind turbine performance im-provement, there are few to no comprehensive studiesusing both experimental and numerical methods forvarious gap ratios at different Reynolds numbers. Theprimary goal of the present study is to investigate the
aerodynamic characteristics of three-bladed Savoniuswind turbines in order to contribute to the performanceimprovement of vertical-axis Savonius wind turbines. Toachieve this goal, the authors designed and fabricatedSavonius wind turbine scale models with no overlap ra-tio and two different overlap ratios, measured the pres-sure distribution around the Savonius turbine rotormodels, and calculated the drag coefficients. Statictorque was measured using the subsonic wind turbinefor all models at varying angles of rotation, the meshwas generated numerically around all turbine modelsusing GAMBIT, and fluid flow fields around the modelswere solved using k-ε turbulence model of FLUENT.Pressure contours, velocity contours, and torque weredetermined at various Reynolds numbers. A detail of theexperimental and computational procedure of this re-search work can be found in the thesis work done byone of the authors [21].
MethodsExperimental measurementSubsonic wind tunnelA subsonic wind tunnel was designed and built to con-duct the experimental measurement of this research asshown in Figure 1. The wind tunnel is 12-ft (3.66 m)long and consists of a converging mouth entry, honey-comb Section Background, test section, fan section, rect-angle section, honeycomb Section Methods, convergingdiverging section, and rectangular exit section.
Mathematical expressionsThe following equations were used to calculate variousexperimental aerodynamic coefficients corresponding todifferent Reynolds numbers (Re) and tip speed ratios (λ).Savonius rotor model dimensions and wind tunnel mea-sured data were used as inputs for these equations.

Morshed et al. International Journal of Energy and Environmental Engineering 2013, 4:18 Page 4 of 14http://www.journal-ijeee.com/content/4/1/18
Rotor area:
A ¼ DH : ð1ÞOverlap ratio:
OR ¼ aD: ð2Þ
Aspect ratio:
AR ¼ Hd: ð3Þ
Angular velocity:
ω ¼ 2πN60
: ð4Þ
Reynolds number:
Re ¼ VDν
: ð5Þ
Tip speed ratio:
λ ¼ ωD2V
ð6Þ
Torque coefficient:
Cq ¼ T14 ρADV
2 : ð7Þ
Power coefficient:
Cp ¼ P12 ρAV
3 ¼Tω
12 ρAV
3 ¼ Cq � λ: ð8Þ
Normal drag force:
Fn ¼ ∫π
0Δp
d2cos∅d∅ ¼∑
17
i¼1Δpi
d2cos∅iΔ∅i: ð9Þ
Figure 2 Setup of Savonius rotor model with pressure transducer dat
Tangential drag force:
F t ¼ ∫π
0Δp
d2sin∅d∅ ¼∑
17
i¼1Δpi
d2sin∅iΔ∅i: ð10Þ
Normal drag coefficient:
Cn ¼ Fn12 ρV
2A: ð11Þ
Tangential drag coefficient:
Ct ¼ F t12 ρV
2A: ð12Þ
Drag force measurementThe pressure distribution around the concave and con-vex surfaces of each blade was measured experimentallyusing a semi-cylindrical three-bladed Savonius VAWTmodel with overlap distance, a = 25 mm, between theadjacent blades as shown in Figure 2. The rotor modelwas made of stainless steel with each blade diameter,d = 125 mm, height, H = 300 mm, and rotor diameter, D =225 mm. The overlap ratio (OR) was 0.11, and no shaftwas used through the rotor model. The whole rotor wasmounted on an iron frame using two separate shafts andbearings at the two ends. The convex and concave surfacepressures of each blade were measured at 17 tappingpoints using 1.5-mm outer diameter and 10-mm-longcopper tubes which were press fitted into 17 tapping holes.Those tapping points were located at the mid-plane ofeach blade to measure the pressure at every 10° intervalon the blade surface. The copper tubes were connected to17 pressure transducers (PX277, Omega Engineering Inc.,Stamford, CT, USA) through the 2-mm PVC tubes. Pres-sures were measured statically at every 30° interval of
a acquisition system for drag force measurement.

Figure 3 Schematic of the rotor model cross section. Showing the normal and tangential drag forces on each blade.
Morshed et al. International Journal of Energy and Environmental Engineering 2013, 4:18 Page 5 of 14http://www.journal-ijeee.com/content/4/1/18
rotor angle. A personal computer equipped with a data ac-quisition system was used to record and edit the pressuredata. Average wind speed during this experiment was9.61 m/s. The Reynolds number based on rotor diameterwas 1.47 × 10⁵. The normal and tangential drag forces oneach blade of the Savonius rotor model were calculatedusing the measured pressure difference between the con-cave and convex surfaces of the blades using Equations 9and 10. Figure 3 shows the cross section of the rotor withthe normal and tangential drag force directions. Tangentialand normal drag coefficients were then calculated usingEquations 11 and 12.
Three-bladed Savonius rotor modelsTo observe the effect of the OR (the ratio between thedistance of the two adjacent blades and the rotor diam-eter) and Reynolds number on the aerodynamic
Model 1 Model 2
Figure 4 3-D and fabricated views of three Savonius rotor models.
characteristics of the Savonius rotor, three different rotormodels with and without overlap ratios were designedand physically fabricated. Figure 4 shows the threeSavonius rotor models with three different ORs. Model1 was designed without any overlap between the adja-cent blades and fabricated with three semi-cylindricalblades of diameter, d = 127 mm, and height, H =300 mm. The blades of model 1 were made of acrylicand set 120° apart. The overall diameter of the rotormodel 1 was D = 248 mm without any central shaft.Model 2 was designed with an overlap distance betweenthe adjacent blades, a = 25 mm but having the sameblade diameter and height as model 1, and was fabri-cated with the same number of blades 120° apart. Theoverall rotor diameter of model 2 was D = 216 mm withOR = 0.12. Model 3 was designed and fabricated with anoverlap distance between adjacent blades, a = 50 mm,
Model 3

Figure 5 Setup of wind tunnel and Savonius rotor model forstatic torque measurement.
Model 1
Model 2
Model 3
Figure 6 Generated mesh using GAMBIT.
Morshed et al. International Journal of Energy and Environmental Engineering 2013, 4:18 Page 6 of 14http://www.journal-ijeee.com/content/4/1/18
with the same blade diameter, height, and number ofblades set 120° apart as model 1 and model 2. Theoverall rotor diameter of model 3 was D = 192 mm andOR = 0.26. These three models were tested in front ofthe subsonic wind tunnel for various Reynolds numberflow conditions.
Static torque measurementThe experiment was carried out at three different windspeeds: V = 9.66, 8.23, and 7.33 m/s. The Reynolds num-bers based on the rotor diameter varied from 9.94 × 10⁴
to 1.6 × 10⁵. Experiments were carried out, and datawere recorded at room temperature. Static torque (T)for the three different models of the Savonius wind tur-bine was measured using a static torque meter (TQ-8800 model, Lutron Electronic Enterprise Co., Ltd.,Taipei, Taiwan) at three different wind speeds. Torquemeter output was in pound-inch which was then con-verted into Newton-meter. Rotational speed (N) was mea-sured using a non-contact photo tachometer. Equation 4was used to calculate the angular velocity from the rota-tional speed.Savonius wind turbine is a drag-type VAWT where the
lift forces are considered to be negligible. Figure 5 showsthe experimental setup for torque measurement of aSavonius wind turbine model. When the wind strikesthe blade surfaces of the model, two components of dragforce are generated on each blade surface. Normal dragforce (Fn) acts perpendicularly on the blade surface, andthe tangential drag force (Ft) acts tangentially on each
blade, as shown in Figure 3. The pressure difference be-tween the concave and convex surfaces on each bladeproduces these tangential and normal drag forces. Thesecomponents of drag force are responsible for torquegeneration within the turbine shaft and can be measuredusing a torque meter. Equation 7 is used to calculate thetorque coefficient from the measured torque value. Thepower coefficient can be calculated from the measuredtorque and angular velocity of the rotor usingEquation 8.
Numerical investigationNumerical model selectionFor the selection of the numerical model from the CFDcode FLUENT 2D, a NACA 4412 airfoil was numerically
-0.4
-0.2
0
0.2
0.4
0.6
0.8
1
1.2
0 20 40 60 80 100
120
140
160
180
200
220
240
260
280
300
320
340
360
Nor
mal
Dra
g C
oeff
icie
nt (
Cn)
Angle of rotation (θ)
Figure 7 Cn versus angle of rotation (θ) for a three-blade combined effect.
Morshed et al. International Journal of Energy and Environmental Engineering 2013, 4:18 Page 7 of 14http://www.journal-ijeee.com/content/4/1/18
examined at a different angle of attack and comparedwith established research results. Using the flow simula-tion results from both the inviscid model and the k-εturbulence model, lift coefficient was calculated and thencompared with published [22] NACA 4412 airfoil re-sults. Comparing the inviscid model and the k-ε turbu-lence model results with established published results, itwas found that the k-ε turbulence model gave more ac-curate results than the inviscid model. Therefore, the k-εturbulence model was selected for numerical modelingof the Savonius wind turbine.
Numerical procedureThe k-ε turbulence model was used for the computa-tional flow simulation around the Savonius rotor modelswith different overlap ratios. Commercially availablesoftware FLUENT was used to solve the turbulent flowfield, and GAMBIT was used for mesh generationaround the rotor models. Numerical simulation providesthe pressure and velocity values at all nodal points offlow domain around the rotating blades. Figure 6 showsthe 2-D mesh generated using GAMBIT within a com-putational domain around three-bladed Savonius wind
0
0.2
0.4
0.6
0.8
1
1.2
1.4
0 20 40 60 80 100
120
140
160T
ange
ntia
l Dra
g C
oeff
icie
nt (
Ct)
Angle of
Figure 8 Ct versus angle of rotation (θ) for the three-bladed rotor.
turbine models in which the position of the three bladeswere 0°, 120°, and 240°. The size of the computationaldomain was 1.6 m × 1.4 m, and the total number ofnodes was around 39,992. These computer-generatedmeshes were then exported into FLUENT for post-processing. The flow of air within the domain aroundthe rotor model was assumed to be turbulent, and theeffects of molecular viscosity were considered negligible.Also, the end effects of the turbine have been considerednegligible. The simplest ‘complete models’ of turbulenceare two-equation models in which the solution of twoseparate transport equations allows the turbulent vel-ocity and length scales to be independently determined.The standard k-ε turbulence model in FLUENT was
used for the analysis of turbulent flow around rotormodels. The pressure–velocity coupling is achievedusing the well-known SIMPLE method by Patankar [23].Turbulence kinetic energy (k) and turbulence dissipationrate (ε) first-order upwind scheme was chosen for themomentum equation solution. The standard k-ε turbu-lence model [24] is a semi-empirical model based onmodel transport equations for k and its ε. The modeltransport equation for k was derived from the exact
180
200
220
240
260
280
300
320
340
360
rotation (θ)

-0.300-0.200-0.1000.0000.1000.2000.3000.4000.5000.6000.700
0 30 60 90 120
150
180
210
240
270
300
330
360
Tor
que
Coe
ffic
ient
(C
q)
Angle of Rotation (θ)
Re = 1.61E+05 Re = 1.37E+05 Re = 1.22E+05
Figure 9 Cq versus angle of rotation (θ) for model 1.
Morshed et al. International Journal of Energy and Environmental Engineering 2013, 4:18 Page 8 of 14http://www.journal-ijeee.com/content/4/1/18
equation, while the model transport equation for ε wasobtained using physical reasoning and bears little resem-blance to its mathematically exact counterpart.The turbulence kinetic energy, k, and its rate of dissi-
pation, ε, were obtained from the following transportequations:
∂∂t
ρkð Þ þ ∂∂xi
ρkuið Þ ¼ ∂∂xj
μþ μtσk
� �∂k∂xj
� �
þ Gk þ Gh−ρε−YM
þ Sk ; ð13Þ
∂∂t
ρεð Þ þ ∂∂xi
ρεuið Þ ¼ ∂∂xj
μþ μtσε
� �∂ε∂xj
� �
þ c1εε
kGk þ C3εGbð Þ−C2ερ
ε2
kþ Sε:
ð14Þ
In these equations, Gk represents the generation ofturbulence kinetic energy due to the mean velocity gra-dients; Gb, the generation of turbulence kinetic energydue to buoyancy; YM, the contribution of the fluctuating
0.000
0.100
0.200
0.300
0.400
0.500
0.600
0.700
0 30 60 90 120
150
Tor
que
Coe
ffic
ient
(C
q)
Angle o
Re = 1.40E+05 R
Figure 10 Cq versus angle of rotation (θ) for model 2.
dilatation in compressible turbulence to the overall dissi-pation rate; and C1ε, C2ε, and C3ε, constants. σk and σεare the turbulent Prandtl numbers for k and ε, respect-ively. Sk and Sε are user-defined source terms. The tur-bulent (or eddy) viscosity, μt, is computed by combiningk and ε as follows:
μt ¼ ρCμk2
ε; ð15Þ
where Cμ is a constant.Boundary conditions were assigned with symmetric
top and bottom, the left side was open with inlet free-stream velocity, and the right side was open with anatmospheric pressure outlet. Inlet air velocity was con-sidered the same as the experimental values, i.e., 9.66,8.23, and 7.33 m/s, and air density was considered at1.2 kg/m3. The blades were considered as moving wallsand their rotational velocity was provided from the rpmmeasured during the experiment. The convergence ofthe sequential iterative solution is achieved when thesum of the absolute differences of the solution variablesbetween two successive iterations falls below a pre-specified small number, which was chosen as 1 × 10⁻⁵ in
180
210
240
270
300
330
360
f Rotation (θ)
e = 1.19E+05 Re = 1.06E+05
0.000
0.100
0.200
0.300
0.400
0.500
0.600
0.700
0 30 60 90 120
150
180
210
240
270
300
330
360
Tor
que
Coe
ffic
ient
(C
q)
Angle of Rotation (θ)
Re = 1.24E+05 Re = 1.06E+05 Re = 9.44E+04
Figure 11 Cq versus angle of rotation (θ) for model 3.
Morshed et al. International Journal of Energy and Environmental Engineering 2013, 4:18 Page 9 of 14http://www.journal-ijeee.com/content/4/1/18
this study. For all models using k-ε turbulence modelconvergence criteria, 1 × 10⁻⁵ was set and tested for con-tinuity, x velocity, y velocity, k, and ε.
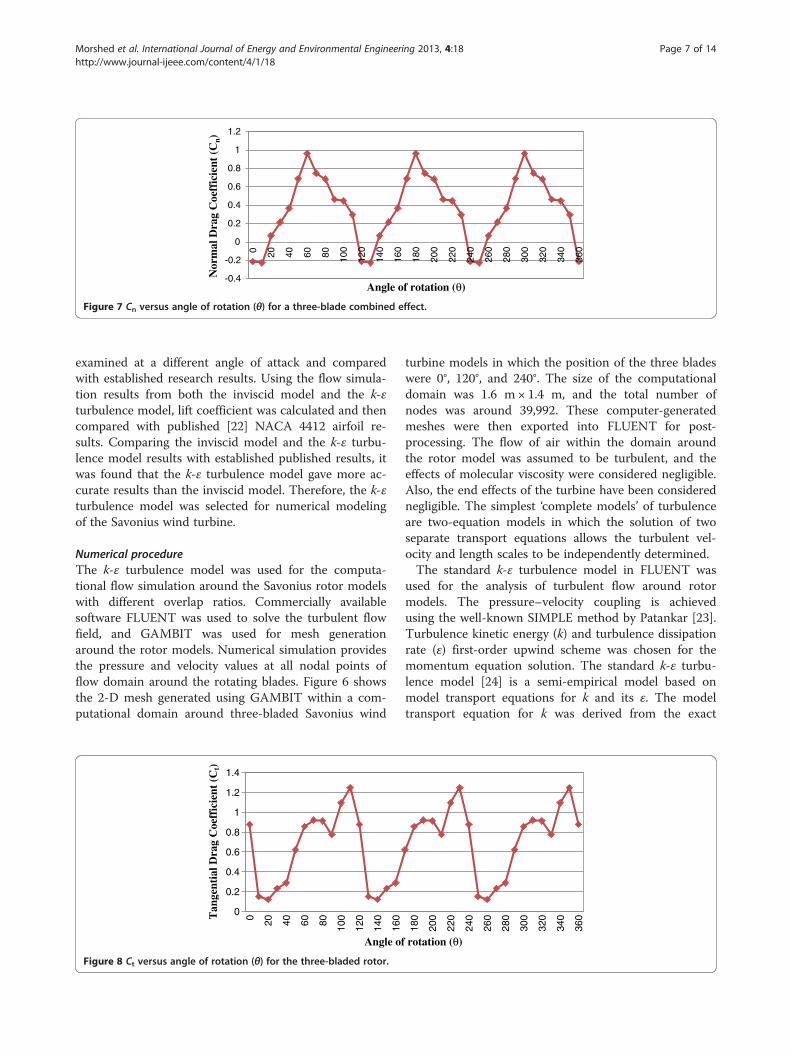
Results and discussionExperimental resultsNormal and tangential drag coefficientsNormal drag coefficient (Cn) variation with the changein angle of rotation (θ) for the three-bladed Savoniuswind turbine model is shown in Figure 7. A three-bladecombined effect at every 10° interval from 0° to 360° isshown in this plot. Normal drag coefficient increaseswith the increase of rotor angle from 0° to 60° and thendecreases with the increase of rotor angle up to 100°.Normal drag coefficient is responsible for torque gener-ation in the rotor model. The same pattern of normaldrag coefficient repeats from 120° to 230° and from 240°to 350°.Tangential drag coefficient (Ct) with change in rotor
angle (θ) for every 10° interval from 0° to 360° is shownin Figure 8. The figure shows that a sharp drop occurs
-0.100
-0.050
0.000
0.050
0.100
0.150
0.200
0.250
0 30 60 90 120
Pow
er C
oeff
icie
nt (
Cp)
Angle
Re = 1.61E+05 R
Figure 12 Cp versus angle of rotation (θ) for model 1.
from 0° to 10° and then sharp increase occurs from 10°to 40°. Again, a sharp drop occurs in the tangential dragcoefficient from 40° to 90°, and a sharp increase occursfrom 90° to 120°. However, for every angle of rotation,the tangential drag coefficient remains positive which isa very important factor for producing thrust in the rotormodel. The same pattern of tangential drag coefficientrepeats from 120° to 230° and from 240° to 350° of angleof rotation.
Torque coefficient variation for three individual SavoniusVAWT modelsTorque coefficient of the Savonius wind turbine model 1was calculated for three different Reynolds number.Figure 9 shows torque coefficient (Cq) variation with theincrease of angle of rotation (θ). Torque coefficient wascalculated for combined blade effect at every 30° intervalfrom 0° to 360°. Three Reynolds numbers for model 1were 1.61 × 10⁵ (for wind speed 9.66 m/s), 1.37 × 10⁵ (forwind speed 8.23 m/s), and 1.22 × 10⁵ (for wind speed7.33 m/s). For every Reynolds number, the values of
150
180
210
240
270
300
330
360
of Rotation (θ)
e = 1.37E+05 Re = 1.22E+05

0.000
0.020
0.040
0.060
0.080
0.100
0.120
0.140
0.160
0 30 60 90 120
150
180
210
240
270
300
330
360
Pow
er C
oeff
icie
nt(C
p)
Angle of Rotation (θ)
Re = 1.40E+05 Re = 1.19E+05 Re = 1.06E+05
Figure 13 Cp versus angle of rotation (θ) for model 2.
Morshed et al. International Journal of Energy and Environmental Engineering 2013, 4:18 Page 10 of 14http://www.journal-ijeee.com/content/4/1/18
torque coefficient increase from 0° to 60° and then startto decrease from 60° to 120°. The same pattern repeatsfor the rotor angle from 120° to 210° and from 240° to330°. For Reynolds number, 1.00 × 10⁵, the value oftorque coefficient becomes negative at 120°, 210°, and240°. It is desired to remove the negative torque for allrotor positions, as this negative torque causes reverse ro-tation which can reduce power output. Figure 10 showsCq variation with the angle of rotation (θ) for rotormodel 2. Similarly, the combined blade effect on torquecoefficient with 30° interval from 0° to 360° was calcu-lated. Reynolds numbers for model 2 were 1.40 × 10⁵
(for wind speed 9.66 m/s), 1.19 × 10⁵ (for wind speed8.23 m/s), and 1.06 × 10⁵ (for wind speed 7.33 m/s).From the figure, it can be seen that the torque coeffi-cient increases from 0° to 60° and decreases at 90°, andagain increases at 120° (except at Re = 1.06 × 10⁵). Therewas no negative torque coefficient for this model. Thesame pattern repeats for the rotor angle from 120° to210° and from 240° to 330°. Figure 11 shows Cq variation
0.000
0.010
0.020
0.030
0.040
0.050
0.060
0 30 60 90 120
150
Pow
er C
oeff
icie
nt (
Cp)
Angle
Re = 1.24E+05 R
Figure 14 Cp versus angle of rotation (θ) for model 3.
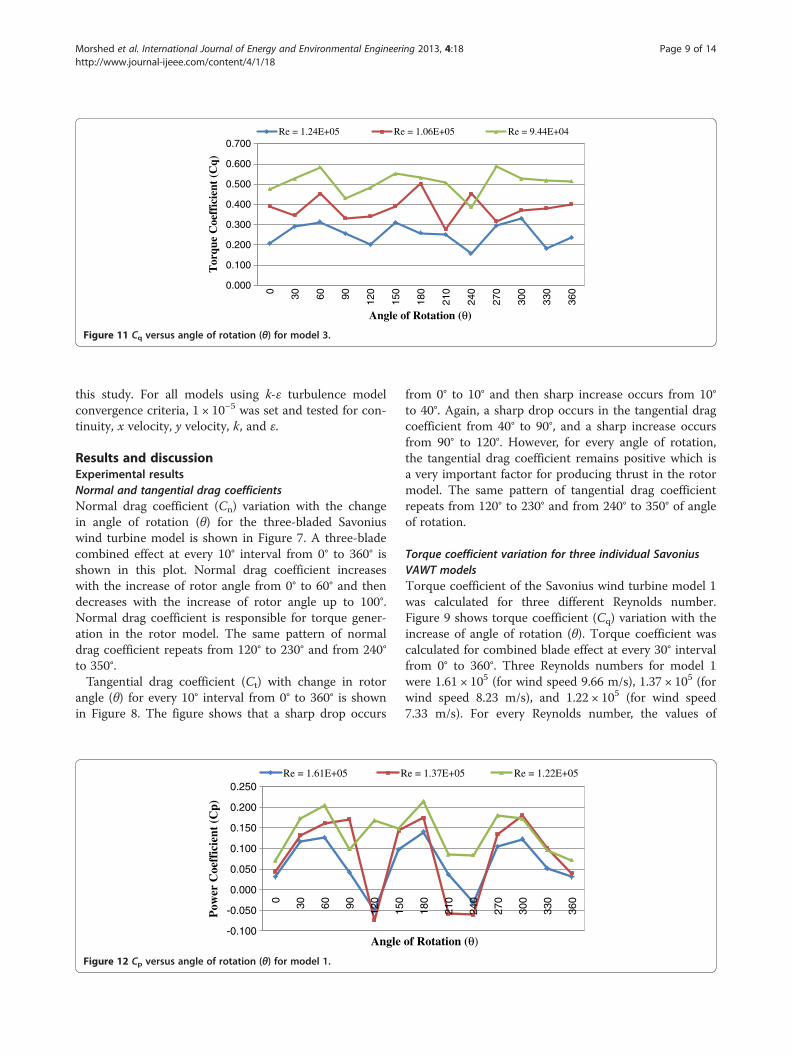
with the increase of angle of rotation (θ) for model 3.Likewise other two models, combined blade effect ontorque coefficient at every 30° interval from 0° to 360°was calculated. Reynolds numbers for model 3 were1.24 × 105 (for wind speed 9.66 m/s), 1.06 × 10⁵ (for windspeed 8.23 m/s), and 9.44 × 10⁵ (for wind speed 7.33 m/s).For Re = 1.24 × 10⁵, 1.06 × 10⁵, and 9.44 × 10⁵, the pat-tern of the graph looks similar. The torque coefficientincreases from 0° to 60° then decreases at 90°, and againincreases at 120° (except for Re = 1.24 × 10⁵). The samepattern repeats for the rotor angle from 120° to 210°and from 240° to 330°.
Power coefficient variation for three individual SavoniusVAWT modelsPower coefficient (Cp) was calculated using the relation-ship between Cp and Cq which is Cp = Cq × λ at three dif-ferent Re for all three models. Figure 12 shows Cp
variation with angle of rotation (θ) from 0° to 360° formodel 1. Trends of the plots are similar for Re = 1.61 ×
180
210
240
270
300
330
360
of Rotation (θ)
e = 1.06E+05 Re = 9.44E+04

a b cFigure 15 Pressure contours around Savonius rotor (a) model 1, (b) model 2, (c) model 3 for all three Reynolds numbers.(Reynolds numbers in descending order from top to bottom).
Figure 16 Velocity contours around Savonius rotor (a) model 1, (b) model 2, (c) model 3 for all three Reynolds numbers.(Reynolds numbers are in descending order from top to bottom).
Morshed et al. International Journal of Energy and Environmental Engineering 2013, 4:18 Page 11 of 14http://www.journal-ijeee.com/content/4/1/18
0
0.002
0.004
0.006
0.008
0.01
0.012
0.014
0.0165.
00E
+04
7.50
E+
04
1.00
E+
05
1.25
E+
05
1.50
E+
05
Tor
que
Coe
ffic
ient
(C
q)
Reynolds Number (Re)
Model 1Model 2Model 3
Figure 17 Numerical Cq versus Re for three models.
Morshed et al. International Journal of Energy and Environmental Engineering 2013, 4:18 Page 12 of 14http://www.journal-ijeee.com/content/4/1/18
105, 1.37 × 10⁵, and 1.22 × 10⁵. Power coefficient wasnegative at 120°, 210°, and 240° for Re = 1.37 × 10⁵ and at120° and 240° for Re = 1.61 × 10⁵. For this model, betterpower coefficient variation occurred at Re = 1.22 × 10⁵.Figure 13 shows Cp variation with angle of rotation (θ)at three different Re for model 2. There is no negativepower coefficient for this model at any Reynolds num-ber. Figure 14 shows Cp variation with the change ofangle of rotation (θ) from 0° to 360° for model 3. For thismodel, power coefficient variation follows the similartrend for all Reynolds number, increasing from 0° to 60°and then decreasing up to 120° then repeats from 120°to 230° and from 240° to 330°.
Numerical resultsPressure contours for three models at three differentReynolds numbersPressure contours generated from numerical simulationof model 1, model 2, and model 3 for three differentReynolds numbers are shown in Figure 15a,b,c, respect-ively. For all these cases, higher pressure values werefound at the convex side of the first blade Savonius rotor
0
0.05
0.1
0.15
0.2
0.25
0.3
0.021 0.35 0.3
Pow
er C
oeff
icie
nt (
Cp)
Tip Speed ratio
Figure 18 Cp versus λ for model 1.
model. Negative pressure region was developed from theconvex side of blade 2 to some portion of the convexside of blade 3. This negative pressure is creating pres-sure difference between the concave and convex surfacesthat eventually rotates the turbine blades.
Velocity contours for three models at three differentReynolds numbersContours of velocity magnitude for Savonius rotor model1, model 2, and model 3 at three different Reynolds num-bers are shown in Figure 16a,b,c, respectively. Patterns ofthe contours are almost the same for different Reynoldsnumbers; the only exception is a slight variation in velocitymagnitude. Once the wind strikes the turbine blades, thevelocity starts to decrease at the trailing edge of theSavonius wind turbine model, but after some distancetravel, the turbine blades start to regain their velocity.Higher velocity region was created at the top and bottomsides of the wind turbine model.
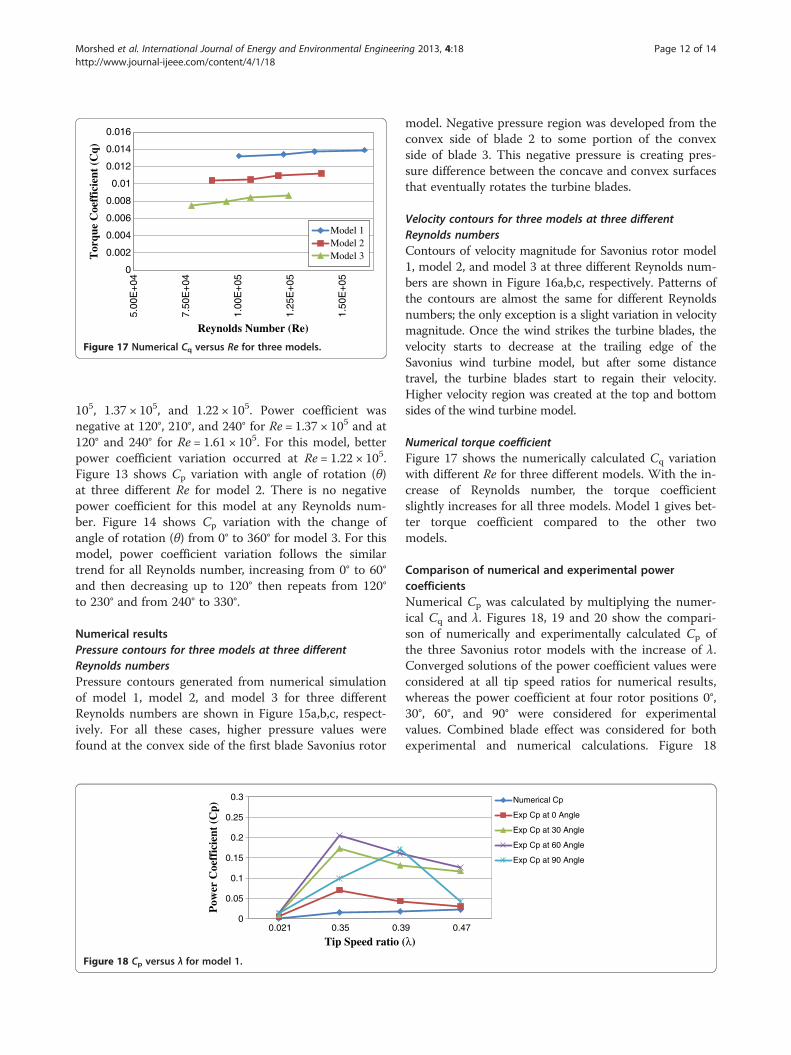
Numerical torque coefficientFigure 17 shows the numerically calculated Cq variationwith different Re for three different models. With the in-crease of Reynolds number, the torque coefficientslightly increases for all three models. Model 1 gives bet-ter torque coefficient compared to the other twomodels.
Comparison of numerical and experimental powercoefficientsNumerical Cp was calculated by multiplying the numer-ical Cq and λ. Figures 18, 19 and 20 show the compari-son of numerically and experimentally calculated Cp ofthe three Savonius rotor models with the increase of λ.Converged solutions of the power coefficient values wereconsidered at all tip speed ratios for numerical results,whereas the power coefficient at four rotor positions 0°,30°, 60°, and 90° were considered for experimentalvalues. Combined blade effect was considered for bothexperimental and numerical calculations. Figure 18
9 0.47
(λ)
Numerical Cp
Exp Cp at 0 Angle
Exp Cp at 30 Angle
Exp Cp at 60 Angle
Exp Cp at 90 Angle

0
0.03
0.06
0.09
0.12
0.15
0.18
0.028 0.19 0.24 0.35
Pow
er C
oeff
icie
nt (
Cp)
Tip Speed ratio (λ)
Numerical Cp
Exp Cp at 0 Angle
Exp Cp at 30 Angle
Exp Cp at 60 Angle
Exp Cp at 90 Angle
Figure 19 Cp versus λ for model 2.
Morshed et al. International Journal of Energy and Environmental Engineering 2013, 4:18 Page 13 of 14http://www.journal-ijeee.com/content/4/1/18
shows that for model 1 experimental power coefficientat rotor position 0° is very close to the numerical results.However, the deviation is huge for rotor position 60°.Disturbance from the surrounding environment causes asudden power coefficient increase for the experimentalvalue at different rotor positions, whereas for numericalcalculation of power coefficient, the boundary effect hasto consider for simulation purpose which causes a re-duction in converged numerical power coefficient value.Similar pattern of power coefficient variation is observedfor model 2 and model 3 as shown in Figures 19 and 20.However, the magnitude of the Cp decreases for model 2and model 3 for both numerical and experimental cases.
Error analysisNormal drag coefficient, tangential drag coefficient,torque coefficient, and power coefficient were calculatedboth experimentally and numerically and compared. Ex-perimental power coefficient matches well with the nu-merical results. The experimental results are slightlydeviated from the numerical results. In both computa-tional and experimental cases, there can be some pos-sible sources of errors, but computational results are stillmore towards the ideal case except some assumptionsthat were made for the model formulation. In the ex-perimental case, more possibilities of errors can be
0
0.02
0.04
0.06
0.08
0.1
0.017 0.089 0.092
Pow
er C
oeff
icie
nt (
Cp)
Tip Speed ratio (λ
Figure 20 Cp versus λ for model 3.
found because of equipment and human imperfection.This could be the reason for lower values of coefficientsin the experimental case.
ConclusionsThree different three-bladed Savonius wind turbine scalemodels with different overlap ratios (model 1, no over-lap; model 2, overlap ratio 0.12; and model 3, overlap ra-tio 0.26) were designed and fabricated for the currentstudy. Aerodynamic characteristics of these models wereexperimentally investigated using the subsonic wind tun-nel. Experimental investigation was performed at differ-ent Reynolds numbers. Numerical investigation was alsoperformed to determine torque and power coefficientsusing GAMBIT and FLUENT. The current study showsthat lower Reynolds number gave better Cq variationwith the increase of the angle of rotation for each model.Model 2 demonstrates better experimental Cq for allthree different wind speeds (9.66, 8.23, and 7.33 m/s).For model 1 with Re = 1.22 × 10⁵, model 2 with Re =1.19 × 10⁵, and model 3 with Re = 9.94 × 10⁴, the experi-mental Cp shows higher and positive values compared toother Reynolds numbers. Model 2 shows the better ex-perimental Cp at wind speeds of 9.66 and 8.23 m/s.However, for wind speed 7.33 m/s, model 1 shows thebetter Cp. Power coefficient calculated from the numer-ical method shows that it is always increasing with the
0.16)
Numerical Cp
Exp Cp at 0 Angle
Exp Cp at 30 Angle
Exp Cp at 60 Angle
Exp Cp at 90 Angle

Morshed et al. International Journal of Energy and Environmental Engineering 2013, 4:18 Page 14 of 14http://www.journal-ijeee.com/content/4/1/18
increase of tip speed ratio. For model 1, numericalpower coefficient matches well with the correspondingexperimental values at 0° rotor position.
Abbreviationsa: overlap distance between two adjacent blades (mm); A: rotor area (m2);AR: aspect ratio; Cn: normal drag coefficient; Cp: power coefficient; Cq: torquecoefficient; Ct: tangential drag coefficient; d: blade diameter (mm); D: overallrotor diameter (mm); Fn: normal drag force (N); Ft: tangential drag force (N);H: rotor height (mm); k: turbulence kinetic energy; N: rotational speed (rpm);OR: overlap ratio: ratio of overlap distance between two adjacent blades androtor diameter (OR = a / D); P: power (W); Re: Reynolds number; T: torque(N.m); V: wind velocity (m/s); ν: kinematic viscosity (m2/s); ρ: air density(kg/m3); θ: angle of rotation (°); Φ: angular position of the pressure tappingpoints on three blades (°); ω: angular velocity (rad/s); λ: tip speed ratio;Δp: pressure difference (Pa); ε: turbulence dissipation rate.
Competing interestsThe authors declare that they have no competing interests.
Authors' contributionsKNM carried out both experimental and computational investigations on theperformance improvement of the three-bladed Savonius wind turbine withvarying overlap ratios under the supervision of MR. GM and MA were also inthe research group who gave their inputs time to time. All authors havetheir contributions in different percentages in developing the manuscript ofthis paper. All authors read and approved the final manuscript.
AcknowledgmentsThe authors acknowledge the funding and facility support from theMechanical Engineering Department of Georgia Southern University. Theywould also like to thank Mr. Andrew Michaud for helping in fabricatingdifferent Savonius wind turbine models.
Author details1Mechanical Engineering Department, Colorado State University, Fort Collins,CO 80523, USA. 2Mechanical Engineering Department, Georgia SouthernUniversity, Statesboro, GA 30460, USA. 3Biochemistry, Chemistry & Physics,Southern Arkansas University, Magnolia, AR 71753, USA.
Received: 18 September 2012 Accepted: 8 March 2013Published: 18 April 2013
References1. Hayashi, T, Li, Y, Hara, Y, Suzuki, K: Wind tunnel test on a three stage out
phase Savonius rotor. JSME International Journal 48(1), 9–16 (2005)2. Diaz, F, Gavalda, J, Massons, J: Drag and lift coefficients of the Savonius
wind machine. J. Wind. Eng. 1991(15), 240–246 (1991)3. Sawada, T, Nahamura, M, Kamada, S: Blade force measurement and flow
visualization of Savonius rotors. Bulletin of JSME 29, 2095–2100 (1986)4. Aldoss, TK, Obeidat, KM: Performance analysis of two Savonius rotors
running side by side using the discrete vortex method. Wind. Eng.11, 79–88 (1987)
5. Fujisawa, N, Gotoh, F: Experimental study on the aerodynamic performanceof a Savonius rotor. ASME J Sol Energ Eng 116, 148–152 (1994)
6. Rahman, M, Islam, MQ, Islam, AKMS: Prediction of dynamic characteristics ofa three bladed Savonius rotor. In: Proceeding of the third internationalconference on fluid mechanics and heat transfer. Dhaka, Bangladesh.15–16 December 1999
7. Rahman, M: Torque and drag characteristics of a three bladed Savoniusrotor. Mechanical Engineering Department, Bangladesh University ofEngineering and Technology, Bangladesh (1999). M.Sc. thesis
8. Rahman, M, Islam, MQ, Islam, AKMS: Aerodynamic characteristics of a threebladed Savonius rotor. In: Proceeding of the 2nd international seminar onrenewable energy for poverty alleviation. IEB, Bangladesh. 26–27November 1999
9. Rahman, M, Morshed, KN, Lewis, J, Fullar, M: Experimental and numericalinvestigations on drag and torque characteristics of three-bladed Savoniuswind turbine. In: Proceedings of 2009 ASME International MechanicalEngineering Congress and Exposition (IMECE 2009). Lake Buena Vista,Orlando. 13–19 November 2009
10. Gupta, R, Biswas, A, Sharma, KK: Comparative study of a three bucketSavonius rotor with a combined three-bucket Savonius–three-bladedDarrieus rotor. Renew Energy 33, 1974–1981 (2008)
11. Altan, BD, Atilgan, M, Ozdamar, A: An experimental study on improvementof a Savonius rotor performance with curtaining. Exp. Therm. Fluid. Sci.32, 1673–1678 (2008)
12. Sargolzaei, J, Kianifar, A: Modeling and simulation of wind turbine Savoniusrotor using artificial neural networks for estimation of the power ratio andtorque. Simulat. Model Pract. Theor. 17, 1290–1298 (2009)
13. Altan, BD, Atilgan, M: An experimental and numerical study on theimprovement of the performance of Savonius wind rotor. Energ. Convers.Manag. 49, 3425–3432 (2008)
14. Saha, UK, Thotla, S, Maity, D: Optimum design configuration of Savoniusrotor through wind tunnel experiment. J. Wind. Eng. Ind. Aerod.96, 1359–1375 (2008)
15. Kamoji, MA, Kedare, SB: Wind tunnel tests on a single stage helical Savoniusrotor. In: 5th AIAA International Energy Conversion Engineering Conference.St. Louis, Missouri. 25–28 June 2007
16. Gupta, R, Das, R, Gautam, R, Deka, SS: CFD analysis of a two bucket Savoniusrotor for various overlap conditions. ISESCO J. Sci. Tech. 8(13), 67–74 (2012)
17. Qasim, AY, Usubamatov, R, Zain, ZM: Investagation and design impeller typevertical axis wind turbine. Australian J Basic Appl Sci 5(12), 121–126 (2011)
18. Ghatage, SV, Jyeshtharaj, BJ: Optimisation of vertical axis wind turbine: CFDsimulations and experimental measurements. Can. J. Chem. Eng.90, 1186–1201 (2012)
19. Kumbernuss, J, Chen, J, Yang, HX, Lu, L: Investigation into the relationship ofthe overlap ratio and shift angle of double stage three bladed vertical axiswind turbine (VAWT). J. Wind Eng. Ind. Aerod. 107, 57–75 (2012)
20. Carrigan, TJ, Brian, HD, Zhen, XH, Bo, PW: Aerodynamic shape optimizationof a vertical-axis wind turbine using differential evolution. InternationalScholarly Research Network ISRN Renewable Energy 2012, 1–16 (2012)
21. Morshed, KN: Experimental and numerical investigations on aerodynamiccharacteristics of Savonius wind turbine with various overlap ratios. GeorgiaSouthern University (2010). M.S. thesis
22. Pinkerton, RB: Calculated and measured pressure distribution over themidspan section of the NACA 4412 airfoil. NACA report no.563, 365–380 (1936)
23. Patankar, SV: Numerical Heat Transfer and Fluid Flow. HemispherePublishing Corporation, Washington, D.C. (1980)
24. Launder, BE, Spalding, DB: Lectures in Mathematical Models of Turbulence.Academic Press, London (1972)
doi:10.1186/2251-6832-4-18Cite this article as: Morshed et al.: Wind tunnel testing and numericalsimulation on aerodynamic performance of a three-bladed Savoniuswind turbine. International Journal of Energy and Environmental Engineering2013 4:18.
Submit your manuscript to a journal and benefi t from:
7 Convenient online submission
7 Rigorous peer review
7 Immediate publication on acceptance
7 Open access: articles freely available online
7 High visibility within the fi eld
7 Retaining the copyright to your article
Submit your next manuscript at 7 springeropen.com