Original Research Mineral Constituents of Edible Field ... Constituents of.pdfmushroom (Macrolepiota...
16
Introduction Fungi play a key role in the transfer of metals from the lithosphere into the biosphere. Within the bio- diverse world, mushrooms are the important groups that constitute edible and medicinal mushrooms. Most of the estimated 2,000 species of edible wild mushrooms that grow worldwide are poorly characterized with respect to their composition and multi-mineral constituents as well as their bio-accessibility, while such information is completely absent for numerous species. In the studies of metallic elements and metalloids in mushrooms, the pertinent question is the unraveling of the qualitative and quantitative interrelationships between the elements/ Pol. J. Environ. Stud. Vol. 25, No. 6 (2016), 2445-2460 Original Research Mineral Constituents of Edible Field Parasol (Macrolepiota procera) Mushrooms and the Underlying Substrate from Upland Regions of Poland: Bioconcentration Potential, Intake Benefits, and Toxicological Risk Anna K. Kojta 1 *, Magdalena Gucia 1 , Grażyna Krasińska 1 , Martyna Saba 1 , Innocent C. Nnorom 2 , Jerzy Falandysz 1 1 Gdańsk University, 63 Wita Stwosza Str., 80-308 Gdańsk, Poland 2 Abia State University, Uturu, Abia State, Nigeria Received: 20 January 2016 Accepted: 5 May 2016 Abstract This paper presents analytical and scientific monitoring data on the bioconcentration potential of trace elements and mineral compounds in Macrolepiota procera collected from background areas in upland regions of central Poland. The contents of Ag, Al, Ba, Ca, Cd, Co, Cr, Cu, Fe, K, Mg, Mn, Na, Pb, Rb, Sr, and Zn in caps and stipes (99 specimens) and underlying soil substrates were examined by ICP-OES and Hg by CV-AAS after wet digestion. The results showed that M. procera is a rich source of especially Ca, Cu, Fe, K, Mg, Mn, Na, and Zn. The contents of Pb, Hg, Ag, and Cd in the caps were 1.7±0.6 to 5.9±1.7, 1.8±0.8 to 5.3±0.8, 1.2±0.7 to 16±7, and 0.56±0.13 to 4.9±5.4 mg kg -1 dry matter, respectively. Probable dietary intake assessment showed that occasional consumption (once a week) of Macrolepiota procera caps could be safe, while consumption more than once a week could provide doses of toxic metals that exceed the provisionally allowed daily intake limits for humans. Keywords: foods, mushrooms, heavy metals, minerals, Macrolepiota procera *e-mail:[email protected] DOI: 10.15244/pjoes/62997
Transcript of Original Research Mineral Constituents of Edible Field ... Constituents of.pdfmushroom (Macrolepiota...
Introduction
Fungi play a key role in the transfer of metals from the lithosphere into the biosphere. Within the bio-diverse world, mushrooms are the important groups that
constitute edible and medicinal mushrooms. Most of the estimated 2,000 species of edible wild mushrooms that grow worldwide are poorly characterized with respect to their composition and multi-mineral constituents as well as their bio-accessibility, while such information is completely absent for numerous species. In the studies of metallic elements and metalloids in mushrooms, the pertinent question is the unraveling of the qualitative and quantitative interrelationships between the elements/
Pol. J. Environ. Stud. Vol. 25, No. 6 (2016), 2445-2460
Original Research
Mineral Constituents of Edible Field Parasol (Macrolepiota procera) Mushrooms and
the Underlying Substrate from Upland Regions of Poland: Bioconcentration Potential, Intake Benefits, and Toxicological Risk
Anna K. Kojta1*, Magdalena Gucia1, Grażyna Krasińska1, Martyna Saba1, Innocent C. Nnorom2, Jerzy Falandysz1
1Gdańsk University, 63 Wita Stwosza Str., 80-308 Gdańsk, Poland2Abia State University, Uturu, Abia State, Nigeria
Received: 20 January 2016Accepted: 5 May 2016
Abstract
This paper presents analytical and scientific monitoring data on the bioconcentration potential of trace elements and mineral compounds in Macrolepiota procera collected from background areas in upland regions of central Poland. The contents of Ag, Al, Ba, Ca, Cd, Co, Cr, Cu, Fe, K, Mg, Mn, Na, Pb, Rb, Sr, and Zn in caps and stipes (99 specimens) and underlying soil substrates were examined by ICP-OES and Hg by CV-AAS after wet digestion. The results showed that M. procera is a rich source of especially Ca, Cu, Fe, K, Mg, Mn, Na, and Zn. The contents of Pb, Hg, Ag, and Cd in the caps were 1.7±0.6 to 5.9±1.7, 1.8±0.8 to 5.3±0.8, 1.2±0.7 to 16±7, and 0.56±0.13 to 4.9±5.4 mg kg-1 dry matter, respectively. Probable dietary intake assessment showed that occasional consumption (once a week) of Macrolepiota procera caps could be safe, while consumption more than once a week could provide doses of toxic metals that exceed the provisionally allowed daily intake limits for humans.
Keywords: foods, mushrooms, heavy metals, minerals, Macrolepiota procera
*e-mail:[email protected]
DOI: 10.15244/pjoes/62997
2446 Kojta A.K., et al.
compounds sequestered in the fruiting bodies from the soil or other substratum on which the mycelium develops [1-5].
Mushrooming is a global gourmet heritage practiced by both rural inhabitants and city dwellers. Nevertheless, sufficient knowledge of the composition and mineral constituents of many edible wild mushrooms available for picking is lacking [6-7]. Consequently, it has become common for only several of the well recognizable species to be collected and consumed. The few figures available on the annual intake rates of wild mushrooms shows that the average consumption varies by country: from 1.0 kg per capita in Sweden to 10 kg for fanciers in the Czech Republic, and as much as 20-24 kg per capita in the Liangshan Yi nationality in China. The portion of mushrooms in a single meal is usually 300 g (fresh weight), but this could sometimes be as much as 500 g [8]. Edible wild as well as cultivated mushrooms are highly popular among vegetarians and vegans.
In Poland, under a regulation issued by the Minister of Public Health and Welfare, 42 mushrooms can be purchased commercially, and these are readily available through retail sales. M. procera (common name field parasol or parasol mushroom) is on this ministerial list [9].
Edible wild mushrooms on sale in Poland are dominated by three groups or species, i.e.: • Boletus spp., or the bay bolete (Imleria badia)• Yellow-cracked bolete (Boletus subtomentosus) and
golden bolete (Xerocomellus chrysenteron); Boletus spp., and in majority the king bolete (Boletus edulis)
• Common chanterelle (Cantharellus cibarius) [10]Mushrooms, especially wild grown mushrooms and
the edible species in particular, have been reported to be rich in mineral constituents as well as in some toxic metals [11-16]. As such, mushroom studies have shown that some mushroom species are rich sources of essential trace elements. Mycelium can have a species-specific ability to absorb and trans-locate metallic elements or metalloids from the mushroom substrate into the mushroom fruiting body. This is because of the specific physiological requirement of some mushroom species that can be impacted by geogenic factors, e.g., low stable Cs (133Cs) and low-radio Cs (137Cs), or relatively high stable Sr and relatively high-radio Sr (90Sr) [17-19], while the reason for metals absorption is note completely elucidated. A well-known example of a hyperaccumulator is the fly agaric (Amanita muscaria), which readily bioaccumulates vanadium found in the metalorganic compound amavadine [20]. A typical example of a mushroom species rich in As is the amethyst deceiver (Laccaria amethystina), which contains dimethylarsinic acid, methylarsonic acid, trimethylarsine oxide, arsenic acid, and arsenobetaine [21-22]. Albatrellus and Boletus mushrooms are rich in Se, while for some of the Boletus mushrooms in particular, several seleno-compounds have been identified [23]. Some mushrooms are rich in Ag, while many species are able to efficiently bioaccumulate Ag [24-27]. King bolete (Boletus edulis), bay bolete (Imleria badia), Amanita spp. (A. crocea, A. muscaria, A. submembranacea), and
some other species can accumulate Ag in large amounts when they emerge at Ag-contaminated sites (e.g., a Au/Cu mine dump or Ag-rich galena smelting [11, 28]), while the species Amanita strobiliformis is a hyper-accumulator of Ag [29].
Similarly, Hg is efficiently bio-concentrated by numerous mushrooms, and many species are relatively abundant in mercury even at uncontaminated sites where the Hg content of the substrate/soil on which the mushroom is growing is very low [30-39]. For instance, the reported mean BCF (the ratio of the content of the element in the cap or stipe to its content in the soil) for the caps of M. procera varied from 16±6 to 220±110 (range 0.52 to 470) and that for B. edulis varied from 41±6 to 130±39 (range 13 and 170) [13, 30, 32-34].
Mushrooms are also often rich in metals that are weakly bio-available or in metals that feature as “bio-excluded” by mycelium, but which are abundant in the top layer of soils. Typical examples of this are Al, Ca, or Fe [12]. Cadmium, chromium, mercury, lead, copper, and zinc are the heavy metals most frequently studied in wild mushrooms [40-45]. There is scarcity of data on mineral composition of the same mushroom species that emerged at geographically distant places that have different soil bedrock geochemistry and environment [46-48].
The aim of this study is to examine the contents of Ag, Al, Ba, Ca, Cd, Co, Cr, Cu, Fe, Hg, K, Mg, Mn, Na, Ni, Pb, Rb, Sr, and Zn in widely consumed M. procera, and the soil substrates beneath the mushrooms that were collected from southern and central parts of Poland, and also to assess the mineral interrelationships and bioconcentration potentials of this species. The nutritional benefits and toxicological risk of the minerals determined in M. procera are also discussed.
Materials and Methods
Sampling
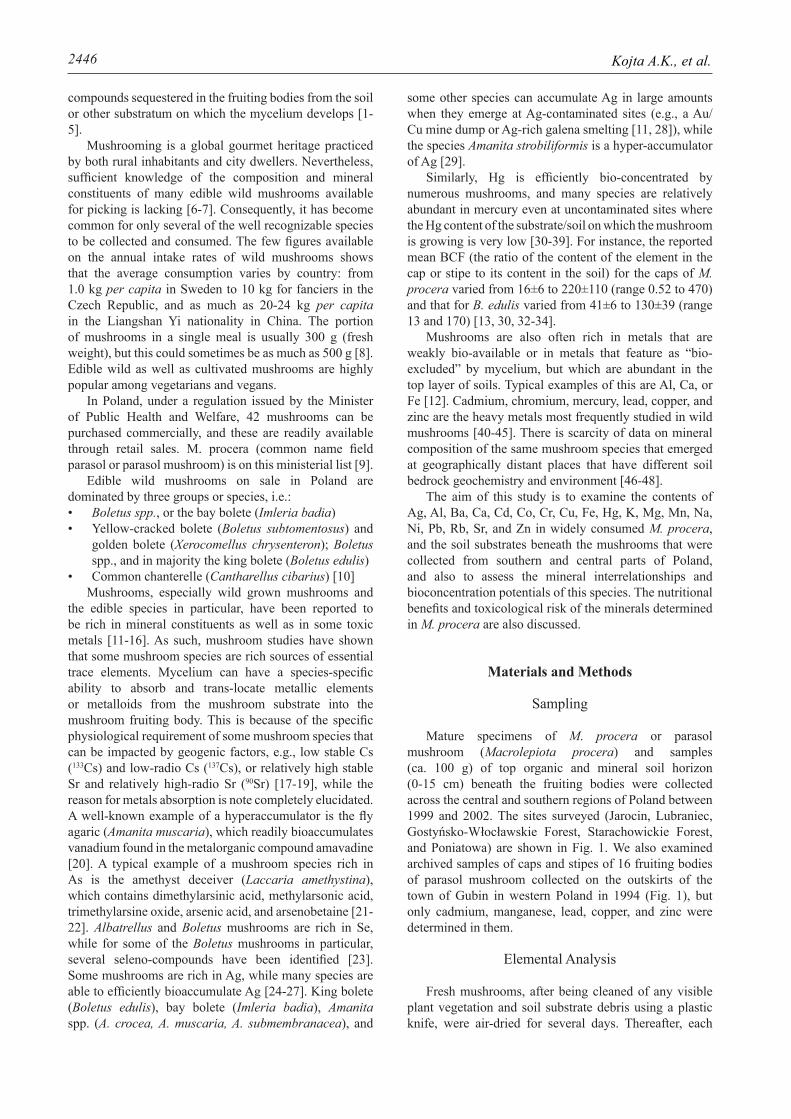
Mature specimens of M. procera or parasol mushroom (Macrolepiota procera) and samples (ca. 100 g) of top organic and mineral soil horizon (0-15 cm) beneath the fruiting bodies were collected across the central and southern regions of Poland between 1999 and 2002. The sites surveyed (Jarocin, Lubraniec, Gostyńsko-Włocławskie Forest, Starachowickie Forest, and Poniatowa) are shown in Fig. 1. We also examined archived samples of caps and stipes of 16 fruiting bodies of parasol mushroom collected on the outskirts of the town of Gubin in western Poland in 1994 (Fig. 1), but only cadmium, manganese, lead, copper, and zinc were determined in them.
Elemental Analysis
Fresh mushrooms, after being cleaned of any visible plant vegetation and soil substrate debris using a plastic knife, were air-dried for several days. Thereafter, each
2447Mineral Constituents of Edible...
sample of the fruiting body was separated into two parts – the cap and the stipe – and dried at 65ºC to constant weight. Dried mushroom parts were pulverized in an agate mortar and kept in brand new sealed polyethylene bags under dry conditions. The pulverized sub-samples (400 mg) of caps and stipes were weighed into pressure-resistant and analytical quality pro-digestive vessels made of polytetrafluoroethylene (PTFE). The fungal materials were pre-digested for 24 hours with concentrated nitric acid (65%; Suprapure, Merck; 7 mL) at room temperature and further digested under pressure in a MARS 5 (CEM Corp. Matthews, NC, USA) automatic microwave digestion system. The digest, after the addition of an internal standard (yttrium), was diluted to 25 mL using deionized water and subjected to instrumental analysis [49-50].
The soils were air dried at room temperature under clean conditions for several weeks and next sieved through a pore size of 2 mm and further dried in an electric oven at 40ºC to constant weight. Next, the soil sub-samples (0.5 g) were cold-treated with 20% nitric acid solution (20 mL) for 24 hours in quartz vessels [49-50]. Furthermroe, after the addition of deionized water (10 mL), the extract was filtered through Whatmann No. 42 filter paper into a polyethylene bottle. After the addition of internal standard (yttrium), the extract was diluted to 50 mL using deionized water and thereafter subjected to instrumental analysis.
The trace elements (Ag, Al, Ba, Ca, Cd, Co, Cu, Cr, Fe, K, Mg, Mn, Na, Ni, Pb, Rb, Sr, and Zn) were determined by inductively coupled plasma-optical emission spectroscopy (ICP-OES; Optima 2000 DV, Perkin-Elmer, USA) [49-50] and Hg by cold vapor atomic absorption spectrometry (CV-AAS; Mercury analyzer type MA-2000, Nippon Instruments Corporation, Takatsuki, Japan) [51].
Quality Control/Quality Assurance
These methods of metallic element measurements were validated and controlled on several occasions by the analyses of officially certified reference materials: IAEA 359 cabbage leaves from the International Atomic Energy Agency, and from participation in international calibration trials such as the GESM/Food Euro proficiency testing exercise, the IAEA-338 Proficiency Test of Trace Elements in Lichen, the Aquacon Project 9 Soil Analysis (European Commission Environment Institute), and Oriental tobacco leaves (CTA-OTL-1), tea leaves (INTC-TL-1), and Polish herbal blend (INCT-MPH-2) by the Institute of Nuclear Chemistry and Technology in Warsaw, Poland [49-50]. Discrepancies between certified values and contents quantified were below 10%. Duplicates and blanks followed with every set of 10 mushroom or soil samples examined. For blank samples no major interferences were found for the elements quantified.
Limits of detection for Al, Ba, Ca, Cd, Co, Cu, Cr, Fe, K, Mg, Mn, Na, Ni, Pb, Rb, Sr, and Zn were between 0.01-0.10 mg kg-1 dry matter (dm), and 0.005 mg kg-1 dm for Hg. Coefficients of variation for these measurements on routine runs were well below 10%.
Multivariate Analysis
All data produced were statistically treated to find possible statistically significant differences between the variables of the Mann-Whitney U test, principal component analysis (PCA), and cluster analysis (CA) (Figs 2-4, Tables 2 and 3) [41]. The computer software package Statistica version 8.0 was used for statistical analysis of data.
Fig. 1. Location of the sampling sites of field parasol. Abbreviations: Gubin (1), Jarocin (2), Lubraniec (3), Gostyń-sko-Włocławskie Forest (4), Starchowickie Forest (5), and Po-niatowa (6).
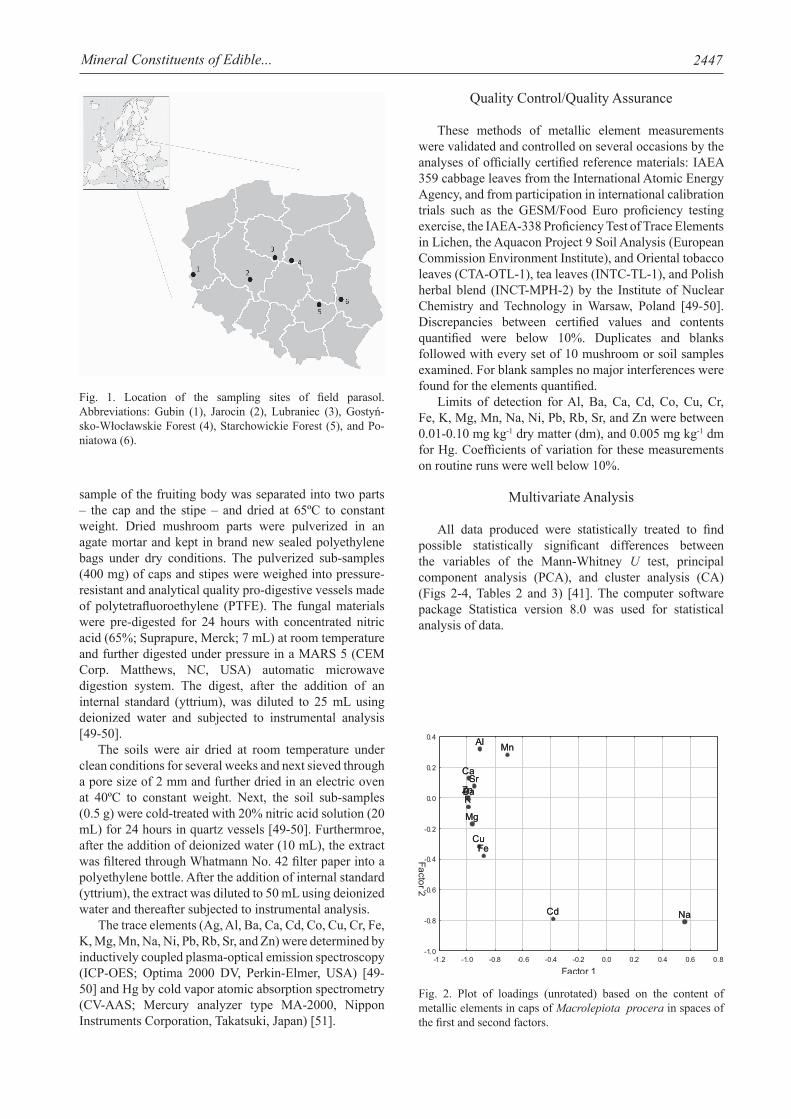
Fig. 2. Plot of loadings (unrotated) based on the content of metallic elements in caps of Macrolepiota procera in spaces of the first and second factors.
2448 Kojta A.K., et al.
Results and Discussion
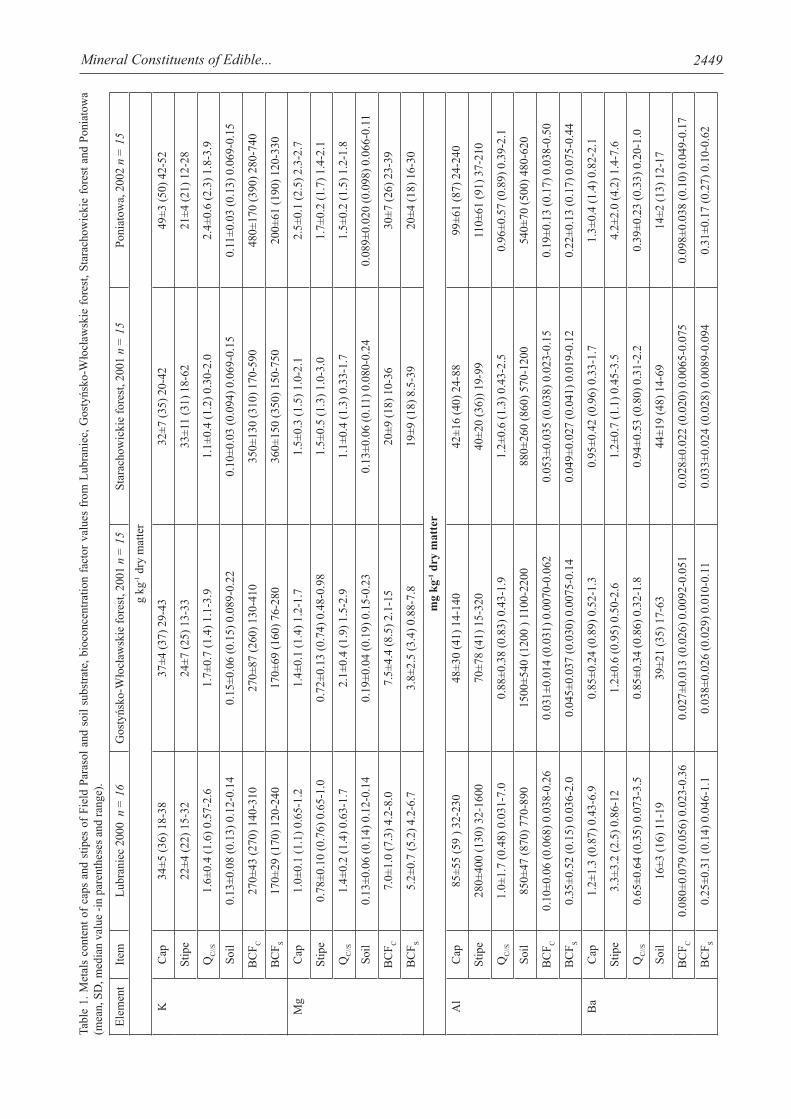
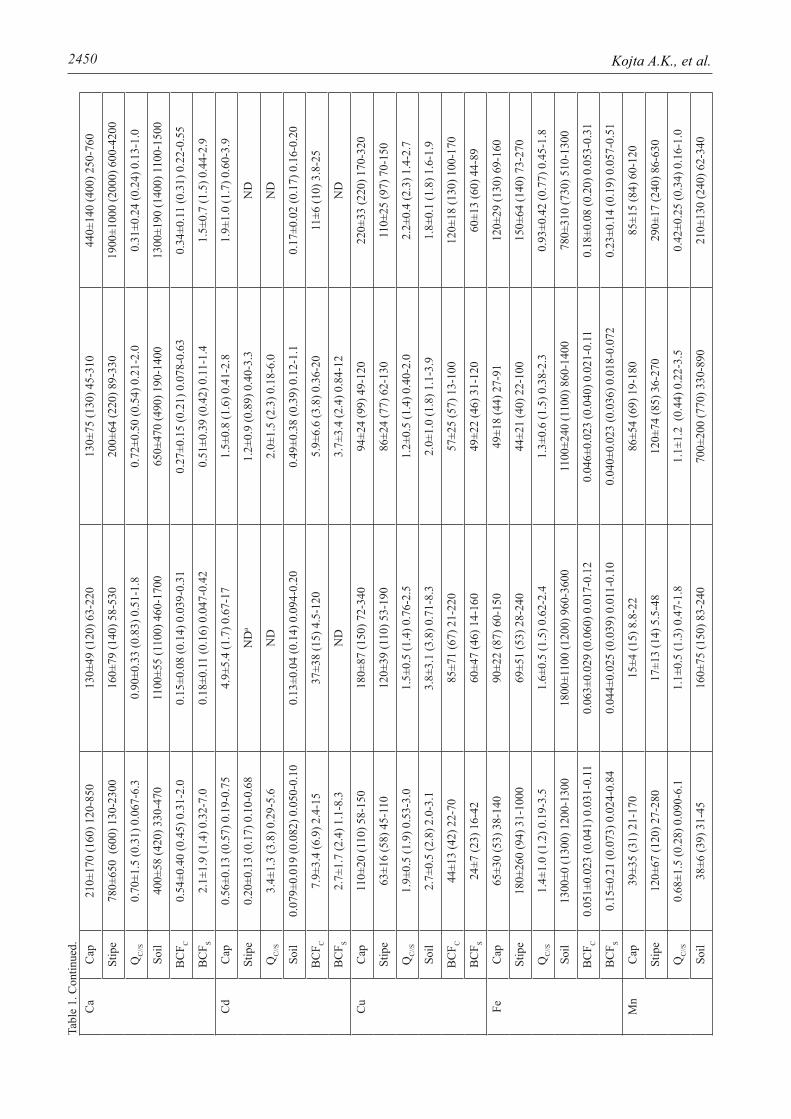
The metal contents in caps and stipes of M. procera and the soils as well as the values of the quotient of metal contents in cap to stipe (QC/S) and in cap or stipe to contents in soil substratum (BCF, or bioconcentration factor) are given in Table 1 and in Annexes 1 and 2. These data are for 99 specimens of M. procera m collected from six geographically distant regions of central, southwest,
and southeast Poland. Some metallic elements in this study were determined in mushrooms and soils collected in one (Rb), two (Co, Cr, Hg, Pb), three (Ag), or four to six sites (other metals), respectively (Annexes 1 and 2).
Essential Metals: Major Minerals (K, Mg, Ca)
Among the essential macro-elements determined, potassium (K) was found in highest amounts in M. procera. Depending on the site, K content varied between 32,000±7,000 and 49,000±3,000 (total range 18,000-52,000) mg kg-1 dm. The caps were on average about two-fold richer in K than the stipes. Potassium content of caps and stipes as well as the value of QC/S for this metal varied significantly between the sampling sets (year of collection) of mushrooms (p < 0.05; Mann-Whitney U test; Table 1). M. procera is characterized by a high potential to bioconcentrate potassium. The BCF (also called enrichment or transfer factor) of K ranged from 140 to 740 for caps and from 76-750 for stipes of 88 specimens collected from four of the sites surveyed. BCF is a unitless parameter and is calculated as a quotient of the content of the metal determined in the fruiting body or its morphological part in relation to metal content of the substratum in which the mycelium lives (soil, wood, compost). All analytical data are expressed on a dry-weight basis. The mean K content of the soil substratum to M. procera varied between 0.10±0.03 and 0.15±0.06 mg kg-1 dm.
Potassium content in caps of M. procera is followed by Mg and then Ca. Mean magnesium contents in caps of four sites varied from 1,000±100 to 2,500±100 (range 650-2,700) mg kg-1 dm, while the mean Ca content varied between 130±75 and 440±140 (range 63-850) mg kg-1 dm (Table 1). Calcium is usually more abundant in stipes than in caps of this fungus, while Mg is usually more in the caps (Table 1). As in the case of K, the contents of Mg and Ca in M. procera varied statistically, depending on the sites surveyed (0.05<p<0.01; Mann-Whitney U test). The contents of magnesium in soil (substratum to Parasol Mushroom fruiting bodies) varied from 89±20 to 190±40; and Ca from 400±58 to 1,300±190 mg kg-1 dm. Up-take of Mg and Ca by M. procera, when assessed from the BCF values, decreased as content of Mg and Ca in topsoil increased. Nevertheless, the relatively high contents of Mg and Ca in the soils – in spite of the lower availability or regulated up-take by the mushroom – resulted in the abundance of these metals in the fruiting bodies, as noted for Gostyńsko-Włocławskie Forest (Mg) and the Poniatowa site (Ca) (Table 1).
Essential Metals: Trace Constituents (Zn, Cu, Fe, Mn, Na, Cr, Co)
Among Zn, Cu, Fe, Mn, Na, Cr, and Co, which are essential to mammals, some of them (Zn, Cu, Fe, Mn, and Na) are also essential to fungi [52]. These five metals were determined in the caps in contents ranging from 10±7 mg kg-1 dm (Na) to 640±36 mg kg-1 dm (Zn), while Cr and Co
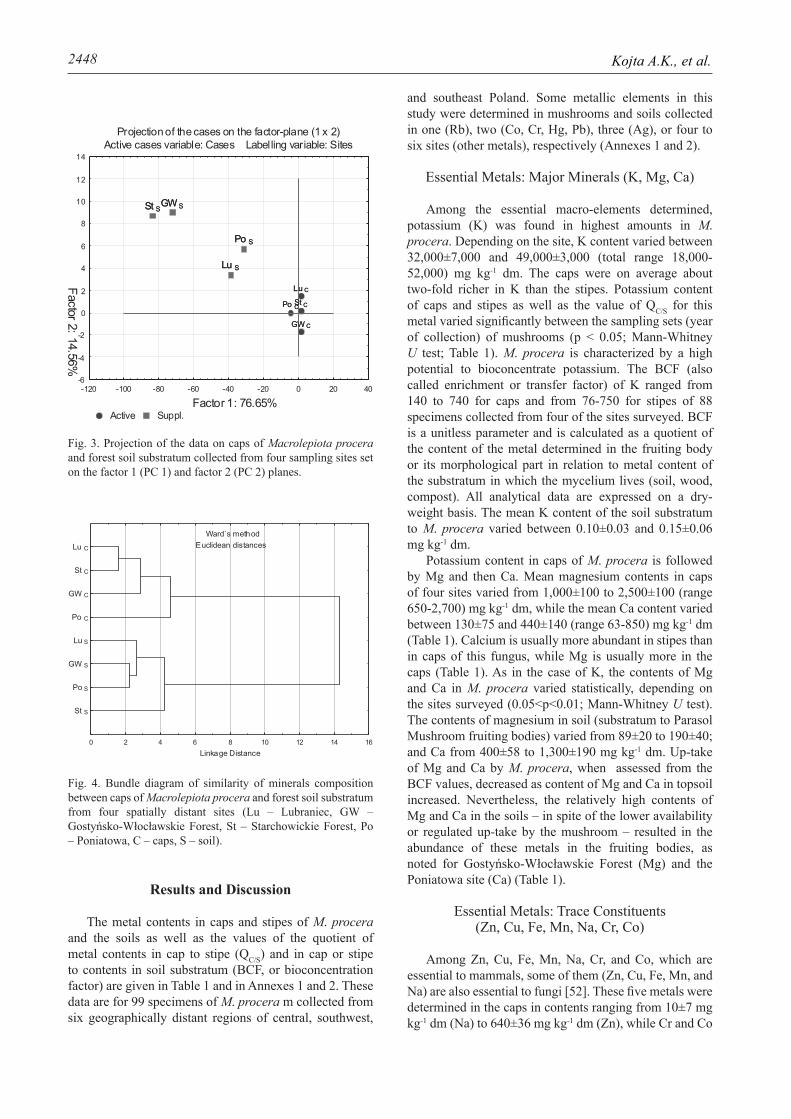
Fig. 3. Projection of the data on caps of Macrolepiota procera and forest soil substratum collected from four sampling sites set on the factor 1 (PC 1) and factor 2 (PC 2) planes.
Fig. 4. Bundle diagram of similarity of minerals composition between caps of Macrolepiota procera and forest soil substratum from four spatially distant sites (Lu – Lubraniec, GW – Gostyńsko-Włocławskie Forest, St – Starchowickie Forest, Po – Poniatowa, C – caps, S – soil).
2449Mineral Constituents of Edible...
Elem
ent
Item
Lubr
anie
c 20
00 n
= 1
6G
osty
ńsko
-Wło
cław
skie
fore
st, 2
001
n =
15
Star
acho
wic
kie
fore
st, 2
001
n =
15
Poni
atow
a, 2
002
n =
15
g kg
-1 d
ry m
atte
r
KC
ap34
±5 (3
6) 1
8-38
37±4
(37)
29-
4332
±7 (3
5) 2
0-42
49±3
(50)
42-
52
Stip
e22
±4 (2
2) 1
5-32
24±7
(25)
13-
3333
±11
(31)
18-
6221
±4 (2
1) 1
2-28
QC
//S1.
6±0.
4 (1
.6) 0
.57-
2.6
1.7±
0.7
(1.4
) 1.1
-3.9
1.1±
0.4
(1.2
) 0.3
0-2.
02.
4±0.
6 (2
.3) 1
.8-3
.9
Soil
0.13
±0.0
8 (0
.13)
0.1
2-0.
140.
15±0
.06
(0.1
5) 0
.089
-0.2
20.
10±0
.03
(0.0
94) 0
.069
-0.1
50.
11±0
.03
(0.1
3) 0
.069
-0.1
5
BC
F C27
0±43
(270
) 140
-310
270±
87 (2
60) 1
30-4
1035
0±13
0 (3
10) 1
70-5
9048
0±17
0 (3
90) 2
80-7
40
BC
F S17
0±29
(170
) 120
-240
170±
69 (1
60) 7
6-28
036
0±15
0 (3
50) 1
50-7
5020
0±61
(190
) 120
-330
Mg
Cap
1.0±
0.1
(1.1
) 0.6
5-1.
21.
4±0.
1 (1
.4) 1
.2-1
.71.
5±0.
3 (1
.5) 1
.0-2
.12.
5±0.
1 (2
.5) 2
.3-2
.7
Stip
e0.
78±0
.10
(0.7
6) 0
.65-
1.0
0.72
±0.1
3 (0
.74)
0.4
8-0.
981.
5±0.
5 (1
.3) 1
.0-3
.01.
7±0.
2 (1
.7) 1
.4-2
.1
QC
//S1.
4±0.
2 (1
.4) 0
.63-
1.7
2.1±
0.4
(1.9
) 1.5
-2.9
1.1±
0.4
(1.3
) 0.3
3-1.
71.
5±0.
2 (1
.5) 1
.2-1
.8
Soil
0.13
±0.0
6 (0
.14)
0.1
2-0.
140.
19±0
.04
(0.1
9) 0
.15-
0.23
0.13
±0.0
6 (0
.11)
0.0
80-0
.24
0.08
9±0.
020
(0.0
98) 0
.066
-0.1
1
BC
F C7.
0±1.
0 (7
.3) 4
.2-8
.07.
5±4.
4 (8
.5) 2
.1-1
520
±9 (1
8) 1
0-36
30±7
(26)
23-
39
BC
F S5.
2±0.
7 (5
.2) 4
.2-6
.73.
8±2.
5 (3
.4) 0
.88-
7.8
19±9
(18)
8.5
-39
20±4
(18)
16-
30
mg
kg-1 d
ry m
atte
r
Al
Cap
85±5
5 (5
9 ) 3
2-23
048
±30
(41)
14-
140
42±1
6 (4
0) 2
4-88
99±6
1 (8
7) 2
4-24
0
Stip
e28
0±40
0 (1
30) 3
2-16
0070
±78
(41)
15-
320
40±2
0 (3
6)) 1
9-99
110±
61 (9
1) 3
7-21
0
QC
//S1.
0±1.
7 (0
.48)
0.0
31-7
.00.
88±0
.38
(0.8
3) 0
.43-
1.9
1.2±
0.6
(1.3
) 0.4
3-2.
50.
96±0
.57
(0.8
9) 0
.39-
2.1
Soil
850±
47 (8
70) 7
70-8
9015
00±5
40 (1
200
) 110
0-22
0088
0±26
0 (8
60) 5
70-1
200
540±
70 (5
00) 4
80-6
20
BC
F C0.
10±0
.06
(0.0
68) 0
.038
-0.2
60.
031±
0.01
4 (0
.031
) 0.0
070-
0.06
20.
053±
0.03
5 (0
.038
) 0.0
23-0
.15
0.19
±0.1
3 (0
.17)
0.0
38-0
.50
BC
F S0.
35±0
.52
(0.1
5) 0
.036
-2.0
0.04
5±0.
037
(0.0
30) 0
.007
5-0.
140.
049±
0.02
7 (0
.041
) 0.0
19-0
.12
0.22
±0.1
3 (0
.17)
0.0
75-0
.44
Ba
Cap
1.2±
1.3
(0.8
7) 0
.43-
6.9
0.85
±0.2
4 (0
.89)
0.5
2-1.
30.
95±0
.42
(0.9
6) 0
.33-
1.7
1.3±
0.4
(1.4
) 0.8
2-2.
1
Stip
e3.
3±3.
2 (2
.5) 0
.86-
121.
2±0.
6 (0
.95)
0.5
0-2.
61.
2±0.
7 (1
.1) 0
.45-
3.5
4.2±
2.0
(4.2
) 1.4
-7.6
QC
//S0.
65±0
.64
(0.3
5) 0
.073
-3.5
0.85
±0.3
4 (0
.86)
0.3
2-1.
80.
94±0
.53
(0.8
0) 0
.31-
2.2
0.39
±0.2
3 (0
.33)
0.2
0-1.
0
Soil
16±3
(16)
11-
1939
±21
(35)
17-
6344
±19
(48)
14-
6914
±2 (1
3) 1
2-17
BC
F C0.
080±
0.07
9 (0
.056
) 0.0
23-0
.36
0.02
7±0.
013
(0.0
26) 0
.009
2-0.
051
0.02
8±0.
022
(0.0
20) 0
.006
5-0.
075
0.09
8±0.
038
(0.1
0) 0
.049
-0.1
7
BC
F S0.
25±0
.31
(0.1
4) 0
.046
-1.1
0.03
8±0.
026
(0.0
29) 0
.010
-0.1
10.
033±
0.02
4 (0
.028
) 0.0
089-
0.09
40.
31±0
.17
(0.2
7) 0
.10-
0.62
Tabl
e 1.
Met
als
cont
ent o
f cap
s an
d st
ipes
of F
ield
Par
asol
and
soi
l sub
stra
te, b
ioco
ncen
tratio
n fa
ctor
val
ues
from
Lub
rani
ec, G
osty
ńsko
-Wło
cław
skie
fore
st, S
tara
chow
icki
e fo
rest
and
Pon
iato
wa
(mea
n, S
D, m
edia
n va
lue
-in p
aren
thes
es a
nd ra
nge)
.
2450 Kojta A.K., et al.Ta
ble
1. C
ontin
ued.
Ca
Cap
210±
170
(160
) 120
-850
130±
49 (1
20) 6
3-22
013
0±75
(130
) 45-
310
440±
140
(400
) 250
-760
Stip
e78
0±65
0 (6
00) 1
30-2
300
160±
79 (1
40) 5
8-53
020
0±64
(220
) 89-
330
1900
±100
0 (2
000)
600
-420
0
QC
//S0.
70±1
.5 (0
.31)
0.0
67-6
.30.
90±0
.33
(0.8
3) 0
.51-
1.8
0.72
±0.5
0 (0
.54)
0.2
1-2.
0 0.
31±0
.24
(0.2
4) 0
.13-
1.0
Soil
400±
58 (4
20) 3
30-4
7011
00±5
5 (1
100)
460
-170
065
0±47
0 (4
90) 1
90-1
400
1300
±190
(140
0) 1
100-
1500
BC
F C0.
54±0
.40
(0.4
5) 0
.31-
2.0
0.15
±0.0
8 (0
.14)
0.0
39-0
.31
0.27
±0.1
5 (0
.21)
0.0
78-0
.63
0.34
±0.1
1 (0
.31)
0.2
2-0.
55
BC
F S2.
1±1.
9 (1
.4) 0
.32-
7.0
0.18
±0.1
1 (0
.16)
0.0
47-0
.42
0.51
±0.3
9 (0
.42)
0.1
1-1.
41.
5±0.
7 (1
.5) 0
.44-
2.9
Cd
Cap
0.56
±0.1
3 (0
.57)
0.1
9-0.
754.
9±5.
4 (1
.7) 0
.67-
171.
5±0.
8 (1
.6) 0
.41-
2.8
1.9±
1.0
(1.7
) 0.6
0-3.
9
Stip
e0.
20±0
.13
(0.1
7) 0
.10-
0.68
ND
a1.
2±0.
9 (0
.89)
0.4
0-3.
3N
D
QC
//S3.
4±1.
3 (3
.8) 0
.29-
5.6
ND
2.0±
1.5
(2.3
) 0.1
8-6.
0N
D
Soil
0.07
9±0.
019
(0.0
82) 0
.050
-0.1
00.
13±0
.04
(0.1
4) 0
.094
-0.2
00.
49±0
.38
(0.3
9) 0
.12-
1.1
0.17
±0.0
2 (0
.17)
0.1
6-0.
20
BC
F C7.
9±3.
4 (6
.9) 2
.4-1
537
±38
(15)
4.5
-120
5.9±
6.6
(3.8
) 0.3
6-20
11±6
(10)
3.8
-25
BC
F S2.
7±1.
7 (2
.4) 1
.1-8
.3N
D3.
7±3.
4 (2
.4) 0
.84-
12N
D
Cu
Cap
110±
20 (1
10) 5
8-15
0 18
0±87
(150
) 72-
340
94±2
4 (9
9) 4
9-12
022
0±33
(220
) 170
-320
Stip
e63
±16
(58)
45-
110
120±
39 (1
10) 5
3-19
086
±24
(77)
62-
130
110±
25 (9
7) 7
0-15
0
QC
//S1.
9±0.
5 (1
.9) 0
.53-
3.0
1.5±
0.5
(1.4
) 0.7
6-2.
51.
2±0.
5 (1
.4) 0
.40-
2.0
2.2±
0.4
(2.3
) 1.4
-2.7
Soil
2.7±
0.5
(2.8
) 2.0
-3.1
3.8±
3.1
(3.8
) 0.7
1-8.
32.
0±1.
0 (1
.8) 1
.1-3
.91.
8±0.
1 (1
.8) 1
.6-1
.9
BC
F C44
±13
(42)
22-
7085
±71
(67)
21-
220
57±2
5 (5
7) 1
3-10
012
0±18
(130
) 100
-170
BC
F S24
±7 (2
3) 1
6-42
60±4
7 (4
6) 1
4-16
049
±22
(46)
31-
120
60±1
3 (6
0) 4
4-89
FeC
ap65
±30
(53)
38-
140
90±2
2 (8
7) 6
0-15
049
±18
(44)
27-
9112
0±29
(130
) 69-
160
Stip
e18
0±26
0 (9
4) 3
1-10
0069
±51
(53)
28-
240
44±2
1 (4
0) 2
2-10
015
0±64
(140
) 73-
270
QC
//S1.
4±1.
0 (1
.2) 0
.19-
3.5
1.6±
0.5
(1.5
) 0.6
2-2.
41.
3±0.
6 (1
.5) 0
.38-
2.3
0.93
±0.4
2 (0
.77)
0.4
5-1.
8
Soil
1300
±0 (1
300)
120
0-13
0018
00±1
100
(120
0) 9
60-3
600
1100
±240
(110
0) 8
60-1
400
780±
310
(730
) 510
-130
0
BC
F C0.
051±
0.02
3 (0
.041
) 0.0
31-0
.11
0.06
3±0.
029
(0.0
60) 0
.017
-0.1
20.
046±
0.02
3 (0
.040
) 0.0
21-0
.11
0.18
±0.0
8 (0
.20)
0.0
53-0
.31
BC
F S0.
15±0
.21
(0.0
73) 0
.024
-0.8
40.
044±
0.02
5 (0
.039
) 0.0
11-0
.10
0.04
0±0.
023
(0.0
36) 0
.018
-0.0
720.
23±0
.14
(0.1
9) 0
.057
-0.5
1
Mn
Cap
39±3
5 (3
1) 2
1-17
015
±4 (1
5) 8
.8-2
286
±54
(69)
19-
180
85±1
5 (8
4) 6
0-12
0
Stip
e12
0±67
(120
) 27-
280
17±1
3 (1
4) 5
.5-4
812
0±74
(85)
36-
270
290±
17 (2
40) 8
6-63
0
QC
//S0.
68±1
.5 (0
.28)
0.0
90-6
.11.
1±0.
5 (1
.3) 0
.47-
1.8
1.1±
1.2
(0.4
4) 0
.22-
3.5
0.42
±0.2
5 (0
.34)
0.1
6-1.
0
Soil
38±6
(39)
31-
4516
0±75
(150
) 83-
240
700±
200
(770
) 330
-890
210±
130
(240
) 62-
340
2451Mineral Constituents of Edible...
BC
F C1.
0±0.
9 (0
.84)
0.5
4-4.
40.
12±0
.07
(0.1
0) 0
.042
-0.2
70.
13±0
.07
(0.1
3) 0
.027
-0.2
90.
69±0
.54
(0.3
2) 0
.17-
1.7
BC
F S3.
3±2.
2 (2
.9) 0
.71-
9.1
0.14
±0.1
5 (0
.081
) 0.0
30-0
.58
0.22
±0.2
1 (0
.13)
0.0
44-0
.75
2.3±
2.4
(1.4
) 0.2
8-7.
5
Na
Cap
20±1
1 (1
8) 6
.4-4
313
0±17
0 (6
7) 3
6-69
032
±14
(27)
9.7
-58
10±7
(8.1
) 3.2
-26
Stip
e24
±11
(25)
7.9
-46
250±
190
(200
) 49-
740
34±1
6 (2
9) 1
3-69
21±1
7 (1
2) 4
.9-6
8
QC
//S0.
92±0
.56
(0.7
9) 0
.26-
2.4
0.49
±0.2
2 (0
.44)
0.1
7-0.
931.
3±1.
1 (0
.79)
0.3
3-3.
80.
79±0
.64
(0.6
4) 0
.11-
2.1
Soil
8.0±
0.8
(7.9
) 7.2
-9.3
21±1
9 (1
2) 7
.3-5
33.
8±2.
1 (4
.1) 1
.1-6
.215
±2 (1
4) 1
3-18
BC
F C2.
5±1.
4 (2
.2) 0
.80-
5.5
10±1
5 (5
.0) 0
.68-
5913
±13
(7.7
) 2.8
-45
2.0±
1.2
(1.9
) 0.5
9-4.
0
BC
F S3.
1±1.
4 (2
.8) 0
.85-
5.9
19±1
6 (1
6) 0
.92-
6313
±2 (8
.0) 2
.4-4
45.
4±6.
1 (2
.3) 0
.89-
25
SrC
ap0.
74±0
.61
(0.5
6) 0
.37-
3.0
0.50
±0.1
5 (0
.48)
0.2
4-0.
740.
29±0
.13
(0.3
2) 0
.10-
0.54
1.2±
0.3
(1.1
) 0.9
0-1.
9
Stip
e2.
2±1.
7 (1
.8) 0
.47-
6.4
0.
64±0
.29
(0.5
7) 0
.27-
1.3
0.36
±0.1
4 (0
.31)
0.1
5-0.
674.
4±2.
2 (3
.8) 1
.6-9
.0
QC
//S0.
75±1
.5 (0
.35)
0.0
79-6
.90.
88±0
.40
(0.7
5) 0
.51-
2.0
0.90
±0.4
8 (0
.74)
0.3
9-1.
90.
34±0
.18
(0.2
8) 0
.15-
0.75
Soil
3.1±
0.6
(3.2
) 2.3
-3.7
5.0±
1.7
(5.8
) 3.0
-6.7
2.6±
1.6
(2.1
) 0.8
6-4.
94.
9±0.
7 (5
.3) 4
.0-5
.6
BC
F C0.
24±0
.19
(0.2
1) 0
.12-
0.93
0.11
±0.0
3 (0
.11)
0.0
37-0
.16
0.14
±0.0
8 (0
.12)
0.0
39-0
.30
0.25
±0.0
6 (0
.24)
0.1
9-0.
41
BC
F S0.
77±0
.71
(0.5
3) 0
.15-
2.8
0.14
±0.0
6 (0
.12)
0.0
57-0
.27
0.20
±0.1
4 (0
.20)
0.0
50-0
.58
0.90
±0.4
0 (0
.86)
0.2
9-1.
7
ZnC
ap86
±13
(87)
51-
120
100±
29 (9
6) 7
0-18
014
0±45
(130
) 90-
230
640±
36 (6
50) 5
80-7
10
Stip
e54
±12
(51)
41-
9451
±18
(52)
28-
100
150±
69 (1
30) 7
9-26
031
0±48
(290
) 250
-400
QC
//S1.
6±0.
3 (1
.7) 0
.55-
2.2
2.1±
0.4
(2.0
) 1.6
-2.8
1.1±
0.5
(1.3
) 0.4
0-1.
82.
1±0.
3 (2
.1) 1
.5-2
.5
Soil
9.4±
0.7
(10)
8.3
-10
19±9
(24)
7.0
-28
25±1
6 (2
0) 1
0-56
11±1
(11)
9.7
-12
BC
F C9.
3±1.
6 (9
.1) 5
.3-1
26.
9±4.
0 (4
.0) 2
.9-1
48.
1±5.
1 (7
.5) 1
.9-1
659
±7 (5
8) 5
1-70
BC
F S5.
8±1.
3 (5
.7) 4
.6-9
.83.
4±1.
9 (2
.2) 1
.2-6
.57.
5±3.
5 (6
.1) 3
.8-1
428
±4 (2
8) 2
1-40
a Not
det
erm
ined
Tabl
e 1.
Con
tinue
d.
2452 Kojta A.K., et al.
ANNEX 1. Metals contents of caps and stipes of field parasol and soil substrate, bioconcentration factor values from Lubraniec and Poni-atowa (mg kg-1 dry mass; mean, SDa, median value – in parentheses and range).
Element ItemSite
Lubraniec 2000 n = 16 Poniatowa, 2002 n = 15
Ag Cap 3.8±1.3 (3.2) 1.3-5.9 16±7 (13) 5.4-31
Stipe 1.6±0.8 (1.4) 1.0-4.1 5.7±2.8 (5.3) 1.5-10
QC//Sb 2.4±0.8 (2.4) 0.31-3.2 2.9±0.7 (2.9) 1.6-4.5
Soil 0.0084±0.0011 (0.0086) 0.007-0.010 0.031±0.020 (0.036) 0.011-0.056
BCFc 420±130 (410) 190-680 730±630 (470) 130-2600
BCFS 200±120 (160) 110-610 260±210 (190) 28-890
Co Cap 0.050±0.033 (0.05) 0.01-0.10 0.22±0.07 (0.20) 0.10-0.40
Stipe 0.14±0.11 (0.10) 0.025-0.49 0.36±0.12 (0.37) 0.20-0.65
QC//S 0.50±0.41 (0.34) 0.026-1.2 0.66±0.31 (0.61) 0.23-1.6
Soil 0.39±0.03 (0.41) 0.34-0.42 0.34±0.14 (0.35) 0.21-0.56
BCFc 0.13±0.09 (0.13) 0.0054-0.27 0.71±0.29 (0.82) 0.18-1.2
BCFS 0.37±0.35 (0.25) 0.062-1.5 1.2±0.6 (1.2) 0.35-2.2
Cr Cap 0.26±0.16 (0.24) 0.13-0.78 1.3±0.1 (1.3) 1.0-1.6
Stipe 0.58±0.67 (0.30) 0.12-2.7 0.98±0.22 (0.94) 0.75-1.6
QC//S 0.87±0.69 (0.78) 0.10-2.7 1.4±0.3 (1.4) 0.74-1.8
Soil 1.4±0.1 (1.5) 1.3-1.5 0.76±0.14 (0.69) 0.63-0.92
BCFc 0.18±0.11 (0.16) 0.088-0.52 1.8±0.4 (1.8) 1.1-2.5
BCFS 0.41±0.50 (0.20) 0.083-2.0 1.3±0.2 (1.3) 0.94-1.7
Hg Cap 2.1±0.6 (2.0) 1.3-3.5 3.1±0.9 (2.9) 1.8-4.6
Stipe 0.98±0.28 (0.87) 0.67-1.7 1.5±0.4 (1.5) 0.63-2.7
QC//S 2.2±0.7 (2.1) 1.5-4.5 2.1±0.5 (2.1) 1.3-2.9
Soil 0.13±0.02 (0.13) 0.11-0.16 0.047±0.010 (0.046) 0.035-0.063
BCFc 16±6 (15) 8.3-31 69±23 (62) 29-120
BCFS 7.6±2.8 (6.8) 4.3-15 34±9 (34) 10-46
Ni Cap 0.86±0.22 (0.84) 0.60-1.5 0.29±0.47 (0.01) 0.01-1.3
Stipe 1.3±0.6 (1.2) 0.52-2.9 0.39±0.95 (0.05) 0.01-3.6
QC//S 0.81±0.60 (0.68) 0.23-2.8 0.84±0.64 (1.0) 0.41-2.6
Soil 1.0±0.1 (1.0) 0.85-1.1 0.80±0.06 (0.79) 0.75-0.89
BCFc 0.87±0.21 (0.83) 0.57-1.4 0.36±0.59 (0.01) 0.0056-1.6
BCFS 1.4±0.8 (1.2) 0.50-3.4 0.49±1.2 (0.067) 0.0056-4.4
Pb Cap 2.3±0.7 (2.2 ) 1.6-4.4 5.9±1.7 (5.2) 3.6-8.9
Stipe 1.9±1.3 (1.4) 0.50-5.1 3.7±0.9 (3.8) 1.9-5.5
Q C//S 1.9±0.9 (1.9) 0.44-4.0 1.7±0.7 (1.6) 0.81-3.1
Soil 12±1 (12) 10-13 8.8±1.4 (7.9) 7.4-11
BCFc 0.20±0.06 (0.20) 0.13-0.37 0.70±0.20 (0.65) 0.38-1.1
BCFS 0.17±0.14 (0.13) 0.041-0.52 0.43±0.12 (0.44) 0.21-0.59
2453Mineral Constituents of Edible...
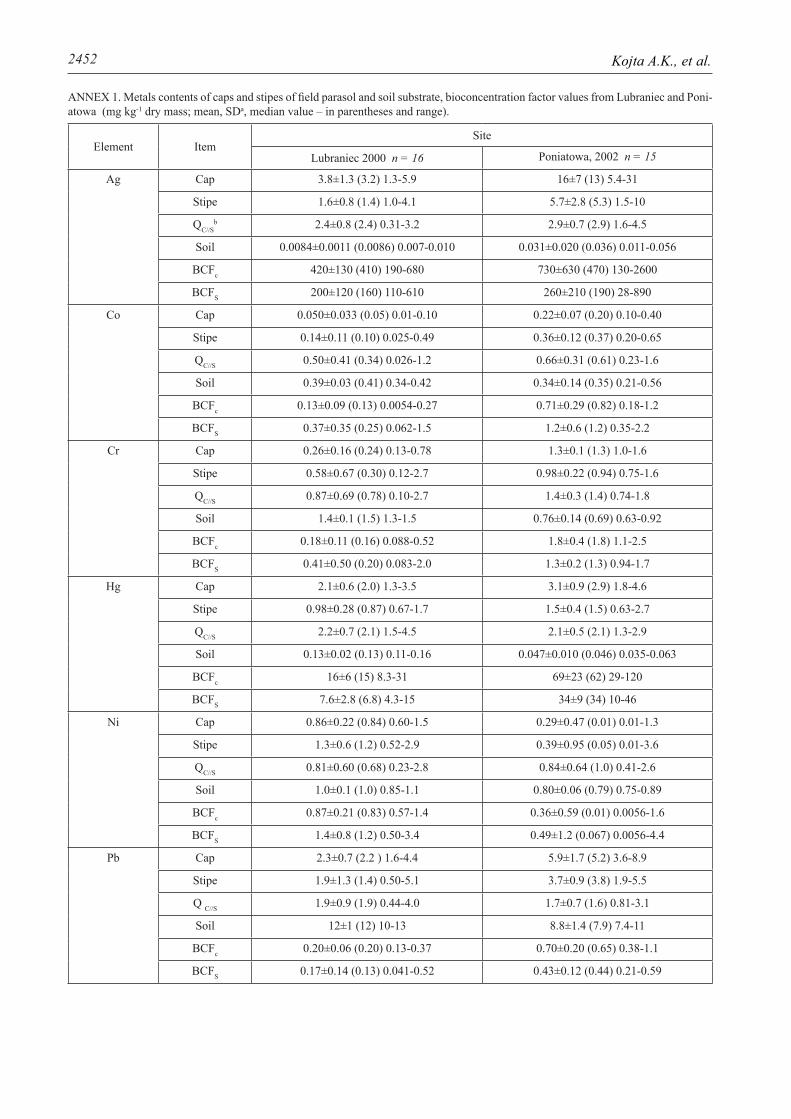
(determined for samples from two sites only) were below 1 mg kg-1 dm, on average (Annex 1).
The mean content of Zn in caps of M. procera is 200 mg kg-1 dm, followed by 170, 81, 48, and 45 mg kg-1 dm for Cu, Fe, Na, and Mg, respectively. The corresponding values (arithmetic mean) for stipes are 120 mg kg-1 dm for Zn and 110 mg kg-1 dm for Cu, Fe, and Mn, and 81 mg kg-1 dm for Na. The contents of Mn, Na, and Fe showed that they appeared to be more abundant in the stipes than in the caps of M. procera. Nevertheless, the QC/S values of these metals varied significantly depending on the site surveyed (Table 1).
These metals occurred in caps in contents that were comparable (p>0.05) for some sites while there were significant differences for some other sites (p<0.05; Mann Whitney U test), e.g., higher content of Cu, Fe, Mg, and Zn, but lower for Na in individuals from the Poniatowa site (Table 1). Considering the mean values for caps at the sites surveyed, the contents varied for Zn from 86±13 to 640±36 (range 51-710) mg kg-1 dm followed by Cu with mean values ranging from 94±24 to 280±73 (range 49-440) mg kg-1 dm. The caps were about twice more abundant in Zn and Cu than the stipes (Table 1). The soil substrates from Gostyńsko-Włocławskie Forest and Starachowickie Forest contained twice more Zn than the soils from the Lubraniec and Poniatowa sites, while those from Gostyńsko-Włocławskie Forest were also about twice richer in Cu (0.05<p<0.01). There is an apparent variation in the availability of Zn and Cu to M. procera between the sites surveyed, as can be seen from the values of the BCF. Both Zn and Cu are well bioconcentrated by M. procera, and their BCF values varied between the sites, on average from about 5 to 60 for Zn and from 40 to 120 for Cu. At the Poniatowa site Zn and Cu were more bioavailable from soil than elsewhere in this study.
The mean Fe content in caps varied from 49±18 to 120±29 (range 27-160) mg kg-1 dm, followed by Mn, which varied from 15±4 to 86±54 (range 8.8-180), and then Na, which varied from 10±7 to 130±170 (range 3.2-690) mg kg-1 dm (Table 1). Iron was abundant in the soils, and also to some degree in the caps and stipes – and Fe can be considered to be bioexcluded by this fungus since its BCF values were <0.5. Similar to Cu and Zn, Fe
was more bioavailable at the Poniatowa site, where the soil Fe contents were significantly lower (p<0.01; Mann-Whitney U test) when compared to other sites. Mn and Na content of the upper soil layer varied highly between the sites (0.001<p<0.01; Table 1), and Mn was usually bioexcluded, while Na was bioconcentrated in fruiting bodies (median BCF of 1.9-7.7 for caps).
Cobalt and chromium were determined only in soils and mushrooms from the Lubraniec and Poniatowa sites (Annex 2). The median contents of these metals in caps varied significantly (p<0.01) between the sites. The mean Co content values ranged from 0.050±0.033 to 0.22±0.07 (range 0.01-0.40) mg kg-1 dm, and for Cr between 0.26±0.16 and 1.3±0.1 (range 0.13-1.6) mg kg-1 dm, while the corresponding values for stipes were smaller. The availability of these two trace metals to M. procera also varied between the sites investigated. The results of this study indicate that Co is bioexcluded by the parasol mushroom. For Cr, the BCF for specimens from the Poniatowa site was around 1.5, while the corresponding value for the Lubraniec site is much lower.
Some other Metals: Trace Constituents (Al, Ba, Ni, Rb, Sr)
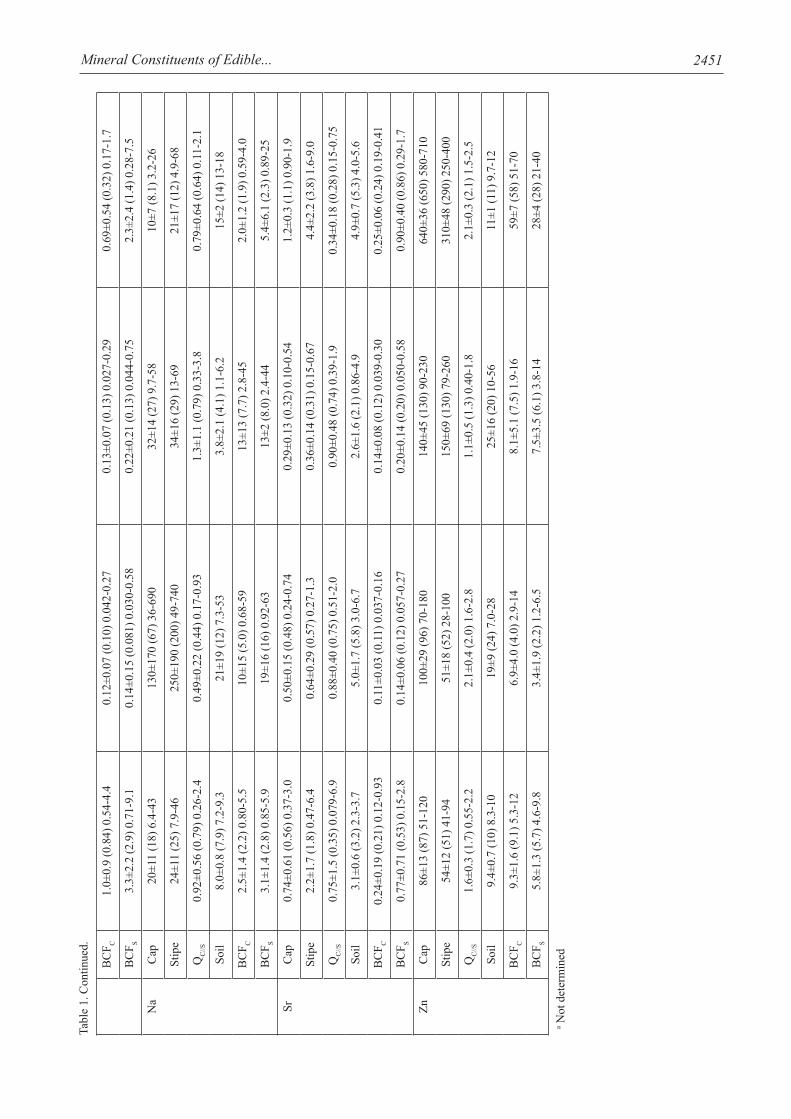
Aluminum is bio-excluded by M. procera (BCF<0.5). Nevertheless, Al was found to be relatively abundant in the caps with the mean values of the sites investigated ranging from 42±16 to 99±61 (total 14-240) mg kg-1 dm. In spite of the low BCF, the relative abundance of Al in the fruiting bodies may be a result of its abundance in the soil (between 500 and 1,200 mg kg-1 dm, on average; Table 1), and there may be a competitive co-absorption of Al with other metals.
Barium and strontium contents in the soils for the four sites varied from 14±2 to 44±19 (range 11-69) mg kg-1 dm, and from 2.6±1.6 to 5.0±1.7 (range 0.86-67) mg kg-1 dm, respectively (Table 1). Barium and strontium are bioexcluded by M. procera. In caps they occurred in contents between 0.85±0.24 and 1.3±0.4 (range 0.33-6.9) mg Ba kg-1 dm m, and between 0.29±0.13 and 1.2±0.3 (range 0.10-3.0) mg Sr kg-1 dm. Both metals were usually more enriched in stipes than in the caps of fruiting bodies of this fungus.
ANNEX 1. Continued.
Rb Cap NDc 38±7 (37) 27-53
Stipe ND 21±37 (12) 6.8-150
QC//S ND 3.3±1.5 (3.3) 0.22-6.4
Soil ND 0.45±0.21 (0.39) 0.25-0.71
BCFc ND 100±48 (110) 44-180
BCFS ND 45±50 (36) 12-220a SD standard deviationb Qc/s values of the quotient of metal contents in cap to stipec Not determined
2454 Kojta A.K., et al.
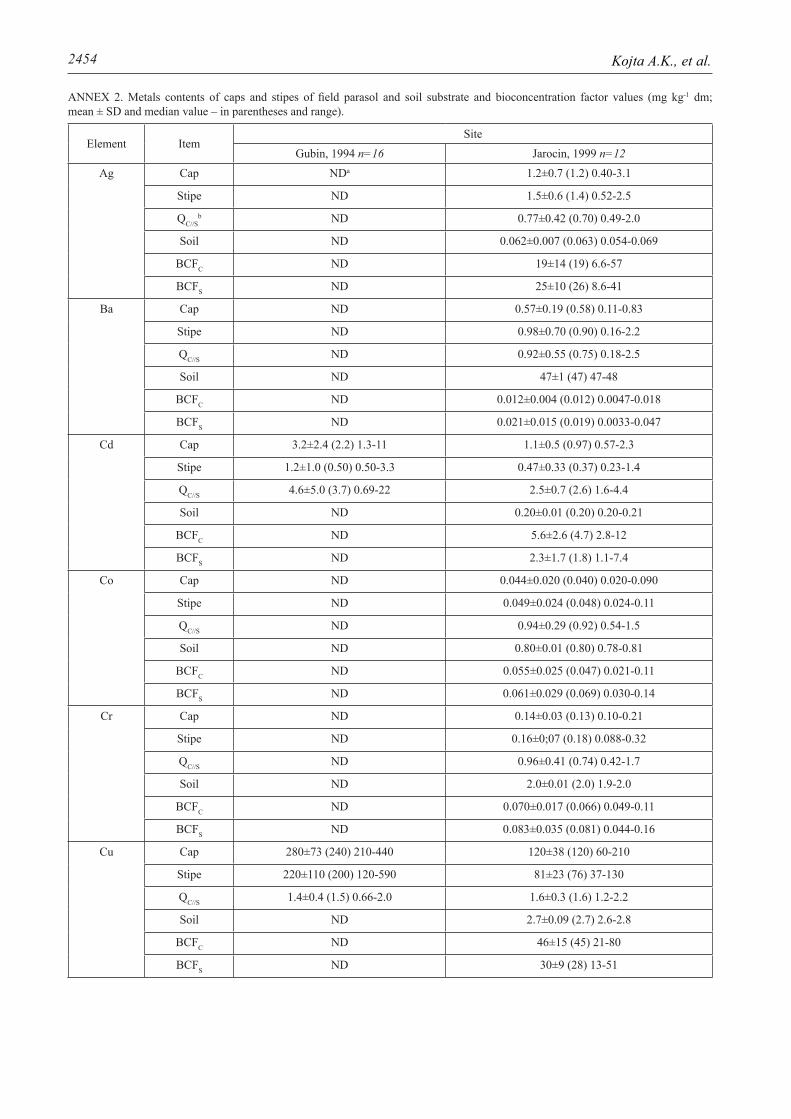
ANNEX 2. Metals contents of caps and stipes of field parasol and soil substrate and bioconcentration factor values (mg kg-1 dm; mean ± SD and median value – in parentheses and range).
Element ItemSite
Gubin, 1994 n=16 Jarocin, 1999 n=12Ag Cap NDa 1.2±0.7 (1.2) 0.40-3.1
Stipe ND 1.5±0.6 (1.4) 0.52-2.5
QC//Sb ND 0.77±0.42 (0.70) 0.49-2.0
Soil ND 0.062±0.007 (0.063) 0.054-0.069
BCFC ND 19±14 (19) 6.6-57
BCFS ND 25±10 (26) 8.6-41
Ba Cap ND 0.57±0.19 (0.58) 0.11-0.83
Stipe ND 0.98±0.70 (0.90) 0.16-2.2
QC//S ND 0.92±0.55 (0.75) 0.18-2.5
Soil ND 47±1 (47) 47-48
BCFC ND 0.012±0.004 (0.012) 0.0047-0.018
BCFS ND 0.021±0.015 (0.019) 0.0033-0.047
Cd Cap 3.2±2.4 (2.2) 1.3-11 1.1±0.5 (0.97) 0.57-2.3
Stipe 1.2±1.0 (0.50) 0.50-3.3 0.47±0.33 (0.37) 0.23-1.4
QC//S 4.6±5.0 (3.7) 0.69-22 2.5±0.7 (2.6) 1.6-4.4
Soil ND 0.20±0.01 (0.20) 0.20-0.21
BCFC ND 5.6±2.6 (4.7) 2.8-12
BCFS ND 2.3±1.7 (1.8) 1.1-7.4
Co Cap ND 0.044±0.020 (0.040) 0.020-0.090
Stipe ND 0.049±0.024 (0.048) 0.024-0.11
QC//S ND 0.94±0.29 (0.92) 0.54-1.5
Soil ND 0.80±0.01 (0.80) 0.78-0.81
BCFC ND 0.055±0.025 (0.047) 0.021-0.11
BCFS ND 0.061±0.029 (0.069) 0.030-0.14
Cr Cap ND 0.14±0.03 (0.13) 0.10-0.21
Stipe ND 0.16±0;07 (0.18) 0.088-0.32
QC//S ND 0.96±0.41 (0.74) 0.42-1.7
Soil ND 2.0±0.01 (2.0) 1.9-2.0
BCFC ND 0.070±0.017 (0.066) 0.049-0.11
BCFS ND 0.083±0.035 (0.081) 0.044-0.16
Cu Cap 280±73 (240) 210-440 120±38 (120) 60-210
Stipe 220±110 (200) 120-590 81±23 (76) 37-130
QC//S 1.4±0.4 (1.5) 0.66-2.0 1.6±0.3 (1.6) 1.2-2.2
Soil ND 2.7±0.09 (2.7) 2.6-2.8
BCFC ND 46±15 (45) 21-80
BCFS ND 30±9 (28) 13-51
2455Mineral Constituents of Edible...
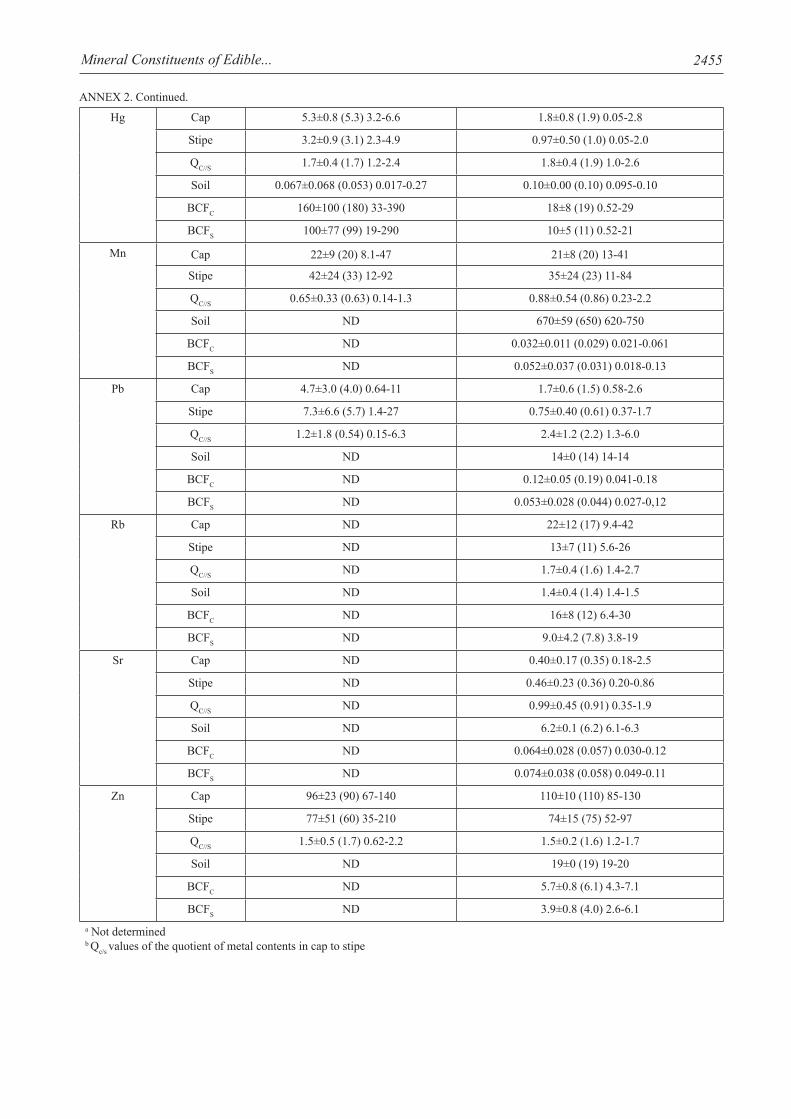
ANNEX 2. Continued.
Hg Cap 5.3±0.8 (5.3) 3.2-6.6 1.8±0.8 (1.9) 0.05-2.8
Stipe 3.2±0.9 (3.1) 2.3-4.9 0.97±0.50 (1.0) 0.05-2.0
QC//S 1.7±0.4 (1.7) 1.2-2.4 1.8±0.4 (1.9) 1.0-2.6
Soil 0.067±0.068 (0.053) 0.017-0.27 0.10±0.00 (0.10) 0.095-0.10
BCFC 160±100 (180) 33-390 18±8 (19) 0.52-29
BCFS 100±77 (99) 19-290 10±5 (11) 0.52-21
Mn Cap 22±9 (20) 8.1-47 21±8 (20) 13-41
Stipe 42±24 (33) 12-92 35±24 (23) 11-84
QC//S 0.65±0.33 (0.63) 0.14-1.3 0.88±0.54 (0.86) 0.23-2.2
Soil ND 670±59 (650) 620-750
BCFC ND 0.032±0.011 (0.029) 0.021-0.061
BCFS ND 0.052±0.037 (0.031) 0.018-0.13
Pb Cap 4.7±3.0 (4.0) 0.64-11 1.7±0.6 (1.5) 0.58-2.6
Stipe 7.3±6.6 (5.7) 1.4-27 0.75±0.40 (0.61) 0.37-1.7
QC//S 1.2±1.8 (0.54) 0.15-6.3 2.4±1.2 (2.2) 1.3-6.0
Soil ND 14±0 (14) 14-14
BCFC ND 0.12±0.05 (0.19) 0.041-0.18
BCFS ND 0.053±0.028 (0.044) 0.027-0,12
Rb Cap ND 22±12 (17) 9.4-42
Stipe ND 13±7 (11) 5.6-26
QC//S ND 1.7±0.4 (1.6) 1.4-2.7
Soil ND 1.4±0.4 (1.4) 1.4-1.5
BCFC ND 16±8 (12) 6.4-30
BCFS ND 9.0±4.2 (7.8) 3.8-19
Sr Cap ND 0.40±0.17 (0.35) 0.18-2.5
Stipe ND 0.46±0.23 (0.36) 0.20-0.86
QC//S ND 0.99±0.45 (0.91) 0.35-1.9
Soil ND 6.2±0.1 (6.2) 6.1-6.3
BCFC ND 0.064±0.028 (0.057) 0.030-0.12
BCFS ND 0.074±0.038 (0.058) 0.049-0.11
Zn Cap 96±23 (90) 67-140 110±10 (110) 85-130
Stipe 77±51 (60) 35-210 74±15 (75) 52-97
QC//S 1.5±0.5 (1.7) 0.62-2.2 1.5±0.2 (1.6) 1.2-1.7
Soil ND 19±0 (19) 19-20
BCFC ND 5.7±0.8 (6.1) 4.3-7.1
BCFS ND 3.9±0.8 (4.0) 2.6-6.1a Not determinedb Qc/s values of the quotient of metal contents in cap to stipe
2456 Kojta A.K., et al.
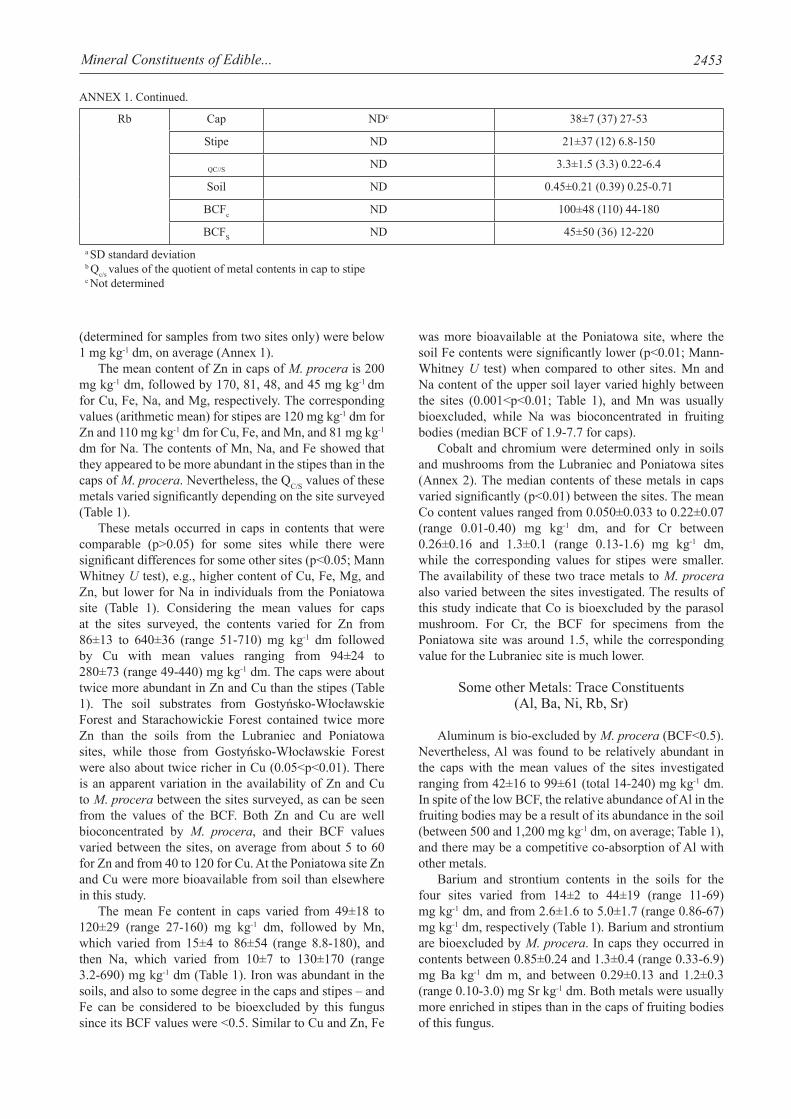
Nickel was determined only in mushrooms and soils from the Lubraniec and Poniatowa sites. The soil Ni contents were similar (p>0.05) for the two spatially distant sites. Caps contained Ni in content varying between 0.29±0.47 and 0.86±0.22 (range 0.01-1.5) mg kg-1 dm, while the stipes were a little more abundant in Ni than the caps (p<0.05; Mann-Whitney U test). From the data summarized in Annex 1 it can be concluded that the M. procera bioexcludes Ni. Laboratory studies showed that Ni (from NiCl2) was absorbed by mycelium and accumulated by M. procera, but the mushroom growth was impaired as the Ni content increased in the substrate medium from 0.05 to 0.8 mM [53]. Rubidium is effectively bioconcentrated by M. procera in caps (BCF ~100) and stipes (BCF~40). Rubidium contents in the soil were approximately 0.40 mg kg-1 dm, while the mean content in the caps was 38±7 (range 27-53) mg Rb kg-1 dm (Annex 1).
Toxic Metals (Cd, Pb, Hg, Ag)
These metals (Cd, Pb, Hg, and Ag) are highly toxic to mammals. In the caps of M. procera from the Lubraniec and Poniatowa sites, the mean Pb content varied from 1.7±0.6 to 5.9±1.7 (range 0.58-11) mg kg-1 dm. The mean Hg contents in caps from the Lubraniec, Poniatowa, Jarocin, and Gubin sites are 2.1±0.6, 3.1±0.9 (range 1.3-4.6), 1.8±0.8, and 5.3±0.8 mg kg-1 dm, respectively (Annex 1). Silver content in caps (for three sites including the Jarocin site) varied from 1.2±0.7 to 16±7 (range 0.40-31) mg kg-1 dm, and for Cd (for six sites) the mean values varied from 0.56±0.13 to 4.9±5.4 (range 0.07-17) mg kg-1 dm (Annex 1 and 2). The abundance of these metals in the caps varied significantly (0.01<p<0.05; Mann-Whitney U test) for some of the sites.
Cadmium, mercury, and silver were accumulated by M. procera while Pb was bioexcluded. The ranges of Cd, Ag, Hg, and Pb contents in the soils were 0.1-0.4, 0.01-0.06, 0.05-0.15, and 8-15 mg kg-1 dm, respectively, while the range of their BCF values for caps were 4-15, 20-470, 15-160, and 0.2-0.7 (for Cd, Ag, Hg, and Pb), respectively (Annexes 1 and 2). For some of the sampled sites, Ag and Hg were highly bioconcentrated by M. procera and their BCF values reached more than 100. Earlier studies reported that M. procera has the ability to efficiently bioconcentrate Hg [54-57]. This species, apart from being rich in the essential elements (including Cu and Zn), is also rich in Cd, Pb, Hg, and Ag [2, 14, 26, 40, 56].
The occurrence of essential and toxic trace elements in edible mushrooms collected in the wild as well as their intake rates, nutritional benefits, and likely risks, are of primarily concern to consumers. The traditional cooking recipes describe that caps of freshly collected M. procera are especially good for stuffing (filling) and then broiling, or for frying in a pan with some oil or butter after being dipped in whisked egg and breadcrumbs. In Slovakia, for example, baked M. procera caps are stuffed with ground pork, oregano, and garlic. In these culinary treatments the possible leaching of the mineral contents of the mushroom cap is small, if any, and can therefore be ignored when
estimating toxic metals intake rates and the likely risks to consumers.
Mercury
For the assessment of possible risks due to intake of Hg accumulated in caps of M. procera, the reference dose (RfD; 0.0003 mg kg-1 body mass daily) and established value of provisionally tolerable weekly intake (PTWI; 0.004 mg kg-1 bm) were applied [58-59]. From a toxicological point of view, Hg content of caps of M. procera is of concern. A meal cooked using 300 or 500 g of caps collected at the Jarocin, Lubraniec, Poniatowa, or Gubin sites will result in the intake of Hg ranging from 0.9 to 2.7 or 1.5 to 4.4 µg kg-1 body mass for consumption of 300 g or 500 g of caps, respectively. These doses were derived from the minimum and maximum median values of 0.18 (Jarocin) and 0.53 (Gubin) mg Hg kg-1 caps, wet weight (assuming 90% water content in caps and an adult individual of 60 kg body mass). The weekly consumption of 500 g of caps of M. procera from Gubin, which showed the highest Hg content, will result in the intake of 0.26 mg Hg, which is above the 0.24 Hg recommended dose of PTWI (assuming that no Hg from other foods is ingested).
Selenium plays a protective role against Hg contained in foods. It is presumed that the co-occurrence of Se and methyl mercury or total Hg in stoichiometric ratio could prevent the toxic effects of Hg [60]. Among fungi M. procera is relatively rich in Se. As reviewed recently, Se content of the caps of M. procera usually varies around 5 mg kg-1 dm [61]. In a recent study, the average Se content of M. procera (n=11) collected from Spain were 16±9 mg kg-1 dm for the hymenophores and 5.5±2.3 mg kg-1 dm for the rest of the fruiting body (in-cluding inedible stipes) [39].
The PTWI for methylmercury is 0.0016 mg kg-1 body mass [62]. The methylmercury content of M. procera were not determined in this study. Bargagli and Bal-di reported 0.06% of the total mercury content parasol mushroom as methyl Hg in a single specimen of Parasol Mushroom from a cinnabar mining area near Siena, Italy (4 mg Hg kg-1 dm) [63].
Cadmium
Cadmium is known for its high toxicity to the mammalian body systems and especially because of its nephrotoxicity and accumulation in kidneys. The PTWI of 7 µg Cd kg-1 body mass (equivalent to 1 µg kg-1 bm daily) was set earlier by the World Health Organization [64]. The provisional tolerable monthly intake (PTMI) for this metal is 25 µg kg-1 bm [65]. The median values of Cd in caps from six of the sites surveyed varied from 0.57 (Lubraniec) to 2.2 (Gubin) mg kg-1 dm (0.057 and 0.22 mg kg-1 fresh weight; assuming 90% water content). In the European Union the maximum level of cadmium allowed for mushrooms is 1.0 mg kg-1 fresh product (10 mg kg-1 dm; assuming 90% moisture content) [66]. The
2457Mineral Constituents of Edible...
median and arithmetic mean content values in this study were below the acceptable limit, and only a few specimens collected from Gostyńsko-Włocławskie Forest and from the Gubin region contained Cd in caps at levels >10 mg kg-1 dm (Table 1, Annex 1).
A meal made with 300 or 500 g of caps of M. procera from these sites will result in Cd intake of between 17 and 28 or 66 and 110 µg Cd, respectively, assuming no Cd intake from other foods is ingested. These amounts correspond to doses of 0.28 to 0.47 (for consumption of 300 g of caps of M. procera or 1.1 to 1.8 µg Cd kg-1 bm (for consumption of 500 g of caps). These estimated values show that a tolerable weekly intake (TWI) dose of 150 µg Cd (for an individual of 60 kg bm) will not be exceeded when eating a large meal (500 g) made of caps of M. procera collected from the Gubin region once weekly, or two to three meals weekly for caps from the other investigated sites. The estimated TWI value of 150 µg for Cd is equivalent to 21 µg daily intake and this value is close to the estimated Cd intake from a 300 g portion of fresh caps of parasol mushrooms from the other sites surveyed.
The caps of some M. procera samples from four of the six sites surveyed showed substantially higher Cd contents (Annex 1 and 2) compared to the maximum median values used in these estimations. This suggests that consumers could be exposed to relatively higher doses of Cd if they consume larger meals of M. procera often – especially during the mushrooming season each year.
Lead
The median Pb values of caps from four of the sites surveyed were 1.5 (Jarocin), 2.2 (Lubraniec), 4.0 (Gubin), and 5.2 (Poniatowa) mg kg-1 dm (between 0.15 and 0.52 mg kg-1 fresh product; assuming 90% moisture content). In the EU regulation, the permitted content of Pb in cultivated mushrooms (champignon, oyster, and shiitake) is 0.3 mg kg-1 fresh mushrooms (3.0 mg kg-1 dm; assuming 90% moisture) [67]. For M. procera specimens from the Poniatowa and Gubin sites, the median Pb contents for caps exceeded the EU limit (also for some specimens from the Lubraniec site) (Annexes 1 and 2). A meal made with 300 or 500 g of caps from these sites will result in the intake of between 45 and 75 or 156 and 260 µg Pb, respectively. These values correspond to doses of 0.75 to 1.2 or 2.6 to 4.3 µg Pb kg-1 bm, assuming no Pb intake from other foods.
The FAO/WHO JECFA established a PTWI for lead of 1.5 mg for person of 60 kg body mass, which is equivalent to 214 µg daily, 25 µg kg-1 bm weekly, or 3.6 µg kg-1 bm daily [68]. Nevertheless, because of the relatively elevated Pb levels accumulated in M. procera, the frequent eating of caps during the mushrooming season can result in intake doses close to or exceeding the allowed intake value. This can be of special toxicological concern since a significant proportion of the caps in specimens studied showed Pb content exceeding the median values determined (Tables 1 and 2).
Silver
Unlike Hg, Cd, or Pb, there are no intake limits or tolerance values set for Ag in foodstuffs. Silver ion is very reactive and quickly bonds to the surface of epithelium cells of the alimentary tract and hence is largely excreted (not absorbed) [69], thereby raising questions about the absorption rates of Ag from the food chain — especially for Ag in edible wild mushrooms.
Many mushroom species are relatively rich in silver, and this metal is efficiently taken-up from contaminated substratum by the champignon mushroom (Agaricus bisporus) or in the wild by the meadow mushroom (A. campestris), while the warted amanita (Amanita strobiliformis) is a hyperacumulator of silver [11, 24-26]. Plant foods such as cereals, vegetables, pulses, and fruits are known to contain much lower Ag when compared to many mushroom species. The chemical species of Ag in mushrooms were identified recently as the metallothionein isoforms involved in intracellular sequestration of Ag by A. strobiliformis [24]. The availability and toxicity of Ag bonded to fungal peptides from a mushroom meal is unknown.
The median values of silver in caps at three of the sites surveyed varied widely: 1.2 for Jarocin, 3.2 for Lubraniec, and 13 for Poniatowa mg kg-1 dm (range 0.12 to 1.3 mg kg-1 fresh productt; assuming 90% water content). Hence, a meal made with 300 or 500 g of fresh caps of M. procera collected from these sites (Jarocin, Lubraniec, and Poniatowa) will result in intake of silver of between 36 and 60 or 390 and 650 µg Ag, respectively, assuming no silver intake from other foods is ingested. These amounts correspond to doses of 0.6 to 1 or 6.5 to 10.8 µg Ag kg-1 bm.
Principal Component Analysis
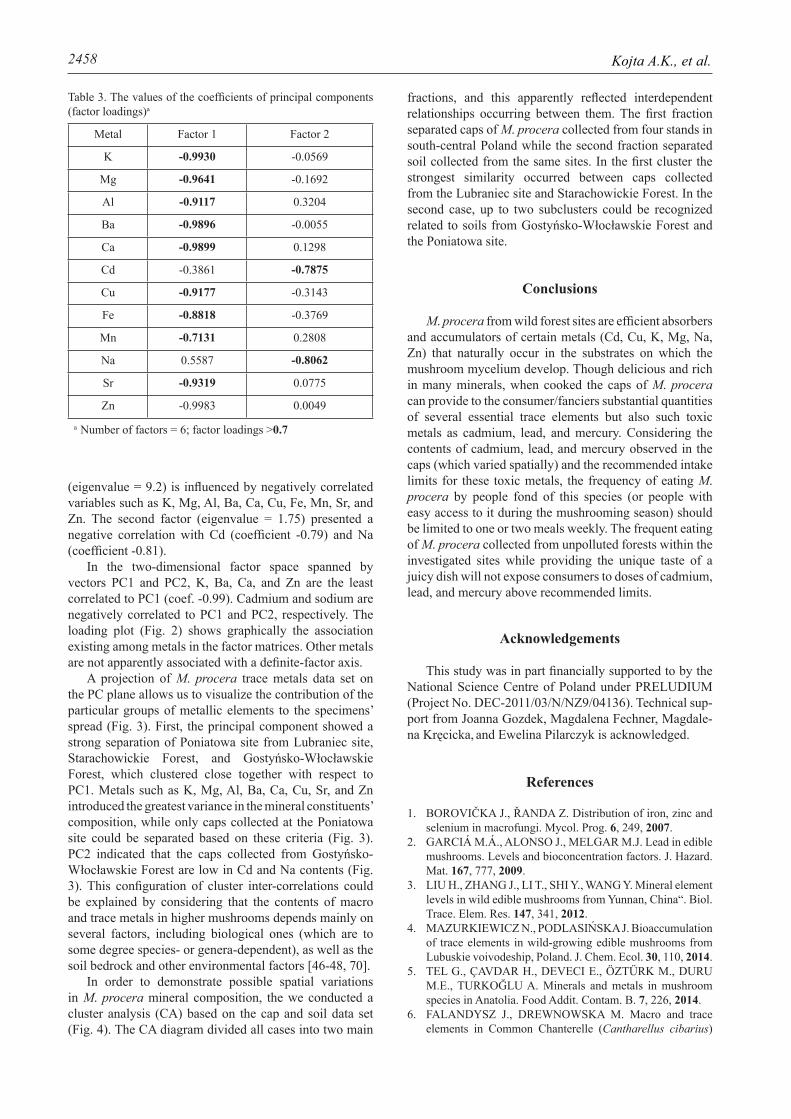
In order to examine the profiles of metals sequestered in the caps from four sites (Table 1), the principal component analysis (PCA) was used. The contents of K, Mg, Al, Ba, Ca, Cd, Cu, Fe, Mn, Na, Sr, and Zn were used as variables. The correlation matrixes resulting from the PCA are displayed in Tables 2 and 3. The number of components was chosen with the ordinary rule of selecting eigenvalues >1. The PCA of the data matrix gave a two-dimensional model that explained 91% (77% and 15%, respectively) of the total variance in the data set. The loading plot (Fig. 2) shows that the first principal component
Factor EigenvaluePercent of total
variance
Cumulative eigenvalue
Cumulative percent
1 9.20 76.65 9.20 76.65
2 1.75 14.56 10.95 91.25a Minimum Eigenvalue = 1
Table 2. Eigenvalues of correlation matrix and related statisticsa
2458 Kojta A.K., et al.
(eigenvalue = 9.2) is influenced by negatively correlated variables such as K, Mg, Al, Ba, Ca, Cu, Fe, Mn, Sr, and Zn. The second factor (eigenvalue = 1.75) presented a negative correlation with Cd (coefficient -0.79) and Na (coefficient -0.81).
In the two-dimensional factor space spanned by vectors PC1 and PC2, K, Ba, Ca, and Zn are the least correlated to PC1 (coef. -0.99). Cadmium and sodium are negatively correlated to PC1 and PC2, respectively. The loading plot (Fig. 2) shows graphically the association existing among metals in the factor matrices. Other metals are not apparently associated with a definite-factor axis.
A projection of M. procera trace metals data set on the PC plane allows us to visualize the contribution of the particular groups of metallic elements to the specimens’ spread (Fig. 3). First, the principal component showed a strong separation of Poniatowa site from Lubraniec site, Starachowickie Forest, and Gostyńsko-Włocławskie Forest, which clustered close together with respect to PC1. Metals such as K, Mg, Al, Ba, Ca, Cu, Sr, and Zn introduced the greatest variance in the mineral constituents’ composition, while only caps collected at the Poniatowa site could be separated based on these criteria (Fig. 3). PC2 indicated that the caps collected from Gostyńsko-Włocławskie Forest are low in Cd and Na contents (Fig. 3). This configuration of cluster inter-correlations could be explained by considering that the contents of macro and trace metals in higher mushrooms depends mainly on several factors, including biological ones (which are to some degree species- or genera-dependent), as well as the soil bedrock and other environmental factors [46-48, 70].
In order to demonstrate possible spatial variations in M. procera mineral composition, the we conducted a cluster analysis (CA) based on the cap and soil data set (Fig. 4). The CA diagram divided all cases into two main
fractions, and this apparently reflected interdependent relationships occurring between them. The first fraction separated caps of M. procera collected from four stands in south-central Poland while the second fraction separated soil collected from the same sites. In the first cluster the strongest similarity occurred between caps collected from the Lubraniec site and Starachowickie Forest. In the second case, up to two subclusters could be recognized related to soils from Gostyńsko-Włocławskie Forest and the Poniatowa site.
Conclusions
M. procera from wild forest sites are efficient absorbers and accumulators of certain metals (Cd, Cu, K, Mg, Na, Zn) that naturally occur in the substrates on which the mushroom mycelium develop. Though delicious and rich in many minerals, when cooked the caps of M. procera can provide to the consumer/fanciers substantial quantities of several essential trace elements but also such toxic metals as cadmium, lead, and mercury. Considering the contents of cadmium, lead, and mercury observed in the caps (which varied spatially) and the recommended intake limits for these toxic metals, the frequency of eating M. procera by people fond of this species (or people with easy access to it during the mushrooming season) should be limited to one or two meals weekly. The frequent eating of M. procera collected from unpolluted forests within the investigated sites while providing the unique taste of a juicy dish will not expose consumers to doses of cadmium, lead, and mercury above recommended limits.
Acknowledgements
This study was in part financially supported to by the National Science Centre of Poland under PRELUDIUM (Project No. DEC-2011/03/N/NZ9/04136). Technical sup-port from Joanna Gozdek, Magdalena Fechner, Magdale-na Kręcicka, and Ewelina Pilarczyk is acknowledged.
References
1. BOROVIČKA J., ŘANDA Z. Distribution of iron, zinc and selenium in macrofungi. Mycol. Prog. 6, 249, 2007.
2. GARCIÁ M.Á., ALONSO J., MELGAR M.J. Lead in edible mushrooms. Levels and bioconcentration factors. J. Hazard. Mat. 167, 777, 2009.
3. LIU H., ZHANG J., LI T., SHI Y., WANG Y. Mineral element levels in wild edible mushrooms from Yunnan, China“. Biol. Trace. Elem. Res. 147, 341, 2012.
4. MAZURKIEWICZ N., PODLASIŃSKA J. Bioaccumulation of trace elements in wild-growing edible mushrooms from Lubuskie voivodeship, Poland. J. Chem. Ecol. 30, 110, 2014.
5. TEL G., ÇAVDAR H., DEVECI E., ÖZTÜRK M., DURU M.E., TURKOĞLU A. Minerals and metals in mushroom species in Anatolia. Food Addit. Contam. B. 7, 226, 2014.
6. FALANDYSZ J., DREWNOWSKA M. Macro and trace elements in Common Chanterelle (Cantharellus cibarius)
Metal Factor 1 Factor 2
K -0.9930 -0.0569
Mg -0.9641 -0.1692
Al -0.9117 0.3204
Ba -0.9896 -0.0055
Ca -0.9899 0.1298
Cd -0.3861 -0.7875
Cu -0.9177 -0.3143
Fe -0.8818 -0.3769
Mn -0.7131 0.2808
Na 0.5587 -0.8062
Sr -0.9319 0.0775
Zn -0.9983 0.0049
a Number of factors = 6; factor loadings >0.7
Table 3. The values of the coefficients of principal components (factor loadings)a
2459Mineral Constituents of Edible...
mushroom from the European background areas in Poland: Composition, accumulation, dietary exposure and data re-view for species. J. Environ. Sci. Heal. B. 50, 374, 2015.
7. SARIKURKCU C., TEPE B., KOCAK M.S., UREN M.C. Metal concentration and antioxidant activity of edible mush-rooms from Turkey. Food Chem. 175, 549, 2015.
8. ZHANG D., FRANKOWSKA A., JARZYŃSKA G., KO-JTA A.K., DREWNOWSKA M., WYDMAŃSKA D., BIELAWSKI L., WANG J., FALANDYSZ J. Metals of King Bolete (Boletus edulis) collected at the same site over two years. Afr. J. Agric. Res. 5, 3050, 2010.
9. JOURNAL OF LAWS OF THE REPUBLIC OF POLAND Dz.U.11.115.672, regulation, Ministry of Health on 17 May 2011. on mushrooms authorized for the marketing or production of mushroom products, resources foodstuffs containing mushrooms and also mushroom classifier and mushroom expert. Annexes 1 to Regulation of the Minister of Health of 17 May 2011. The list of mushrooms authorized for marketing or production mushroom products and foodstuffs containing mushrooms.
10. http://www2.mz.gov.pl/wwwmz/slajd?mr=m4&ms=1&ml=pl&mi=5&mx=0&mt=&my=9&ma=017636 (27.04.2016r.)
11. GUS, Forestry, Central Statistical Office, Warsaw, 2014. http://stat.gov.pl/en/topics/agriculture-forestry/forestry/forestry-2014,1,5.html (27.04.2015r.)
12. BOROVIČKA J., KOTRBA P., GRYNDLER M., MIHAL-JEIČ M., ŘANDA Z., ROHOVEC J., CAJTHAML T., STIJ-VE T., DUNN C.E. Bioaccumulation of silver in ectomy-corrhizal and saprobic macrofungi from pristine and polluted areas. Sci. Total. Environ. 408, 2733, 2010.
13. FALANDYSZ J., KUNITO T., KUBOTA R., LIPKA K., MAZUR A., FALANDYSZ J.J., TANABE S. Selected elements in Fly Agaric Amanita muscaria. J. Environ. Sci. Heal. A. 42, 1615, 2007.
14. FALANDYSZ J., KUNITO T., KUBOTA R., BIELAWSKI L., FRANKOWSKA A., FALANDYSZ J.J., TANABE S. Multivariate characterization of elements accumulated in King Bolete Boletus edulis mushroom at lowland and high mountain regions. J. Environ. Sci. Heal. A. 43, 1692, 2008.
15. FALANDYSZ J., KUNITO T., KUBOTA R., GUCIA M., MAZUR A., FALANDYSZ J.J., TANABE S. Some mineral constituents of Parasol Mushroom Macrolepiota procera. J. Environ. Sci. Heal. B. 43, 187, 2008.
16. ISILDAK O., TÜRKEKUL I., ELMSTAŞ M., ABOUL-ENEIN H. Bioaccumulation of heavy metals in some wild-grown edible mushrooms. Anal. Lett. 40, 1099, 2007.
17. LI T., WANG Y.Z., ZHANG J., ZHAO Y.L., LIU H. Trace element content of Boletus tomentipes mushroom collected from Yunnan, China. Food Chem. 127, 1828, 2011.
18. FALANDYSZ J., BOROVIČKA J. Macro and trace mineral constituents and radionuclides in mushrooms – health ben-efits and risks. Appl. Microbiol. Biot. 97, 477, 2013.
19. FALANDYSZ J., ZALEWSKA T., KRASIŃSKA G., APA-NEL A., WANG Y., PANKAVEC S. Evaluation of the radio-active contamination in Fungi genus Boletus in the region of Europe and Yunnan Province in China. App. Microbiol. Biot. 99, 8217, 2015.
20. SANIEWSKI M., ZALEWSKA T., KRASIŃSKA G., SZYLKE N., WANG Y., FALANDYSZ J. 90Sr in King Bo-lete Boletus edulis and certain other mushrooms consumed in Europe and China. Sci. Total Environ. 543, 287, 2016.
21. DA SILVA J.A.L., FRAÚSTO DA SILVA J.J.R., POM-BEIRO A.J.L. Amavadin, a vanadium natural complex: Its role and applications. Coordin. Chem. Rev. 257, 2388, 2013.
22. STIJVE T., VELLINGA E.C., HERRMANN A. Arsenic ac-cumulation in some higher fungi. Persoonia. 14, 161, 1990.
23. ZHANG J., LI T., YANG Y., LIU H., WANG W. Arsenic concentrations and associated health risks in Laccaria mushrooms from Yunnan (SW China). Biol. Trace. Elem. Res. 164, 261, 2015.
24. STIJVE T., NOORLOOS T., BYRNE A.R., ŠLEJKOVEC Z., GOESSLER W. High selenium levels in edible Albatrellus mushroom. Deut. Lebensm.-Rundsch. 94, 275, 1998.
25. BOROVIČKA J., ŘANDA Z., JELÍNEK E., KOTRBA P., DUNN C.E. Hyperaccumulation of silver by Amanita strobiliformis and related species of the section Lepidella. Mycol. Res. 111, 1339, 2007.
26. FALANDYSZ J., DANISIEWICZ D. Bioconcentration fac-tors (BCF) of silver in wild Agaricus campestris. B. Environ. Contam. Tox. 55, 122, 1995.
27. FALANDYSZ J., BONA H., DANISIEWICZ D. Silver con-tent of wild-grown mushrooms from northern Poland. Z. Lebensm. Unters. For. 199, 222, 1994.
28. FALANDYSZ J., BONA H., DANISIEWICZ D. Silver up-take by Agaricus bisporus from an artificially enriched sub-strate. Z. Lebensm. Unters. For. 199, 225, 1994.
29. KOJTA A.K., JARZYŃSKA G., FALANDYSZ J. Mineral composition and heavy metals accumulation capacity of Bay Bolete’s (Xerocomus badius) fruiting bodies collected near a former gold and copper mining area. J. Geochem. Explor. 121, 76, 2012.
30. OSOBOVÁ M., URBAN V., JEDELSKÝ P.L., BOROVIČKA J., GRYNDLER M., RUM T., KOTRBA P. Three metallothionein isoforms and sequestration of intracellular silver in the hyperaccumulator Amanita strobiliformis. New. Phytol. 190, 916, 2011.
31. ALONSO J., SALGADO M.J., GARCIÁ M.Á, MELGAR M.J. Accumulation of mercury in edible macrofungi: Influ-ence of some factors. Arch. Environ. Con. Tox. 44, 158, 2000.
32. CHOJNACKA A., JARZYŃSKA G., DREWNOWSKA M., NNOROM I.C., FALANDYSZ J. Mercury in Yellow-cracking Boletes Xerocomus subtomentosus mushrooms and soils from spatially diverse sites: Assessment of bioconcentration potential by species and human intake. J. Environ. Sci. Heal. A. 47, 2094, 2012.
33. FALANDYSZ J., GUCIA M., FRANKOWSKA A., KAWA-NO M., SKWARZEC B. Total mercury in wild mushrooms and underlying soil substrate from the city of Umeå and its surroundings, Sweden. B. Environ. Contam. Tox. 67, 763, 2001.
34. FALANDYSZ J., BIELAWSKI L., KANNAN K., GUCIA M., LIPKA K., BRZOSTOWSKI A. Mercury in wild mush-rooms and underlying soil substrate from the great lakes land in Poland. J. Environ. Monitor. 4, 473, 2002.
35. FALANDYSZ J., GUCIA M., BRZOSTOWSKI A., KAWANO M., BIELAWSKI L., FRANKOWSKA A., WYRZYKOWSKA B. Content and bioconcentration of mercury in mushrooms from northern Poland. Food. Addit. Contam. 20, 247, 2003.
36. FALANDYSZ J., KOJTA A.K., JARZYŃSKA G., DRE-WNOWSKA M., DRYŻAŁOWSKA A., WYDMAŃSKA D., KOWALEWSKA I., WACKO A., SZLOSOWSKA M., KANNAN K., SZEFER P. Mercury in Bay Bolete Xeroco-mus badius: bioconcentration by fungus and assessment of element intake by humans eating fruiting bodies. Food. Addit. Contam. A. 29, 951, 2012.
37. FALANDYSZ J., KOWALEWSKA I., NNOROM I.C., DREWNOWSKA M., JARZYŃSKA G. Mercury in Red Aspen Boletes (Leccinum aurantiacum) mushrooms and the soils. J. Environ. Sci. Heal. A. 47, 1695, 2012.
2460 Kojta A.K., et al.
38. FALANDYSZ J., WIDZICKA E., KOJTA A.K., JARZYŃSKA G., DREWNOWSKA M., DANISIEWICZ-CZUPRYŃSKA D., DRYŻAŁOWSKA A., LENZ E., NNOROM I.C. Mercury in Common Chanterelles mush-rooms: Cantharellus spp. update. Food Chem. 133, 842, 2012.
39. FALANDYSZ J., KRASIŃSKA G., PANKAVEC S., NNO-ROM I.C. Mercury in certain Boletus mushrooms from Po-land and Belarus. J. Environ. Sci. Heal. B. 49, 690, 2014.
40. MELGAR M.J., ALONSO J., GARCİA M.Á. Mercury in edible mushrooms and soil. Bioconcentration factors and toxicological risk. Sci. Total Environ. 407, 5328, 2009.
41. COCCHI L., VESCOVI L., PETRINI L., PETRINI O. Heavy metals in edible mushrooms in Italy. Food Chem. 98, 277, 2006.
42. NNOROM I.C., JARZYŃSKA G., FALANDYSZ J., DREWNOWSKA M., OKOYE I., OJI-NNOROM CH.G. Occurrence and accumulation of mercury in two species of wild grown Pleurotus mushrooms from Southeastern Nige-ria. Ecotox. Environ. Safe. 84, 78, 2012.
43. RIEDER S.R., BRUNNER I., HORVAT M., JACOBS A., FREY B. Accumulation of mercury and methylmercury by mushrooms and earthworms from forest soils. Environ. Pol-lut. 159, 2861, 2011.
44. SVOBODA L., KALAČ P. Contamination of two edible Agaricus spp. mushrooms growing in a town with cadmium, lead, and mercury. B. Environ. Contam. Tox. 71, 123, 2003.
45. VETTER J., STILLER I. Ásványi anyagok mennyiségé-nek alakulása a gomba terötestben (Macrolepiota procera). Mikolódiai Közlemények. 36, 33, 1977.
46. ZIMMERMANNOVA K., SVOBODA L., KALAČ P. Mer-cury, cadmium, lead and copper contents in fruiting bodies of selected edible mushrooms in contaminated Middle Spiš region. Ekologia (Bratislava). 20, 440, 2001.
47. ALOUPI M., KOUTROTSIOS G., KOULOUSARIS M., KALOGEROPOULOS N. Trace metal contents in wild edible mushrooms growing on serpentine and volcanic soils on the island of Lesvos, Greece. Ecotox. Environ. Safe. 78, 184, 2011.
48. FALANDYSZ J., DREWNOWSKA M., JARZYŃSKA G., ZHANG D., ZHANG Y., WANG J. Mineral constituents in Common Chanterelles and soils collected from a high mountain and lowland sites in Poland. J Mt Sci-Engl 9, 6975, 2012.
49. ŘANDA Z., KUČERA J. Trace elements in higher fungi (mushrooms) determined by activation analysis. J. Radio-anal. Nucl. Ch. 259, 99, 2004.
50. BRZOSTOWSKI A., FALANDYSZ J., JARZYŃSKA G., ZHANG D. Bioconcentration potential of metallic elements by Poison Pax (Paxillus involutus) mushroom. J. Environ. Sci. Heal. A. 46, 378, 2011.
51. BRZOSTOWSKI A., JARZYŃSKA G., KOJTA A.K., WYDMAŃSKA D., FALANDYSZ J. Variations in metal levels accumulated in Poison Pax (Paxillus involutus) mush-room collected at one site over four years. J. Environ. Sci. Heal. A. 46, 581, 2011.
52. JARZYŃSKA G., FALANDYSZ J. The determination of mercury in mushrooms by CV-AAS and ICP-OES tech-niques. J. Environ. Sci. Heal. A. 46, 569, 2011.
53. MILES P.G., CHANG S.-T., Mushroom Biology: Concise Basics and Current Developments, World Scientific Publishing Company, Singapore, 1997.
54. BAPTISTA P., FERREIRA S., SOARES E., COELHO V., DE LOURDES BARTOS M. Tolerance and stress response of Macrolepiota procera to nickel. J. Agr. Food. Chem. 57, 7145, 2009.
55. FALANDYSZ J., CHWIR A. The concentrations and bioconcentration factors of mercury in mushrooms from the Mierzeja Wiślana sand-bar, Northern Poland. Sci. Total. Environ. 203, 221, 1997.
56. FALANDYSZ J., GUCIA M., MAZUR A. Content and bio-concentration factors of mercury by Parasol Mushroom Mac-rolepiota procera. J. Environ. Sci. Heal. B. 42, 735, 2007.
57. GIANNACCINI G., BETTI L., PALEGO L., MASCIA G., SCHMID L., LANZA M., MELA A., FABBRINI L., BIONDI L., LUCACCHINI A. The trace element content of top-soil and wild edible mushroom samples collected in Tus-cany, Italy. Environ. Monit. Assess. 184, 7579, 2012.
58. GUCIA M., JARZYŃSKA G., KOJTA A.K., FALANDYSZ J. Temporal variability in twenty chemical elements con-tent of Parasol Mushroom (Macrolepiota procera) collected from two sites over a few years. J. Environ. Sci. Heal. B. 47, 81, 2012.
59. JECFA. Joint FAO/WHO Expert Committee on Food Addi-tives. Seventy-second meeting. Rome, 16-25 February 2010. Summary and Conclusions. JECFA/72/SC. Food and Ag-riculture Organization of the United Nations World Health Organization; Issued 16th March 2010.
60. EPA. Peer Workshop on Mercury Issues. Summary Report. Environmental Criteria and Assessment Office. Cincinnati, OH: US Environment Protection Agency; October 26, 1987.
61. RALSTON N.V.C., RAYMOND L.J. Dietary selenium’s protective effects against methylmercury toxicity. Toxicol-ogy. 278, 112, 2010.
62. FALANDYSZ J. Selenium in edible mushrooms. J. Environ. Sci. Heal. C. 26, 256, 2008.
63. JECFA. Evaluation of certain food additives and contaminants (Sixty-first report of the Joint FAO/WHO Expert Committee on Food Additives). WHO food additives series, No 58, World Health Organization, Geneva, 2007.
64. BARGAGLI R., BALDI F. Mercury and methyl mercury in higher fungi and their relation with substrata in a cinnabar mining area. Chemosphere 13, 1059, 1984.
65. WHO. World Health Organization, Safety evaluation of certain food additives and contaminants. Food Additive Series No. 52. Joint FAO/WHO Expert Committee on Food Additives, Geneva, Switzerland, 2003.
66. WHO. Evaluation of certain food additives and contaminants. Seventy-third report of the Joint FAO/WHO Expert Committee on Food Additives, WHO Technical Report Series 960, 2011.
67. EFSA. Cadmium in food. Resource document. European Food Safety Authority, 2009. Accessed 10 May 2015.
68. h t t p : / / w w w. e f s a . e u r o p a . e u / c s / B l o b S e r v e r /Scientific_Opinion/contam_op_ej980_cadmium_en_rev.1.pdf?ssbinary=true/.
69. EC. Commission Regulation (EC) No. 629/2008 of 2 July 2008 amending Regulation (EC) No. 1881/2006 setting maximum levels for certain contaminants in foodstuffs. Official Journal of the European Union L 173, 6, 2008.
70. WHO. World Health Organization. Evaluation of certain food additives and contaminants, 41st Report of the Joint FAO/WHO Expert Committee on Food Additives. Technical Report Series No. 837, Geneva, Switzerland, 1993.