ORIGINAL RESEARCH Interorganizational Relationships Within ... · Luke D. Interorganizational...
25
VOLUME 1: NO. 4 OCTOBER 2004 Interorganizational Relationships Within State Tobacco Control Networks: A Social Network Analysis ORIGINAL RESEARCH Suggested citation for this article: Krauss M, Mueller N, Luke D. Interorganizational relationships within state tobacco control networks: a social network analysis. Prev Chronic Dis [serial online] 2004 Oct [date cited]. Available from: URL: http://www.cdc.gov/pcd/issues/2004/oct/ 04_0041.htm. PEER REVIEWED Abstract Introduction State tobacco control programs are implemented by net- works of public and private agencies with a common goal to reduce tobacco use. The degree of a program’s compre- hensiveness depends on the scope of its activities and the variety of agencies involved in the network. Structural aspects of these networks could help describe the process of implementing a state’s tobacco control program, but have not yet been examined. Methods Social network analysis was used to examine the struc- ture of five state tobacco control networks. Semi-struc- tured interviews with key agencies collected quantitative and qualitative data on frequency of contact among net- work partners, money flow, relationship productivity, level of network effectiveness, and methods for improvement. Results Most states had hierarchical communication structures in which partner agencies had frequent contact with one or two central agencies. Lead agencies had the highest con- trol over network communication. Networks with denser communication structures had denser productivity struc- tures. Lead agencies had the highest financial influence within the networks, while statewide coalitions were financially influenced by others. Lead agencies had highly productive relationships with others, while agencies with narrow roles had fewer productive relationships. Statewide coalitions that received Robert Wood Johnson Foundation funding had more highly productive relation- ships than coalitions that did not receive the funding. Conclusion Results suggest that frequent communication among network partners is related to more highly productive rela- tionships. Results also highlight the importance of lead agencies and statewide coalitions in implementing a com- prehensive state tobacco control program. Network analy- sis could be useful in developing process indicators for state tobacco control programs. Introduction Tobacco control activities in the United States predom- inately occur in highly complex, comprehensive state tobacco control programs. These programs are usually considered comprehensive based on the scope of activities implemented to reduce tobacco use. For example, as out- lined in the Centers for Disease Control and Prevention’s (CDC’s) Best Practices for Comprehensive Tobacco Control Programs — August 1999, a comprehensive pro- gram should include some level of activity in community programs, chronic disease programs, school programs, enforcement, statewide programs, counter-marketing, cessation programs, surveillance and evaluation, and administration and management (1). The opinions expressed by authors contributing to this journal do not necessarily reflect the opinions of the U.S. Department of Health and Human Services, the Public Health Service, the Centers for Disease Control and Prevention, or the authors’ affiliated institutions. Use of trade names is for identification only and does not imply endorsement by any of the groups named above. www.cdc.gov/pcd/issues/2004/oct/04_0041.htm • Centers for Disease Control and Prevention 1 Melissa Krauss, MPH, Nancy Mueller, MPH, Douglas Luke, PhD
Transcript of ORIGINAL RESEARCH Interorganizational Relationships Within ... · Luke D. Interorganizational...
VOLUME 1: NO. 4 OCTOBER 2004
Interorganizational Relationships WithinState Tobacco Control Networks: A Social
Network Analysis
ORIGINAL RESEARCH
Suggested citation for this article: Krauss M, Mueller N,Luke D. Interorganizational relationships within statetobacco control networks: a social network analysis. PrevChronic Dis [serial online] 2004 Oct [date cited]. Availablefrom: URL: http://www.cdc.gov/pcd/issues/2004/oct/04_0041.htm.
PEER REVIEWED
Abstract
IntroductionState tobacco control programs are implemented by net-
works of public and private agencies with a common goalto reduce tobacco use. The degree of a program’s compre-hensiveness depends on the scope of its activities and thevariety of agencies involved in the network. Structuralaspects of these networks could help describe the processof implementing a state’s tobacco control program, buthave not yet been examined.
MethodsSocial network analysis was used to examine the struc-
ture of five state tobacco control networks. Semi-struc-tured interviews with key agencies collected quantitativeand qualitative data on frequency of contact among net-work partners, money flow, relationship productivity, levelof network effectiveness, and methods for improvement.
ResultsMost states had hierarchical communication structures
in which partner agencies had frequent contact with one ortwo central agencies. Lead agencies had the highest con-trol over network communication. Networks with denser
communication structures had denser productivity struc-tures. Lead agencies had the highest financial influencewithin the networks, while statewide coalitions werefinancially influenced by others. Lead agencies had highlyproductive relationships with others, while agencies withnarrow roles had fewer productive relationships.Statewide coalitions that received Robert Wood JohnsonFoundation funding had more highly productive relation-ships than coalitions that did not receive the funding.
ConclusionResults suggest that frequent communication among
network partners is related to more highly productive rela-tionships. Results also highlight the importance of leadagencies and statewide coalitions in implementing a com-prehensive state tobacco control program. Network analy-sis could be useful in developing process indicators forstate tobacco control programs.
Introduction
Tobacco control activities in the United States predom-inately occur in highly complex, comprehensive statetobacco control programs. These programs are usuallyconsidered comprehensive based on the scope of activitiesimplemented to reduce tobacco use. For example, as out-lined in the Centers for Disease Control and Prevention’s(CDC’s) Best Practices for Comprehensive TobaccoControl Programs — August 1999, a comprehensive pro-gram should include some level of activity in communityprograms, chronic disease programs, school programs,enforcement, statewide programs, counter-marketing,cessation programs, surveillance and evaluation, andadministration and management (1).
The opinions expressed by authors contributing to this journal do not necessarily reflect the opinions of the U.S. Department of Health and Human Services,the Public Health Service, the Centers for Disease Control and Prevention, or the authors’ affiliated institutions. Use of trade names is for identification only
and does not imply endorsement by any of the groups named above.
www.cdc.gov/pcd/issues/2004/oct/04_0041.htm • Centers for Disease Control and Prevention 1
Melissa Krauss, MPH, Nancy Mueller, MPH, Douglas Luke, PhD
VOLUME 1: NO. 4OCTOBER 2004
Many activities are said to be included in a comprehen-sive program, which suggests many organizations must beinvolved. Therefore, a state tobacco control program’s com-prehensiveness refers not only to its activities but also toits multifaceted structure. Tobacco control programs havecomplicated and ambitious goals that cannot be achievedsolely by one agency, but through the efforts of many agen-cies. While usually led by a state department of health oran independent tobacco control agency, a state’s effortsinvolve a wide range of other stakeholders, such as con-tractors with the lead agency, regional and statewide coali-tions, and voluntary agencies. These agencies attempt towork in partnership toward their common goal of reducingtobacco use in their state through strategic planning, poli-cy implementation, prevention and cessation activities,and advocacy. Collaboration and coordination are essen-tial parts of this process. Collaboration between publichealth groups and private organizations has been arguedto be an effective tool for advancing a variety of tobaccocontrol initiatives (2). In fact, the creation of public andprivate partnerships and the development of a sharedleadership model were cited as some of the key contribut-ing factors to providing the foundation for a coordinatedapproach in the evolution of the Massachusetts TobaccoControl Program (3).
Typically, evaluations of state programs have concen-trated on the effectiveness of tobacco control activities indecreasing tobacco use (4-10). State programs have alsobeen evaluated on program inputs, such as the level offunding the state has dedicated to its tobacco control pro-gram (11-13), the strength of the state’s tobacco controlpolicies (14,15), or, to a lesser extent, political and finan-cial climates and measures of organizational capacity (16).Because collaboration is an important component of astate’s program, the relationships among the agencieswithin the network should also be evaluated to helpdescribe the process of implementing a coordinated andcomprehensive tobacco control program. A well-connectedtobacco control network could improve a state’s tobaccocontrol effort through more efficient and effective use ofknowledge and resources. However, to our knowledge, theinterorganizational structures and relationships of statetobacco control networks have not yet been examined.
Social network analysis is a particularly useful quanti-tative analytic method that can be used to examine rela-tionships among social entities, such as the various agen-cies involved in a state’s tobacco control program. This
type of analysis can be used to address such questions ashow hierarchical a communication structure is, or whichentities have more control over information or resourcesthan others in the network. Social network analysis hasbeen used in a wide range of social and behavioral sciencedisciplines, including tobacco behavior research, to studythe influences of peer group social structure on youthsmoking (17-21). This technique has also been used toexamine the structure of interorganizational relationsand how that structure can influence organizationalbehavior (22). Social network analysis has helped explainthe relationship between how central an organization iswithin a network and how powerful it is. It also explainsthe relationship between how the structure of interorga-nizational relations influences an organization’s strate-gies and political behavior and how the organizationsecures resources (22). Social network analysis has beenused in a wide variety of areas to describe interorganiza-tional relationships, including those addressing healthand policy. For example, social network analysis was usedto investigate the structure of the Canadian women’smovement by studying relationships among nationalwomen’s groups; to study relationships among stakehold-er organizations in the mental health policy area; toexamine interorganizational relations among HIV/AIDSservice agencies; and to analyze the network of servicesfor pregnant low-income women (23-26).
The purpose of this study is to examine the interorgani-zational relationships of state tobacco control networksusing social network analysis. Our study adds to the liter-ature on the evaluation of state tobacco control programsby leading to a greater understanding of the intricacies andcomplexities of tobacco control networks. Specific objectivesof the study are to 1) examine relationships among tobaccocontrol agencies within state programs based on their com-munication, productivity, and exchange of funding, 2) iden-tify the most important actors within the tobacco controlnetworks and describe how they relate to other actors, and3) investigate the structure of tobacco control networks bycomparing and contrasting five state network structures.
Methods
Project overview
The Center for Tobacco Policy Research is conducting amultiyear process evaluation on the status of 10 state
2 Centers for Disease Control and Prevention • www.cdc.gov/pcd/issues/2004/oct/04_0041.htm
The opinions expressed by authors contributing to this journal do not necessarily reflect the opinions of the U.S. Department of Health and Human Services,the Public Health Service, the Centers for Disease Control and Prevention, or the authors’ affiliated institutions. Use of trade names is for identification only
and does not imply endorsement by any of the groups named above.
tobacco control programs. A cross-sectional study designwas used to evaluate the process of organizing and con-ducting statewide tobacco prevention activities. One of thespecific objectives of the study was to examine the interor-ganizational relationships of the tobacco control network.
Sample
To obtain a diverse sample of states, states were select-ed based on 1) geographic location; 2) level of programcapacity (e.g., funding level, age of program); 3) presence oftobacco farming; and 4) type of lead agency (state healthdepartments or independent organization). The 10 select-ed states thus represented a variety of tobacco control pro-grams from across the country. This paper presents thenetwork analysis results from the first set of states evalu-ated: Washington (evaluated June 2002), Indiana (July2002), Wyoming (October 2002), New York (December2002), and Michigan (February 2003).
A modified fixed-list sampling method was implemented to identify the key partner agencies of eachstate tobacco control program (27). The tobacco controlmanager from the lead agency was first contacted andasked to compile a list of partners that contributed substantially to the program or had a unique role. Theresearch team and the tobacco control manager then discussed the list to finalize the number of agencies andindividuals who would be invited to participate in an interview. The statewide coalition director verified thatall major agencies were represented. During the inter-views, each agency was asked questions about the otheragencies in the network. Individuals interviewed also had an opportunity to suggest additional participants. Theaverage number of agencies interviewed within each state was 14.
Data collection
For each agency in the tobacco control program, a keyinformant was identified and asked to participate in aninterview. This key informant was the staff member mostfamiliar with the agency’s tobacco control activities. Thesemi-structured in-depth interview collected quantitativeand qualitative data on network characteristics, politicalsupport for tobacco control, the financial climate of thestate, use of the CDC’s Best Practices for ComprehensiveTobacco Control Programs, and organizational capacity.Trained interview teams conducted the interviews either
in person or over the telephone. Approximately 54% of theinterviews were conducted in person. The average interview lasted 73 minutes.
Quantitative network measures
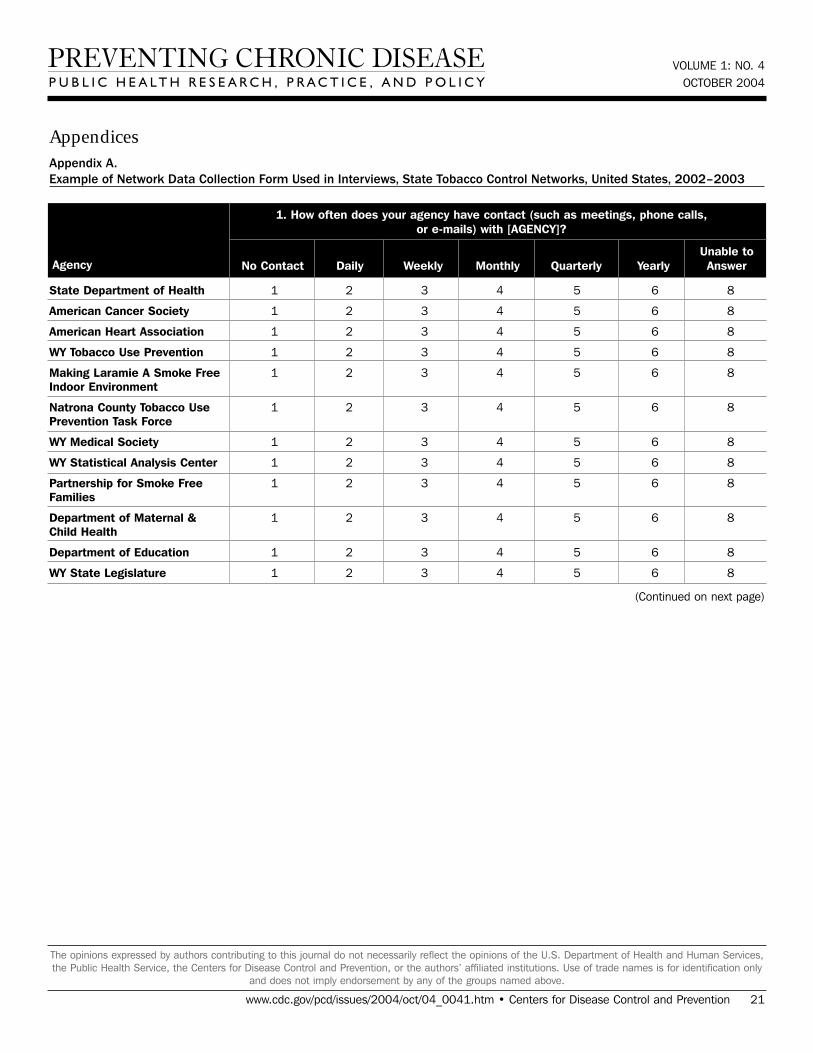
Throughout the interviews, we collected data about eachagency’s interaction with other agencies within the net-work. The quantitative relational constructs measuredwere the frequency of contact (through meetings, phonecalls, or e-mails) among agencies, the flow of money amongagencies, and the perceived productivity of agency rela-tionships. Appendix A shows an example of the networkdata collection form for one state. Each participant wasasked questions about each partner agency in the state’stobacco control network. We followed typical social net-work analysis procedures to prepare data for analysis (28).Missing values were indicated when participants felt theywere unable to answer the question because of limited con-tact or knowledge.
For contact frequency, if multiple respondents wereinterviewed from one agency (which usually only occurredwith the lead agency), we averaged respondent values toproduce one final value. When one response was missingfor a pair of agencies, we used the response given by theother agency. Although not ideal, this type of imputationof missing network data is common. Basic network meas-ures such as betweenness have been shown to be reliablewith as much as 25% missing data (29). Answers wereaveraged from each pair of agencies to determine one levelof contact. This is important because although individualreports of contact level may vary, it was assumed thatinteragency contact was symmetric. That is, if Agency Ahad a meeting with Agency B, this naturally means thatAgency B met with Agency A. We then dichotomized theaverage score into “at least monthly contact” and “lessthan monthly contact.”
For money flow, if multiple respondents were inter-viewed from one agency, we used the responses given bythe most senior staff member interviewed. When disagree-ment arose on the perception of money exchange betweena pair of agencies, we contacted each agency to determinethe correct response. If one response was missing for a pairof agencies, we used the response given by the otheragency in the pair. The money construct was dichotomizedinto “send money” or “do not send money.”
VOLUME 1: NO. 4OCTOBER 2004
www.cdc.gov/pcd/issues/2004/oct/04_0041.htm • Centers for Disease Control and Prevention 3
The opinions expressed by authors contributing to this journal do not necessarily reflect the opinions of the U.S. Department of Health and Human Services,the Public Health Service, the Centers for Disease Control and Prevention, or the authors’ affiliated institutions. Use of trade names is for identification only
and does not imply endorsement by any of the groups named above.
VOLUME 1: NO. 4OCTOBER 2004
For relationship productivity, if multiple respondentswere interviewed from one agency, we averaged respon-dent values to produce one final value. When one responsewas missing for a pair of agencies, we used the responsegiven by the other agency. When both responses weremissing, we chose “neutral” as the response. This decisionwas made so that we would not lose the entire node in thenetwork, nor make any assumptions on the direction of theresponse, given no data from either partner. Wedichotomized the scores into “very productive” relation-ships, the highest possible productivity response, and “notvery productive” relationships, which includes “counter-productive,” “very unproductive,” “somewhat unproduc-tive,” “neutral,” and “somewhat productive.”
Social network analysis
We performed the social network analysis using graphicand statistical methods. Graphs based on each of the threeconstructs described above (contact frequency, money flow,and relationship productivity) were created to visuallydepict the relationships in each network. Statistical analy-ses provided measures both at the agency and network lev-els. Graph construction and social network analyses wereconducted using UCINET Social Network AnalysisSoftware Version 6 (Analytic Technologies, Inc, Harvard,Mass), Pajek Program for Large Network Analysis (Vlado,Ljubljana, Slovenia), and NetDraw Network Visualization(Analytic Technologies, Inc, Harvard, Mass).
Contact frequencyOne important use of social network analysis is to iden-
tify the most important actors in a network, which areconsidered to be in strategic locations within the network(28). Our measure of contact frequency is nondirectional,meaning that the relation between two actors in the net-work holds simultaneously for both actors. So, if AgencyA has contact with Agency B at least monthly, thenAgency B must also have contact with Agency A. Oneway to determine the important actors with this type ofrelation is to examine centrality using the measure ofbetweenness. We examined the normalized betweennessof each actor (30).
Flow of moneyExchange of money among network partners was a
directional relation, meaning that the tie between twoactors has an origin and a destination. In this case,Agency A may send money to Agency B, but not neces-
sarily vice versa. For this construct, we used Taylor’sinfluence to measure the amount of financial influence ofone agency over another (31). (Appendix B providesmore information on Taylor’s influence.) A negativeinfluence value indicates that an agency had a prepon-derance of receiving over sending money to other agen-cies in the network, a positive value indicates a prepon-derance of sending over receiving, and a neutral valueindicates a balance of sending and receiving.
Relationship productivityOur productivity variable was also a directional rela-
tion. Agency A may feel they have a productive relation-ship with Agency B, but the feeling may not be mutual.A common way of identifying prominent actors in adirectional relation is by examining prestige, which wemeasured using normalized indegree (28). (See
4 Centers for Disease Control and Prevention • www.cdc.gov/pcd/issues/2004/oct/04_0041.htm
The opinions expressed by authors contributing to this journal do not necessarily reflect the opinions of the U.S. Department of Health and Human Services,the Public Health Service, the Centers for Disease Control and Prevention, or the authors’ affiliated institutions. Use of trade names is for identification only
and does not imply endorsement by any of the groups named above.
Glossary
For the discussion in this article, these nontechnical networkanalysis definitions may be useful (28):
Connectedness: A network graph is connected if there is a pathor tie between every pair of actors in the graph. Therefore, allpairs of actors are reachable in a connected graph.
Density is defined here as the proportion of possible lines or tiesthat are actually present in a network graph. Because it repre-sents a proportion, density ranges from 0 to 1.
Centrality provides a measure of how central an actor is within anetwork. Actors that are highly central are interpreted as control-ling the flow of information or resources within the network.
Betweenness is a measure of centrality based on how often anactor in a network is found in the shortest pathway betweenother actors in the network. The equation for normalizedbetweenness can be found in Appendix B. It is used in this studyto evaluate frequency of contact and control over network com-munication. Higher scores indicate higher control.
Prestige is a value that is commonly examined in a directionalrelationship as a way to identify prominent actors in a network. Aprestigious or prominent actor is one that is the object or recipi-ent of many ties in the network.
Normalized indegree is used to measure prestige; it indicatesthe number of directional ties terminating at or pointing towardan actor. A higher indegree score indicates higher prestige.
Appendix B for definition and equation.) In our study, aprominent or prestigious agency would be one withwhom many others felt they had highly productive rela-tionships. A higher indegree score indicates higher pres-tige.
Group-level indicesIn addition to the actor-level measures described
above, we also examined some group-level indices tofacilitate comparisons across networks and states. Agroup betweenness centralization index was calculatedfor each contact frequency network, which indicatesvariability of the betweenness of members of the net-work. A high betweenness centralization score indicatesa hierarchical network structure, where it is more likelythat a single agency in the network is quite central,while remaining agencies are less central. We did notexamine a group-level index for prestige because littleresearch has been done to adequately develop and vali-date network-level prestige indices (28). We also exam-ined the density of each network for contact frequency,relationship productivity, and money flow. Density indi-cates the proportion of all possible ties that are actuallypresent in the network. The above constructs were alsocompared with other state network variables, such asfunding level, receipt of The Robert Wood JohnsonFoundation (RWJF) Smokeless States grants, and loca-tion of partner agencies.
Qualitative network measures and analysis
Qualitative network constructs were collected viaopen-ended questions about the perceived effectivenessof the state’s tobacco control network and suggestions formethods to improve the network’s effectiveness. Eachinterview was transcribed verbatim and imported intothe qualitative data management software NUD*IST(QSR International Pty Ltd, Melbourne, Australia).Each transcript was then coded using a detailed code-book developed during the pilot test by two trained staffmembers. Inter-rater reliability for coding was 83.7%.The coded text units were entered into NUD*IST, and areport was generated for each construct (e.g., network,financial climate). Analysis teams consisting of twotrained staff members independently analyzed thereports to identify major themes or ideas. The team thenmet to discuss the results and arrive at consensus onmajor themes.
Results
Basic network characteristics
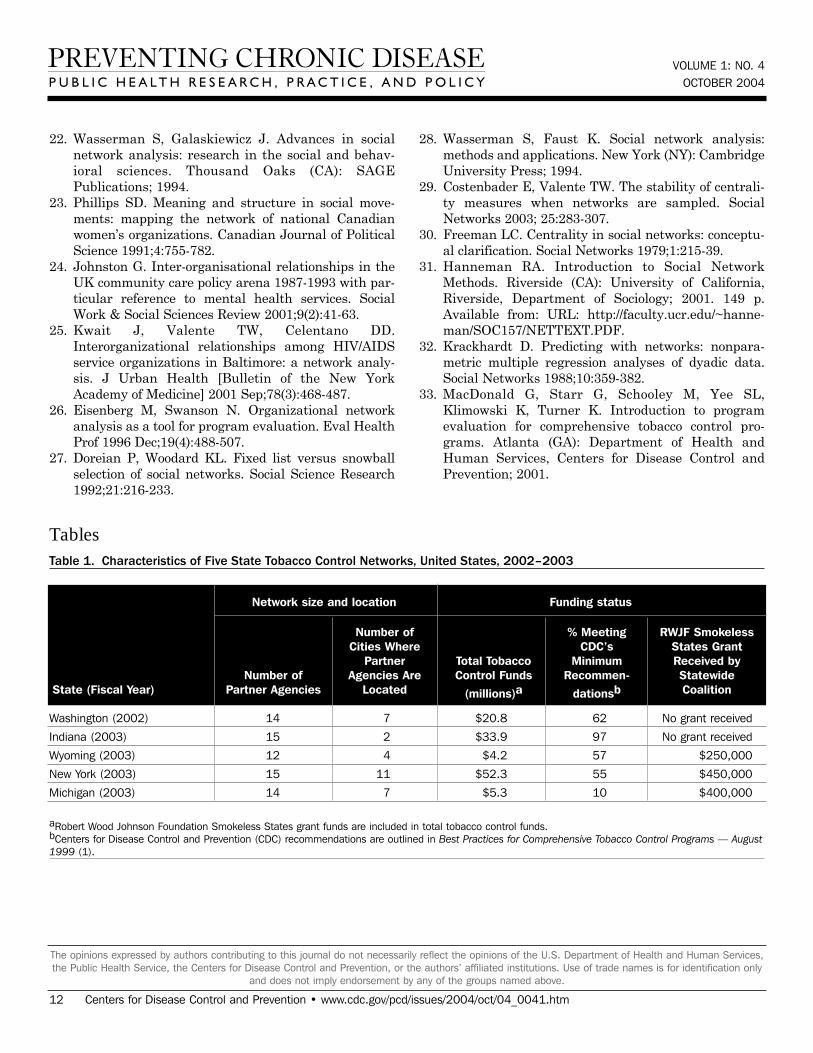
The five state tobacco control programs represented avariety of funding levels, network sizes, and geographiclocations (Table 1). Annual funding levels for entirestate programs ranged from $4.2 million (Wyoming, fis-cal year 2003) to $52.3 million (New York, fiscal year2003). According to the CDC’s minimum recommenda-tions for state tobacco control funding (1), Michigan hadlow funding (10% of CDC’s recommendation), New York,Wyoming and Washington had middle funding levels(55%, 57%, and 62%), and Indiana had a high fundinglevel (97%). Three of the statewide coalitions received aSmokeless States grant from the RWJF at the time ofthe evaluation. The average number of partner agenciesper state network was 14, and the number of citieswhere partner agencies were located ranged from a few(two in Indiana) to as many as 11 (New York).
Four of the tobacco control networks were led by thetobacco control program within the state’s department ofhealth. The exception was Indiana’s program, which wasled by an independent tobacco control agency. Leadagencies usually included as key partners in the net-work were voluntary agencies, advocacy agencies,statewide and regional coalitions, and contractors withthe lead agency. Partner agencies unique to some statesincluded government agencies, political figures, trustfund agencies, media firms, and funding agencies.(Appendix C lists agencies, along with their abbrevia-tions, included in each state network.)
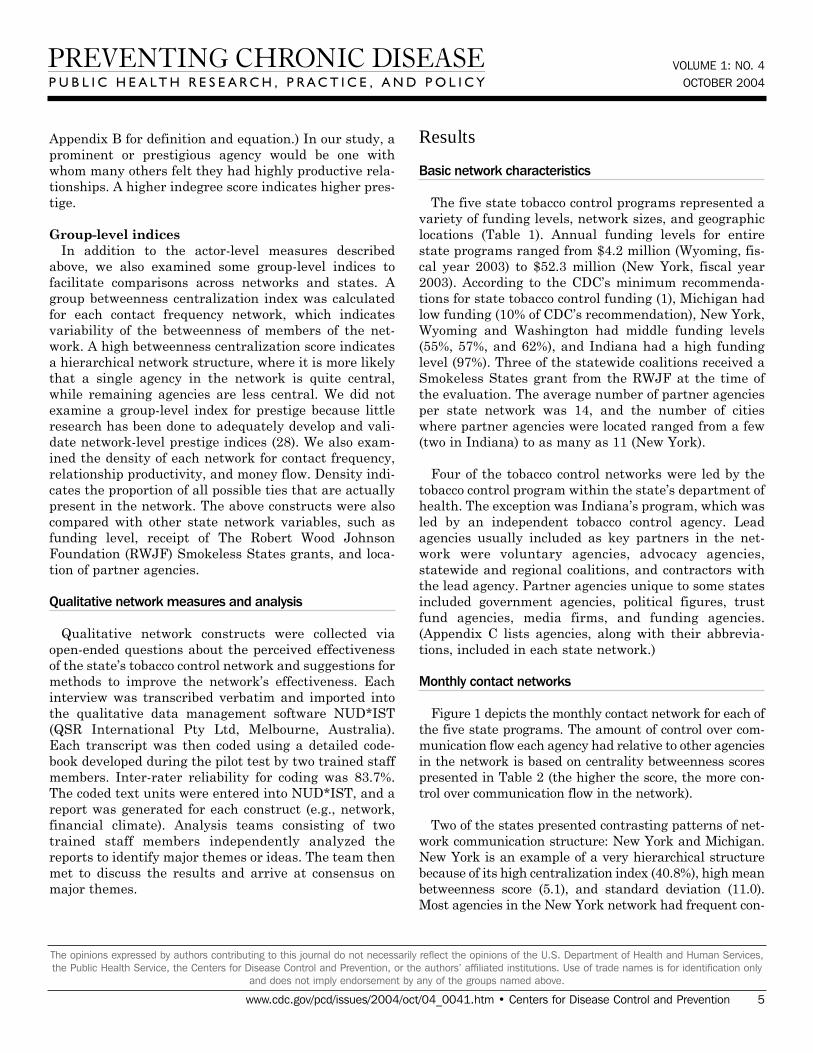
Monthly contact networks
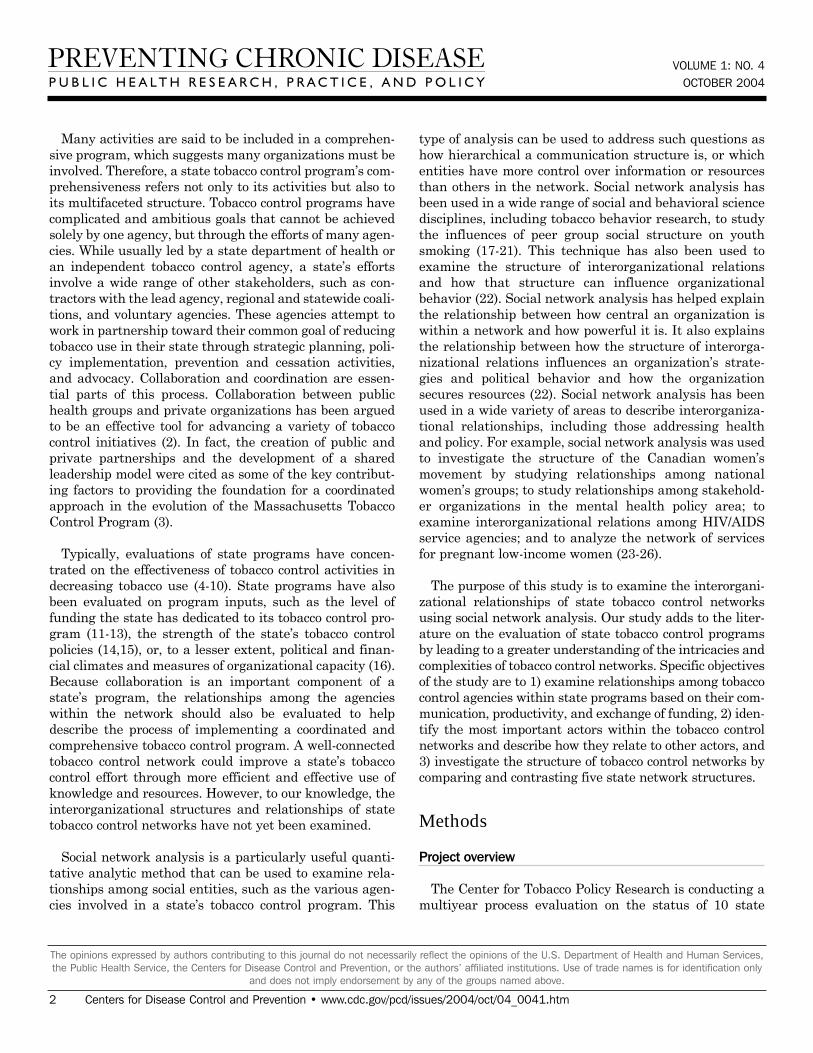
Figure 1 depicts the monthly contact network for each ofthe five state programs. The amount of control over com-munication flow each agency had relative to other agenciesin the network is based on centrality betweenness scorespresented in Table 2 (the higher the score, the more con-trol over communication flow in the network).
Two of the states presented contrasting patterns of net-work communication structure: New York and Michigan.New York is an example of a very hierarchical structurebecause of its high centralization index (40.8%), high meanbetweenness score (5.1), and standard deviation (11.0).Most agencies in the New York network had frequent con-
VOLUME 1: NO. 4OCTOBER 2004
www.cdc.gov/pcd/issues/2004/oct/04_0041.htm • Centers for Disease Control and Prevention 5
The opinions expressed by authors contributing to this journal do not necessarily reflect the opinions of the U.S. Department of Health and Human Services,the Public Health Service, the Centers for Disease Control and Prevention, or the authors’ affiliated institutions. Use of trade names is for identification only
and does not imply endorsement by any of the groups named above.
VOLUME 1: NO. 4OCTOBER 2004
tact with one central agency (the leadagency New York State Department ofHealth Tobacco Control Program), whichalso had the most control over communi-cation flow within the network, indicatedby its high betweenness score (43.1).Betweenness scores dropped substantial-ly for other partner agencies. The densityof New York’s network was the lowest ofthe five states (0.39). Figure 1 shows thatmany agencies had very little contactwith other agencies. An agency wouldlikely have to go through the lead agencyto communicate with another agency.From qualitative analysis, we found thatnetwork partners believed the networkwas improving and had potential, butthought it still needed to improve its coor-dination and communication.
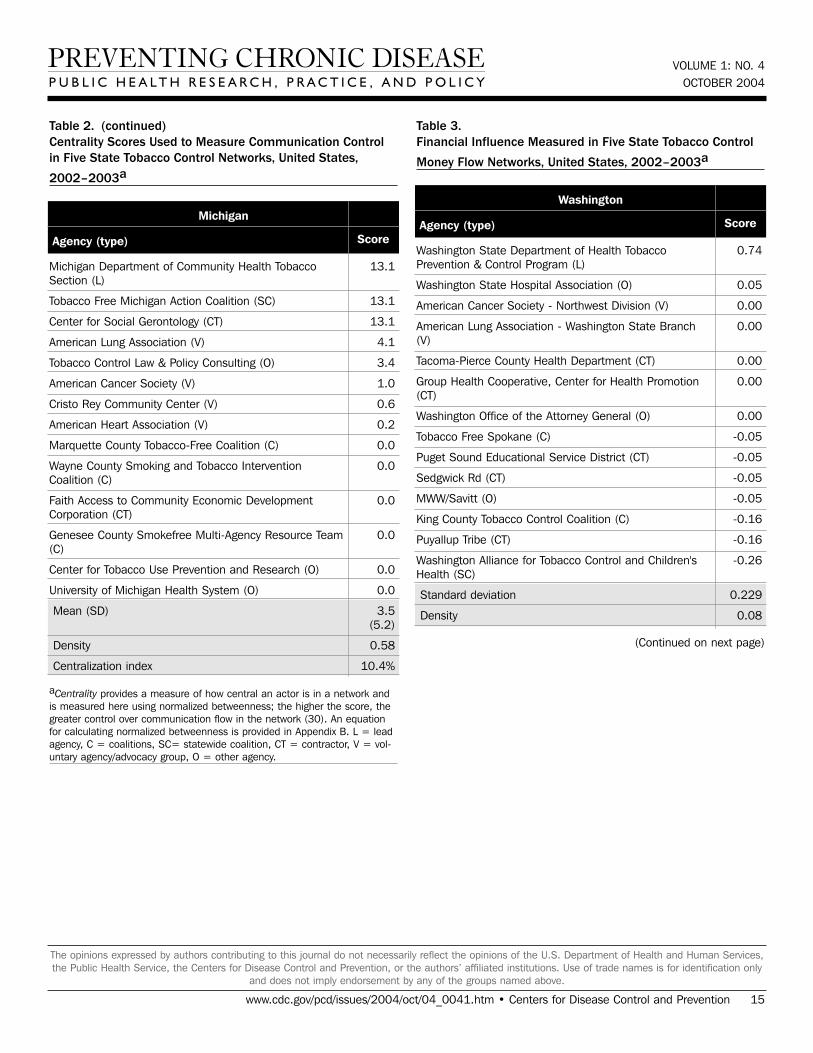
Michigan, on the other hand, had amuch flatter, or nonhierarchical, commu-nication structure. This structure isreflected by its low centralization index(10.4%), and the low mean betweennessscore (3.5) and standard deviation (5.2).Partner agencies had frequent contactwith many other agencies in the network.Three agencies, including the lead agencyMichigan Department of CommunityHealth Tobacco Section, the statewidecoalition Tobacco Free Michigan ActionCoalition (TFMAC), and the contractorGerontology, had higher control overcommunication flow than other agenciesin the network. Although these threeagencies had higher relative betweennness scores withintheir own network, their scores were not very high com-pared to agencies in other state networks. Michigan’s den-sity (0.58) was higher than that of the other four states. Incontrast to New York’s contact graph (Figure 1),Michigan’s figure shows a much more connected commu-nication network. There were multiple routes for informa-tion flow from agency to agency. Michigan’s partner agen-cies felt their network was very effective and had improvedover the last few years. They believed TFMAC and aSmokefree Regulations Task Force, a group of partnersfocusing on clean indoor air efforts, were important net-work components that facilitated the process of bringing
stakeholders together. Partners felt this helped strength-en the network’s ability to work more efficiently. Yet part-ners thought communication could be improved by openlysharing agencies’ priorities and activities.
In examining all five states, a few patterns emerged. Thelead agency usually had the highest control over commu-nication flow, which intuitively makes sense. However,statewide coalitions, which are known to bring stakehold-ers together on tobacco issues, usually did not have thehighest communication control, except in Michigan. Mostnetwork communication structures were relatively hierar-chical, except Michigan, which had a much flatter
6 Centers for Disease Control and Prevention • www.cdc.gov/pcd/issues/2004/oct/04_0041.htm
The opinions expressed by authors contributing to this journal do not necessarily reflect the opinions of the U.S. Department of Health and Human Services,the Public Health Service, the Centers for Disease Control and Prevention, or the authors’ affiliated institutions. Use of trade names is for identification only
and does not imply endorsement by any of the groups named above.
WYOMING
WASHINGTONNEW YORK
INDIANA MICHIGAN
Figure 1. Monthly contact network for five state tobacco control programs. A line connects twoagencies that had contact with each other at least once a month via meetings, phone calls, or e-mails. Colored dots represent the amount of control over communication flow each agency hadrelative to other agencies in the network as determined by scores for betweenness. All acronymsare spelled out in Appendix C.
structure. The average density of the con-tact networks was 0.47. The densitiesranged from 0.39 in New York to 0.58 in Michigan.
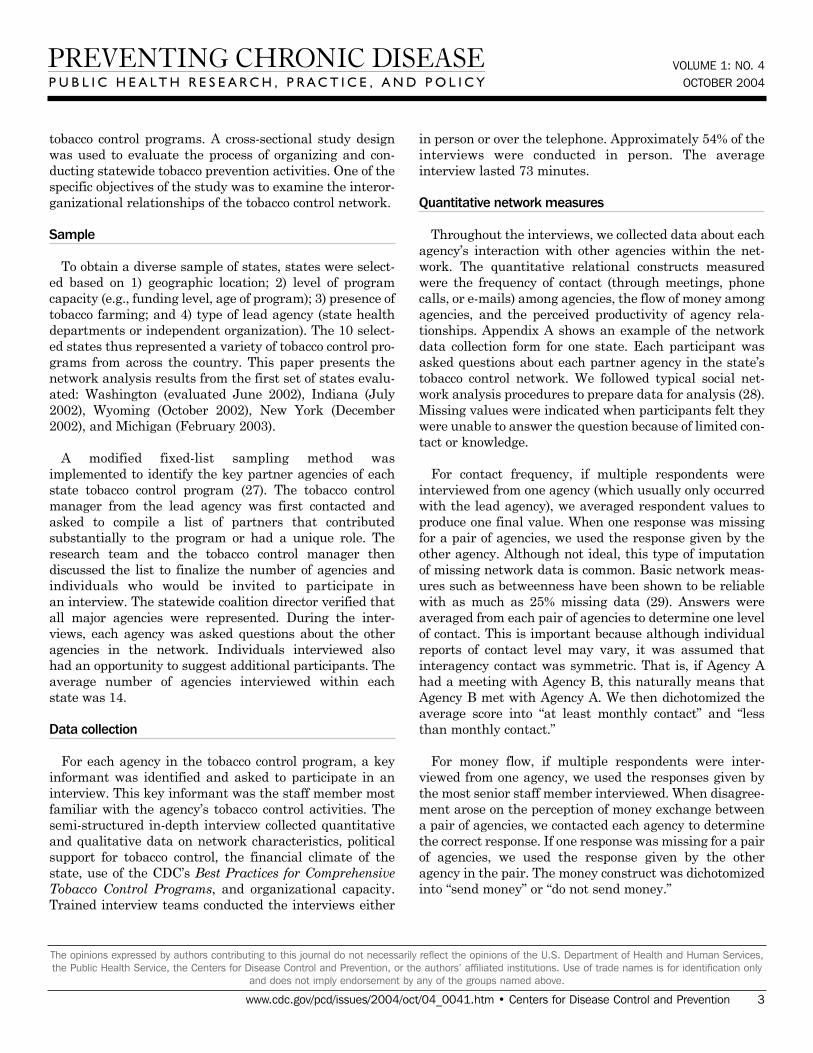
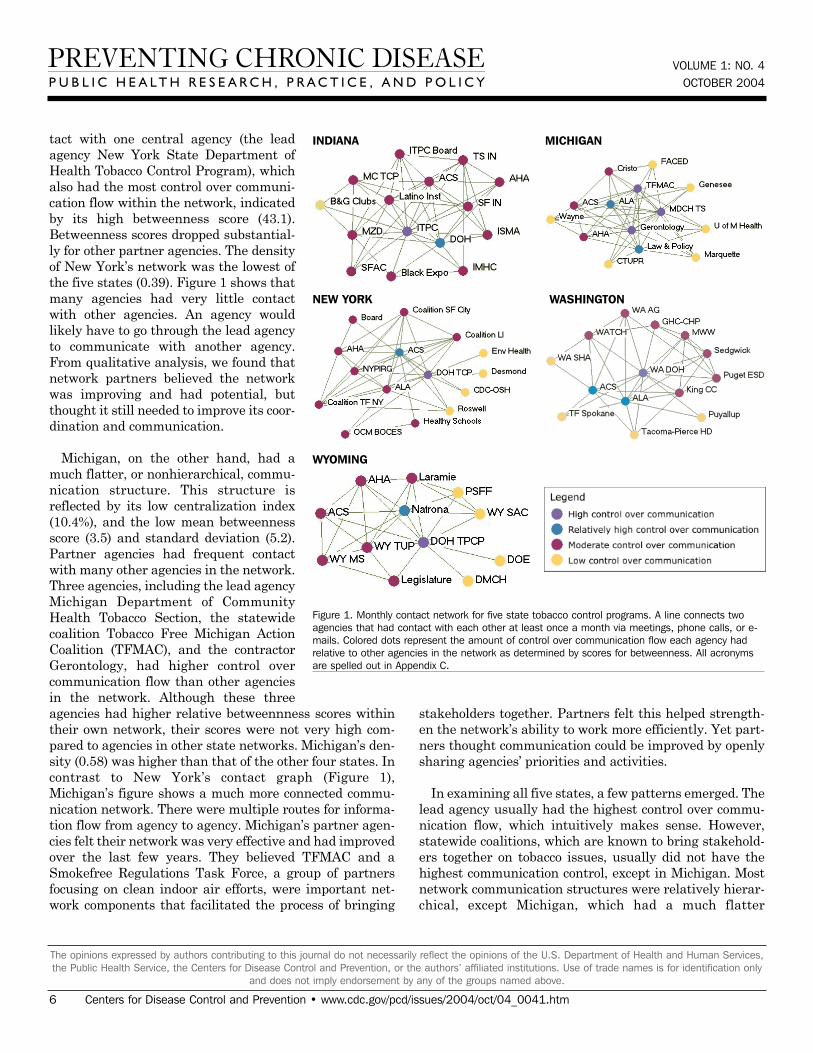
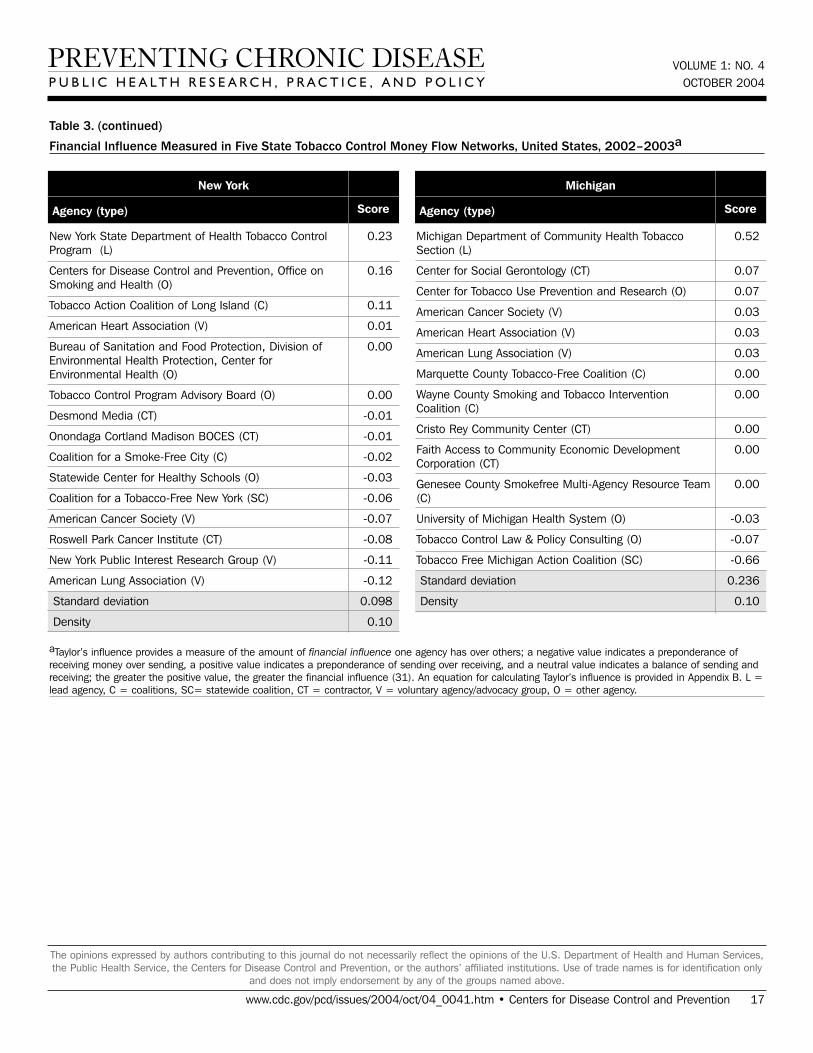
Money flow networks
Figure 2 shows the money flow net-work for each state. Table 3 presentsthe financial influence scores for eachagency in each network. In most states,the lead agency had the highest finan-cial influence over the network, whichcorresponds with their duties as fiscaloversight agencies. The exception wasWyoming, where the legislature wasincluded as a partner in the network.Due to the legislature’s role in appropri-ating funding, it had the highest finan-cial influence. Statewide coalitions wereusually highly influenced by others inthe network, except in Indiana. Thestatewide coalition Tobacco SmartIndiana did not send or receive moneyfrom anyone in the network at the timeof the study. At the time of the evalua-tion, the coalition was in transitionbecause of a loss of funding.
Many of the states with greater fundinglevels had more complex money flow net-works, such as Indiana, New York, andWashington. In these states, moneyflowed not only from the lead agency toother agencies but also flowed among contractors andcoalitions. Wyoming, which had a low funding level, hadthe simplest money flow network, with money mainlyflowing from the legislature to the lead agency and then tocontractors or coalitions. Some money was also given byother agencies to the statewide coalition. Network densityrelated to money flow varied little among the states. Theaverage density was 0.09.
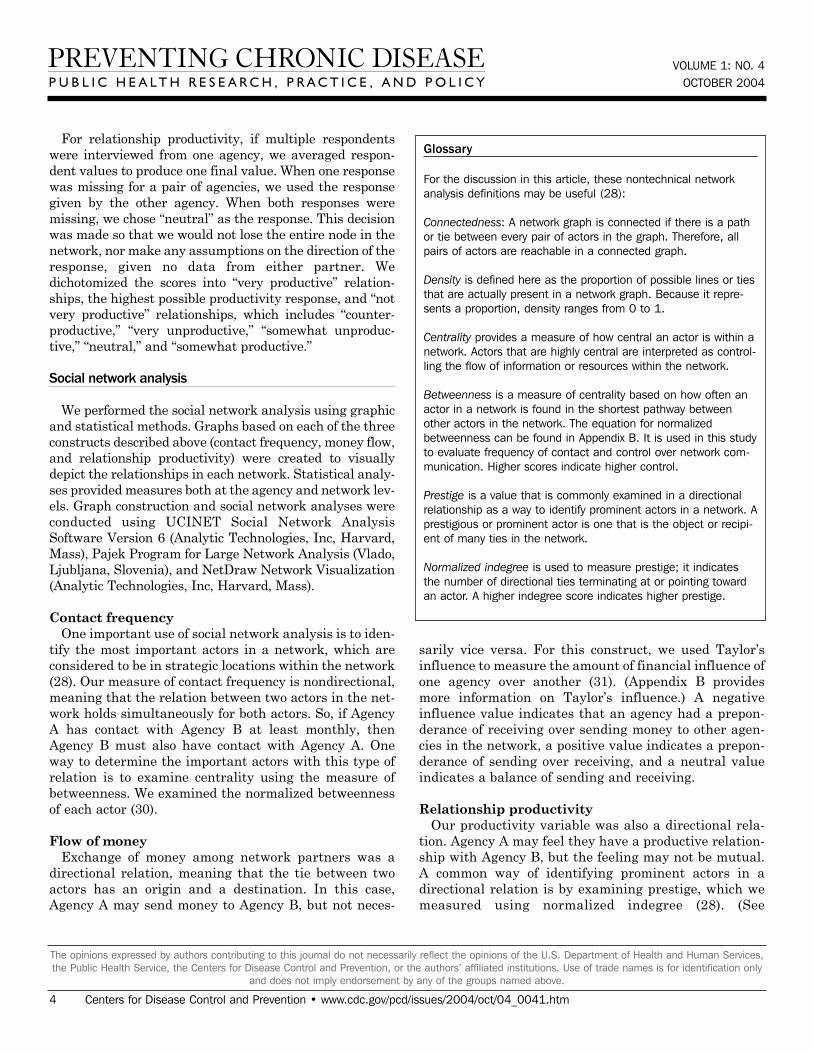
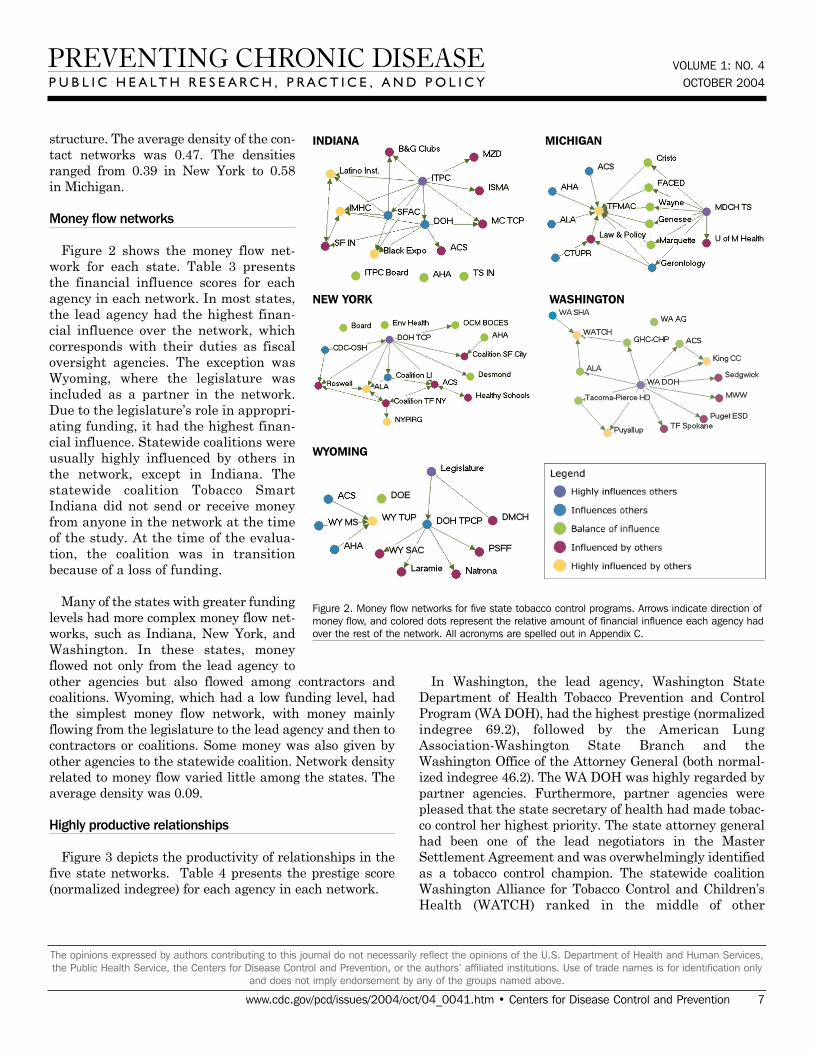
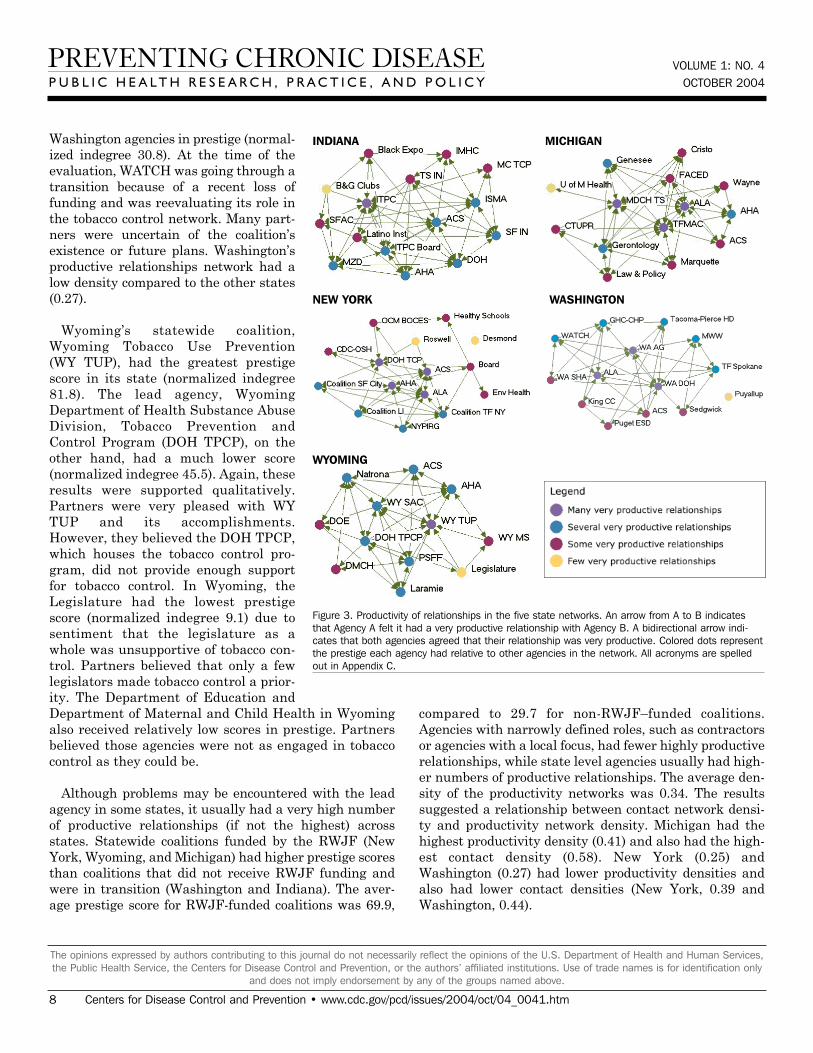
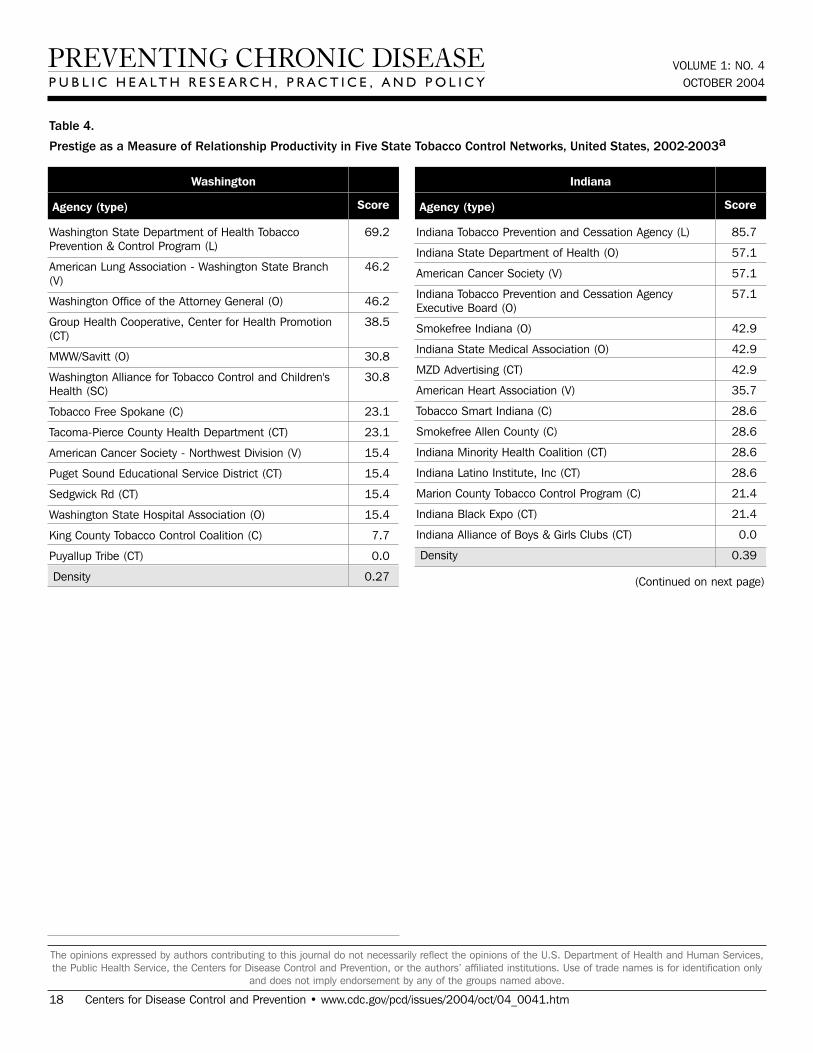
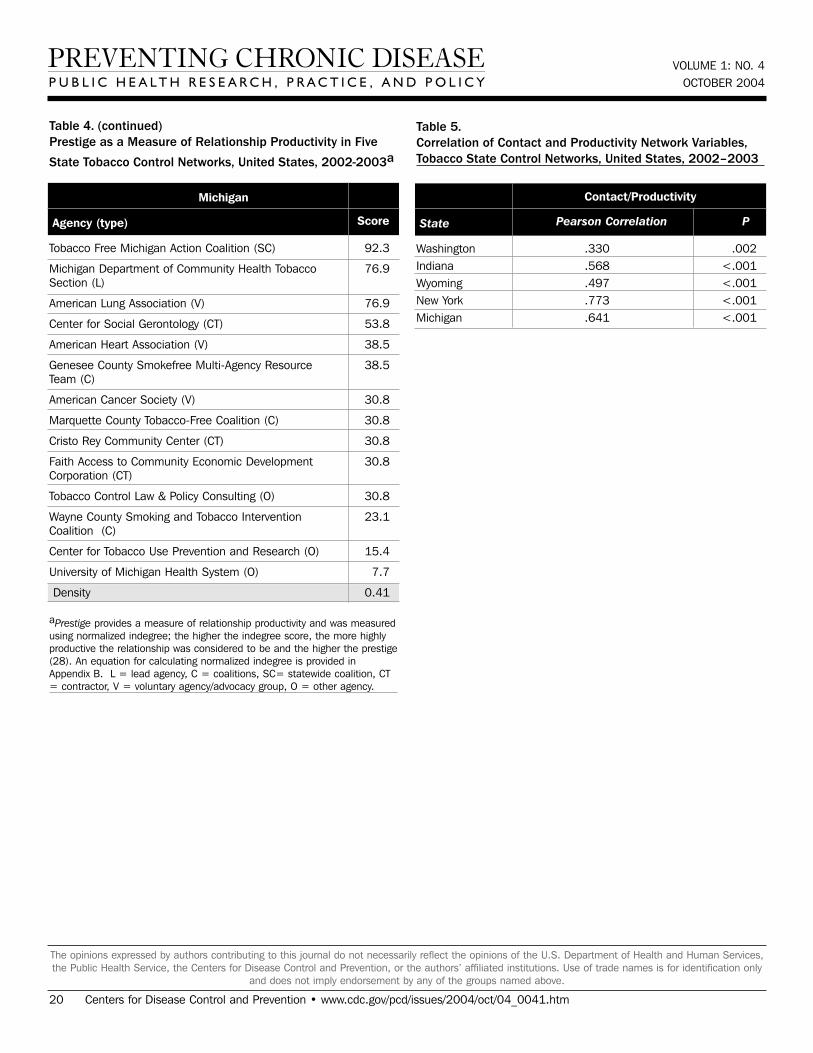
Highly productive relationships
Figure 3 depicts the productivity of relationships in thefive state networks. Table 4 presents the prestige score(normalized indegree) for each agency in each network.
In Washington, the lead agency, Washington StateDepartment of Health Tobacco Prevention and ControlProgram (WA DOH), had the highest prestige (normalizedindegree 69.2), followed by the American LungAssociation-Washington State Branch and theWashington Office of the Attorney General (both normal-ized indegree 46.2). The WA DOH was highly regarded bypartner agencies. Furthermore, partner agencies werepleased that the state secretary of health had made tobac-co control her highest priority. The state attorney generalhad been one of the lead negotiators in the MasterSettlement Agreement and was overwhelmingly identifiedas a tobacco control champion. The statewide coalitionWashington Alliance for Tobacco Control and Children’sHealth (WATCH) ranked in the middle of other
VOLUME 1: NO. 4OCTOBER 2004
www.cdc.gov/pcd/issues/2004/oct/04_0041.htm • Centers for Disease Control and Prevention 7
The opinions expressed by authors contributing to this journal do not necessarily reflect the opinions of the U.S. Department of Health and Human Services,the Public Health Service, the Centers for Disease Control and Prevention, or the authors’ affiliated institutions. Use of trade names is for identification only
and does not imply endorsement by any of the groups named above.
WYOMING
WASHINGTONNEW YORK
INDIANA MICHIGAN
Figure 2. Money flow networks for five state tobacco control programs. Arrows indicate direction ofmoney flow, and colored dots represent the relative amount of financial influence each agency hadover the rest of the network. All acronyms are spelled out in Appendix C.
VOLUME 1: NO. 4OCTOBER 2004
Washington agencies in prestige (normal-ized indegree 30.8). At the time of theevaluation, WATCH was going through atransition because of a recent loss offunding and was reevaluating its role inthe tobacco control network. Many part-ners were uncertain of the coalition’sexistence or future plans. Washington’sproductive relationships network had alow density compared to the other states(0.27).
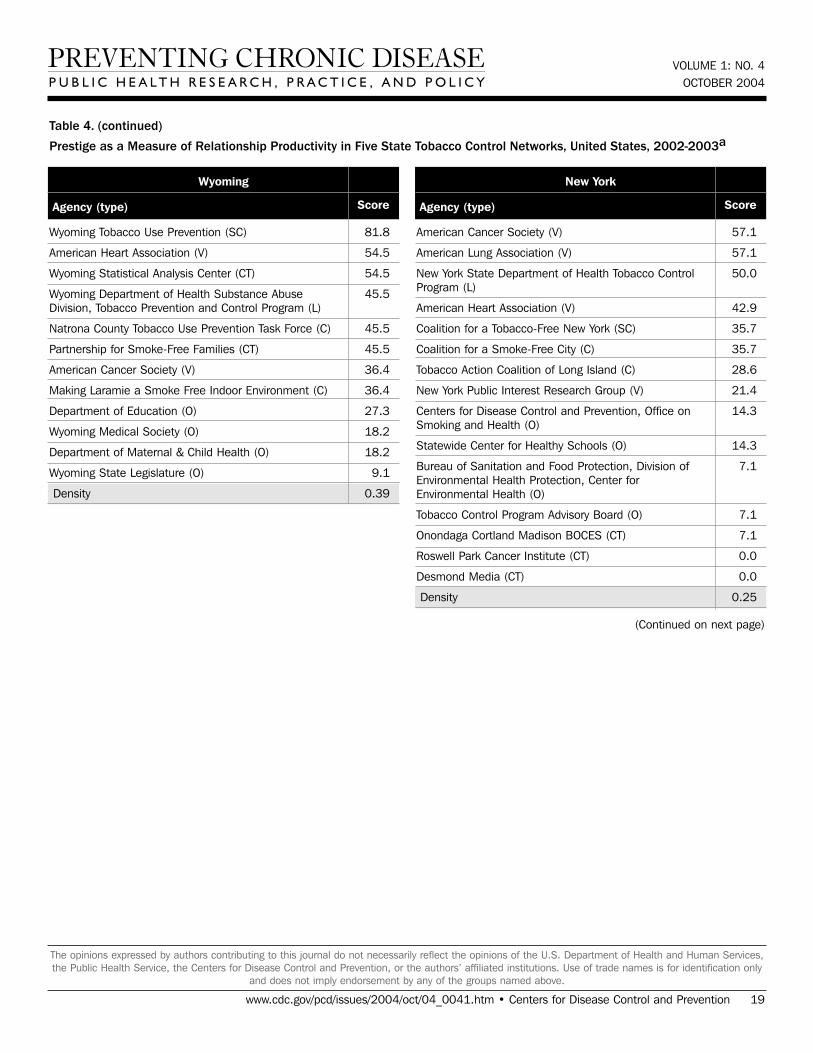
Wyoming’s statewide coalition,Wyoming Tobacco Use Prevention (WY TUP), had the greatest prestigescore in its state (normalized indegree81.8). The lead agency, WyomingDepartment of Health Substance AbuseDivision, Tobacco Prevention andControl Program (DOH TPCP), on theother hand, had a much lower score(normalized indegree 45.5). Again, theseresults were supported qualitatively.Partners were very pleased with WYTUP and its accomplishments.However, they believed the DOH TPCP,which houses the tobacco control pro-gram, did not provide enough supportfor tobacco control. In Wyoming, theLegislature had the lowest prestigescore (normalized indegree 9.1) due tosentiment that the legislature as awhole was unsupportive of tobacco con-trol. Partners believed that only a fewlegislators made tobacco control a prior-ity. The Department of Education andDepartment of Maternal and Child Health in Wyomingalso received relatively low scores in prestige. Partnersbelieved those agencies were not as engaged in tobaccocontrol as they could be.
Although problems may be encountered with the leadagency in some states, it usually had a very high numberof productive relationships (if not the highest) acrossstates. Statewide coalitions funded by the RWJF (NewYork, Wyoming, and Michigan) had higher prestige scoresthan coalitions that did not receive RWJF funding andwere in transition (Washington and Indiana). The aver-age prestige score for RWJF-funded coalitions was 69.9,
compared to 29.7 for non-RWJF–funded coalitions.Agencies with narrowly defined roles, such as contractorsor agencies with a local focus, had fewer highly productiverelationships, while state level agencies usually had high-er numbers of productive relationships. The average den-sity of the productivity networks was 0.34. The resultssuggested a relationship between contact network densi-ty and productivity network density. Michigan had thehighest productivity density (0.41) and also had the high-est contact density (0.58). New York (0.25) andWashington (0.27) had lower productivity densities andalso had lower contact densities (New York, 0.39 andWashington, 0.44).
8 Centers for Disease Control and Prevention • www.cdc.gov/pcd/issues/2004/oct/04_0041.htm
The opinions expressed by authors contributing to this journal do not necessarily reflect the opinions of the U.S. Department of Health and Human Services,the Public Health Service, the Centers for Disease Control and Prevention, or the authors’ affiliated institutions. Use of trade names is for identification only
and does not imply endorsement by any of the groups named above.
WYOMING
WASHINGTONNEW YORK
INDIANA MICHIGAN
Figure 3. Productivity of relationships in the five state networks. An arrow from A to B indicatesthat Agency A felt it had a very productive relationship with Agency B. A bidirectional arrow indi-cates that both agencies agreed that their relationship was very productive. Colored dots representthe prestige each agency had relative to other agencies in the network. All acronyms are spelledout in Appendix C.
Discussion
This paper presents a new construct that can be used toexamine state tobacco programs: network structure. Usingsocial network analysis to examine five state tobacco con-trol programs led to some important observations. Keyactors in the networks were highlighted, such as the leadagency of the programs. In all five states, lead agencieshad high control over communication flow, many highlyproductive relationships, and much financial influenceover the networks. The financial stability of statewidecoalitions also influenced network structure. Statewidecoalitions had many highly productive relationships insome states, but not as many in other states. This differ-ence could be explained by the funding status of the coali-tions. Those with RWJF funding scored higher in produc-tivity than coalitions without RWJF funding. Funding isnecessary for sustaining a stable statewide coalition andfor building and maintaining high-quality relationshipswith others in the state.
Some patterns between network structure and basicdescriptive network characteristics also emerged. Forexample, results suggested that geographic dispersion of anetwork could play a role in communication among agen-cies. Densities of contact networks appeared to be higherfor states with partners in fewer locations and vice versa.New York had the greatest number of partner agency loca-tions (11) and the lowest density (0.39). Conversely,Indiana had a low number of partner agency locations (2)and a high contact density (0.50). This does not suggestthat tobacco control efforts should be concentrated in onlya few areas of the state. In fact, it is important to havepartners in many areas of the state to reach citizens withmessages of prevention and cessation and to create policychange. This does suggest, however, that increased effortsmay be needed to facilitate communication among agen-cies located throughout the state.
While the results of this descriptive study cannot direct-ly assess causality, it was clear that communicationamong agencies was an important factor for having pro-ductive relationships. Results suggested that states withmore dense contact networks had more dense productivitynetworks. Michigan had the highest contact density (0.58)and the highest productive relationships density (0.41).New York had the lowest density for contact (0.39) andproductive relationships (0.25). This is logical because aproductive relationship can only occur when at least some
contact occurs between agencies. However, frequency ofcontact could be a factor here. The more often communica-tion occurs among agencies, the more they work togetherand the more productive they feel their relationship is. Itis relatively easy to investigate the amount of contactoccurring among agencies. Little contact among agenciescould be a symptom of other problems in the network thatmay lead to lower productivity.
To further pursue this, we calculated the relationshipbetween contact and productivity for each of the fivestates by determining the graph correlation using thequadratic assignment procedure (32). Table 5 presentsthese correlations and shows that for these states thereis a significant positive correlation between contact andrelationship (average correlation = .56). Therefore, wesee that tobacco control agencies that have more frequentcontact with each other are more likely to report highlyproductive relationships.
Surprisingly, a relationship between funding level andnetwork connectedness was not suggested by our results.Both New York and Indiana had high funding dollaramounts, but Indiana’s network seemed very well con-nected, while New York’s network was less connected.Michigan had a lower funding dollar amount and had avery connected network. Therefore, funding level does notseem to be a driving force for how connected a state pro-gram can be.
Nuances in state tobacco control programs also affectedthe structure of the networks. For example, Wyoming’stobacco control program had the only lead agency that wasplaced under the Substance Abuse Division at theDepartment of Health. Partners believed the program didnot provide enough support for tobacco control, whichcaused this lead agency to have fewer productive relation-ships than lead agencies in the other states. TheWashington Attorney General’s prominent role in theMaster Settlement Agreement and continued support forthe program made the attorney general a unique partnerin the network, and partners believed their relationshipswith the attorney general were highly productive.
Results of this study should be interpreted with somecaution. Because our sample size included only five statenetworks, results are not very generalizable. Furthermore,state networks presented do not include all agenciesinvolved in the state network. A limited number of agen-
VOLUME 1: NO. 4OCTOBER 2004
www.cdc.gov/pcd/issues/2004/oct/04_0041.htm • Centers for Disease Control and Prevention 9
The opinions expressed by authors contributing to this journal do not necessarily reflect the opinions of the U.S. Department of Health and Human Services,the Public Health Service, the Centers for Disease Control and Prevention, or the authors’ affiliated institutions. Use of trade names is for identification only
and does not imply endorsement by any of the groups named above.
VOLUME 1: NO. 4OCTOBER 2004
cies could be interviewed because of the very large numberof agencies involved in a state’s program and the studyteam’s limited resources. However, the type of samplingmethodology employed here, which included a list of keypartners identified by tobacco control program managersand the addition of some other agencies as suggested bythe key partners, resulted in including the most importanttobacco control agencies in the evaluated tobacco controlnetwork. Although only one individual per agency wasusually interviewed, we believe those responses representthe viewpoint of the entire agency on quantitative networkconstructs. When multiple individuals from an agencywere interviewed, their responses for quantitative con-structs were highly correlated. The productivity of rela-tionships was dichotomized as “very productive” or “notvery productive.” Dichotomization of this variable wasnecessary for analysis, and we chose to use “very produc-tive” as the cutoff to highlight the highest productivitylevel between agencies. Doing so could be a disadvantagebecause of the loss of variability in the measure. Finally,our analysis is based on reports of individuals from part-ner agencies, which may not be accurate, or at times weresimply missing. Reported responses may differ from actu-al, observed interactions among partners. Possible bias inreporting or from missing data is an inherent limitation inkey informant interviews.
The CDC has developed an extensive logic model fortobacco prevention in an effort to identify specific outcomeindicators for comprehensive tobacco control programs(33). The emphasis in the CDC logic model is on short-,medium-, and long-term outcomes, such as smoking initi-ation rates, cigarette prices, and existence of tobacco con-trol policies.
The work presented in this paper represents a first stepin developing measures of process indicators as opposed tooutcome indicators. That is, very little is known about theorganizational structures and processes that may influ-ence successful tobacco control outcomes. Investigatingstructures of state tobacco control networks can help shedlight on the highly complex process of coordinating a statetobacco control program. Social network analysis providesan objective and relatively simple and inexpensive way toexamine this process. One important way this type ofanalysis could be used is to examine the effect of statebudget cuts on state tobacco control programs. Other thantracking the amount of money states spend on tobacco con-trol, it is difficult to measure the impact of budget cuts on
the process of implementing a statewide program.Network structure could be compared before and afterbudget cuts to determine changes in network characteris-tics and size. More importantly, future research couldcompare network analysis measures with the success ofstate programs in decreasing smoking rates or passingtobacco control policies to establish the link between net-work characteristics as process and program outcomeindicators. Furthermore, this type of organizational net-work analysis represents a new way to perform programevaluation, in which the emphasis is less on simple countsof program activities and more on the documentation ofstructural and process changes that result from effectiveprograms (26). In summary, network analysis of statetobacco control programs can identify the network’s struc-ture and connectedness of the agencies within the pro-gram. Once linked with program outcomes in futureresearch, this analysis could be used to inform necessarydevelopment or organizational changes to tobacco controlprograms and produce better outcomes.
Acknowledgments
We wish to thank the tobacco control partners inWashington, Indiana, Wyoming, New York, and Michiganfor their participation in this research. This research wassupported by a grant from the American LegacyFoundation with collaboration from the CDC Foundationand scientific and technical assistance from the CDC.Results of this paper do not necessarily represent theviews of the American Legacy Foundation or the CDCFoundation, their staff, or boards of directors.
Author Information
Corresponding author: Nancy Mueller, MPH, Center forTobacco Policy Research, Saint Louis University School ofPublic Health, 3545 Lafayette Ave, Suite 300, St. Louis,MO 63104. Telephone: 314-977-4027. Fax: 314-977-3234.E-mail: [email protected].
Author affiliations: Melissa Krauss, MPH, DouglasLuke, PhD, Center for Tobacco Policy Research, SaintLouis University School of Public Health, St. Louis, Mo.
10 Centers for Disease Control and Prevention • www.cdc.gov/pcd/issues/2004/oct/04_0041.htm
The opinions expressed by authors contributing to this journal do not necessarily reflect the opinions of the U.S. Department of Health and Human Services,the Public Health Service, the Centers for Disease Control and Prevention, or the authors’ affiliated institutions. Use of trade names is for identification only
and does not imply endorsement by any of the groups named above.
References
1. Centers for Disease Control and Prevention. Bestpractices for comprehensive tobacco control pro-grams—August 1999. Atlanta (GA): U.S.Department of Health and Human Services, Centersfor Disease Control and Prevention, National Centerfor Chronic Disease Prevention and HealthPromotion, Office on Smoking and Health, 1999[reprinted, with corrections].
2. Anderson P. Public-private partnerships to reducetobacco dependence. Addiction 2002 Aug;97(8):951-5.
3. Robbins H, Krakow M. Evolution of a comprehensivetobacco control programme: building system capacityand strategic partnerships – lessons fromMassachusetts. Tob Control 2000 Dec;9(4):423-30.
4. Rohrbach LA, Howard-Pitney B, Unger JB, Dent CW,Howard KA, Cruz TB, et al. Independent evaluation ofthe California Tobacco Control Program: relationshipsbetween program exposure and outcomes, 1996-1998.Am J Public Health 2002 Jun;92(6):975-83.
5. Pierce JP, Gilpin EA, Emery SL, White MM,Rosbrook B, Berry CC. Has the California tobaccocontrol program reduced smoking? JAMA 1998Sep;280(10):893-99.
6. Siegel M, Mowery PD, Pechacek TP, Strauss WJ,Schooley MW, Merritt RK, et al. Trends in adult ciga-rette smoking in California compared with the rest ofthe United States, 1978-1994. Am J Public Health2000 Mar;90(3):372-79.
7. Soldz S, Clark TW, Stewart E, Celebucki C, KleinWalker DK. Decreased youth tobacco use inMassachusetts 1996 to 1999: evidence of tobacco con-trol effectiveness. Tob Control 2002 Jun;11(Suppl2):ii14-9.
8. Bauer UE, Johnson TM, Hopkins RS, Brooks RG.Changes in youth cigarette use and intentions follow-ing implementation of a tobacco control program: find-ings from the Florida Youth Tobacco Survey, 1998-2000. JAMA 2000 Aug;284(6):723-28.
9. Centers for Disease Control and Prevention. Declinein cigarette consumption following implementation ofa comprehensive tobacco prevention and educationprogram - Oregon, 1996-1998. MMWR Morb MortalWkly Rep 1999 Feb;48(7):140-3.
10. Centers for Disease Control and Prevention. Tobaccouse among adults-Arizona, 1996 and 1999. MMWRMorb Mortal Wkly Rep 2001 May;50(20):402-6.
11. Campaign for Tobacco-Free Kids, American Lung
Association, American Cancer Society, AmericanHeart Association, SmokeLess States NationalTobacco Policy Initiative. Show us the money: a reporton the states' allocation of the tobacco settlement dol-lars. Washington (DC): Campaign for Tobacco-FreeKids; 2003. 126 p. Available from: URL:http://www.tobaccofreekids.org/reports/settlements/.
12. Gross CP, Soffer B, Bach PB, Rajkumar R, FormanHP. State expenditures for tobacco-control programsand the tobacco settlement. N Engl J Med 2002Oct;347 (14):1080-6.
13. Farrelly MC, Pechacek TF, Chaloupka FJ. The impactof tobacco control program expenditures on aggregatecigarette sales: 1981-1998. National Bureau ofEconomic Research: NBER Working Paper Series2001:1-32.
14. Chriqui JF, Frosh M, Brownson RC, Shelton DM,Sciandra RC, Hobart R, et al. Application of a ratingsystem to state clean indoor air laws (USA). TobControl 2002 Mar;11(1):26-34.
15. Luke DA, Stamatakis KA, Brownson RC. State youthaccess tobacco control policies and youth smokingbehavior in the United States. Am J Prev Med 2000Oct;19(3):180-7.
16. Mueller N, Luke DA, Muramoto ML, DeLeeuw KL,Krauss M. Best Practices: Current Policy, Evaluation,and Practice. Paper presented at: NationalConference on Tobacco or Health; 2002 Nov 19-21;San Francisco, CA.
17. Ennett ST, Bauman KE. Peer group structure andadolescent cigarette smoking: a social network analy-sis. J Health Soc Behav 1993 Sep;34(3):226-36.
18. Ennett ST, Bauman KE, Koch GG. Variability in cig-arette smoking within and between adolescentfriendship cliques. Addict Behav 1994 May-Jun;19(3):295-305.
19. Ennett ST, Bauman KE. The contribution of influenceand selection to adolescent peer group homogeneity:the case of adolescent cigarette smoking. J Pers SocPsychol 1994 Oct;67(4):653-63.
20. Pearson M, Mitchell L. Smoke rings: social networkanalysis of friendship groups, smoking and drug-tak-ing. Drugs: Education, Prevention & Policy 2000 Feb;7(1):21-37.
21. Abel G, Plumridge L, Graham P. Peers, networks orrelationships: strategies for understanding socialdynamics as determinants of smoking behaviour.Drugs: Education, Prevention & Policy 2002 Nov;9(4):325-38.
VOLUME 1: NO. 4OCTOBER 2004
www.cdc.gov/pcd/issues/2004/oct/04_0041.htm • Centers for Disease Control and Prevention 11
The opinions expressed by authors contributing to this journal do not necessarily reflect the opinions of the U.S. Department of Health and Human Services,the Public Health Service, the Centers for Disease Control and Prevention, or the authors’ affiliated institutions. Use of trade names is for identification only
and does not imply endorsement by any of the groups named above.
VOLUME 1: NO. 4OCTOBER 2004
22. Wasserman S, Galaskiewicz J. Advances in socialnetwork analysis: research in the social and behav-ioral sciences. Thousand Oaks (CA): SAGEPublications; 1994.
23. Phillips SD. Meaning and structure in social move-ments: mapping the network of national Canadianwomen’s organizations. Canadian Journal of PoliticalScience 1991;4:755-782.
24. Johnston G. Inter-organisational relationships in theUK community care policy arena 1987-1993 with par-ticular reference to mental health services. SocialWork & Social Sciences Review 2001;9(2):41-63.
25. Kwait J, Valente TW, Celentano DD.Interorganizational relationships among HIV/AIDSservice organizations in Baltimore: a network analy-sis. J Urban Health [Bulletin of the New YorkAcademy of Medicine] 2001 Sep;78(3):468-487.
26. Eisenberg M, Swanson N. Organizational networkanalysis as a tool for program evaluation. Eval HealthProf 1996 Dec;19(4):488-507.
27. Doreian P, Woodard KL. Fixed list versus snowballselection of social networks. Social Science Research1992;21:216-233.
28. Wasserman S, Faust K. Social network analysis:methods and applications. New York (NY): CambridgeUniversity Press; 1994.
29. Costenbader E, Valente TW. The stability of centrali-ty measures when networks are sampled. SocialNetworks 2003; 25:283-307.
30. Freeman LC. Centrality in social networks: conceptu-al clarification. Social Networks 1979;1:215-39.
31. Hanneman RA. Introduction to Social NetworkMethods. Riverside (CA): University of California,Riverside, Department of Sociology; 2001. 149 p.Available from: URL: http://faculty.ucr.edu/~hanne-man/SOC157/NETTEXT.PDF.
32. Krackhardt D. Predicting with networks: nonpara-metric multiple regression analyses of dyadic data.Social Networks 1988;10:359-382.
33. MacDonald G, Starr G, Schooley M, Yee SL,Klimowski K, Turner K. Introduction to programevaluation for comprehensive tobacco control pro-grams. Atlanta (GA): Department of Health andHuman Services, Centers for Disease Control andPrevention; 2001.
12 Centers for Disease Control and Prevention • www.cdc.gov/pcd/issues/2004/oct/04_0041.htm
The opinions expressed by authors contributing to this journal do not necessarily reflect the opinions of the U.S. Department of Health and Human Services,the Public Health Service, the Centers for Disease Control and Prevention, or the authors’ affiliated institutions. Use of trade names is for identification only
and does not imply endorsement by any of the groups named above.
TablesTable 1. Characteristics of Five State Tobacco Control Networks, United States, 2002–2003
Washington (2002)
Indiana (2003)
Wyoming (2003)
New York (2003)
Michigan (2003)
14
15
12
15
14
7
2
4
11
7
$20.8
$33.9
$4.2
$52.3
$5.3
62
97
57
55
10
No grant received
No grant received
$250,000
$450,000
$400,000
State (Fiscal Year)Number of
Partner Agencies
Number ofCities Where
PartnerAgencies Are
Located
Total TobaccoControl Funds
(millions)a
% MeetingCDC’s
MinimumRecommen-
dationsb
RWJF SmokelessStates GrantReceived byStatewideCoalition
Network size and location Funding status
aRobert Wood Johnson Foundation Smokeless States grant funds are included in total tobacco control funds.bCenters for Disease Control and Prevention (CDC) recommendations are outlined in Best Practices for Comprehensive Tobacco Control Programs — August1999 (1).
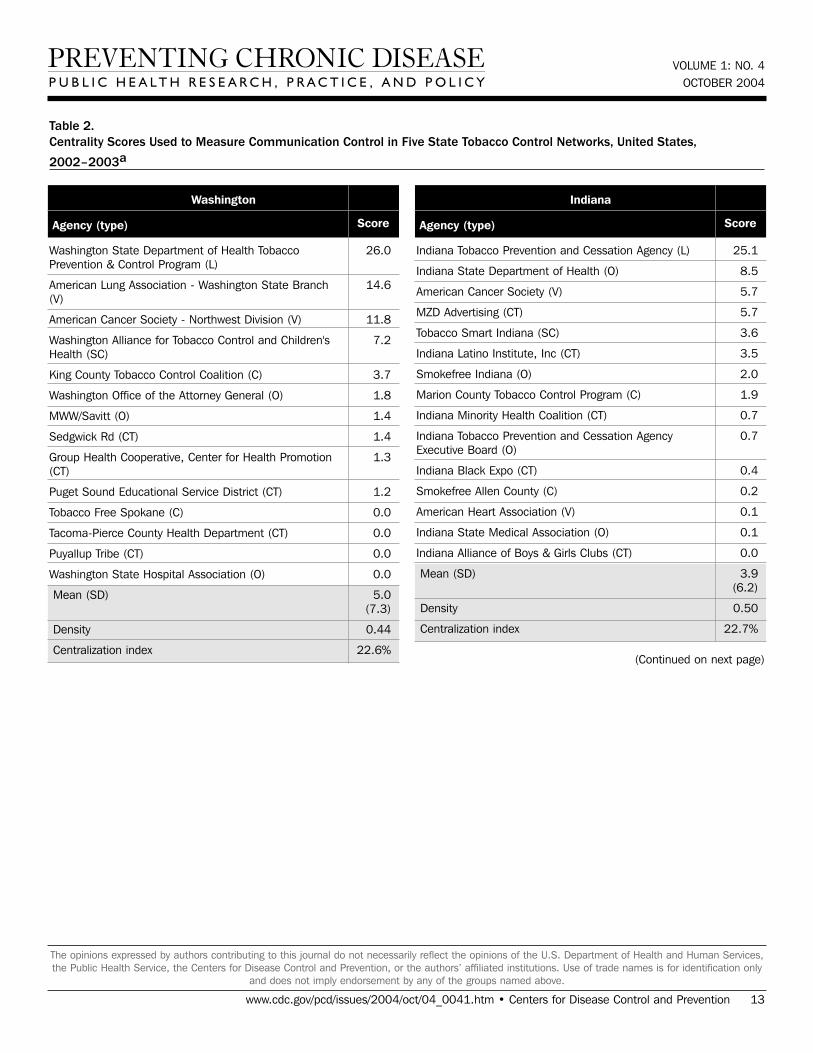
Table 2. Centrality Scores Used to Measure Communication Control in Five State Tobacco Control Networks, United States,
2002–2003a
VOLUME 1: NO. 4OCTOBER 2004
www.cdc.gov/pcd/issues/2004/oct/04_0041.htm • Centers for Disease Control and Prevention 13
The opinions expressed by authors contributing to this journal do not necessarily reflect the opinions of the U.S. Department of Health and Human Services,the Public Health Service, the Centers for Disease Control and Prevention, or the authors’ affiliated institutions. Use of trade names is for identification only
and does not imply endorsement by any of the groups named above.
Washington State Department of Health TobaccoPrevention & Control Program (L)
American Lung Association - Washington State Branch(V)
American Cancer Society - Northwest Division (V)
Washington Alliance for Tobacco Control and Children'sHealth (SC)
King County Tobacco Control Coalition (C)
Washington Office of the Attorney General (O)
MWW/Savitt (O)
Sedgwick Rd (CT)
Group Health Cooperative, Center for Health Promotion(CT)
Puget Sound Educational Service District (CT)
Tobacco Free Spokane (C)
Tacoma-Pierce County Health Department (CT)
Puyallup Tribe (CT)
Washington State Hospital Association (O)
Mean (SD)
Density
Centralization index
26.0
14.6
11.8
7.2
3.7
1.8
1.4
1.4
1.3
1.2
0.0
0.0
0.0
0.0
5.0 (7.3)
0.44
22.6%
Agency (type) Score
Washington
Indiana Tobacco Prevention and Cessation Agency (L)
Indiana State Department of Health (O)
American Cancer Society (V)
MZD Advertising (CT)
Tobacco Smart Indiana (SC)
Indiana Latino Institute, Inc (CT)
Smokefree Indiana (O)
Marion County Tobacco Control Program (C)
Indiana Minority Health Coalition (CT)
Indiana Tobacco Prevention and Cessation AgencyExecutive Board (O)
Indiana Black Expo (CT)
Smokefree Allen County (C)
American Heart Association (V)
Indiana State Medical Association (O)
Indiana Alliance of Boys & Girls Clubs (CT)
Mean (SD)
Density
Centralization index
25.1
8.5
5.7
5.7
3.6
3.5
2.0
1.9
0.7
0.7
0.4
0.2
0.1
0.1
0.0
3.9(6.2)
0.50
22.7%
Agency (type) Score
Indiana
(Continued on next page)
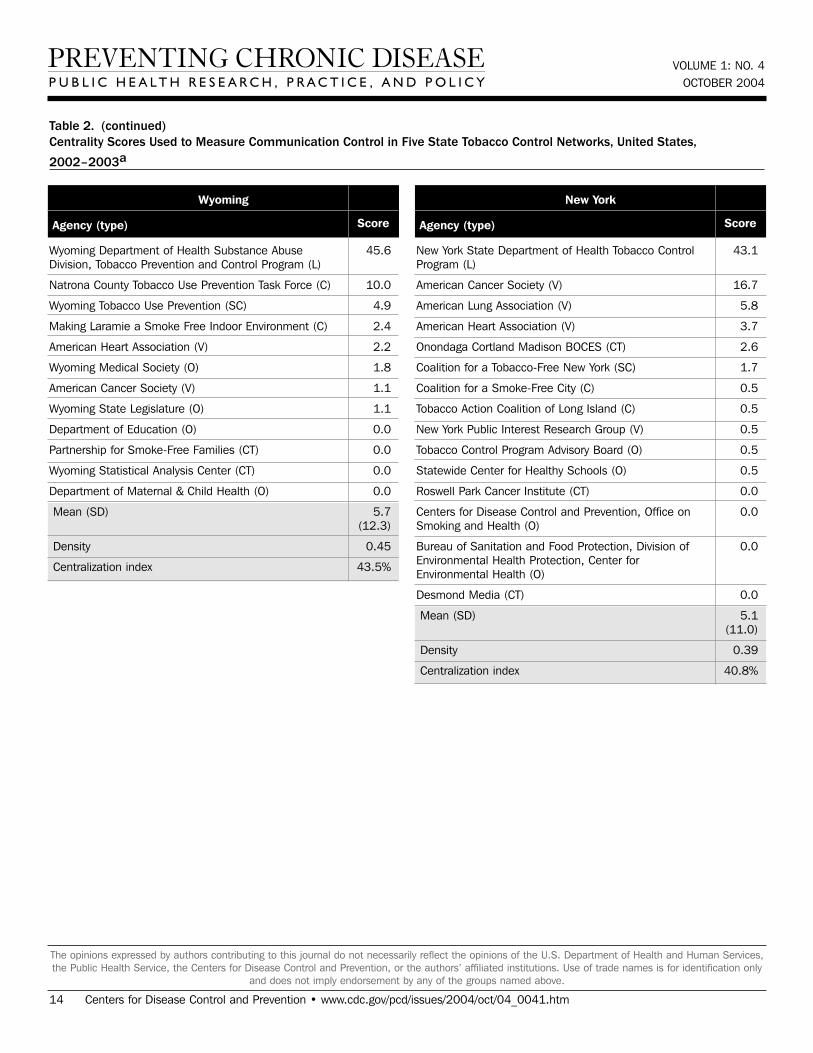
Table 2. (continued)Centrality Scores Used to Measure Communication Control in Five State Tobacco Control Networks, United States,
2002–2003a
VOLUME 1: NO. 4OCTOBER 2004
14 Centers for Disease Control and Prevention • www.cdc.gov/pcd/issues/2004/oct/04_0041.htm
The opinions expressed by authors contributing to this journal do not necessarily reflect the opinions of the U.S. Department of Health and Human Services,the Public Health Service, the Centers for Disease Control and Prevention, or the authors’ affiliated institutions. Use of trade names is for identification only
and does not imply endorsement by any of the groups named above.
Wyoming Department of Health Substance AbuseDivision, Tobacco Prevention and Control Program (L)
Natrona County Tobacco Use Prevention Task Force (C)
Wyoming Tobacco Use Prevention (SC)
Making Laramie a Smoke Free Indoor Environment (C)
American Heart Association (V)
Wyoming Medical Society (O)
American Cancer Society (V)
Wyoming State Legislature (O)
Department of Education (O)
Partnership for Smoke-Free Families (CT)
Wyoming Statistical Analysis Center (CT)
Department of Maternal & Child Health (O)
Mean (SD)
Density
Centralization index
45.6
10.0
4.9
2.4
2.2
1.8
1.1
1.1
0.0
0.0
0.0
0.0
5.7(12.3)
0.45
43.5%
Agency (type) Score
Wyoming
New York State Department of Health Tobacco ControlProgram (L)
American Cancer Society (V)
American Lung Association (V)
American Heart Association (V)
Onondaga Cortland Madison BOCES (CT)
Coalition for a Tobacco-Free New York (SC)
Coalition for a Smoke-Free City (C)
Tobacco Action Coalition of Long Island (C)
New York Public Interest Research Group (V)
Tobacco Control Program Advisory Board (O)
Statewide Center for Healthy Schools (O)
Roswell Park Cancer Institute (CT)
Centers for Disease Control and Prevention, Office onSmoking and Health (O)
Bureau of Sanitation and Food Protection, Division ofEnvironmental Health Protection, Center forEnvironmental Health (O)
Desmond Media (CT)
Mean (SD)
Density
Centralization index
43.1
16.7
5.8
3.7
2.6
1.7
0.5
0.5
0.5
0.5
0.5
0.0
0.0
0.0
0.0
5.1(11.0)
0.39
40.8%
Agency (type) Score
New York
VOLUME 1: NO. 4OCTOBER 2004
www.cdc.gov/pcd/issues/2004/oct/04_0041.htm • Centers for Disease Control and Prevention 15
The opinions expressed by authors contributing to this journal do not necessarily reflect the opinions of the U.S. Department of Health and Human Services,the Public Health Service, the Centers for Disease Control and Prevention, or the authors’ affiliated institutions. Use of trade names is for identification only
and does not imply endorsement by any of the groups named above.
Table 2. (continued)Centrality Scores Used to Measure Communication Controlin Five State Tobacco Control Networks, United States,
2002–2003a
Michigan Department of Community Health TobaccoSection (L)
Tobacco Free Michigan Action Coalition (SC)
Center for Social Gerontology (CT)
American Lung Association (V)
Tobacco Control Law & Policy Consulting (O)
American Cancer Society (V)
Cristo Rey Community Center (V)
American Heart Association (V)
Marquette County Tobacco-Free Coalition (C)
Wayne County Smoking and Tobacco InterventionCoalition (C)
Faith Access to Community Economic DevelopmentCorporation (CT)
Genesee County Smokefree Multi-Agency Resource Team(C)
Center for Tobacco Use Prevention and Research (O)
University of Michigan Health System (O)
Mean (SD)
Density
Centralization index
13.1
13.1
13.1
4.1
3.4
1.0
0.6
0.2
0.0
0.0
0.0
0.0
0.0
0.0
3.5(5.2)
0.58
10.4%
Agency (type) Score
Michigan
aCentrality provides a measure of how central an actor is in a network andis measured here using normalized betweenness; the higher the score, thegreater control over communication flow in the network (30). An equationfor calculating normalized betweenness is provided in Appendix B. L = leadagency, C = coalitions, SC= statewide coalition, CT = contractor, V = vol-untary agency/advocacy group, O = other agency.
Table 3. Financial Influence Measured in Five State Tobacco Control
Money Flow Networks, United States, 2002–2003a
Washington State Department of Health TobaccoPrevention & Control Program (L)
Washington State Hospital Association (O)
American Cancer Society - Northwest Division (V)
American Lung Association - Washington State Branch(V)
Tacoma-Pierce County Health Department (CT)
Group Health Cooperative, Center for Health Promotion(CT)
Washington Office of the Attorney General (O)
Tobacco Free Spokane (C)
Puget Sound Educational Service District (CT)
Sedgwick Rd (CT)
MWW/Savitt (O)
King County Tobacco Control Coalition (C)
Puyallup Tribe (CT)
Washington Alliance for Tobacco Control and Children'sHealth (SC)
Standard deviation
Density
0.74
0.05
0.00
0.00
0.00
0.00
0.00
-0.05
-0.05
-0.05
-0.05
-0.16
-0.16
-0.26
0.229
0.08
Agency (type) Score
Washington
(Continued on next page)
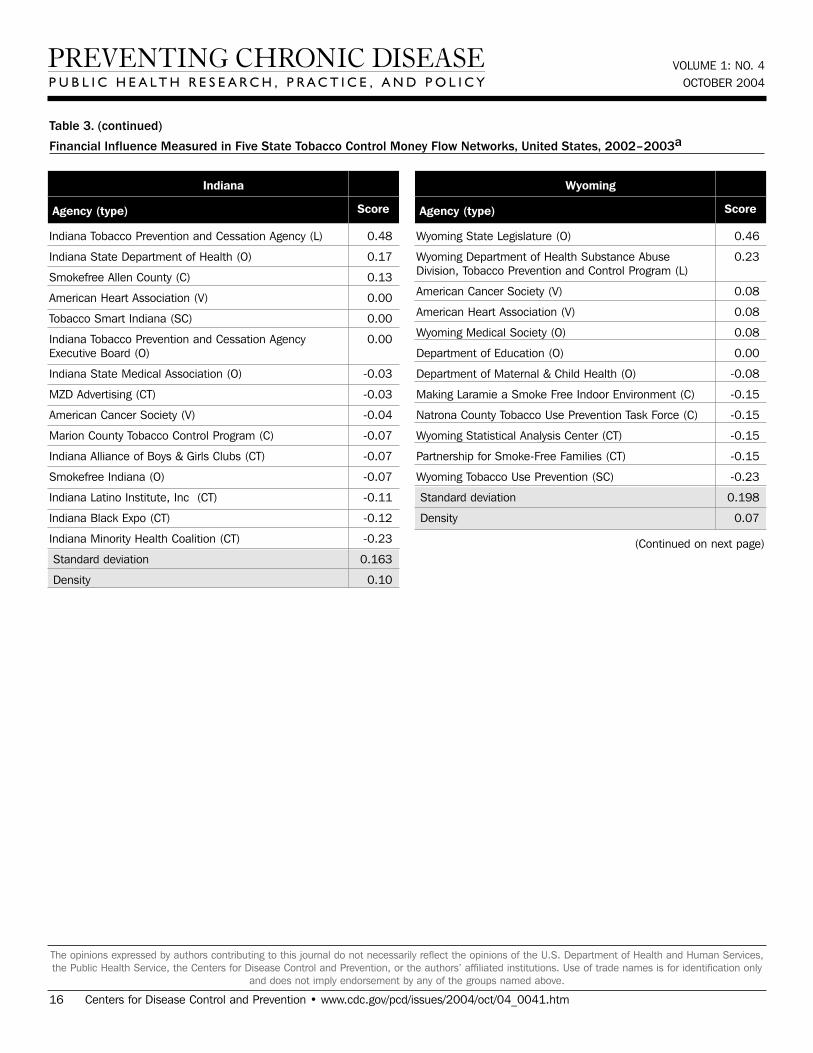
Table 3. (continued)
Financial Influence Measured in Five State Tobacco Control Money Flow Networks, United States, 2002–2003a
VOLUME 1: NO. 4OCTOBER 2004
16 Centers for Disease Control and Prevention • www.cdc.gov/pcd/issues/2004/oct/04_0041.htm
The opinions expressed by authors contributing to this journal do not necessarily reflect the opinions of the U.S. Department of Health and Human Services,the Public Health Service, the Centers for Disease Control and Prevention, or the authors’ affiliated institutions. Use of trade names is for identification only
and does not imply endorsement by any of the groups named above.
Indiana Tobacco Prevention and Cessation Agency (L)
Indiana State Department of Health (O)
Smokefree Allen County (C)
American Heart Association (V)
Tobacco Smart Indiana (SC)
Indiana Tobacco Prevention and Cessation AgencyExecutive Board (O)
Indiana State Medical Association (O)
MZD Advertising (CT)
American Cancer Society (V)
Marion County Tobacco Control Program (C)
Indiana Alliance of Boys & Girls Clubs (CT)
Smokefree Indiana (O)
Indiana Latino Institute, Inc (CT)
Indiana Black Expo (CT)
Indiana Minority Health Coalition (CT)
Standard deviation
Density
0.48
0.17
0.13
0.00
0.00
0.00
-0.03
-0.03
-0.04
-0.07
-0.07
-0.07
-0.11
-0.12
-0.23
0.163
0.10
Agency (type) Score
Indiana
Wyoming State Legislature (O)
Wyoming Department of Health Substance AbuseDivision, Tobacco Prevention and Control Program (L)
American Cancer Society (V)
American Heart Association (V)
Wyoming Medical Society (O)
Department of Education (O)
Department of Maternal & Child Health (O)
Making Laramie a Smoke Free Indoor Environment (C)
Natrona County Tobacco Use Prevention Task Force (C)
Wyoming Statistical Analysis Center (CT)
Partnership for Smoke-Free Families (CT)
Wyoming Tobacco Use Prevention (SC)
Standard deviation
Density
0.46
0.23
0.08
0.08
0.08
0.00
-0.08
-0.15
-0.15
-0.15
-0.15
-0.23
0.198
0.07
Agency (type) Score
Wyoming
(Continued on next page)
VOLUME 1: NO. 4OCTOBER 2004
www.cdc.gov/pcd/issues/2004/oct/04_0041.htm • Centers for Disease Control and Prevention 17
The opinions expressed by authors contributing to this journal do not necessarily reflect the opinions of the U.S. Department of Health and Human Services,the Public Health Service, the Centers for Disease Control and Prevention, or the authors’ affiliated institutions. Use of trade names is for identification only
and does not imply endorsement by any of the groups named above.
Table 3. (continued)
Financial Influence Measured in Five State Tobacco Control Money Flow Networks, United States, 2002–2003a
New York State Department of Health Tobacco ControlProgram (L)
Centers for Disease Control and Prevention, Office onSmoking and Health (O)
Tobacco Action Coalition of Long Island (C)
American Heart Association (V)
Bureau of Sanitation and Food Protection, Division ofEnvironmental Health Protection, Center forEnvironmental Health (O)
Tobacco Control Program Advisory Board (O)
Desmond Media (CT)
Onondaga Cortland Madison BOCES (CT)
Coalition for a Smoke-Free City (C)
Statewide Center for Healthy Schools (O)
Coalition for a Tobacco-Free New York (SC)
American Cancer Society (V)
Roswell Park Cancer Institute (CT)
New York Public Interest Research Group (V)
American Lung Association (V)
Standard deviation
Density
0.23
0.16
0.11
0.01
0.00
0.00
-0.01
-0.01
-0.02
-0.03
-0.06
-0.07
-0.08
-0.11
-0.12
0.098
0.10
Agency (type) Score
New York
Michigan Department of Community Health TobaccoSection (L)
Center for Social Gerontology (CT)
Center for Tobacco Use Prevention and Research (O)
American Cancer Society (V)
American Heart Association (V)
American Lung Association (V)
Marquette County Tobacco-Free Coalition (C)
Wayne County Smoking and Tobacco InterventionCoalition (C)
Cristo Rey Community Center (CT)
Faith Access to Community Economic DevelopmentCorporation (CT)
Genesee County Smokefree Multi-Agency Resource Team(C)
University of Michigan Health System (O)
Tobacco Control Law & Policy Consulting (O)
Tobacco Free Michigan Action Coalition (SC)
Standard deviation
Density
0.52
0.07
0.07
0.03
0.03
0.03
0.00
0.00
0.00
0.00
0.00
-0.03
-0.07
-0.66
0.236
0.10
Agency (type) Score
Michigan
aTaylor’s influence provides a measure of the amount of financial influence one agency has over others; a negative value indicates a preponderance ofreceiving money over sending, a positive value indicates a preponderance of sending over receiving, and a neutral value indicates a balance of sending andreceiving; the greater the positive value, the greater the financial influence (31). An equation for calculating Taylor’s influence is provided in Appendix B. L =lead agency, C = coalitions, SC= statewide coalition, CT = contractor, V = voluntary agency/advocacy group, O = other agency.
VOLUME 1: NO. 4OCTOBER 2004
18 Centers for Disease Control and Prevention • www.cdc.gov/pcd/issues/2004/oct/04_0041.htm
The opinions expressed by authors contributing to this journal do not necessarily reflect the opinions of the U.S. Department of Health and Human Services,the Public Health Service, the Centers for Disease Control and Prevention, or the authors’ affiliated institutions. Use of trade names is for identification only
and does not imply endorsement by any of the groups named above.
Table 4.
Prestige as a Measure of Relationship Productivity in Five State Tobacco Control Networks, United States, 2002-2003a
Washington State Department of Health TobaccoPrevention & Control Program (L)
American Lung Association - Washington State Branch(V)
Washington Office of the Attorney General (O)
Group Health Cooperative, Center for Health Promotion(CT)
MWW/Savitt (O)
Washington Alliance for Tobacco Control and Children'sHealth (SC)
Tobacco Free Spokane (C)
Tacoma-Pierce County Health Department (CT)
American Cancer Society - Northwest Division (V)
Puget Sound Educational Service District (CT)
Sedgwick Rd (CT)
Washington State Hospital Association (O)
King County Tobacco Control Coalition (C)
Puyallup Tribe (CT)
Density
69.2
46.2
46.2
38.5
30.8
30.8
23.1
23.1
15.4
15.4
15.4
15.4
7.7
0.0
0.27
Agency (type) Score
Washington
Indiana Tobacco Prevention and Cessation Agency (L)
Indiana State Department of Health (O)
American Cancer Society (V)
Indiana Tobacco Prevention and Cessation AgencyExecutive Board (O)
Smokefree Indiana (O)
Indiana State Medical Association (O)
MZD Advertising (CT)
American Heart Association (V)
Tobacco Smart Indiana (C)
Smokefree Allen County (C)
Indiana Minority Health Coalition (CT)
Indiana Latino Institute, Inc (CT)
Marion County Tobacco Control Program (C)
Indiana Black Expo (CT)
Indiana Alliance of Boys & Girls Clubs (CT)
Density
85.7
57.1
57.1
57.1
42.9
42.9
42.9
35.7
28.6
28.6
28.6
28.6
21.4
21.4
0.0
0.39
Agency (type) Score
Indiana
(Continued on next page)
VOLUME 1: NO. 4OCTOBER 2004
www.cdc.gov/pcd/issues/2004/oct/04_0041.htm • Centers for Disease Control and Prevention 19
The opinions expressed by authors contributing to this journal do not necessarily reflect the opinions of the U.S. Department of Health and Human Services,the Public Health Service, the Centers for Disease Control and Prevention, or the authors’ affiliated institutions. Use of trade names is for identification only
and does not imply endorsement by any of the groups named above.
Table 4. (continued)
Prestige as a Measure of Relationship Productivity in Five State Tobacco Control Networks, United States, 2002-2003a
Wyoming Tobacco Use Prevention (SC)
American Heart Association (V)
Wyoming Statistical Analysis Center (CT)
Wyoming Department of Health Substance AbuseDivision, Tobacco Prevention and Control Program (L)
Natrona County Tobacco Use Prevention Task Force (C)
Partnership for Smoke-Free Families (CT)
American Cancer Society (V)
Making Laramie a Smoke Free Indoor Environment (C)
Department of Education (O)
Wyoming Medical Society (O)
Department of Maternal & Child Health (O)
Wyoming State Legislature (O)
Density
81.8
54.5
54.5
45.5
45.5
45.5
36.4
36.4
27.3
18.2
18.2
9.1
0.39
Agency (type) Score
Wyoming
American Cancer Society (V)
American Lung Association (V)
New York State Department of Health Tobacco ControlProgram (L)
American Heart Association (V)
Coalition for a Tobacco-Free New York (SC)
Coalition for a Smoke-Free City (C)
Tobacco Action Coalition of Long Island (C)
New York Public Interest Research Group (V)
Centers for Disease Control and Prevention, Office onSmoking and Health (O)
Statewide Center for Healthy Schools (O)
Bureau of Sanitation and Food Protection, Division ofEnvironmental Health Protection, Center forEnvironmental Health (O)
Tobacco Control Program Advisory Board (O)
Onondaga Cortland Madison BOCES (CT)
Roswell Park Cancer Institute (CT)
Desmond Media (CT)
Density
57.1
57.1
50.0
42.9
35.7
35.7
28.6
21.4
14.3
14.3
7.1
7.1
7.1
0.0
0.0
0.25
Agency (type) Score
New York
(Continued on next page)
VOLUME 1: NO. 4OCTOBER 2004
20 Centers for Disease Control and Prevention • www.cdc.gov/pcd/issues/2004/oct/04_0041.htm
The opinions expressed by authors contributing to this journal do not necessarily reflect the opinions of the U.S. Department of Health and Human Services,the Public Health Service, the Centers for Disease Control and Prevention, or the authors’ affiliated institutions. Use of trade names is for identification only
and does not imply endorsement by any of the groups named above.
Table 4. (continued)Prestige as a Measure of Relationship Productivity in Five
State Tobacco Control Networks, United States, 2002-2003a
Tobacco Free Michigan Action Coalition (SC)
Michigan Department of Community Health TobaccoSection (L)
American Lung Association (V)
Center for Social Gerontology (CT)
American Heart Association (V)
Genesee County Smokefree Multi-Agency ResourceTeam (C)
American Cancer Society (V)
Marquette County Tobacco-Free Coalition (C)
Cristo Rey Community Center (CT)
Faith Access to Community Economic DevelopmentCorporation (CT)
Tobacco Control Law & Policy Consulting (O)
Wayne County Smoking and Tobacco InterventionCoalition (C)
Center for Tobacco Use Prevention and Research (O)
University of Michigan Health System (O)
Density
92.3
76.9
76.9
53.8
38.5
38.5
30.8
30.8
30.8
30.8
30.8
23.1
15.4
7.7
0.41
Agency (type) Score
Michigan
Table 5. Correlation of Contact and Productivity Network Variables,Tobacco State Control Networks, United States, 2002–2003
WashingtonIndianaWyomingNew YorkMichigan
.330
.568
.497
.773
.641
.002<.001<.001<.001<.001
State PPearson Correlation
aPrestige provides a measure of relationship productivity and was measuredusing normalized indegree; the higher the indegree score, the more highlyproductive the relationship was considered to be and the higher the prestige(28). An equation for calculating normalized indegree is provided inAppendix B. L = lead agency, C = coalitions, SC= statewide coalition, CT= contractor, V = voluntary agency/advocacy group, O = other agency.
Contact/Productivity
VOLUME 1: NO. 4OCTOBER 2004
www.cdc.gov/pcd/issues/2004/oct/04_0041.htm • Centers for Disease Control and Prevention 21
The opinions expressed by authors contributing to this journal do not necessarily reflect the opinions of the U.S. Department of Health and Human Services,the Public Health Service, the Centers for Disease Control and Prevention, or the authors’ affiliated institutions. Use of trade names is for identification only
and does not imply endorsement by any of the groups named above.
AppendicesAppendix A. Example of Network Data Collection Form Used in Interviews, State Tobacco Control Networks, United States, 2002–2003
State Department of Health
American Cancer Society
American Heart Association
WY Tobacco Use Prevention
Making Laramie A Smoke FreeIndoor Environment
Natrona County Tobacco UsePrevention Task Force
WY Medical Society
WY Statistical Analysis Center
Partnership for Smoke FreeFamilies
Department of Maternal &Child Health
Department of Education
WY State Legislature
Agency Monthly Quarterly YearlyUnable toAnswerWeeklyDailyNo Contact
1. How often does your agency have contact (such as meetings, phone calls, or e-mails) with [AGENCY]?
8
8
8
8
8
8
8
8
8
8
8
8
6
6
6
6
6
6
6
6
6
6
6
6
5
5
5
5
5
5
5
5
5
5
5
5
4
4
4
4
4
4
4
4
4
4
4
4
3
3
3
3
3
3
3
3
3
3
3
3
2
2
2
2
2
2
2
2
2
2
2
2
1
1
1
1
1
1
1
1
1
1
1
1
(Continued on next page)
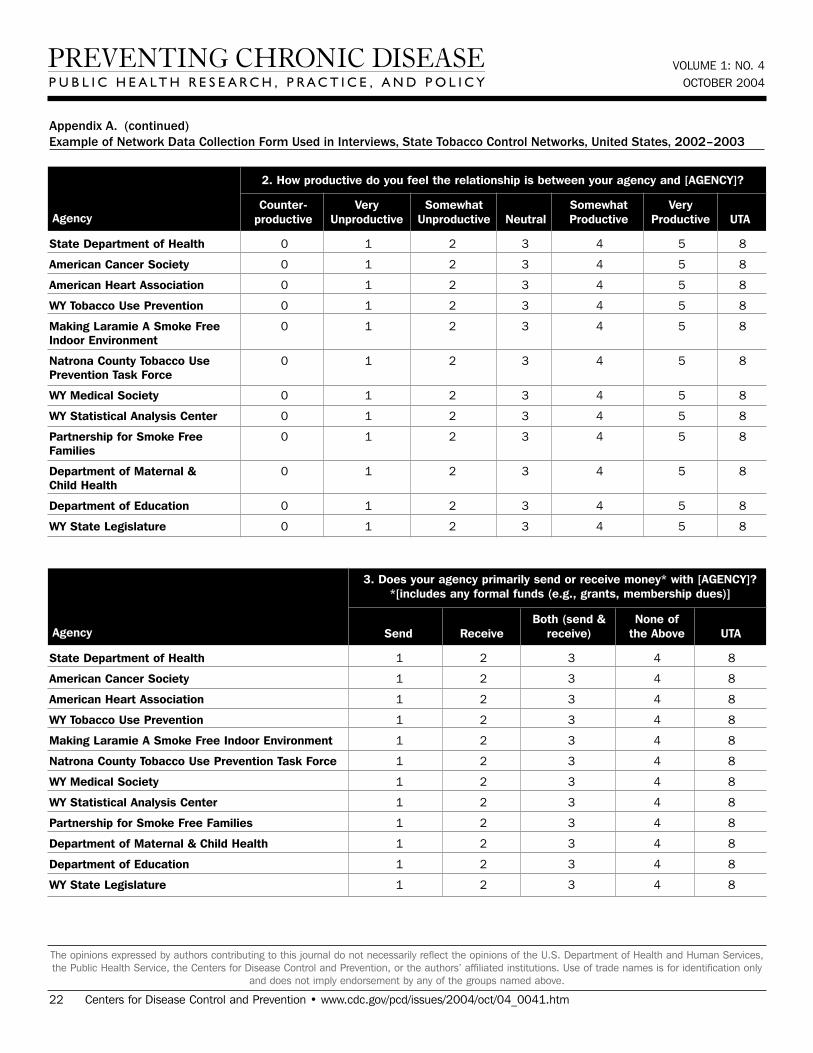
VOLUME 1: NO. 4OCTOBER 2004
22 Centers for Disease Control and Prevention • www.cdc.gov/pcd/issues/2004/oct/04_0041.htm
The opinions expressed by authors contributing to this journal do not necessarily reflect the opinions of the U.S. Department of Health and Human Services,the Public Health Service, the Centers for Disease Control and Prevention, or the authors’ affiliated institutions. Use of trade names is for identification only
and does not imply endorsement by any of the groups named above.
Appendix A. (continued)Example of Network Data Collection Form Used in Interviews, State Tobacco Control Networks, United States, 2002–2003
State Department of Health
American Cancer Society
American Heart Association
WY Tobacco Use Prevention
Making Laramie A Smoke FreeIndoor Environment
Natrona County Tobacco UsePrevention Task Force
WY Medical Society
WY Statistical Analysis Center
Partnership for Smoke FreeFamilies
Department of Maternal &Child Health
Department of Education
WY State Legislature
Agency NeutralSomewhatProductive
VeryProductive UTA
SomewhatUnproductive
VeryUnproductive
Counter-productive
2. How productive do you feel the relationship is between your agency and [AGENCY]?
8
8
8
8
8
8
8
8
8
8
8
8
5
5
5
5
5
5
5
5
5
5
5
5
4
4
4
4
4
4
4
4
4
4
4
4
3
3
3
3
3
3
3
3
3
3
3
3
2
2
2
2
2
2
2
2
2
2
2
2
1
1
1
1
1
1
1
1
1
1
1
1
0
0
0
0
0
0
0
0
0
0
0
0
State Department of Health
American Cancer Society
American Heart Association
WY Tobacco Use Prevention
Making Laramie A Smoke Free Indoor Environment
Natrona County Tobacco Use Prevention Task Force
WY Medical Society
WY Statistical Analysis Center
Partnership for Smoke Free Families
Department of Maternal & Child Health
Department of Education
WY State Legislature
AgencyNone of
the Above UTABoth (send &
receive)ReceiveSend
3. Does your agency primarily send or receive money* with [AGENCY]?*[includes any formal funds (e.g., grants, membership dues)]
4
4
4
4
4
4
4
4
4
4
4
4
8
8
8
8
8
8
8
8
8
8
8
8
3
3
3
3
3
3
3
3
3
3
3
3
2
2
2
2
2
2
2
2
2
2
2
2
1
1
1
1
1
1
1
1
1
1
1
1
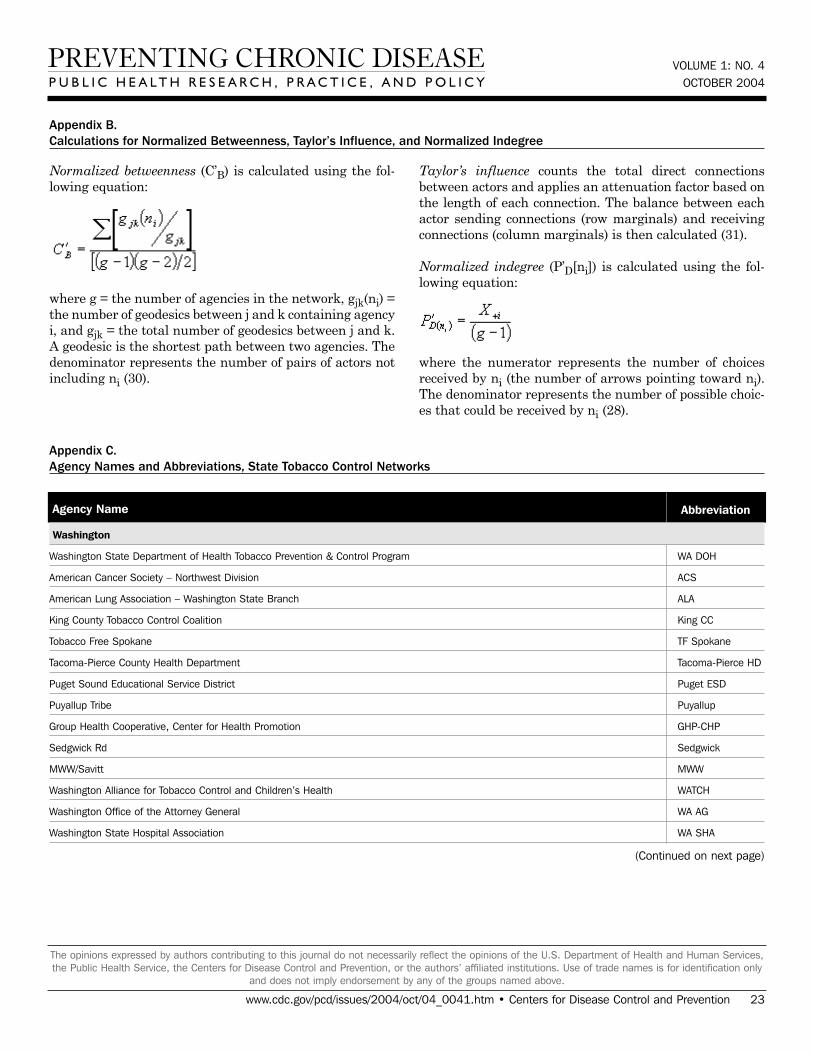
VOLUME 1: NO. 4OCTOBER 2004
www.cdc.gov/pcd/issues/2004/oct/04_0041.htm • Centers for Disease Control and Prevention 23
The opinions expressed by authors contributing to this journal do not necessarily reflect the opinions of the U.S. Department of Health and Human Services,the Public Health Service, the Centers for Disease Control and Prevention, or the authors’ affiliated institutions. Use of trade names is for identification only
and does not imply endorsement by any of the groups named above.
Appendix B. Calculations for Normalized Betweenness, Taylor’s Influence, and Normalized Indegree
Normalized betweenness (C’B) is calculated using the fol-lowing equation:
where g = the number of agencies in the network, gjk(ni) =the number of geodesics between j and k containing agencyi, and gjk = the total number of geodesics between j and k.A geodesic is the shortest path between two agencies. Thedenominator represents the number of pairs of actors notincluding ni (30).
Taylor’s influence counts the total direct connectionsbetween actors and applies an attenuation factor based onthe length of each connection. The balance between eachactor sending connections (row marginals) and receivingconnections (column marginals) is then calculated (31).
Normalized indegree (P’D[ni]) is calculated using the fol-lowing equation:
where the numerator represents the number of choicesreceived by ni (the number of arrows pointing toward ni).The denominator represents the number of possible choic-es that could be received by ni (28).
Appendix C. Agency Names and Abbreviations, State Tobacco Control Networks
Agency Name Abbreviation
Washington
Washington State Department of Health Tobacco Prevention & Control Program WA DOH
American Cancer Society – Northwest Division ACS
American Lung Association – Washington State Branch ALA
King County Tobacco Control Coalition King CC
Tobacco Free Spokane TF Spokane
Tacoma-Pierce County Health Department Tacoma-Pierce HD
Puget Sound Educational Service District Puget ESD
Puyallup Tribe Puyallup
Group Health Cooperative, Center for Health Promotion GHP-CHP
Sedgwick Rd Sedgwick
MWW/Savitt MWW
Washington Alliance for Tobacco Control and Children’s Health WATCH
Washington Office of the Attorney General WA AG
Washington State Hospital Association WA SHA
(Continued on next page)
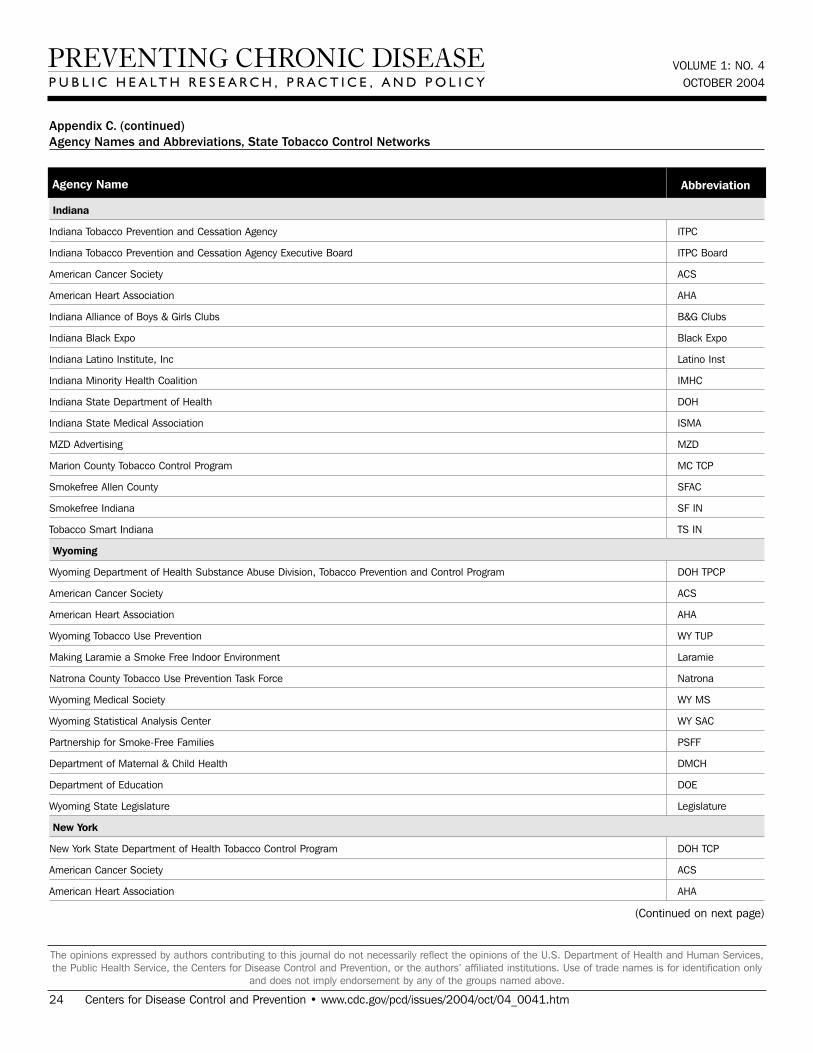
VOLUME 1: NO. 4OCTOBER 2004
24 Centers for Disease Control and Prevention • www.cdc.gov/pcd/issues/2004/oct/04_0041.htm
The opinions expressed by authors contributing to this journal do not necessarily reflect the opinions of the U.S. Department of Health and Human Services,the Public Health Service, the Centers for Disease Control and Prevention, or the authors’ affiliated institutions. Use of trade names is for identification only
and does not imply endorsement by any of the groups named above.
Appendix C. (continued)Agency Names and Abbreviations, State Tobacco Control Networks
Agency Name Abbreviation
Indiana
Indiana Tobacco Prevention and Cessation Agency ITPC
Indiana Tobacco Prevention and Cessation Agency Executive Board ITPC Board
American Cancer Society ACS
American Heart Association AHA
Indiana Alliance of Boys & Girls Clubs B&G Clubs
Indiana Black Expo Black Expo
Indiana Latino Institute, Inc Latino Inst
Indiana Minority Health Coalition IMHC
Indiana State Department of Health DOH
Indiana State Medical Association ISMA
MZD Advertising MZD
Marion County Tobacco Control Program MC TCP
Smokefree Allen County SFAC
Smokefree Indiana SF IN
Tobacco Smart Indiana TS IN
Wyoming
Wyoming Department of Health Substance Abuse Division, Tobacco Prevention and Control Program DOH TPCP
American Cancer Society ACS
American Heart Association AHA
Wyoming Tobacco Use Prevention WY TUP
Making Laramie a Smoke Free Indoor Environment Laramie
Natrona County Tobacco Use Prevention Task Force Natrona
Wyoming Medical Society WY MS
Wyoming Statistical Analysis Center WY SAC
Partnership for Smoke-Free Families PSFF
Department of Maternal & Child Health DMCH
Department of Education DOE
Wyoming State Legislature Legislature
New York
New York State Department of Health Tobacco Control Program DOH TCP
American Cancer Society ACS
American Heart Association AHA
(Continued on next page)
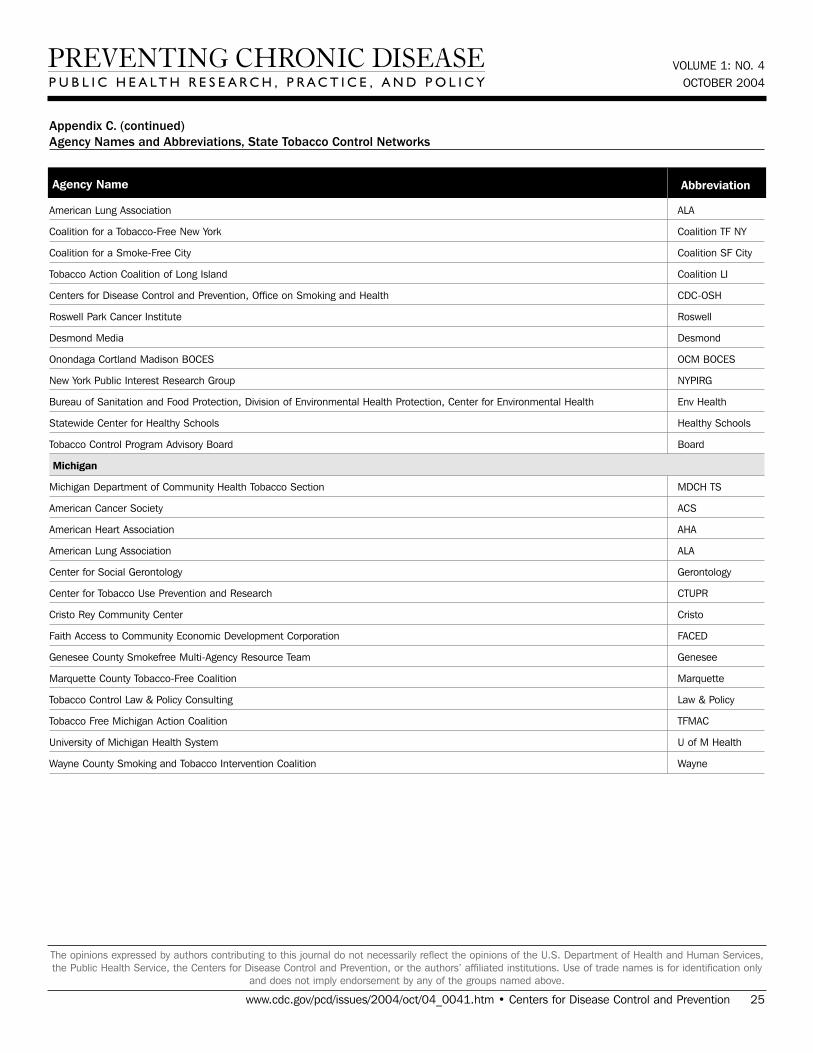
VOLUME 1: NO. 4OCTOBER 2004
www.cdc.gov/pcd/issues/2004/oct/04_0041.htm • Centers for Disease Control and Prevention 25
The opinions expressed by authors contributing to this journal do not necessarily reflect the opinions of the U.S. Department of Health and Human Services,the Public Health Service, the Centers for Disease Control and Prevention, or the authors’ affiliated institutions. Use of trade names is for identification only
and does not imply endorsement by any of the groups named above.
Appendix C. (continued)Agency Names and Abbreviations, State Tobacco Control Networks
Agency Name Abbreviation
American Lung Association ALA
Coalition for a Tobacco-Free New York Coalition TF NY
Coalition for a Smoke-Free City Coalition SF City
Tobacco Action Coalition of Long Island Coalition LI
Centers for Disease Control and Prevention, Office on Smoking and Health CDC-OSH
Roswell Park Cancer Institute Roswell
Desmond Media Desmond
Onondaga Cortland Madison BOCES OCM BOCES
New York Public Interest Research Group NYPIRG
Bureau of Sanitation and Food Protection, Division of Environmental Health Protection, Center for Environmental Health Env Health
Statewide Center for Healthy Schools Healthy Schools
Tobacco Control Program Advisory Board Board
Michigan
Michigan Department of Community Health Tobacco Section MDCH TS
American Cancer Society ACS
American Heart Association AHA
American Lung Association ALA
Center for Social Gerontology Gerontology
Center for Tobacco Use Prevention and Research CTUPR
Cristo Rey Community Center Cristo
Faith Access to Community Economic Development Corporation FACED
Genesee County Smokefree Multi-Agency Resource Team Genesee
Marquette County Tobacco-Free Coalition Marquette
Tobacco Control Law & Policy Consulting Law & Policy
Tobacco Free Michigan Action Coalition TFMAC
University of Michigan Health System U of M Health
Wayne County Smoking and Tobacco Intervention Coalition Wayne