Original Research Article - Journals publishers | … Demonstrator, 2Assistant Professor, Dept. of...
13
Original Research Article International Journal of Clinical Biochemistry and Research 2016;3(2):214-226 214 Comparison of Level of thyroid hormone between pregnant and non-pregnant women Raghav Nepalia 1,* , Renuka Z Lal 2 1 Senior Demonstrator, 2 Assistant Professor, Dept. of Biochemistry, RNT Medical College, Rajasthan *Corresponding Author: Email: [email protected] Abstract Background: The thyroid diseases hyperthyroidism and hypothyroidism are relatively common in pregnancy and important to treat. During pregnancy, if you have pre-existing hyperthyroidism or hypothyroidism, you may require more medical attention to control these conditions during pregnancy, especially in the first trimester. Aims & Objective: To know optimum values of T3, T4 and TSHduring various trimesters of pregnancy. To find rise/fall in values with increasing duration of pregnancy. To compare thyroid profile values of pregnancy cases with the non-pregnant. Methodology: The present case control study was conducted on 100 patients (obstetric cases) attended and managed in the Department of Obstetrics and Gynaecology attached to Geetanjali Medical College and Hospital, Udaipur. The results of the patients were compared with 100 age matched control females having gynaecological problems (with normal thyroid). Fasting blood sample was investigated for the following parameters: T3 (Triiodothyronine). T4 (Thyroxine). TSH (Thyrotropin Stimulating Hormone), FT3, FT4 and Hemoglobin(Hb). P-value was calculated by using online student t-test calculator. Result: All the cases of the control group had normal T3 values. Values below normal were noted in one case each of I and III trimester and normal values were noted in 80.27 per cent in I trimester, 54.75 per cent in II and 55.28 per cent in the III trimester. Only 18.30 per cent cases of I trimester had raised values of T3 while same was observed in 44.03 per cent in II and 43.51 per cent in III trimester. Variable values of T4 were observed in various trimesters of pregnancy. Values of T4 were below normal in 2.81 per cent in I, 1.20 per cent in II and 1.14 per cent in the III trimester. On the other hand in II and III trimester T4 values were higher than normal in 6.02 per cent and 40.22 per cent respectively. TSH value below normal (0.27μIU/dl) were observed in 2 cases in I and II trimester each while normal values were noted in most of the cases i.e. 77.45 per cent in I, 71.41 per cent in II and 83.31per cent in III trimester. Fluctuating values of TSH above 4.2 μIU/dl were observed in 19.71per cent in I, 26.18per cent in II and 16.66 per cent in the III trimester. Conclusion: T3 values increased during pregnancy significantly more so in II trimester. T4 values were less during I trimester particularly at par during II trimester and increased during III trimester. Raised TSH values were observed during pregnancy as compared to non-pregnant women. Significant increase was observed during II trimester. Access this article online Quick Response Code: Website: www.innovativepublication.com DOI: 10.5958/2394-6377.2016.00042.3 Introduction Too much thyroid hormone is called hyperthyroidism and can cause many of the body’s functions to speed up. Too little thyroid hormone is called hypothyroidism and can cause many of the body’s functions to slow down. [1] Thyroid hormone plays a critical role during pregnancy both in the development of a healthy baby and in maintaining the health of the mother. Untreated thyroid diseases in pregnancy may lead to premature birth, preeclampsia (a severe increase in blood pressure), miscarriage, and low birth weight among other problems. It is important to talk to your doctor if you have any history of hypothyroidism or hyperthyroidism so you can be monitored before, and during pregnancy and your treatment adjusted if necessary. [2] These normal hormonal changes can sometimes make thyroid function tests during pregnancy difficult to interpret. Thyroid hormone is critical to normal development of the baby’s brain and nervous system. During the first trimester, the fetus depends on the mother’s supply of thyroid hormone, which comes through the placenta. At around 12 weeks, the baby’s thyroid begins to function on its own. [3] Material and Methods The present case control study was conducted on 100 patients (obstetric cases) attended and managed in the Department of Obstetrics and Gynaecology attached to Geetanjali Medical College and Hospital, Udaipur over a period of 10 months from 25 th July 2011 to 10 th May 2012. The results of the patients were compared with 100 age matched control females having gynaecological problems (with normal thyroid). The subjects for the study were grouped as follows:- Group A (Study Group): Study group will consist of obstetric cases of various trimesters. (n=100).
Transcript of Original Research Article - Journals publishers | … Demonstrator, 2Assistant Professor, Dept. of...

Original Research Article
International Journal of Clinical Biochemistry and Research 2016;3(2):214-226 214
Comparison of Level of thyroid hormone between pregnant and non-pregnant
women
Raghav Nepalia1,*, Renuka Z Lal2
1Senior Demonstrator, 2Assistant Professor, Dept. of Biochemistry, RNT Medical College, Rajasthan
*Corresponding Author: Email: [email protected]
Abstract Background: The thyroid diseases hyperthyroidism and hypothyroidism are relatively common in pregnancy and important to
treat. During pregnancy, if you have pre-existing hyperthyroidism or hypothyroidism, you may require more medical attention to
control these conditions during pregnancy, especially in the first trimester.
Aims & Objective: To know optimum values of T3, T4 and TSHduring various trimesters of pregnancy. To find rise/fall in
values with increasing duration of pregnancy. To compare thyroid profile values of pregnancy cases with the non-pregnant.
Methodology: The present case control study was conducted on 100 patients (obstetric cases) attended and managed in the
Department of Obstetrics and Gynaecology attached to Geetanjali Medical College and Hospital, Udaipur. The results of the
patients were compared with 100 age matched control females having gynaecological problems (with normal thyroid). Fasting
blood sample was investigated for the following parameters: T3 (Triiodothyronine). T4 (Thyroxine). TSH (Thyrotropin
Stimulating Hormone), FT3, FT4 and Hemoglobin(Hb). P-value was calculated by using online student t-test calculator.
Result: All the cases of the control group had normal T3 values. Values below normal were noted in one case each of I and III
trimester and normal values were noted in 80.27 per cent in I trimester, 54.75 per cent in II and 55.28 per cent in the III trimester.
Only 18.30 per cent cases of I trimester had raised values of T3 while same was observed in 44.03 per cent in II and 43.51 per
cent in III trimester. Variable values of T4 were observed in various trimesters of pregnancy. Values of T4 were below normal in
2.81 per cent in I, 1.20 per cent in II and 1.14 per cent in the III trimester. On the other hand in II and III trimester T4 values were
higher than normal in 6.02 per cent and 40.22 per cent respectively. TSH value below normal (0.27μIU/dl) were observed in 2
cases in I and II trimester each while normal values were noted in most of the cases i.e. 77.45 per cent in I, 71.41 per cent in II
and 83.31per cent in III trimester. Fluctuating values of TSH above 4.2 μIU/dl were observed in 19.71per cent in I, 26.18per cent
in II and 16.66 per cent in the III trimester.
Conclusion: T3 values increased during pregnancy significantly more so in II trimester. T4 values were less during I trimester
particularly at par during II trimester and increased during III trimester. Raised TSH values were observed during pregnancy as
compared to non-pregnant women. Significant increase was observed during II trimester.
Access this article online
Quick Response
Code:
Website:
www.innovativepublication.com
DOI: 10.5958/2394-6377.2016.00042.3
Introduction Too much thyroid hormone is called
hyperthyroidism and can cause many of the body’s
functions to speed up. Too little thyroid hormone is
called hypothyroidism and can cause many of the
body’s functions to slow down.[1]
Thyroid hormone plays a critical role during pregnancy
both in the development of a healthy baby and in
maintaining the health of the mother. Untreated thyroid
diseases in pregnancy may lead to premature birth,
preeclampsia (a severe increase in blood pressure),
miscarriage, and low birth weight among other
problems. It is important to talk to your doctor if you
have any history of hypothyroidism or hyperthyroidism
so you can be monitored before, and during pregnancy
and your treatment adjusted if necessary.[2]
These normal hormonal changes can
sometimes make thyroid function tests during
pregnancy difficult to interpret. Thyroid hormone is
critical to normal development of the baby’s brain and
nervous system. During the first trimester, the fetus
depends on the mother’s supply of thyroid hormone,
which comes through the placenta. At around 12
weeks, the baby’s thyroid begins to function on its
own.[3]
Material and Methods The present case control study was conducted on
100 patients (obstetric cases) attended and managed in
the Department of Obstetrics and Gynaecology attached
to Geetanjali Medical College and Hospital, Udaipur
over a period of 10 months from 25th July 2011 to 10th
May 2012.
The results of the patients were compared with 100
age matched control females having gynaecological
problems (with normal thyroid).
The subjects for the study were grouped as follows:-
Group A (Study Group): Study group will consist of
obstetric cases of various trimesters. (n=100).

Raghav Nepalia et al. Comparison of Level of thyroid hormone between pregnant and non-pregnant….
International Journal of Clinical Biochemistry and Research 2016;3(2):214-226 215
Group B (Control Group): Females with
gynaecological problems, having normal thyroid
(control group). (n=100).
Inclusion criteria for study are as follows:
1. Cases having no known thyroid problem were
included in the study.
2. Age between 18-48 years.
3. Obstetric cases during I, II and III trimester
irrespective of obstetric/medical complication were
included.
Exclusion criteria included those with:
The following are the conditions associated with
euthyroidhyperthyroxinemia which were excluded from
the present study:
1. Familial dysalbuminemichyperthyroxinemia.
2. Thyroid Binding Globulin (familial excess,
acquired excess).
3. Transthyretin (excess, mutations).
4. Medications (Propranolol, Ipodate, Popanic acid,
Aminodarone).
5. Sick Euthyroid Syndrome.
6. Resistance to thyroid hormone.
In the proposed study the case study was done as
per pre laid proforma (CASE RECORD).
All patients were questioned and the information of
the interview was recorded on the printed proforma.
Details about patient’s name, age, husband’s name
and address, urban or rural, education status, S/E status
were taken.
S/E status was calculated by criteria laid down by A K
Agarwal (2008)[4]:
Low (Poor+ Very Poor) Rs. 500-1499 per capita
monthly income.
Middle (Lower+ Upper) Rs. 1500-4999 per capita
monthly income.
High (High+ Upper High) Rs. 5000-10000 and
above per capita monthly income.
Details about obstetric history, menstrual history,
associated medical problems and obstetric complication
(if any) were noted.
The blood collection and sample study was done in
clinical laboratory attached to the Department of
Biochemistry, Geetanjali Medical College and Hospital,
Udaipur.
Fasting blood sample was investigated for the following
parameters:-
T3 (Triiodothyronine). [Refrence range:0.87-1.78
ng/ml]
T4 (Thyroxine). [Refrence range:6-12.23 μg/dl]
TSH (Thyrotropin Stimulating Hormone).
[Refrence range:0.5-5 μIU/ml]
FT3 [Refrence range:2.5-3.9 pg/ml]
FT4 [Refrence range:0.61-1.12 ng/dl]
Hemoglobin
The collected samples were incubated at 370C for
15 minutes in the incubator and then centrifuged for 10
minutes at approximately 3000 rpm and serum obtained
was used in thyroid assay.
All the thyroid parameters were measured by
ECLIA (Electro chemiluminescence immunoassay) and
were done on Elecsys 2010 using commercial available
kits of Cobas.
Hemoglobin was measured by Sahlis method.
Based on biochemical evaluation each individual
case was categorized and inference was drawn out.
An obtained result of case group was compared
with control group for determination of difference of
significance.
P-value was calculated by using online student t-
test calculator. p-value less than 0.05 was consider as
significant.
Results Age and parity wise distribution of participants was
done(Table 1, 2).
An obtained result of case group was compared
with control group for determination of difference of
significance.
p-value less than 0.05 was consider as significant.
Table 1: Age wise distribution of participants
Age (Yrs.) Study Group Control Group
No. of cases % No. of cases %
Below 20 1 1 2 2
20-25 32 32 24 24
26-30 52 52 25 25
31-35 12 12 14 14
36-40 3 3 14 14
>40 Nil Nil 21 21
Total 100 100 100 100
Mean 27.43 - 32 -
Minimum Age 19 - 18 -
Maximum Age 38 - 50 -
Raghav Nepalia et al. Comparison of Level of thyroid hormone between pregnant and non-pregnant….
International Journal of Clinical Biochemistry and Research 2016;3(2):214-226 216
Fig. 1: Graphical presentation of Age wise distribution of participants
Table 2: Showing parity wise distribution
Parity Study Group
No. of cases %
Primi 48 48
II trimester 28 28
III trimester 16 16
More than III trimester 8 8
Total 100 100
Fig. 2: Graphical presentation of parity wise distribution
Table 3: Socioeconomic status of participants
S/E Status Study Group Control Group
No. of cases % No. of cases %
Low 2 2 35 35
Middle 45 45 41 41
High 53 53 24 24
Total 100 100 100 100
Only 2 per cent of the obstetric cases were of low S/E status while as much as 35 per cent of cases in the control
group had low S/E status. Incidence of middle S/E status was 45 per cent in the study group and 41 per cent in the
control group. 53 per cent 0f the cases in the study and 24per cent of the cases in the control group were from high
S/E status.

Raghav Nepalia et al. Comparison of Level of thyroid hormone between pregnant and non-pregnant….
International Journal of Clinical Biochemistry and Research 2016;3(2):214-226 217
Fig. 3: Graphical distribution of participants based on socioeconomic status
Table 3A: Socioeconomic status of participants
Thyroid disorder during
pregnancy
S/E Status
High Middle Low
No. of cases No. of
cases %
No. of
cases %
No. of
cases %
37 21 56.76 15 40.54 1 2.70
Table 4: Educational status of the cases
Educational Status Study Group Control Group
No. of cases % No. of cases %
Illiterate 6 6 40 40
Primary 2 2 4 4
Middle 7 7 18 18
Intermediate and above 85 85 38 38
Total 100 100 100 100
Only 6 per cent of the cases of the study group and as much as 40 per cent cases of the control group were
illiterate. Most of the cases in the study group were well educated (85 per cent).
Fig. 4: Educational status of the cases
Table 4A: Educational status of the cases
Raghav Nepalia et al. Comparison of Level of thyroid hormone between pregnant and non-pregnant….
International Journal of Clinical Biochemistry and Research 2016;3(2):214-226 218
Thyroid disorder
during pregnancy
Education
Intermediate and
above Middle Primary Illiterate
No. of cases No. of
cases %
No. of
cases %
No. of
cases %
No. of
cases %
37 28 75.67 4 10.81 1 2.70 4 10.81
The above table depicts that higher was the educational status more was the chance for thyroid disorder in the
present study.
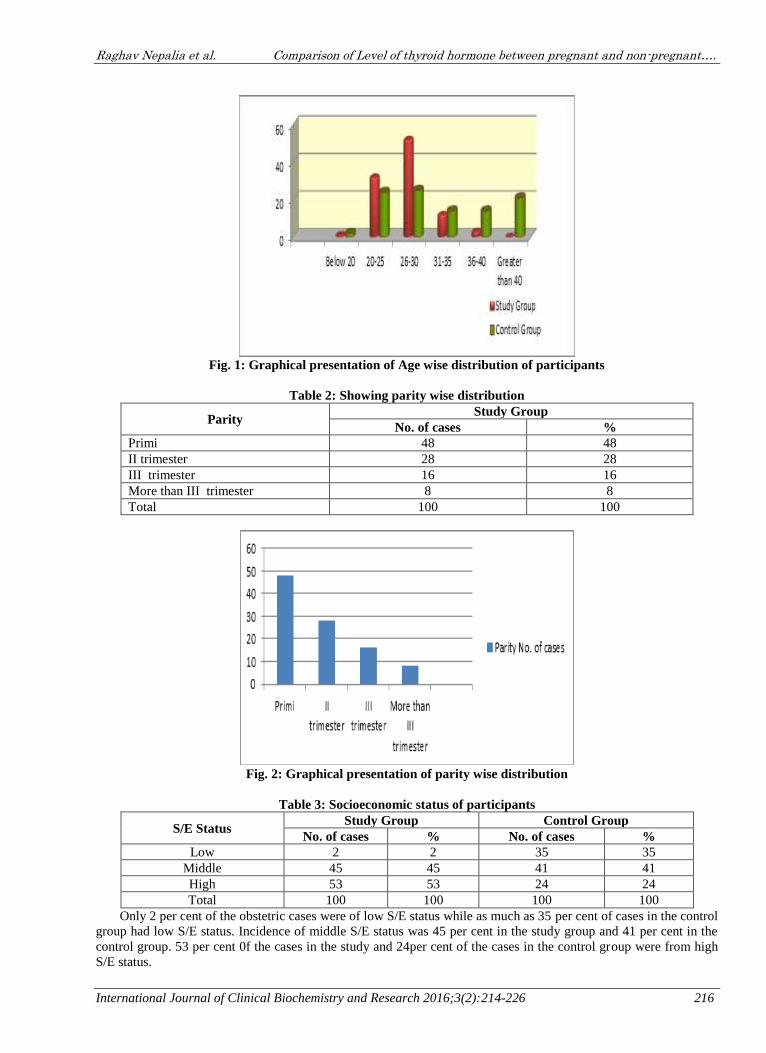
Table 5: Distribution of participants based on locality
Type of case Study Group Control Group
No. of cases % No. of cases %
Urban(U) 80 80 60 60
Rural (R) 20 20 40 40
Total 100 100 100 100
Fig. 5: Graphical Distribution of participants based on locality
Table 5A: Distribution of participants based on locality
Thyroid disorder during
pregnancy
R/U
Rural Urban
No. of cases
No. of cases % No. of cases %
37 8 21.62 29 78.37
Table 6: Hemoglobin status of participants
Haemoglobin (g/dl) Study Group Control Group
No. of cases % No. of cases %
Less than 8 1 1 12 12
8-10 16 16 7 7
10.1-12 53 53 39 39
>12.1 30 30 42 42
Total 100 100 100 100
Mean 11.41 - 11.18 -
Minimum value 7.10 - 3.20 -
Maximum value 14.60 - 13.90 -
Incidence of thyroid disorder in urban population was much higher (78.37 per cent) compared to rural
counterparts (21.62 per cent). This may be a repercussion of higher education, better S/E status and more stressful
lifestyle.
Raghav Nepalia et al. Comparison of Level of thyroid hormone between pregnant and non-pregnant….
International Journal of Clinical Biochemistry and Research 2016;3(2):214-226 219
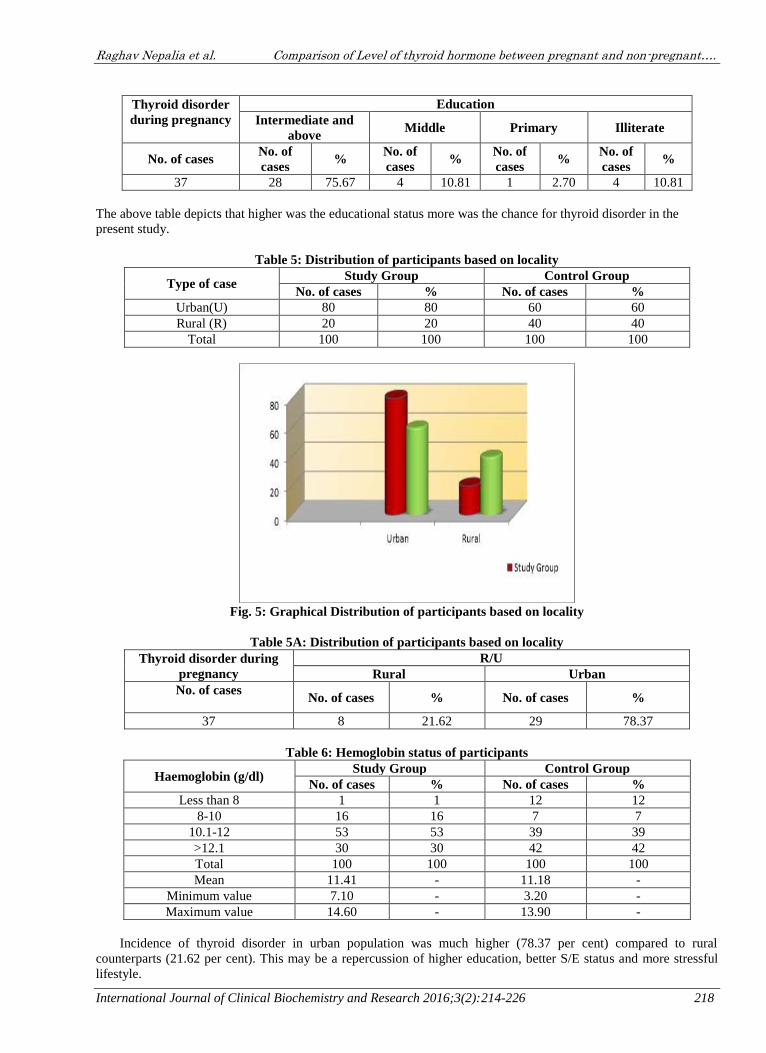
Table 6A: Hemoglobin status of participants
Thyroid disorder during pregnancy Anaemia
No. of cases %
37 3 8.10
Incidence of anaemia was 17 per cent in the study group with haemoglobin less than 10g/dl while the same in
the control group was (19 per cent).
Fig. 6: Graphical presentation of hemoglobin status of participants
Table 7: Weight wise distribution of participants
Weight (kg) Study Group Control Group
No. of cases % No. of cases %
Less than 40 Nil Nil 1 1
40-50 13 13 39 39
51-60 39 39 28 28
61-60 28 28 20 20
>70 20 20 12 12
Total 100 100 100 100
Mean 61.92 - 56.31 -
Minimum weight 40.00 - 35.00 -
Maximum weight 95.00 - 92.00 -
The minimum weight of the study group was 40kg. On the other hand it was 35kg in the control group.
Maximum weight was 95Kg in the study group and 92Kg in the control group. The mean weight of the study group
was 61.92kg.
Raghav Nepalia et al. Comparison of Level of thyroid hormone between pregnant and non-pregnant….
International Journal of Clinical Biochemistry and Research 2016;3(2):214-226 220
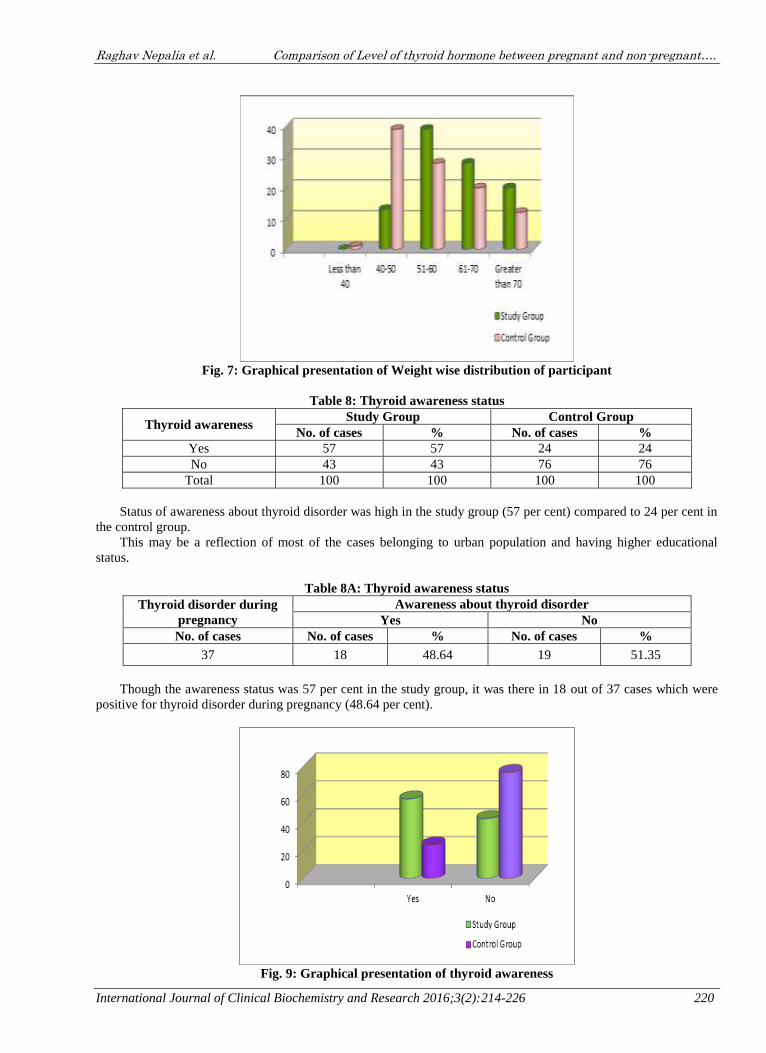
Fig. 7: Graphical presentation of Weight wise distribution of participant
Table 8: Thyroid awareness status
Thyroid awareness Study Group Control Group
No. of cases % No. of cases %
Yes 57 57 24 24
No 43 43 76 76
Total 100 100 100 100
Status of awareness about thyroid disorder was high in the study group (57 per cent) compared to 24 per cent in
the control group.
This may be a reflection of most of the cases belonging to urban population and having higher educational
status.
Table 8A: Thyroid awareness status
Thyroid disorder during
pregnancy
Awareness about thyroid disorder
Yes No
No. of cases No. of cases % No. of cases %
37 18 48.64 19 51.35
Though the awareness status was 57 per cent in the study group, it was there in 18 out of 37 cases which were
positive for thyroid disorder during pregnancy (48.64 per cent).
Fig. 9: Graphical presentation of thyroid awareness

Raghav Nepalia et al. Comparison of Level of thyroid hormone between pregnant and non-pregnant….
International Journal of Clinical Biochemistry and Research 2016;3(2):214-226 221
Table 10: Distribution based on family history
Family history of thyroid
disease
Study Group Control Group
No. of cases % No. of cases %
Yes 15 15 6 6
No 85 85 94 94
Total 100 100 100 100
Table 10A: Distribution based on family history
Deranged thyroid values
Family history of thyroid disorder
Yes No
No. of cases No. of cases % No. of cases %
37 8 21.62 29 78.37
Fig. 10: Graphical presentation of Family history of thyroid disorder
Overall 37 of the cases had deranged thyroid values during pregnancy. Out of which 8 (21.62 per cent) had
positive family background of thyroid disease and rest of the cases (78.37 per cent) had no such family background.
Table 11: Associated medical problem of study group
Associated medical Problems
Study Group
No. of cases %
Toxoplasmosis 1 11.11
Gastroenteritis 1 11.11
Past history of insulin 1 11.11
Past history of tuberculosis 1 11.11
UTI 1 11.11
Asthma 1 11.11
Wheat allergy 1 11.11
Thrombocytopenia 1 11.11
GDM 1 11.11
Total 9 100
Table 11A: Associated medical problem of study group
Thyroid disorder in pregnancy Associated medical problems
No. of cases %
37 3 8.10
Raghav Nepalia et al. Comparison of Level of thyroid hormone between pregnant and non-pregnant….
International Journal of Clinical Biochemistry and Research 2016;3(2):214-226 222
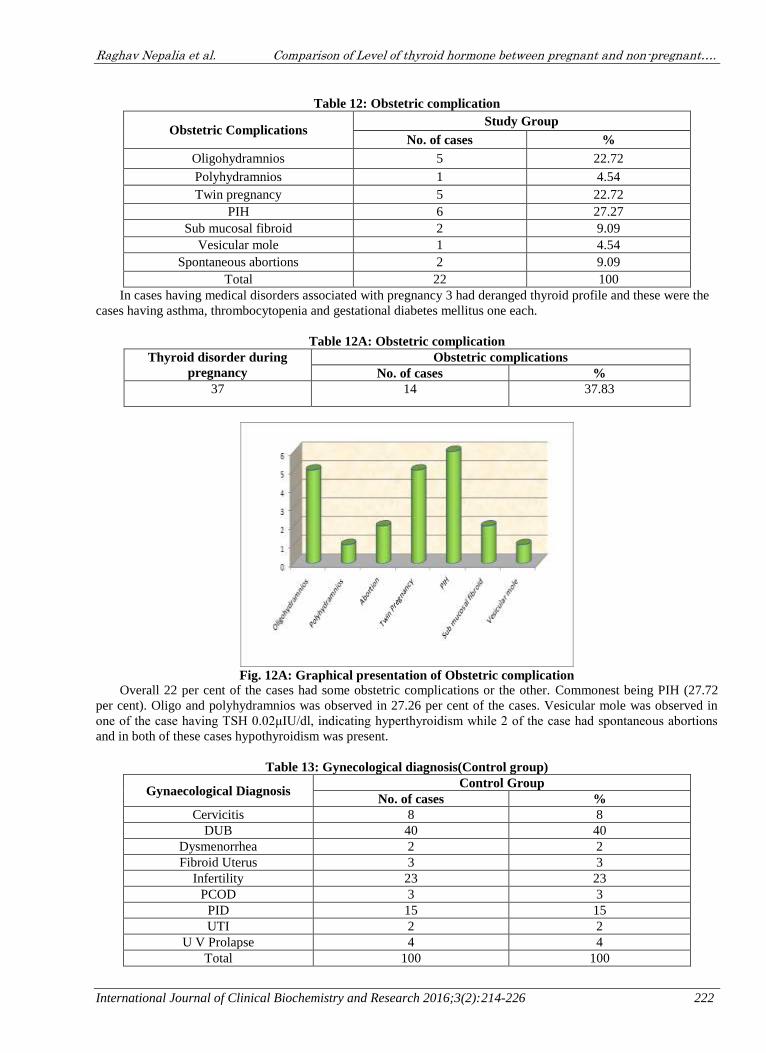
Table 12: Obstetric complication
Obstetric Complications Study Group
No. of cases %
Oligohydramnios 5 22.72
Polyhydramnios 1 4.54
Twin pregnancy 5 22.72
PIH 6 27.27
Sub mucosal fibroid 2 9.09
Vesicular mole 1 4.54
Spontaneous abortions 2 9.09
Total 22 100
In cases having medical disorders associated with pregnancy 3 had deranged thyroid profile and these were the
cases having asthma, thrombocytopenia and gestational diabetes mellitus one each.
Table 12A: Obstetric complication
Thyroid disorder during
pregnancy
Obstetric complications
No. of cases %
37 14 37.83
Fig. 12A: Graphical presentation of Obstetric complication
Overall 22 per cent of the cases had some obstetric complications or the other. Commonest being PIH (27.72
per cent). Oligo and polyhydramnios was observed in 27.26 per cent of the cases. Vesicular mole was observed in
one of the case having TSH 0.02μIU/dl, indicating hyperthyroidism while 2 of the case had spontaneous abortions
and in both of these cases hypothyroidism was present.
Table 13: Gynecological diagnosis(Control group)
Gynaecological Diagnosis Control Group
No. of cases %
Cervicitis 8 8
DUB 40 40
Dysmenorrhea 2 2
Fibroid Uterus 3 3
Infertility 23 23
PCOD 3 3
PID 15 15
UTI 2 2
U V Prolapse 4 4
Total 100 100

Raghav Nepalia et al. Comparison of Level of thyroid hormone between pregnant and non-pregnant….
International Journal of Clinical Biochemistry and Research 2016;3(2):214-226 223
40 per cent of the cases had DUB while 60 per cent had other gynaecological problems.
Fig. 13: Graphical presentation of Gynaecological problems (Control group)
Table 14: Showing level of T3 in case and control group (ng/ml)
T3 (ng/ml)
Study Group Control group
Trimester
I II III
No. of
cases %
No. of
cases %
No. of
cases %
No. of
cases %
Below 0.8 1 1.40 Nil Nil 1 1.17 Nil Nil
0.8-2 57 80.27 46 54.75 47 55.28 100 100
>2 13 18.30 38 44.03 37 43.51 Nil Nil
Total 71 100 84 100 85 100 100 100
Mean 1.77 - 9.09 - 4.43 - 1.35 -
Minimum value 0.23 - 0.89 - 0.68 - 0.86 -
Maximum value 8.90 - 141 - 38 - 2 -
Fig. 14: Showing Graphical presentation of T3 level in case and control group (ng/ml)
All the cases of control group had normal T3 values. Values below normal were noted in one case each of I and
III trimester and normal values were noted in 80.27 per cent in I trimester, 54.75per cent in the II and 55.28 per cent
in III trimester. Only 18.30 per cent cases of I trimester had raised values of T3 while same was observed in 44.03
per cent in II trimester and 43.51 per cent in III trimester.
Raghav Nepalia et al. Comparison of Level of thyroid hormone between pregnant and non-pregnant….
International Journal of Clinical Biochemistry and Research 2016;3(2):214-226 224
Table 15: Showing level of T4(μg/dl) in case and control group
T4(μg/dl)
Study Group Control group
Trimester
I II III
No. of
cases %
No. of
cases %
No. of
cases %
No. of
cases %
Below 5.1 2 2.81 1 1.20 1 1.14 Nil Nil
5.1-14.1 69 97.17 77 87.95 51 58.61 100 100
>14.1 Nil Nil 5 6.02 35 40.22 Nil Nil
Total 71 100 83 100 87 100 100 100
Mean 6.65 - 9.47 - 13.45 - 9.26 -
Minimum
value 1.00 - 3.40 - 1.22 - 5.20 -
Maximum
value 13.08 - 24.86 - 20.80 - 14.10 -
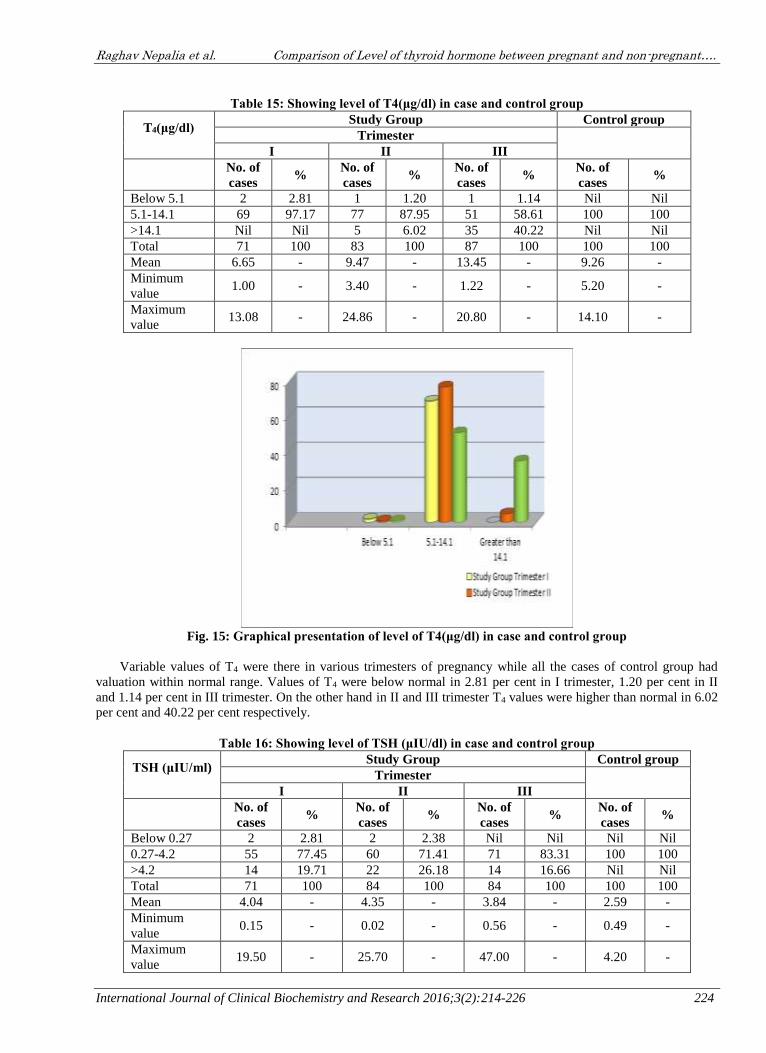
Fig. 15: Graphical presentation of level of T4(μg/dl) in case and control group
Variable values of T4 were there in various trimesters of pregnancy while all the cases of control group had
valuation within normal range. Values of T4 were below normal in 2.81 per cent in I trimester, 1.20 per cent in II
and 1.14 per cent in III trimester. On the other hand in II and III trimester T4 values were higher than normal in 6.02
per cent and 40.22 per cent respectively.
Table 16: Showing level of TSH (μIU/dl) in case and control group
TSH (μIU/ml)
Study Group Control group
Trimester
I II III
No. of
cases %
No. of
cases %
No. of
cases %
No. of
cases %
Below 0.27 2 2.81 2 2.38 Nil Nil Nil Nil
0.27-4.2 55 77.45 60 71.41 71 83.31 100 100
>4.2 14 19.71 22 26.18 14 16.66 Nil Nil
Total 71 100 84 100 84 100 100 100
Mean 4.04 - 4.35 - 3.84 - 2.59 -
Minimum
value 0.15 - 0.02 - 0.56 - 0.49 -
Maximum
value 19.50 - 25.70 - 47.00 - 4.20 -
Raghav Nepalia et al. Comparison of Level of thyroid hormone between pregnant and non-pregnant….
International Journal of Clinical Biochemistry and Research 2016;3(2):214-226 225
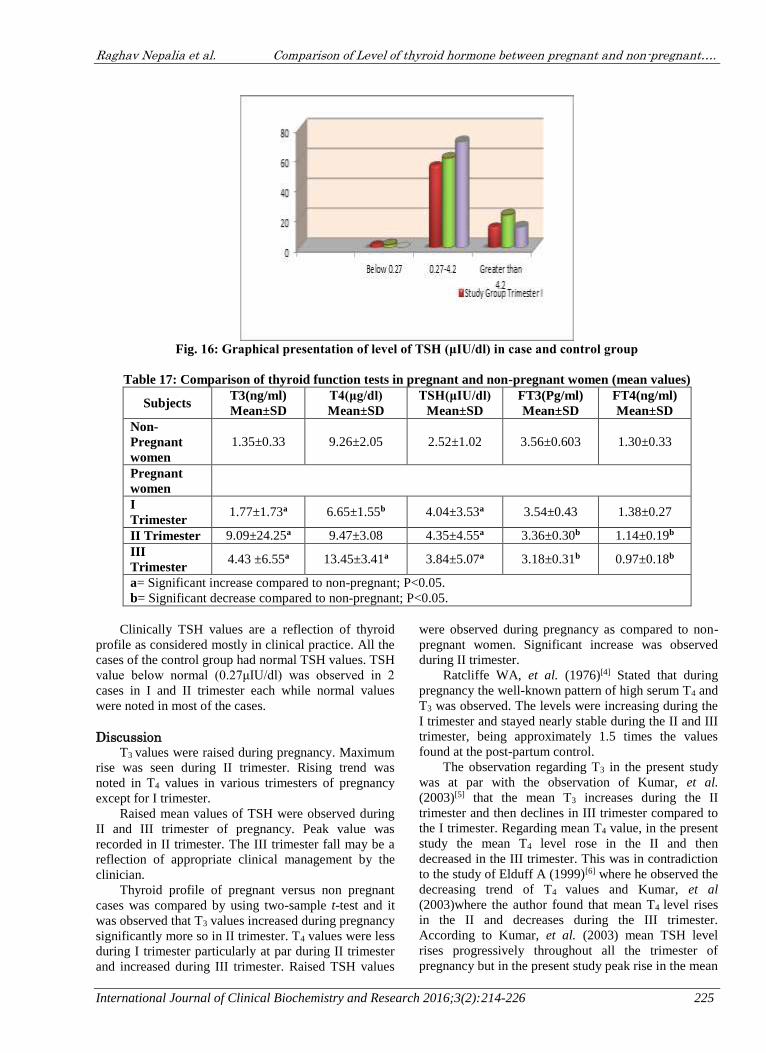
Fig. 16: Graphical presentation of level of TSH (μIU/dl) in case and control group
Table 17: Comparison of thyroid function tests in pregnant and non-pregnant women (mean values)
Subjects T3(ng/ml)
Mean±SD
T4(μg/dl)
Mean±SD
TSH(μIU/dl)
Mean±SD
FT3(Pg/ml)
Mean±SD
FT4(ng/ml)
Mean±SD
Non-
Pregnant
women
1.35±0.33 9.26±2.05 2.52±1.02 3.56±0.603 1.30±0.33
Pregnant
women
I
Trimester 1.77±1.73a 6.65±1.55b 4.04±3.53a 3.54±0.43 1.38±0.27
II Trimester 9.09±24.25a 9.47±3.08 4.35±4.55a 3.36±0.30b 1.14±0.19b
III
Trimester 4.43 ±6.55a 13.45±3.41a 3.84±5.07a 3.18±0.31b 0.97±0.18b
a= Significant increase compared to non-pregnant; P<0.05.
b= Significant decrease compared to non-pregnant; P<0.05.
Clinically TSH values are a reflection of thyroid
profile as considered mostly in clinical practice. All the
cases of the control group had normal TSH values. TSH
value below normal (0.27μIU/dl) was observed in 2
cases in I and II trimester each while normal values
were noted in most of the cases.
Discussion T3 values were raised during pregnancy. Maximum
rise was seen during II trimester. Rising trend was
noted in T4 values in various trimesters of pregnancy
except for I trimester.
Raised mean values of TSH were observed during
II and III trimester of pregnancy. Peak value was
recorded in II trimester. The III trimester fall may be a
reflection of appropriate clinical management by the
clinician.
Thyroid profile of pregnant versus non pregnant
cases was compared by using two-sample t-test and it
was observed that T3 values increased during pregnancy
significantly more so in II trimester. T4 values were less
during I trimester particularly at par during II trimester
and increased during III trimester. Raised TSH values
were observed during pregnancy as compared to non-
pregnant women. Significant increase was observed
during II trimester.
Ratcliffe WA, et al. (1976)[4] Stated that during
pregnancy the well-known pattern of high serum T4 and
T3 was observed. The levels were increasing during the
I trimester and stayed nearly stable during the II and III
trimester, being approximately 1.5 times the values
found at the post-partum control.
The observation regarding T3 in the present study
was at par with the observation of Kumar, et al.
(2003)[5] that the mean T3 increases during the II
trimester and then declines in III trimester compared to
the I trimester. Regarding mean T4 value, in the present
study the mean T4 level rose in the II and then
decreased in the III trimester. This was in contradiction
to the study of Elduff A (1999)[6] where he observed the
decreasing trend of T4 values and Kumar, et al
(2003)where the author found that mean T4 level rises
in the II and decreases during the III trimester.
According to Kumar, et al. (2003) mean TSH level
rises progressively throughout all the trimester of
pregnancy but in the present study peak rise in the mean

Raghav Nepalia et al. Comparison of Level of thyroid hormone between pregnant and non-pregnant….
International Journal of Clinical Biochemistry and Research 2016;3(2):214-226 226
TSH value was noted in the II trimester. Zarghami
Nosratollah, et al. (2005) observed the declining mean
FT3 and FT4 levels during the pregnancy which was
same in the present study too.
Zarghami Nosratollah, et al. (2005) [7] has not
found significant difference in TSH and T3 in pregnant
as compared with non-pregnant cases on the other hand
T4 level in the III trimester was significant highly as
compared to non-pregnant women. In the present study
a significant increase in mean TSH values compared to
non-pregnant women was observed and the increase in
T4 was significant increase in III trimester. Khandakar
M.A., et al. (2002)[8,9] noted a significant increase in
TSH and T3 in all the three trimesters as compared to
non-pregnant. In the present investigation there was
significant increase in mean T3 value in II trimester as
compared to non-pregnant counterparts .TSH results
were par with the present study.
Conclusion From our study it is conclude that serum T3 values
increased during pregnancy significantly more so in II
trimester. T4 values were less during I trimester
particularly at par during II trimester and increased
during III trimester. Raised TSH values were observed
during pregnancy as compared to non-pregnant women.
Significant increase was observed during II trimester.
References 1. Abraham Rebecca, Murugan V Srinivasa, Pukazhvanthen
P, Sen Sk. Thyroid disorders in women of puducherry.
Indian Journal of Clinical Biochemistry 2009;24(1):52-
59.
2. Agarwal AK. Social Classification: The need to update in
the Present Scenario. Indian Journal of Community
Medicine 2008;33(1):50-51.
3. Allan WC, Haddow JE, Palomaki GE, Williams JR,
Mitchell ML, Hermos RJ, Faix JD. Klein RZ. Maternal
thyroid deficiency and pregnancy complications:
implications for population screening. J. Med. Screen.
2000;7:127-130.
4. Agarwal AK. Social Classification: The need to update in
the Present Scenario. Indian Journal of Community
Medicine 2008;33(1):50-51.
5. Ratcliffe WA, et al. The radioimmunoassay of 3, 3’, 5’-
triiodothyronine in unextracted human sera. Clin.
Endocrinol. (Oxf) 1976;5:631-641.
6. Kumar Ashok, Ghosh BK, Murthy NS. Maternal thyroid
hormonal status in preeclampsia. Indian J. Med. Sci.
2005;59(2):57-63.
7. Ekins RP. Meaurement of free hormones in blood.
Endocr. Rev. 1990;11:5.
8. ZarghamiNosratolla, Rohbani-Noubar Mohammad,
Khosrowbeygi Ali. Thyroid status during pregnancy in
normal Iranian women. Indian Journal of clinical
Biochemistry 2005;20(2):182-185.
9. Khandakar M A, et al. Thyroid status of normal pregnant
women in Dhaka City. Mymensingh Med. J. 2002;1:1-5.