Original paper The enigma of cuboid diamonds: the causes ...
12
www.jgeosci.org Journal of Geosciences, 65 (2020), 59–70 DOI: 10.3190/jgeosci.301 Original paper The enigma of cuboid diamonds: the causes of inverse distribution of optical centers within the growth zones Evgeny A. VASILEV 1 *, Dmitry A. ZEDGENIZOV 2 , Igor V. KLEPIKOV 3 1 Saint-Petersburg Mining University, 2, 21 line, Saint-Petersburg, 199106, Russia; [email protected] 2 Sobolev Institute of Geology and Mineralogy, Russian Academy of Sciences, Siberian Branch, 3, Koptyuga ave, Novosibirsk, 630090, Russia 3 A.P. Karpinsky Russian Geological Research Institute, 74, Sredny prospect, Saint-Petersburg, 199106, Russia * Corresponding author In the present work, diamonds with yellow cores and a slightly colored or colorless rims have been studied. Three groups of crystals that differ in spectroscopic features have been identified. In the crystals of the first group, the heterogeneity in color is due to the variation in nitrogen concentration, which is present as the simplest low-temperature nitrogen С center. Absorption spectra of the first group display peaks at wavenumbers 1344 and 1332 cm –1 of С and С+ centers, respectively. The second group also exhibits higher nitrogen concentrations in the form of C centers in the colored zone. However, the concentration of nitrogen in the form of high temperature А-centers, and the total nitrogen content is higher at the periphery of crystals. The FTIR absorption spectra of this group display both 1344 and 1332 cm –1 peaks. Crystals of the third group do not contain C centers. The 1332 cm –1 and the A center bands are observed in the FTIR absorption spectra. In the photoluminescence spectra of the colored zone of the third group, the bands S1 and S2 have been found and the doublet lines 883 and 885 nm of the simplest Ni-containing centers. Previously unobserved systems with zero- phonon lines at 799.5, 819.6, 869.5 and 930 nm lines have been registered in the photoluminescence spectra of the third group under 787 nm excitation. It is hereby proposed that this luminescence is due to Ni-containing centers. In the third group of crystals, Ni seems to stabilize C+ centers and hence the coloring of crystal zones is consistent with Ni impurity distribution. Crystals of each group have distinct sources: the first group is from Yubileinaya pipe, the second from the placers of North Yakutia with unknown primary sources and the third from the Uralian deposits. Keywords: FTIR, photoluminescence, nitrogen, nickel Received: 30 October 2019; accepted: 24 March 2020; handling editor: R. Škoda The online version of this article (doi: 10.3190/jgeosci.301) contains supplementary electronic material and a vacancy (N 3 V, N 4 V) respectively. The concentra- tions of А, В and С centers are estimated by Fourier Transform Infrared (FTIR) spectroscopy. Crystals having a yellow periphery with С centers are not rare (Kamiya and Lang 1965; Boyd et al. 1987; Yelisseyev et al. 2004; Gubanov et al. 2019; Lai et al. 2020). Such crystals may have a structurally discernible core and a mantle. The periphery sometimes does not clearly differ in struc- ture from the core but has a yellow color and contains С centers (Hainschwang et al. 2006). Cuboid diamonds often have dominantly А and В centers in the center of the crystal and С centers in the periphery. Such crystals are formed by [100] pyramids with the normal growth mechanism. The cuboids typically show a low degree of nitrogen defect aggregation. Crystals with “inverse” zon- ing have been discussed in a few works in recent years (Zedgenizov et al. 2016; Smit et al. 2018; Timmerman et al. 2018; Klepikov et al. 2019). In these crystals, the core is yellow, and their periphery is pale-yellow or colorless. Such “inverse” zoning is not consistent with the generally accepted notion of nitrogen defect transformation. With 1. Introduction Most diamond crystals are zoned, due to variations in growth conditions and environmental composition or os- cillations in impurity contents. These heterogeneities are complicated by secondary processes upon natural anneal- ing. The central zone of diamond crystals is subjected to annealing for the longest time, while the peripheral zone records the lowest temperature and duration of natural an- nealing. This pattern is well-defined in the distribution of nitrogen crystal structure defects (Bulanova et al. 2002; Vasilev and Sofroneev 2007; Kohn et al. 2016). Total nitrogen concentration in a diamond may be over 3000 ppm (Zaitsev 2001). Single substitutional nitrogen atom С is the simplest growth defect; it is the cause of yellow color (Collins 2001; Zaitsev 2001; King et al. 2005). Upon annealing, C centers are transformed into more complex А centers that are, in turn, transformed into B and N3 centers. As a result of such transformations, the color disappears. А centers consist of two nitrogen atoms; N3 and В centers consist of three and four nitrogen atoms
Transcript of Original paper The enigma of cuboid diamonds: the causes ...

www.jgeosci.org
Journal of Geosciences, 65 (2020), 59–70 DOI: 10.3190/jgeosci.301
Original paper
The enigma of cuboid diamonds: the causes of inverse distribution of optical centers within the growth zones
Evgeny A. VASILEV1*, Dmitry A. ZEDGENIZOV2, Igor V. KLEPIKOV3
1 Saint-Petersburg Mining University, 2, 21 line, Saint-Petersburg, 199106, Russia; [email protected] Sobolev Institute of Geology and Mineralogy, Russian Academy of Sciences, Siberian Branch, 3, Koptyuga ave, Novosibirsk, 630090, Russia3 A.P. Karpinsky Russian Geological Research Institute, 74, Sredny prospect, Saint-Petersburg, 199106, Russia* Corresponding author
In the present work, diamonds with yellow cores and a slightly colored or colorless rims have been studied. Three groups of crystals that differ in spectroscopic features have been identified. In the crystals of the first group, the heterogeneity in color is due to the variation in nitrogen concentration, which is present as the simplest low-temperature nitrogen С center. Absorption spectra of the first group display peaks at wavenumbers 1344 and 1332 cm–1 of С and С+ centers, respectively. The second group also exhibits higher nitrogen concentrations in the form of C centers in the colored zone. However, the concentration of nitrogen in the form of high temperature А-centers, and the total nitrogen content is higher at the periphery of crystals. The FTIR absorption spectra of this group display both 1344 and 1332 cm–1 peaks. Crystals of the third group do not contain C centers. The 1332 cm–1 and the A center bands are observed in the FTIR absorption spectra. In the photoluminescence spectra of the colored zone of the third group, the bands S1 and S2 have been found and the doublet lines 883 and 885 nm of the simplest Ni-containing centers. Previously unobserved systems with zero-phonon lines at 799.5, 819.6, 869.5 and 930 nm lines have been registered in the photoluminescence spectra of the third group under 787 nm excitation. It is hereby proposed that this luminescence is due to Ni-containing centers. In the third group of crystals, Ni seems to stabilize C+ centers and hence the coloring of crystal zones is consistent with Ni impurity distribution. Crystals of each group have distinct sources: the first group is from Yubileinaya pipe, the second from the placers of North Yakutia with unknown primary sources and the third from the Uralian deposits.
Keywords: FTIR, photoluminescence, nitrogen, nickelReceived: 30 October 2019; accepted: 24 March 2020; handling editor: R. ŠkodaThe online version of this article (doi: 10.3190/jgeosci.301) contains supplementary electronic material
and a vacancy (N3V, N4V) respectively. The concentra-tions of А, В and С centers are estimated by Fourier Transform Infrared (FTIR) spectroscopy. Crystals having a yellow periphery with С centers are not rare (Kamiya and Lang 1965; Boyd et al. 1987; Yelisseyev et al. 2004; Gubanov et al. 2019; Lai et al. 2020). Such crystals may have a structurally discernible core and a mantle. The periphery sometimes does not clearly differ in struc-ture from the core but has a yellow color and contains С centers (Hainschwang et al. 2006). Cuboid diamonds often have dominantly А and В centers in the center of the crystal and С centers in the periphery. Such crystals are formed by [100] pyramids with the normal growth mechanism. The cuboids typically show a low degree of nitrogen defect aggregation. Crystals with “inverse” zon-ing have been discussed in a few works in recent years (Zedgenizov et al. 2016; Smit et al. 2018; Timmerman et al. 2018; Klepikov et al. 2019). In these crystals, the core is yellow, and their periphery is pale-yellow or colorless. Such “inverse” zoning is not consistent with the generally accepted notion of nitrogen defect transformation. With
1. Introduction
Most diamond crystals are zoned, due to variations in growth conditions and environmental composition or os-cillations in impurity contents. These heterogeneities are complicated by secondary processes upon natural anneal-ing. The central zone of diamond crystals is subjected to annealing for the longest time, while the peripheral zone records the lowest temperature and duration of natural an-nealing. This pattern is well-defined in the distribution of nitrogen crystal structure defects (Bulanova et al. 2002; Vasilev and Sofroneev 2007; Kohn et al. 2016). Total nitrogen concentration in a diamond may be over 3000 ppm (Zaitsev 2001). Single substitutional nitrogen atom С is the simplest growth defect; it is the cause of yellow color (Collins 2001; Zaitsev 2001; King et al. 2005). Upon annealing, C centers are transformed into more complex А centers that are, in turn, transformed into B and N3 centers. As a result of such transformations, the color disappears. А centers consist of two nitrogen atoms; N3 and В centers consist of three and four nitrogen atoms
Evgeny A. Vasilev, Dmitry A. Zedgenizov, Igor V. Klepikov
60
aim to better understand this “inverse” zoning phenom-enon, cuboid diamonds with a yellow central zone from Russia have been studied in the present work using FTIR and photoluminescence (PL) spectroscopy.
2. Materials and methods
Crystals with a yellow central zone and a pale-yellow or colorless periphery were selected for the current study. These were crystals of cubic habit or fragments of cuboids from the Uralian placers (Klepikov et al. 2019), from the Yubileinaya kimberlite pipe and from Istok placer in the Anabaro-Oleneksky interfluve, Russia (Zedgenizov et al. 2016). Plates of 0.4–0.7 mm thickness were cut out from the crystals through the center in the plane {100} and polished.
Absorption spectra were recorded using a Vertex 70 spectrometer with a Hyperion1000 microscope at a reso-lution of 1 cm–1 and averaged from 32 scans in the range of 600 to 7000 cm–1. The aperture size was 100 × 100 μm; in general case, true location does not exceed the third of the plate thickness with standard IR 15× objec-tives. For thin light zones (as in plates Ubk-2, Ubz-15), the spot size was decreased down to 20 × 100 μm. Be-cause of relatively thick plates we did not use a smaller aperture. In the range of 500 to 1100 nm, the spectra were recorded at room temperature at a resolution of
8 cm–1 and averaged from 1000 scans. In the range of 390 to 650 nm, absorbance spectra were recorded at room temperature on a Renishaw In Via spectrometer at a resolution better than 0.12 nm, averaged from 10 scans in step mode, with a 12V, 100 W halogen lamp as a light source, a L50× objective. In this mode, the edge filter was removed from the spectrometer and the entrance slit width was set to 15 μm. In order to shift spectral range to low wavelength, a CC8 color filter was mounted in front of the slit. To compare color bright-ness, the absorbance at 450 nm (a450) was measured in each spectrum with constant baseline subtraction at 650 nm. The calculation of true value of absorbance at 450 nm is complicated by scattering on inclusions (samples Ubk 1–7, Ubk 1–2, Ubk 2, HL-3, ISTD 28, ISTD 3) and reflectance from cracks (samples Ubk 1–2, U 601). Both scattering and reflection gave a rise in registered ab-sorption spectra towards lower wavelength. Automatic baseline subtraction, normalizing and manual simple FTIR spectra decomposition were performed via “Spec-trexamination” application, developed in ALROSA Co. by O. Kovalchuk. Nitrogen concentrations in the form of А (NA) centers were calculated from known propor-tionality coefficients (Boyd et al. 1994). The absorption of B centers with main peaks at 1010, 1170 and 1332 cm–1 was not revealed in the studied crystals. The main peak of C centers at 1135 cm–1 was not used for calcula-tion of C centers concentration, because of a significant
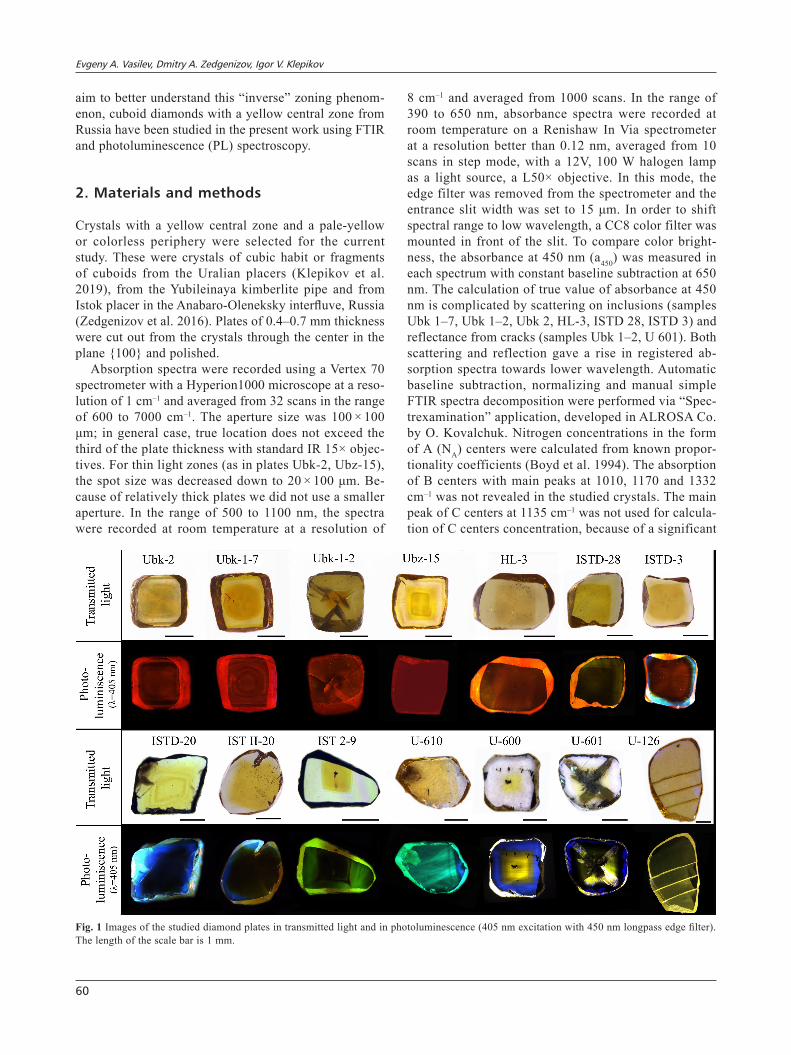
Fig. 1 Images of the studied diamond plates in transmitted light and in photoluminescence (405 nm excitation with 450 nm longpass edge filter). The length of the scale bar is 1 mm.
Enigma of cuboid diamonds
61
background of other bands at this range. A absorption coefficient of the peak 1344 cm–1 was used as a measure of the concentration of C centers (Nc) (Lawson et al. 1998). An absorption coefficient of 1 cm–1 of the peak 1344 cm–1 has earlier been found to be consistent with a concentration of 41 ppm for spectral resolution 1 cm–1
(Liggins 2010). The total nitrogen concentration, Ntot, was estimated as NA plus NС concentration; also the share of nitrogen in A centers NAS (%) was calculated as NА/Ntot. In the results, the concentration values were rounded to 5 ppm because of the crystals heteroge-neity and errors in decomposition of the spectra. In this study, an absorption coefficient at 1332 cm–1 was measured after subtracting of A-defects band from the absorption spectra. The baseline for peak 1332 cm–1 was obtained by linear averaging of absorbance at the range 1350–1430 cm–1. Absorption at 1332 cm–1 is typical of most impurity defects inducing IR absorption, but as an individual peak it is considered to be induced by positively charged С centers, i.e. Х-centers (Lawson and Kanda 1993). The absorption coefficient of the band 3107 cm–1 (α3107) was measured, which is consistent with the defect V3NH (Goss et al. 2014).
Photoluminescence spectra were recorded on a Reni-shaw In Via spectrometer at 77 K upon laser excitation (λex) with wavelengths of 405, 450, 488 and 787 nm, a L50× objective, in the range of 410–1050 nm. When analyzing the PL spectra, the predominant lines were indicated. Generally if several systems overlap each other, it is often impossible to analyze them separately. For example, the narrow lines of the systems H3, 3H and S1 are ~503 nm. In case of the intensive system H3, other lines may not be distinguished. In the current study, heterogeneities in PL were visualized using a Leica M205 microscope at a λex 405 nm through an edge 450 nm long-pass filter.
3. Results
Three groups of crystals have been identified differ-ing in the color and heterogeneity of PL (Fig. 1). The groups are categorized as: 1) crystals with homoge-neous red PL; 2) crystals with faint red or red PL in the center and blue or green PL at the periphery; 3) crys-tals with yellow PL in the center and blue or green PL at the periphery. In addition to the core/periphery heterogeneity, most of the crystals display a thin zon-ing in the distribution of nitrogen and hydrogen defects and some PL systems. The averaged parameters for core/periphery zones are discussed per group below and are summarized in the Tab. 1. All the raw FTIR spectra are available in the Electronic supplementary material (ESM 1).
3.1. Group 1
In the spectra of the first group of crystals, absorbance in the visible range increases continuously from low wave-lengths (Fig. 2a). The absorption spectra of the central and peripheral zones differ only in the amplitude. In absorp-tion there is a line at 614 nm, which is also seen in PL spectra as a reabsorption (Fig. 2a, c). Nitrogen is present dominantly as С centers with main peak at 1135 cm–1. The precise position of this maximum is shifted up to 1140 cm–1 in spectra with intense peak 1332 cm–1. The absor-bance of the bands with maxima of 1344 cm–1 and 1332 cm–1 are close (Fig. 2b). At the periphery of the crystals of this group, the values of Ntot, NС and а1332 are smaller than those in the core. The first group of crystals has 905 nm and 986 nm bands (Н2) in PL spectra at a λex 787 nm. These bands are also observed in absorption spectra. Upon excitation at 405 nm, the PL spectra are dominated by a wide structureless band with a maximum of about 600 nm (BB600) and bands at 575 and 638 nm (NV and NV–) and a 689/698 nm pair, sometimes with a line at 685 nm. Upon excitation at 450 nm, system H3 excited more effectively, and lines 689/698 nm dominate the spectra. In the FTIR spectra of this group, а3107 is either less than 0.1 cm–1 or is not distinguished. The absorption spectra of several samples display structured absorption systems with local maxima at 1265 and 1300 cm–1 and many bands in the ranges of 1330–1750 and 2800–3300 cm–1 designated earlier respectively as F- and Y-centers (Clark and Davey 1984; Hainschwang et al. 2012). The crystals with the F- and Y-centers have a set of sharp PL lines in the range 800–900 at a λex 787 nm (Fig. 2c). The set is not excited by 405, 450 and 488 nm lasers. The lines position and in-tensity continuously change during spectra acquisition. At room temperature, the lines intensity decreases, but their width increases. The identification of the origin of these lines will be the topic of further research.
3.2. Group 2
The crystals of the second group display zonal PL. The contour of the absorption spectra in the visible range is the same as that of the crystals of the first group (Fig. 3a). Nitrogen in the crystals of the second group is present predominantly as А centers, but the concentration of С centers in the core is higher than that in the periphery. The absorbance of the 1332 сm–1 band is higher than that of the 1344 cm–1 band (Fig. 3b). In the spectra of the peripheral parts of the plates IST II-20 and IST 2–9 was recorded a band with the 4170 cm–1 maximum. This band is charac-teristic of crystals with signs of plastic deformation. The central zone of the plates exhibits red PL; in some cases it is not visually identifiable because the intensity is small. The periphery of the crystals emits either blue or green PL. The
Evgeny A. Vasilev, Dmitry A. Zedgenizov, Igor V. Klepikov
62
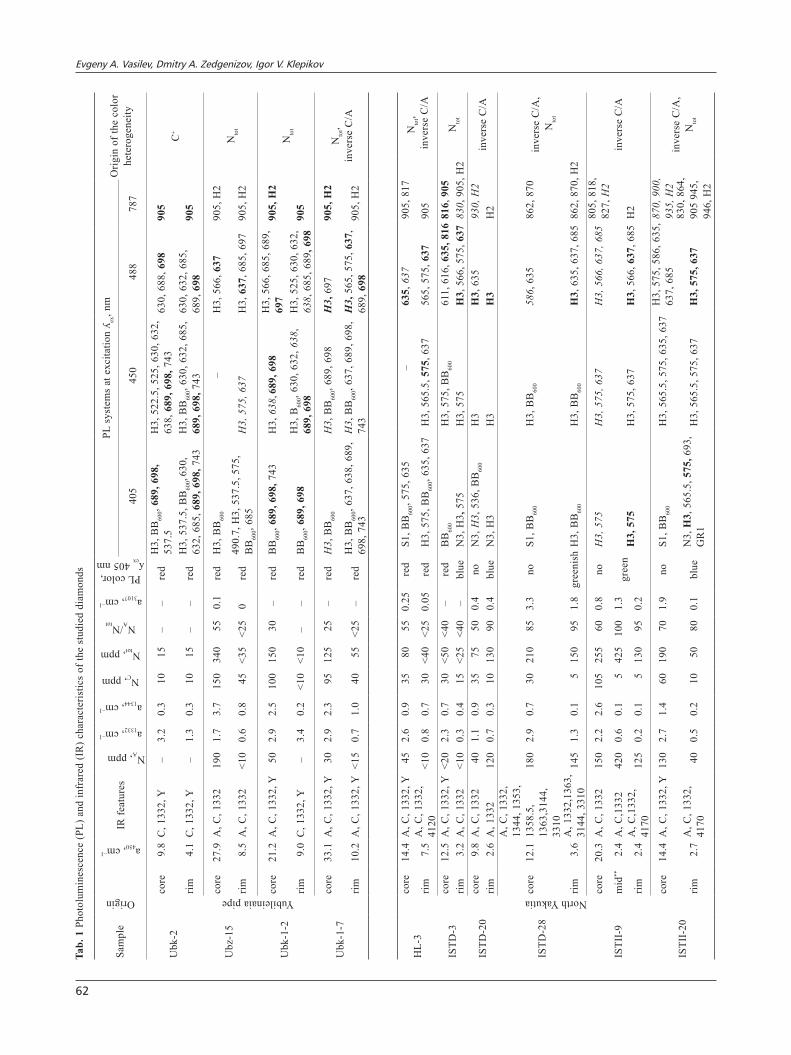
Tab.
1 P
hoto
lum
ines
cenc
e (P
L) a
nd in
frar
ed (I
R) c
hara
cter
istic
s of
the
stud
ied
diam
onds
Sam
ple
Origin
a450, cm–1
IR fe
atur
es
NA, ppm
a1332, cm–1
a1344, cm–1
NC, ppm
Ntot, ppm
NA/Ntot
a3107, cm–1
PL color, ʎex 405 nm
PL s
yste
ms
at e
xcita
tion
ʎ ex, n
mO
rigin
of t
he c
olor
he
tero
gene
ity40
545
048
878
7
Ubk
-2
Yubileinaia pipeco
re9.
8C
, 133
2, Y
–3.
20.
310
15–
–re
dH
3, B
B60
0, 68
9, 6
98,
537.
5H
3, 5
22.5
, 525
, 630
, 632
, 63
8, 6
89, 6
98, 7
4363
0, 6
88, 6
9890
5C
+
rim4.
1C
, 133
2, Y
–1.
30.
310
15–
–re
dH
3, 5
37.5
, BB
600, 6
30,
632,
685
, 689
, 698
, 743
H3,
BB
600,
630,
632
, 685
, 68
9, 6
98, 7
4363
0, 6
32, 6
85,
689,
698
905
Ubz
-15
core
27.9
A, C
, 133
219
01.
73.
715
034
055
0.1
red
H3,
BB
600
–H
3, 5
66, 6
3790
5, H
2N
tot
rim8.
5A
, C, 1
332
<10
0.6
0.8
45<3
5<2
50
red
490.
7, H
3, 5
37.5
, 575
, B
B60
0, 68
5H
3, 5
75, 6
37H
3, 6
37, 6
85, 6
9790
5, H
2
Ubk
-1-2
core
21.2
A, C
, 133
2, Y
502.
92.
510
015
030
–re
dB
B60
0, 68
9, 6
98, 7
43H
3, 6
38, 6
89, 6
98H
3, 5
66, 6
85, 6
89,
697
905,
H2
Nto
t
rim9.
0C
, 133
2, Y
–3.
40.
2<1
0<1
0–
–re
dB
B60
0, 68
9, 6
98H
3, B
600,
630,
632
, 638
, 68
9, 6
98H
3, 5
25, 6
30, 6
32,
638,
685
, 689
, 698
905
Ubk
-1-7
сore
33.1
A, C
, 133
2, Y
302.
92.
395
125
25–
red
H3,
BB
600
H3,
BB
600,
689,
698
H3,
697
905,
H2
Nto
t, in
vers
e C
/Arim
10.2
A, C
, 133
2, Y
<15
0.7
1.0
4055
<25
–re
dH
3, B
B60
0, 63
7, 6
38, 6
89,
698,
743
H3,
BB
600,
637,
689
, 698
, 74
3H
3, 5
65, 5
75, 6
37,
689,
698
905,
H2
HL-
3
North Yakutia
сore
14.4
A, C
, 133
2, Y
452.
60.
935
8055
0.25
red
S1, B
B60
0, 57
5, 6
35–
635,
637
905,
817
Nto
t, in
vers
e C
/Arim
7.5
A, C
, 133
2,
4120
<10
0.8
0.7
30<4
0<2
50.
05re
dH
3, 5
75, B
B60
0, 63
5, 6
37H
3, 5
65.5
, 575
, 637
565,
575
, 637
905
ISTD
-3сo
re12
.5A
, C, 1
332,
Y<2
02.
30.
730
<50
<40
–re
dB
B60
0H
3, 5
75, B
B60
061
1, 6
16, 6
35, 8
16 8
16, 9
05N
tot
rim3.
2A
, C, 1
332
<10
0.3
0.4
15<2
5<4
0–
blue
N3,
H3,
575
H3,
575
H3,
566
, 575
, 637
830,
905
, H2
ISTD
-20
core
9.8
A, C
, 133
240
1.1
0.9
3575
500.
4no
N3,
H3,
536
, BB
600
H3
H3,
635
930,
H2
inve
rse
C/A
rim2.
6A
, 133
212
00.
70.
310
130
900.
4bl
ueN
3, H
3H
3H
3H
2
ISTD
-28
сore
12.1
A, C
, 133
2,
1344
, 135
3,
1358
.5,
1363
,314
4,
3310
180
2.9
0.7
3021
085
3.3
noS1
, BB
600
H3,
BB
600
586,
635
862,
870
inve
rse
C/A
, N
tot
rim3.
6A
, 133
2,13
63,
3144
, 331
014
51.
30.
15
150
951.
8gr
eeni
shH
3, B
B60
0H
3, B
B60
0H
3, 6
35, 6
37, 6
8586
2, 8
70, H
2
ISTI
I-9
core
20.3
A, C
, 133
215
0 2.
22.
610
525
560
0.8
noH
3, 5
75H
3, 5
75, 6
37H
3, 5
66, 6
37, 6
8580
5, 8
18,
827,
H2
inve
rse
C/A
mid
**2.
4A
, C,1
332
420
0.6
0.1
542
510
01.
3gr
een
H3,
575
H3,
575
, 637
H3,
566
, 637
, 685
H2
rim2.
4A
, C,1
332,
41
7012
50.
20.
15
130
950.
2
ISTI
I-20
core
14.4
A, C
, 133
2, Y
130
2.7
1.4
6019
070
1.9
noS1
, BB
600
H3,
565
.5, 5
75, 6
35, 6
37H
3, 5
75, 5
86, 6
35,
637,
685
870,
900
, 93
5, H
2in
vers
e C
/A,
Nto
trim
2.7
A, C
, 133
2,
4170
400.
50.
210
5080
0.1
blue
N3,
H3,
565
.5, 5
75, 6
93,
GR
1H
3, 5
65.5
, 575
, 637
H3,
575
, 637
830,
864
, 90
5 94
5,
946,
H2
Enigma of cuboid diamonds
63
U-6
00
The Urals
сore
4.2
A, 1
332
100
1.2
–3.
910
010
03.
9ye
llow
S1, S
2, H
3, S
B72
0S1
, BB
600
H3,
SB
720
800,
819
, 86
9N
i-rel
ated
rim2.
3A
120
0.2
–0.
512
010
00.
5bl
ueN
3, H
3, 3
HN
3, H
3, B
B60
0H
3, 5
75–
U-6
01сo
re1.
3A
, 133
227
01.
2–
7.2
270
100
7.2
yello
w/
S1, S
2, H
3, S
B72
0S1
, BB
600
H3,
637
, SB
720
819,
839
, 92
6N
i-rel
ated
rim0.
5A
400.
2–
0.4
4010
00.
4bl
ueN
3, H
3, 3
HN
3, H
3, 4
96(S
3), 5
75H
3, 5
75–
U-6
10сo
re4.
2A
, 133
225
1.
0–
0.6
2510
00.
6gr
een
S1, S
2, H
3, 5
75, S
B72
0S1
, S2,
H3,
575
, SB
720
H3,
540
, 575
, 590
, 59
2, 5
35, 6
37,
SB72
0
* 800
, 819
, 86
9 N
i-rel
ated
rim0.
3A
220
––
0.2
220
100
0.2
blue
N3,
H3,
575
N3,
H3,
575
H3
–
U-1
26сo
re2.
2A
, 133
225
0.5
–1.
225
100
1.2
yello
wS1
, S2,
H3,
SB
720
S1, S
2, H
3, S
B72
0
503,
511
.3, 5
20,
524,
531
.5, 5
40,
572.
2, 5
75, 5
76.5
, 58
1.1,
586
.5,
591.
7, 6
35, S
B72
0, 79
9, 8
18, 8
38, 8
69
800,
819
, 86
9N
i-rel
ated
rim0.
1A
, B'
(1.6
cm
–1)
400
––
–40
010
0–
blue
H3,
3H
H3,
3H
H3,
BB
760
–
* The
ban
ds w
ere
regi
ster
ed in
the
mid
dle
zone
, but
not
in th
e co
re**
mid
dle
zone
in th
e pl
ate
IST
II-9
bold
hig
hlig
hts
the
very
stro
ng b
ands
, ita
lic in
dica
tes
the
wea
k ba
nds
N3 and H3 systems, 575 and 638 nm bands are recorded in these zones (Fig. 3c). The N3 system is absent in the spectra of the crystal cores. A broad band with a maximum of 600 nm, lines 575 and 638 nm is revealed. Two crystals have a 565 nm line and one crystal has 552, 685 and 689 nm lines. Upon 787 nm excitation, the PL spectra of all crystals display a Н2 system. The PL spectra of various crystals of this group differ from each other. They all exhibit a variety of weak peaks at 805, 816, 827, 830, 864, 870, 900, 905, 930, and 945 nm. The origin of the bands is still unknown.
3.3. Group 3
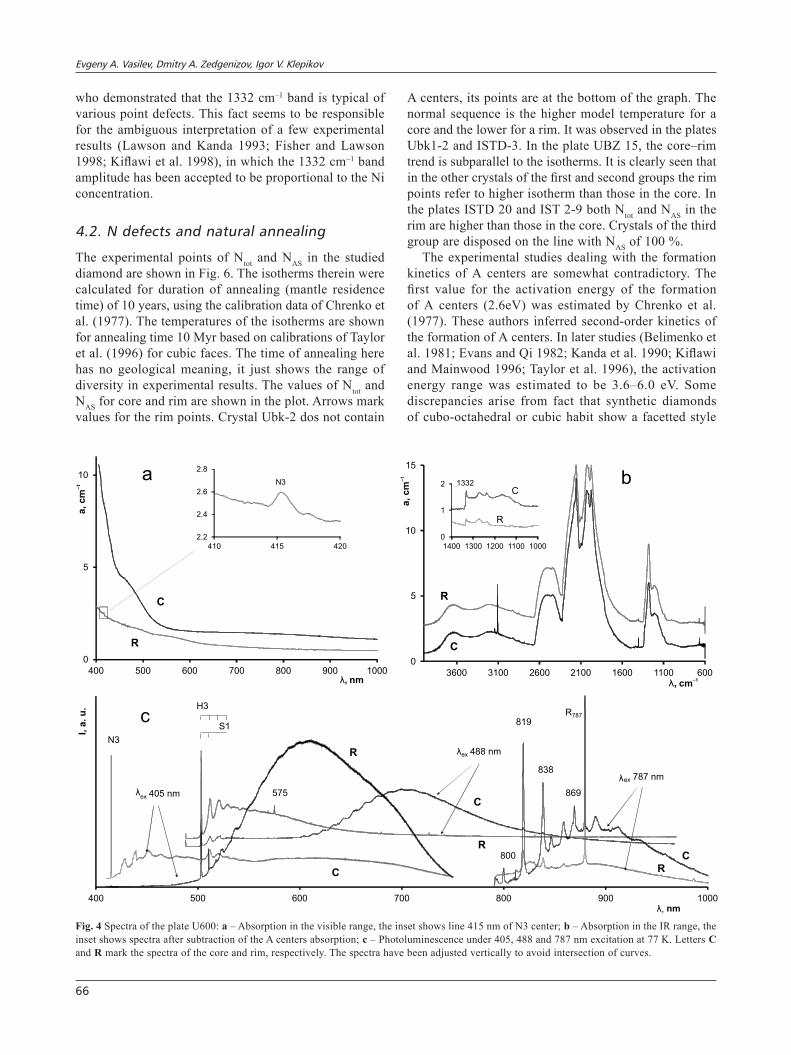
Crystals of the third group display yellow PL in the center and either blue or green PL at the periphery. The color of crystals is canary-yellow. Crystals U 600 and U 601 are well-developed cuboids; crystals U610 and U126 are chips of cuboids. In rims of the latter are clearly seen linear blue zones. These imply a change in the growth mechanism from normal {100} to tangential {111}. In third group, nitrogen is present as А centers. The 1344 cm–1 band of С-defect is not recorded in the FTIR spectra; and neither are the bands of Y centers. In the peripheral part of the plate U-126, a weak peak of B’ was revealed. General appearance and characteristics of the absorption spectrum in the visible range differ from those of the crystals of the first and second groups. The absorption spectrum of the colored zone displays an increase in absorption from 600 nm, a wide structureless band at 430–530 nm (Fig. 4a), and a system with peaks at 425 and 416 nm. These spectra are similar to those described earlier in some yellow dia-monds (Reinitz et al. 1998; Hainschwang et al. 2005). In the absorption spectrum of the peripheral zone of sample U600, there is an N3 system with an absorption coefficient of 0.2 cm–1 at 415 nm, although such an absorption lacks in the center of the crystal. In FTIR spectra of the colored zones, there is the 1332 cm–1 peak on the background of the absorption of А centers (Fig. 4b).
The PL spectra of the colored zone at λex 405 nm exhibit a wide band with a maximum of 600 nm and 503.2 and 510.5 nm peaks of S1 system (Fig. 4c). Upon excitation of 450 nm, Н3 system and 518, 524 nm peaks of the S2 sys-tem are recorded. Upon excitation of 488 nm, the spectrum is dominated by a wide structured system with a maximum of c. 700 nm (SB700). This band was earlier observed in PL spectra of canary-yellow stones (Collins and Mohammed 1982). At λex of 787 nm, systems with a zero-phonon line (ZPL) at 799.5, 819.6, 869.5 and 930 nm are recorded. These systems have not been observed earlier (Dishler 2012; Hainschwang et al. 2013). A system with ZPL 799.5 nm has phonon replicas at 812, 825.5 and 839 nm (energy shift of 0.024 eV); a system with ZPL 819.6 nm has repli-cas at 839 and 859 nm (shift of 0.035 eV); a system with a ZPL of 869.5 nm has replicas at 891, 913 and 936 nm

Evgeny A. Vasilev, Dmitry A. Zedgenizov, Igor V. Klepikov
64
(shift of 0.033 eV); and a system with a ZPL of 930 nm has replicas at 952 and 975 nm (shift of 0.030 eV). They are very weak or absent in PL spectra of the colorless pe-ripheral zone of the crystals. These systems have not been seen in the absorption spectra. The blue luminescence of N3 defects is recorded at λex 405 nm at PL spectra of the peripheral zones. The three zones can be distinguished from the distribution of spectral characteristics in the crystals U600 and U601 as: 1) a yellow core with intense PL with a maximum of c. 700 nm and with an absorption at 1332 cm–1; 2) a colorless transition zone with a weak PL of H3; and 3) a peripheral zone with the well-defined boundary of blue luminescence of N3 system. The value of а3107 in the transition zone is the same as that in the core, but in the peripheral zone it is lower by one order of magnitude.
4. Discussion
The crystals that have been studied fall into three groups, distinguished by the combination and distribution of
spectroscopic characteristics (Tab. 1). The first attribute for the crystals classification was PL color and heteroge-neity; the second was absorbance at 1332 and 1344 cm–1. In spectra of crystals of the first and second groups, both 1332 and 1344 cm–1 lines were observed. In the spectra of crystals of the third group only the band 1332 cm–1
was detected. Another sign of the third group is PL bands in the visible and NIR range. The main features of the groups are related to their nitrogen content.
4.1. N defects and color
In cuboids, C center is the main cause of yellow color-ation. In Fig. 5a, a dependence of the absorbance at 450 nm is shown on the C centers concentration. The linear character of the dependence confirms this observation. In the graph, the two sublinear groups of points are distinguished. The upper group refers to the core of the crystals; the lower one to the rims. In Fig. 5a, points for the Uralian diamonds lie on the ordinate axis because of the absence of C centers.
0
4
8
12
16
600160026003600
a, cm
–1
v, cm–1
2973
1138
R
C
0
4
8
10001100120013001400
1332
1344
400 500 600 700 800 900 1000
I, a
.u.
λ, nm
ex 787 nm698
R787
614H2
689λex 405 nm
λex 450 nm
905
C
R
0
10
20
30
400 500 600 700 800 900 1000
a, cm
–1
λ,nm
C
R
4
5
600 610 620 630
1.5
2.5
870 890 910
a b
c
λ
Fig. 2 Spectra of the plate Ubk1-2: a – Absorption in visible range; the inset shows lines at 614 and 905 nm; b – Absorption in the IR range, the inset shows spectra after subtraction of the A centers absorption; c – Photoluminescence under 405, 450 and 787 nm excitation at 77 K. Letters C and R mark the spectra of the core and rim, respectively. The spectra have been adjusted vertically to avoid intersection of curves.
Enigma of cuboid diamonds
65
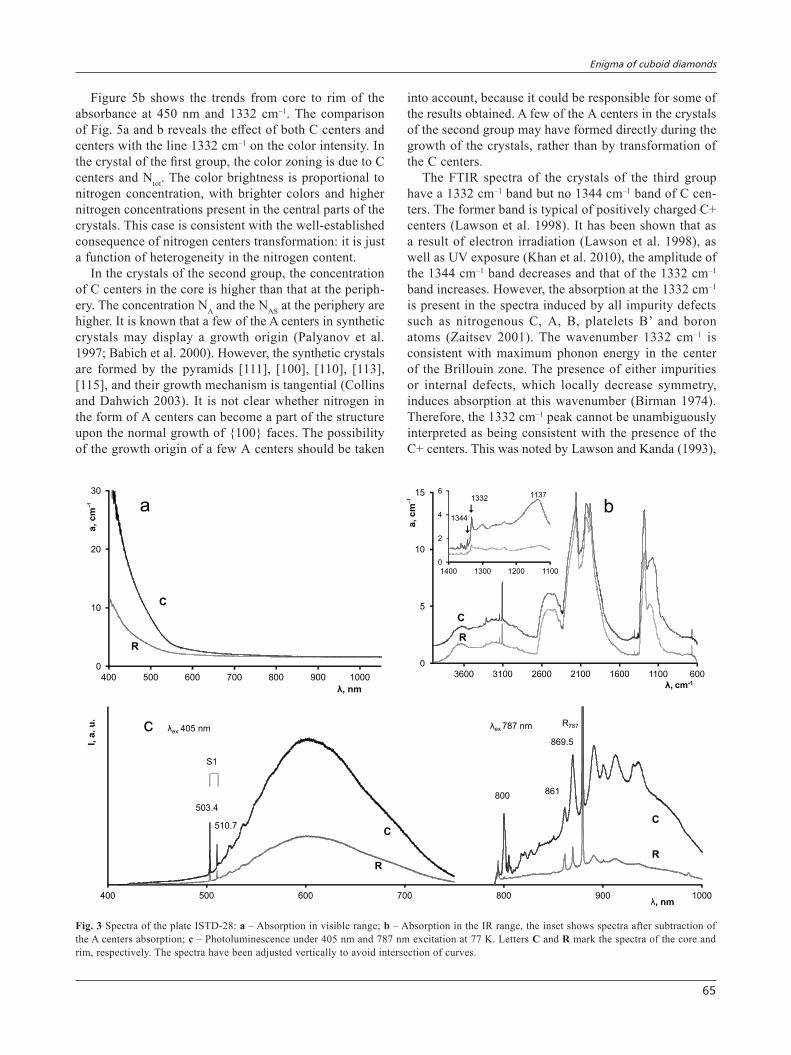
into account, because it could be responsible for some of the results obtained. A few of the А centers in the crystals of the second group may have formed directly during the growth of the crystals, rather than by transformation of the С centers.
The FTIR spectra of the crystals of the third group have a 1332 cm–1 band but no 1344 cm–1 band of С cen-ters. The former band is typical of positively charged С+ centers (Lawson et al. 1998). It has been shown that as a result of electron irradiation (Lawson et al. 1998), as well as UV exposure (Khan et al. 2010), the amplitude of the 1344 cm–1 band decreases and that of the 1332 cm–1 band increases. However, the absorption at the 1332 cm–1 is present in the spectra induced by all impurity defects such as nitrogenous С, А, В, platelets B’ and boron atoms (Zaitsev 2001). The wavenumber 1332 cm–1 is consistent with maximum phonon energy in the center of the Brillouin zone. The presence of either impurities or internal defects, which locally decrease symmetry, induces absorption at this wavenumber (Birman 1974). Therefore, the 1332 cm–1 peak cannot be unambiguously interpreted as being consistent with the presence of the С+ centers. This was noted by Lawson and Kanda (1993),
Figure 5b shows the trends from core to rim of the absorbance at 450 nm and 1332 cm–1. The comparison of Fig. 5a and b reveals the effect of both С centers and centers with the line 1332 cm–1 on the color intensity. In the crystal of the first group, the color zoning is due to С centers and Ntot. The color brightness is proportional to nitrogen concentration, with brighter colors and higher nitrogen concentrations present in the central parts of the crystals. This case is consistent with the well-established consequence of nitrogen centers transformation: it is just a function of heterogeneity in the nitrogen content.
In the crystals of the second group, the concentration of С centers in the core is higher than that at the periph-ery. The concentration NA and the NAS at the periphery are higher. It is known that a few of the A centers in synthetic crystals may display a growth origin (Palyanov et al. 1997; Babich et al. 2000). However, the synthetic crystals are formed by the pyramids [111], [100], [110], [113], [115], and their growth mechanism is tangential (Collins and Dahwich 2003). It is not clear whether nitrogen in the form of А centers can become a part of the structure upon the normal growth of {100} faces. The possibility of the growth origin of a few А centers should be taken
0
5
10
15
600110016002100260031003600
a,cm
–1
λ, cm-1
0
2
4
6
1100120013001400
1344
11371332
C
R
400 500 600 700 800 900 1000
I,u
.a
.
λ, nm
λex 787 nm R787λex 405 nm
C
R
C
R
503.4
510.7
800861
869.5
S1
0
10
20
30
400 500 600 700 800 900 1000
a,cm
–1
λ, nm
C
R
a b
c
Fig. 3 Spectra of the plate ISTD-28: a – Absorption in visible range; b – Absorption in the IR range, the inset shows spectra after subtraction of the A centers absorption; c – Photoluminescence under 405 nm and 787 nm excitation at 77 K. Letters C and R mark the spectra of the core and rim, respectively. The spectra have been adjusted vertically to avoid intersection of curves.
Evgeny A. Vasilev, Dmitry A. Zedgenizov, Igor V. Klepikov
66
who demonstrated that the 1332 cm–1 band is typical of various point defects. This fact seems to be responsible for the ambiguous interpretation of a few experimental results (Lawson and Kanda 1993; Fisher and Lawson 1998; Kiflawi et al. 1998), in which the 1332 cm–1 band amplitude has been accepted to be proportional to the Ni concentration.
4.2. N defects and natural annealing
The experimental points of Ntot and NAS in the studied diamond are shown in Fig. 6. The isotherms therein were calculated for duration of annealing (mantle residence time) of 10 years, using the calibration data of Chrenko et al. (1977). The temperatures of the isotherms are shown for annealing time 10 Myr based on calibrations of Taylor et al. (1996) for cubic faces. The time of annealing here has no geological meaning, it just shows the range of diversity in experimental results. The values of Ntot and NAS for core and rim are shown in the plot. Arrows mark values for the rim points. Crystal Ubk-2 dos not contain
A centers, its points are at the bottom of the graph. The normal sequence is the higher model temperature for a core and the lower for a rim. It was observed in the plates Ubk1-2 and ISTD-3. In the plate UBZ 15, the core–rim trend is subparallel to the isotherms. It is clearly seen that in the other crystals of the first and second groups the rim points refer to higher isotherm than those in the core. In the plates ISTD 20 and IST 2-9 both Ntot and NAS in the rim are higher than those in the core. Crystals of the third group are disposed on the line with NAS of 100 %.
The experimental studies dealing with the formation kinetics of А centers are somewhat contradictory. The first value for the activation energy of the formation of А centers (2.6eV) was estimated by Chrenko et al. (1977). These authors inferred second-order kinetics of the formation of А centers. In later studies (Belimenko et al. 1981; Evans and Qi 1982; Kanda et al. 1990; Kiflawi and Mainwood 1996; Taylor et al. 1996), the activation energy range was estimated to be 3.6–6.0 eV. Some discrepancies arise from fact that synthetic diamonds of cubo-octahedral or cubic habit show a facetted style
400 500 600 700 800 900 1000
I, a
. u
.
λ, nm
575
λex 488 nm
λex 787 nm
819
R787
800
N3
λex 405 nm 869
C
R
C
RC
R
838
S1
H3
0
5
10
15
600110016002100260031003600
a,c
m–1
λ, cm–1
0
1
2
10001100120013001400
1332
0
5
10
400 500 600 700 800 900 1000
a,
cm
–1
λ, nm
2.2
2.4
2.6
2.8
410 415 420
N3a b
c
C
R C
R
R
C
Fig. 4 Spectra of the plate U600: a – Absorption in the visible range, the inset shows line 415 nm of N3 center; b – Absorption in the IR range, the inset shows spectra after subtraction of the A centers absorption; c – Photoluminescence under 405, 488 and 787 nm excitation at 77 K. Letters C and R mark the spectra of the core and rim, respectively. The spectra have been adjusted vertically to avoid intersection of curves.

Enigma of cuboid diamonds
67
of growth (Taylor et al. 1996). These were compared to natural cuboid diamonds of the non-facetted growth. The activation energy of the С→А reaction, as estimated by various researchers for various growth pyramids, differs substantially (Taylor et al. 1996; Collins 2001; Kazuchits et al. 2019).
It seems that the kinetics of this reaction may vary, depending on factors such as the presence of nickel or other impurities (Fisher and Lawson 1998; Kiflawi et al. 1998; Nadolinny et al. 2000; Yelisseyev and Kanda 2007), radiation (Collins 1980; Taylor et al. 1996; Kim et al. 2011; Mita et al. 2018) and plastic deformation (Nadolinny et al. 2020). The activation energy of ag-gregation of C centers into A center in Ni-containing synthetic diamonds with NV centers may vary from 0.5 to 1.5 eV depending on nitrogen concentration (Yelisseyev et al. 2011). In this research, three dif-ferent mechanisms of the C centers aggregation were proposed. The combined effect of all mentioned factors makes it much more difficult to interpret the results obtained and to understand the processes. Thus, on the one hand, radiation stimulates the diffusion activity of impurity atoms (Collins 1980); on the other hand, the generated interstitials stabilize single nitrogen atoms (Collins and Dahwich 2003). Another complication is the irregularity of the distribution of nitrogen and d-elements throughout different growth pyramids (Fisher and Lawson 1998; Babich and Feigelson 2009). Several of the above-mentioned factors have been neglected while interpreting the experimental results.
The PL systems S1 and S2 are known to be due to Ni-involving centers (Dishler 2012). The system SB700 is also attributed to Ni-bearing centers (Titkov et al. 2015). Systems with maxima of 799.5, 819.6, 869.5 and 930 nm were revealed in the spectra of cuboids from the Urals placers (Klepikov et al. 2019). In most cases, the systems were registered together with the 883/885 nm doublet of the low-temperature Ni involving center.
It has been shown earlier (Yelisseyev and Kanda 2007) that Ni impurity stabilizes N+ defects, by compensating the charge and decreasing their diffusion mobility. It is hereby inferred that the “inverse” distribution of color in the crystals of the third group is the result of stabilization of single nitrogen atoms by Ni atoms. This is the simplest interpretation based on the fact of conversion between C and C+ centers, with changing intensities of lines 1344 and 1332 cm–1 respectively (Lawson et al. 1998; Khan et al. 2010).
In the crystals U600 and U601, the volume distribution of N3V does not coincide with either color or Ni-related PL. These stones display an inverse relationship between the concentration of N3V centers and that of hydrogen-bearing N3VH centers with absorption at 3107 cm–1. Simi-lar distributions have been observed earlier (Vasilev et al. 2019) and are interpreted to be due to the trapping of a hydrogen atom by N3V centers and their transformation to
Fig. 5 A dependence of the absorbance at 450 nm on concentration of C centers (a) and on absorbance of the line 1332 cm–1 (b). Arrows mark the rim points. Grey lines refer to the diamonds with normal zoning. Black circles in (a) and bold arrows in (b) correspond to the Uralian diamonds.
0
10
20
30
0 50 100 150
a4
50,
cm
–1
NC, ppm
Ubk 1-2
Ubk 1-7
ISTD-3
Ubz 15
Ubk 2
IST 2-9
IST 2-20
ISTD-20
HL3ISTD-28
0
10
20
30
0 1 2 3 4
a450,
cm
–1
a1332, cm-1
Ubk 1-2
Ubk 1-7
ISTD-3
Ubz 15
Ubk 2
IST 2-9
IST 2-20
ISTD-20
HL3
ISTD-28
U601
U610
U600
Fig. 6 Transformation of the state of nitrogen in the studied diamonds from core to rim. Arrows indicate the points in the rim zones. All diamonds of the third group from the Urals fall on the top of the dia-gram. Isotherms are calculated for annealing time of 10 yr (italic) by calibrations from Chrenko et al. (1977), and for annealing time of 10 Myr (bold) using calibrations from Taylor et al. (1996) for cubic faces.
0
25
50
75
100
0 100 200 300 400
NA
S, %
Ntot, ppm
1023 К
1950
1123 К
2035
1173 К
2075
1223 К
2115
1323 К
2180
Ubz-15
Ubk-2
Ubk 1-2Ubk 1-7
HL3
ISTD 20
ISTD 28IST 2-20 IST 2-9
U 600U 601 U 610U 126
ISTD 3ISTD 3

Evgeny A. Vasilev, Dmitry A. Zedgenizov, Igor V. Klepikov
68
the form N3VH: N3V + H → N3VH. This form is inactive in luminescence but active in IR absorption.
Hence, the study of defect distributions within crystals enables a better understanding of the transformation pat-terns of impurity and internal defects and reveals their genesis.
The results show an existence of some regional features in the evolution of diamond-forming systems. The yellow diamonds from conventional Yubileinaya kimberlitic pipe have the lowest model temperature or mantle residence time. These stones do not contain any of high-temperature centers B, B’ or N3 and show only limited variations in nitrogen content during the crystal growth. Majority of the diamonds from Istok placer in the Anabaro–Oleneksky interfluve shows inverse distri-bution of nitrogen A and C centers. They contain only a few high-temperature N3 centers in peripheral parts. The diamonds from the Urals show a heterogeneity of another origin. They do not contain the simplest C centers, but instead rare Ni-related centers in the core, and the B, B’, N3 in the periphery.
It remains unclear, what growth conditions and post-growth treatment lead to the differentiation of diamonds in the content of Ni-related centers. Further efforts are required to find the cause of variation in Ni concentration upon the growth of cuboids and to reveal the nature of the observed PL systems.
5. Conclusions
Three types of the distribution of spectroscopic character-istics have been identified in cubic diamonds with a yellow core. The results show regional features in the studied diamonds regarding the nature of their heterogeneity. 1) The nitrogen concentrations in the C-center vary in
the diamonds from the Yubileinaya pipe. This popu-lation is characterized by red photoluminescence; it has higher C-center, total nitrogen concentrations and stronger color in the core than in the rim.
2) Complicated (“inverse”) distribution of nitrogen cen-ters was observed in the diamonds from North Yakutia. The detection of the A-centers in the periphery, and low-temperature С-centers in the core are uncommon. This is inferred to be caused by growth origin of A centers, as shown previously in the case of synthetic crystals.
3) The heterogeneous Ni impurity distribution was revea-led in diamonds from the Urals. Nickel atoms appear to stabilize С+ defects, thereby affecting the color of individual zones.
Acknowledgements. We would like to thank S. C. Kohn and S. Timmerman for the helpful discussion and their insightful
reviews and R. Škoda with V. Janoušek for the manuscript handling and valuable comments. This study has been sup-ported by Russian Science Foundation grant 16-17-10067.
Electronic supplementary material. Supplementary mate-rial (raw FTIR spectra for all analyzed points) is available online at the Journal web site (http://dx.doi.org/10.3190/jgeosci.301).
References
Babich YuV, Feigelson BN (2009) Distribution of N+ centers in synthetic diamond single crystals. Inorg Mater 45: 616–619
Babich YV, Feigelson BN, Fisher D, Yelisseyev AP, Nadolinny VA, Baker JM (2000) The growth rate effect on the nitrogen aggregation in HTHP growth synthetic diamonds. Diamond Relat Mater 9: 893–896
Belimenko LD, Klyuev YuA, Laptev VA, Naletov AM, Nepsha VI, Samoilovich MI (1981) The effect of diamond single-crystal annealing under conditions of their thermodynamic stability on the formation and transformation of structural imperfections. Dokl Akad Nauk SSSR 259: 1360–1363
Birman JL (1974) Theory of Crystal Space Groups and Infra-Red and Raman Lattice Processes of Insulating Crystals. Springer-Verlag, Berlin, pp 1–521
Boyd SR, Mattey DP, Pillinger CT, Milledge HJ, Men-delssohn M, Seat M (1987) Multiple growth events during diamond genesis: an integrated study of carbon and nitrogen isotopes and nitrogen aggregation state in coated stones. Earth Planet Sci Lett 86: 341–357
Boyd SR, Kiflawi I, Woods GS (1994) The relationship between infrared absorption and the A defect concentra-tion in diamond. Philos Mag B 69: 1149–1153
Bulanova GP, Pearson DG, Hauri EH, Griffin BJ (2002) Carbon and nitrogen isotope systematics within a sector-growth diamond from the Mir kimberlite, Yakutia. Chem Geol 188: 105–123
Chrenko RM, Tuft RE, Strong U (1977) Transformation of the state of nitrogen in diamond. Nature 270: 141–144
Clark CD, Davey ST (1984) One-phonon infrared absorp-tion in diamond. J Phys C: Solid St Phys 17: 1127–1140
Collins AT (1980) Vacancy enhanced aggregation of nitro-gen in diamond. J Phys C: Solid St Phys 13: 2641–2650
Collins AT (2001) The colour of diamond and how it may be changed. J Gemm 27: 341–359
Collins AT, Dahwich A (2003) The production of vacan-cies in type Ib diamond. J Phys Condens Matter 15: L591–L596
Collins AT, Mohammed K (1982) Optical studies of vi-bronic bands in yellow luminescing natural diamonds. J Phys C: Solid St Phys 15: 147–158
Enigma of cuboid diamonds
69
Dishler B (2012). Handbook of Spectral Lines in Diamond. Springer-Verlag, Berlin, pp 1–467
Evans T, Qi Z (1982) The kinetics of the aggregation of nitrogen atoms in diamond. Proc R Soc London, Ser A 381: 159–178
Fisher D, Lawson SC (1998) The effect of nickel and cobalt on the aggregation of nitrogen in diamond. Diamond Relat Mater 7: 299–304
Goss JP, Briddon PR, Hill V, Jones R, Rayson MJ (2014) Identification of the structure of the 3107 cm−1 H-related defect in diamond. J Phys Condens Matter 26: 1–6
Gubanov N, Zedgenizov D, Sharygin I, Ragozin A (2019) Origin and evolution of high-Mg carbonatitic and low-Mg carbonatitic to silicic high-density fluids in coated diamonds from Udachnaya kimberlite pipe. Minerals 9: 734
Hainschwang T, Simic D, Fritsch E, Deljanin B, Wo-odring S, DelRe N (2005) A gemological study of a col-lection of chameleon diamonds. Gems Gemol 1: 20–35
Hainschwang T, Notari F, Fritsch E, Massi L (2006) Natural, untreated diamonds showing the A, B and C infrared absorptions (“ABC diamonds”), and the H2 absorption. Diamond Relat Mater 15: 1555–1564
Hainschwang T, Fritsch E, Notari F, Rondeau B (2012) A new defect center in type Ib diamond inducing one phonon infrared absorption: the Y center. Diamond Relat Mater 21: 120–126
Hainschwang T, Karampelas S, Fritsch E, Notary F (2013) Luminescence spectroscopy and microscopy applied to study gem materials: a case study of C centre containing diamonds. Mineral Petrol 107: 393–413
Kamiya Y, Lang AR (1965) On the structure of coated diamonds. Philos Mag 11: 347–356
Kanda H, Ohsawa T, Yamaoka S (1990) Formation of nitrogen pairs in synthetic diamond during growth. In: Saito S, Fukunaga O, Yoshikawa M (eds) Science and Technology of New Diamond. Terra Scientific Publish-ing, Tokio, pp 339–344
Kazuchits NM, Rusetsky MS, Kazuchits VN, Korolik OV, Kumar V, Moe KS, Wang W, Zaitsev AM (2019) Comparison of HPHT and LPHT annealing of Ib syn-thetic diamond. Diamond Relat Mater 91: 156–164
Khan R, Martineau PM, Cann BL, Newton ME, Dhillon HK, Twitchen DJ (2010) Color alterations in CVD syn-thetic diamond with heat and UV exposure: implications for color grading and identification. Gems Gemol 1:18–26
Kiflawi I, Mainwood A (1996) Nitrogen interstitials in diamond. Phys Rev B 54: 16719–16726
Kiflawi I, Kanda H, Mainwood A (1998) The effect of nickel and the kinetics of the aggregation of nitrogen in diamond. Diamond Relat Mater 7: 327–332
Kim JR, Kim DK, Zhu H, Abbaschian R (2011) High pres-sure and high temperature annealing on nitrogen aggrega-tion in lab-grown diamonds. J Mater Sci 46: 6264–6272
King JM, Shigley JE, Gelb TH, Guhin SS, Hall M, Wang W (2005) Characterization and grading of natural-color yellow diamonds. Gems Gemol 2: 88–115
Klepikov IV, Vasilev EA, Antonov AV (2019) Defect and admixture composition of diamond crystals with growth pyramids <100> from placers of the Krasnovichersky district, the Urals. Proc Russian Miner Soc 5: 59–72
Kohn SC, Speich L, Smith CB, Bulanova GP (2016) FTIR thermochronometry of natural diamonds: a closer look. Lithos 265: 148–158
Lai MY, Stachel T, Breeding CM, Stern AR (2020) Yellow diamonds with colourless cores – evidence for episodic diamond growth beneath Chidliak and the Ekati Mine, Canada. Mineral Petrol 114: 91–103
Lawson SС, Kanda H (1993) An annealing study of nickel point defects in high-pressure synthetic diamond. J Appl Phys 73: 3967–3973
Lawson CS, Fisher D, Hunt DC, Newton ME (1998) On the existence of positively charged single-substitu-tional nitrogen in diamond. J Phys Condens Matter 10: 6171–6180
Liggins S (2010) Identification of Point Defects in Treated Single Crystal Diamond. Unpublished PhD. thesis, Uni-versity of Warwick, pp 1–241
Mita Y, Nisida Y, Okada M (2018) Formation of the nitrogen aggregates in annealed diamond by neutron irradiation. AIP Adv 8: 025106
Nadolinny VA, Yelisseyev AP, Baker JM, Twitchen DJ, Newton ME, Feigelson BN, Yuryeva OP (2000) Mechanisms of nitrogen aggregation in nickel- and cobalt-containing synthetic diamonds. Diamond Relat Mater 9: 883–886
Nadolinny VA, Shatsky VS, Yuryeva OP, Rakhmanova MI, Komarovskikh AYu, Kalinin AA, Palyanov YuN (2020) Formation features of N3V centers in diamonds from the Kholomolokh placer in the Northeast Siberian Craton. Phys Chem Miner 47:4
Palyanov YN, Khokhryakov AF, Borzdov YuM, Sokol AS, Gusev VA, Rylov GM, Sobolev NV (1997) Growth conditions and real structure of synthetic diamond crys-tals. Rus Geol Geophys 5: 882–906
Reinitz M, Fritsch E, Shigley JE (1998) An oscillating visible light optical center in some natural green to yellow diamonds. Diamond Relat Mater 7: 313–316
Smit KV, D’Haenens-Johansson UFS, Howell D, Loudin LC, Wang W (2018) Deformation-related spectroscopic features in natural Type Ib–IaA diamonds from Zimmi (West African Craton). Mineral Petrol 112: 243–257
Taylor WR, Canil D, Milledge HJ (1996) Kinetics of Ib to IaA nitrogen aggregation in diamond. Geochim Cosmochim Acta 23: 4725–4733
Timmerman S, Chinn IL, Fisher D, Davies GR (2018) Formation of unusual yellow Orapa diamonds. Mineral Petrol 112: 209–218

Evgeny A. Vasilev, Dmitry A. Zedgenizov, Igor V. Klepikov
70
Titkov SV, Shiryaev AA, Zudina NN, Zudin NG, Solo-dova YuP (2015) Defects in cubic diamonds from the placers in the northeastern Siberian Platform: results of IR microspectrometry. Rus Geol Geophys 1–2: 354–362
Vasilev EA, Sofroneev SV (2007) Zoning of diamonds from the Mir kimberlite pipe: results of Fourier-transformed infrared spectroscopy. Geol Ore Depos 49: 784–791
Vasilev E, Kozlov A, Petrovsky V, Antonov A, Kud-riavtsev A, Orekhova K (2019) The story of one diamond: the heterogeneous distribution of the optical centres within a diamond crystal from the Ichetju placer, northern Urals. Mineral Mag 4: 515–522
Yelisseyev AP, Kanda H (2007) Optical centers related to 3d transition metals in diamond. New Diamond Front Carbon Technol 3: 127–178
Yelisseyev AP, Pokhilenko NP, Steeds JW, Zedgenizov DA, Afanasiev VP (2004) Features of coated diamonds from the Snap Lake/King Lake kimberlite dyke, Slave Craton, Canada, as revealed by optical topography. Lithos 1–4: 83–97
Yelisseyev AP, Vins VG, Lobanov SS, Maximov AYu (2011) Aggregation of donor nitrogen in irradiated Ni-containing synthetic diamonds. J Cryst Growth 1: 539–544
Zaitsev AM (2001) Optical Properties of Diamond: A Data Handbook. Springer, New York, pp 1–502
Zedgenizov DA, Kalinina VV, Reutsky VN, Yuryeva OP, Rakhmanova MI (2016) Regular cuboid diamonds from placers on the northeastern Siberian Platform. Lithos 265: 125–137