Original Contribution - brl.uiuc.edu · 0301-5629/06/$–see front matter 1639. gested that the AAC...
10
doi:10.1016/j.ultrasmedbio.2006.05.006 ● Original Contribution EXAMINATION OF CANCER IN MOUSE MODELS USING HIGH- FREQUENCY QUANTITATIVE ULTRASOUND MICHAEL L. OELZE,* ‡ and JAMES F. ZACHARY †‡ *Bioacoustics Research Laboratory, Department of Electrical and Computer Engineering; † Department of Pathobiology; and ‡ Department of Bioengineering, University of Illinois, Urbana, IL, USA (Received 21 November 2005; revised 27 April 2006; in final form 4 May 2006) Abstract—Two mouse models of mammary cancer (a carcinoma and sarcoma) were examined using quantitative ultrasound (QUS). Scatterer property estimates, i.e., the average scatterer diameter (ASD) and average acoustic concentration (AAC), were estimated from regions-of-interest (ROIs) inside the tumors. Initially, the spherical Gaussian model was used over an analysis bandwidth of 10 to 25 MHz to obtain ASD and AAC estimates. ASD estimates were 31.7 9.36 m and 31.0 7.20 m for the carcinomas and sarcomas, respectively. AAC estimates were 6.77 8.75 dB[mm –3 ] and 9.87 9.24 dB[mm –3 ], respectively. The initial ASD and AAC estimates did not yield statistically significant differences between the two kinds of tumors (p 0.83, 0.86 for the ASD and AAC estimates, respectively). However, optical photomicrographs revealed distinct morphologic differences between the tumors. F-tests on the average power spectra from the tumors revealed statistically significant differences between the spectra over the range of 16 to 25 MHz. ASD and AAC estimates using the spherical Gaussian model were then obtained over the new analysis bandwidth of 16 to 25 MHz. The new ASD estimates were 42.1 4.01 m and 32.1 3.81 m for the carcinomas and sarcomas, respectively. The new AAC estimates were 16.4 17.1 dB[mm –3 ] and 36.4 11.9 dB[mm –3 ], respectively. Statistically significant differences were observed for both the ASD and AAC estimates when using the new analysis bandwidth. Structural differences between the tumors were revealed by both QUS and optical photomicrographs. (E-mail: [email protected]) © 2006 World Federation for Ultrasound in Medicine & Biology. Key Words: Quantitative ultrasound, Backscatter, Cancer detection, Tissue characterization, Breast cancer, Parametric imaging. INTRODUCTION Qualitative ultrasound (QUS) has been used successfully to diagnose and monitor disease, such as cancer. Further- more, QUS approaches have been used to differentiate different kinds of tissues (Insana et al. 1991; Lizzi et al. 1983, 1987; Miller et al. 1983; Oelze et al. 2002). QUS images, images enhanced by scatterer parameters like the average scatterer diameter (ASD) and average acoustic concentration (AAC), have been constructed for test phantoms (Insana and Hall 1990) and tissues (Feleppa et al. 1986, 1988, 1999; Insana and Brown 1993; Lizzi et al. 1997a; Silverman et al. 1995). The AAC is defined as the number of scatterers per unit volume multiplied by the squared difference in acoustic impedance between the scatterers and surrounding medium (Feleppa et al. 1988). In clinical settings, QUS has been used to successfully diagnose prostate cancer, ocular tumors and cardiac ab- normalities (Feleppa et al. 1997; Lizzi et al. 1997a; Miller et al. 1983). QUS backscattering techniques have also been used to characterize different aspects of tissue microstructures (Lizzi et al. 1997b). Noteworthy are the pioneering works of Lizzi et al. (1983, 1987) that dem- onstrated theoretically and experimentally the ability to ultrasonically quantify ocular, liver and prostate tissues. Feleppa et al. (1986) found that the effective scat- terer size (ASD) in ocular tumors was a strong indicator of malignant cancer. Larger ASDs were observed in malignant tumors as opposed to surrounding normal tis- sues. The AAC was less sensitive for cancer detection than the scatterer size but was helpful for diagnostically distinguishing between ambiguous cases (Lizzi et al. 1987). Feleppa et al. (1996) and Balaji et al. (2002) also demonstrated that QUS provided greater diagnostic ac- curacy in prostate-cancer detection and lesion localiza- tion than all other noninvasive techniques combined. Although initial studies by Feleppa et al. (1986) sug- Address correspondence to: Michael L. Oelze, Beckman Insti- tute, 405 N Mathews, University of Illinois at Urbana-Champaign, Urbana, IL 61801, USA. E-mail: [email protected] Ultrasound in Med. & Biol., Vol. 32, No. 11, pp. 1639 –1648, 2006 Copyright © 2006 World Federation for Ultrasound in Medicine & Biology Printed in the USA. All rights reserved 0301-5629/06/$–see front matter 1639
Transcript of Original Contribution - brl.uiuc.edu · 0301-5629/06/$–see front matter 1639. gested that the AAC...

Ultrasound in Med. & Biol., Vol. 32, No. 11, pp. 1639–1648, 2006Copyright © 2006 World Federation for Ultrasound in Medicine & Biology
Printed in the USA. All rights reserved0301-5629/06/$–see front matter
doi:10.1016/j.ultrasmedbio.2006.05.006
● Original Contribution
EXAMINATION OF CANCER IN MOUSE MODELS USING HIGH-FREQUENCY QUANTITATIVE ULTRASOUND
MICHAEL L. OELZE,*‡ and JAMES F. ZACHARY†‡
*Bioacoustics Research Laboratory, Department of Electrical and Computer Engineering; †Department ofPathobiology; and ‡Department of Bioengineering, University of Illinois, Urbana, IL, USA
(Received 21 November 2005; revised 27 April 2006; in final form 4 May 2006)
Abstract—Two mouse models of mammary cancer (a carcinoma and sarcoma) were examined using quantitativeultrasound (QUS). Scatterer property estimates, i.e., the average scatterer diameter (ASD) and average acousticconcentration (AAC), were estimated from regions-of-interest (ROIs) inside the tumors. Initially, the sphericalGaussian model was used over an analysis bandwidth of 10 to 25 MHz to obtain ASD and AAC estimates. ASDestimates were 31.7 � 9.36 �m and 31.0 � 7.20 �m for the carcinomas and sarcomas, respectively. AACestimates were 6.77 � 8.75 dB[mm–3] and 9.87 � 9.24 dB[mm–3], respectively. The initial ASD and AACestimates did not yield statistically significant differences between the two kinds of tumors (p � 0.83, 0.86 for theASD and AAC estimates, respectively). However, optical photomicrographs revealed distinct morphologicdifferences between the tumors. F-tests on the average power spectra from the tumors revealed statisticallysignificant differences between the spectra over the range of 16 to 25 MHz. ASD and AAC estimates using thespherical Gaussian model were then obtained over the new analysis bandwidth of 16 to 25 MHz. The new ASDestimates were 42.1 � 4.01 �m and 32.1 � 3.81 �m for the carcinomas and sarcomas, respectively. The new AACestimates were 16.4 � 17.1 dB[mm–3] and 36.4 � 11.9 dB[mm–3], respectively. Statistically significant differenceswere observed for both the ASD and AAC estimates when using the new analysis bandwidth. Structuraldifferences between the tumors were revealed by both QUS and optical photomicrographs. (E-mail:[email protected]) © 2006 World Federation for Ultrasound in Medicine & Biology.
Key Words: Quantitative ultrasound, Backscatter, Cancer detection, Tissue characterization, Breast cancer,
Parametric imaging.INTRODUCTION
Qualitative ultrasound (QUS) has been used successfullyto diagnose and monitor disease, such as cancer. Further-more, QUS approaches have been used to differentiatedifferent kinds of tissues (Insana et al. 1991; Lizzi et al.1983, 1987; Miller et al. 1983; Oelze et al. 2002). QUSimages, images enhanced by scatterer parameters like theaverage scatterer diameter (ASD) and average acousticconcentration (AAC), have been constructed for testphantoms (Insana and Hall 1990) and tissues (Feleppa etal. 1986, 1988, 1999; Insana and Brown 1993; Lizzi et al.1997a; Silverman et al. 1995). The AAC is defined as thenumber of scatterers per unit volume multiplied by thesquared difference in acoustic impedance between thescatterers and surrounding medium (Feleppa et al. 1988).In clinical settings, QUS has been used to successfully
Address correspondence to: Michael L. Oelze, Beckman Insti-
tute, 405 N Mathews, University of Illinois at Urbana-Champaign,Urbana, IL 61801, USA. E-mail: [email protected]1639
diagnose prostate cancer, ocular tumors and cardiac ab-normalities (Feleppa et al. 1997; Lizzi et al. 1997a;Miller et al. 1983). QUS backscattering techniques havealso been used to characterize different aspects of tissuemicrostructures (Lizzi et al. 1997b). Noteworthy are thepioneering works of Lizzi et al. (1983, 1987) that dem-onstrated theoretically and experimentally the ability toultrasonically quantify ocular, liver and prostate tissues.
Feleppa et al. (1986) found that the effective scat-terer size (ASD) in ocular tumors was a strong indicatorof malignant cancer. Larger ASDs were observed inmalignant tumors as opposed to surrounding normal tis-sues. The AAC was less sensitive for cancer detectionthan the scatterer size but was helpful for diagnosticallydistinguishing between ambiguous cases (Lizzi et al.1987). Feleppa et al. (1996) and Balaji et al. (2002) alsodemonstrated that QUS provided greater diagnostic ac-curacy in prostate-cancer detection and lesion localiza-tion than all other noninvasive techniques combined.
Although initial studies by Feleppa et al. (1986) sug-
1640 Ultrasound in Medicine and Biology Volume 32, Number 11, 2006
gested that the AAC was less sensitive for detectingocular tumors than the scatterer size (Silverman et al.1997), later studies (Feleppa et al. 1997) suggested thatthere were large differences in both ASD and AACbetween malignant and nonmalignant regions, emphasiz-ing a potentially important role for the latter.
Anisotropy measurements of scattering in the kid-ney revealed that changes in the effective scatteringstrength (same as the AAC defined in this study) wereresponsible for the anisotropy of backscatter and notchanges in scatterer size (Insana et al. 1991). In thatwork, the glomeruli (�200 �m) and afferent and efferentarterioles (�50 �m) were identified as the principalstructures responsible for scattering at diagnostic ultra-sound frequencies (1 to 15 MHz). These studies led toinvestigations into using QUS images of the scattererproperties to detect changes in renal microanatomy(Garra et al. 1994; Hall et al. 1996; Insana et al. 1992,1995). QUS imaging techniques were capable of differ-entiating among conditions that caused increased corticalechogenicity and structural changes like glomerular hy-pertrophy. Furthermore, ASD estimates agreed well withmeasurements of those structures made using biopsysamples.
In a previous study, Oelze et al. (2004) were able todistinguish between benign fibroadenomas and mam-mary carcinomas in rodent models of breast cancer usingQUS techniques. Furthermore, the estimated scattererproperties were related to actual tissue morphology bycomparisons with optical photomicrographs of stainedtissue sections. Success in using ultrasound to diagnosebreast cancer in humans has been limited. System-de-pendent techniques for evaluating echogenic features ofB-mode images have had limited success in detectingand classifying breast cancer. Several studies in the lit-erature describe improved means of diagnosing breastabnormalities, specifically distinguishing cystic fromsolid tumors and differentiating among solid breast tu-mors, in an effort to improve diagnostic accuracy. Onewell-known study is by Stavros et al. (1995), who de-scribed a set of criteria, e.g., relative “echogenicity,”shadowing, speculation, lobulation features, etc., for di-agnosing breast lesions. This work was followed by aneffort to encode many of the criteria into an automatedalgorithm (Drukker et al. 2002). The limited success ofsystem-dependent techniques for detecting and classify-ing breast cancer could be improved by augmentationwith QUS analysis.
The successes of QUS in earlier studies of oculartumors, renal tissues, prostate cancer, and breast lesionssuggested that variance in scatterer property estimatesfrom tissues was manageable and did not destroy theeffectiveness of the techniques. On the basis of those
previous successes, two malignant cases of mammarycancer in mouse models were studied using QUS tech-niques: a carcinoma and a sarcoma.
MATERIALS AND METHODS
Animal useThe experimental protocol was approved by the
Institutional Animal Care and Use Committee of theUniversity of Illinois and satisfied all campus and Na-tional Institutes of Health rules for the humane use oflaboratory animals.
Mouse carcinomasA mouse mammary tumor cell line (4T1 [CRL-
2539]) was purchased from American Type Culture Col-lection (ATCC, Manassas, VA, USA). This cell line waschosen because of its homogeneous cytologic character-istics and because the tumors are models for stage IVhuman breast cancer in growth patterns (Aslakson andMiller 1992; Pulaski and Ostrand-Rosenberg 1998; Pu-laski et al. 2000). For example, the 4T1 mouse mammarytumor spontaneously metastasizes while the primary tu-mor is in place, analogous to human tumors (Pulaski etal. 1998) Further, the locations of these metastases arecommon between the mouse and human malignancies.
The 4T1 cells have relatively uniform morphology:they are oval to polygonal in shape with large prominentnuclei. Extracellular matrix was minimal to nonapparent.We used these cells as an in vivo model for uniformscattering statistics in tissues. In the context of QUSimaging, the tumors from this cell line mimic the appear-ance of ductal carcinoma in situ (DCIS) in humans. Cellsrelated to DCIS in humans appear to be monomorphic innature (unless surrounded by Paget cells that are pleo-morphic with abundant cytoplasm) and can consist ofsheets of carcinoma cells (Cotran et al. 1999). Similarly,the 4T1 mouse mammary tumors contain sheets of car-cinoma cells that appear to be monomorphic in nature.
The 4T1 cells were stored at –70°C, thawed at 37°Cin a water bath, grown in Roswell Park Memorial Insti-tute (RPMI) 1640 medium with 10% fetal bovine serum(FBS) and antibiotic/antifungal supplements (ATCC),and incubated at 37°C at 100% humidity and 5% CO2.Cells were grown in 75-cm2 tissue culture flasks (T-75,Corning Incorporated, Corning, NY, USA). When cellswere 80% confluent (i.e., adherent cell line), they wererinsed with RPMI 1640 medium lacking FBS or supple-ments and then covered with 2.0 mL of Trypsin-EDTA(ATCC) to detach the cells from the flask. The cells weregently and repetitively drawn through a 10-mL pipette toindividualize the cells. The number of cells present in an80% confluent flask was determined to be approximately107 cells/mL. The approximate number was calculated
by counting the number of cells in a small area of the
Quantitative ultrasound analysis ● M. L. OELZE AND J. F. ZACHARY 1641
flask and extrapolating to estimate the total number ofcells contained in the entire flask.
Detached cells were washed two times with 10 mLof RPMI 1640 medium lacking FBS or supplements andresuspended in RPMI 1640 medium lacking FBS orsupplements to concentration of 105 cells/mL. The ab-dominal mammary fat pad of anesthetized 8- to 16-week-old female BALB/c mice (Harlan, Indianapolis, IN,USA) was injected with 0.1 mL of suspended 4T1 cells(approximately 104 cells). The injected cells initiatedvisible tumor growth in 100% of mice within 8 to 10days postinjection (Pulaski and Ostrand-Rosenberg1998). Tumors in the mice were allowed to grow untilthey had reached 1 cm in diameter (typically three to fourweeks post injection). Mice were then anesthetized andhumanely killed under anesthesia by cervical dislocation.The tumors were ultrasonically imaged in situ by record-ing the backscattered RF signals (see Ultrasound scan-ning procedures). The scanning system consisted of me-chanically translating a single-element transducer acrossthe tumor. The animals were euthanized before scanningbecause tumor motion due to breathing in live animalsduring scans caused distortion in the subsequent ultra-sound images (humans can compliantly hold their breathfor several seconds). The trade-off for scanning eutha-nized animals is that the effects of blood flow on ultra-sound backscatter could not be characterized.
Ten 4T1 tumor-bearing mice were analyzed usingQUS. For each mouse, the tumor and surrounding areawere shaved with electric clippers and depilated (Nair®).Each euthanized mouse was placed in a holder in a tankof degassed water at 37°C for scanning with an ultra-sonic transducer. After scanning, tumors were excised,fixed in 10% neutral-buffered formalin, processed andembedded in paraffin, sectioned at 5 �m, and stainedwith hematoxylin and eosin (H&E) for routine histologicevaluation by light microscopy. The tumors were diag-nosed as mouse mammary carcinomas following his-topathologic evaluation.
Mouse sarcomasA mouse sarcoma tumor cell line (Englebreth-
Holm-Swarm, EHS [CRL-2539]) was purchased fromAmerican Type Culture Collection (Manassas, VA,USA). This cell line was chosen because it producedabundant extracellular materials and basement-mem-brane components (laminin, collagen IV, entactin, andheparan sulfate proteoglycan) (Kleinman et al. 1986;Timpl et al. 1979). Like the carcinoma cell line, the cellswere relatively uniform in morphology: they were ovalto polygonal in shape with large prominent nuclei andarranged in groups usually containing less than 20 cellsper group. Groups of cells were distributed at random in
the abundant extracellular matrix, thus, in many areassuch groups of cells were widely separated, which re-sulted in identifiable structural differences when com-pared with the carcinomas. We used these cells as an invivo model for uniform scattering statistics in tissues andto examine the role of extracellular matrix in ultrasonicscattering.
Mice were weighed and then anesthetized with ket-amine hydrochloride (87.0 mg/kg) and xylazine (13.0mg/kg) administered intraperitoneally before injectionwith EHS cells. Initially the EHS cells were stored at–70°C. Culturing procedures consisted of thawing thecells at 37°C in a water bath and injecting them into threeC57BL/6 mice. The cells were cultured in vivo. The micewould develop visible tumors after 14 to 21 days postinoculation. When the tumors were about 1 cm in diam-eter, the tumors were harvested from the mice, mincedand injected intramuscularly (over the hind limb) intoC57BL/6 mice. The number of mice injected dependedon the tumor yield from the three mice. Some of thenewly injected mice were then used to continue theculturing process and some were used in the QUSanalysis.
The mice to be analyzed with QUS were examineddaily for tumor progression. When tumors reached adiameter of 1.0 cm (usually about 14 to 21 days afterinoculation), mice were anesthetized and humanely eu-thanized under anesthesia by cervical dislocation. Thetumors of the mice were scanned in situ ultrasonicallyand analyzed using QUS.
Ten EHS tumor-bearing mice were used in thestudy. For each mouse, the tumor and surrounding areawere immediately shaved with electric clippers and dep-ilated (Nair®). The mouse was then placed on a holder ina tank of degassed water at 37°C for scanning with anultrasonic transducer. After scanning, the EHS-cell tu-mors were excised, processed, and evaluated as previ-ously described for 4T1-cell tumors.
Ultrasound scanning proceduresA single-element, weakly focused transducer was
used to scan the mice. The transducer had a measuredcenter frequency of 20 MHz at the focus and a 75%–6-dB pulse/echo bandwidth that extended from 10 to 25MHz. The aperture diameter of the 20-MHz transducerwas 6 mm with a focus measured at 22 mm.
This transducer was interfaced with a Panametrics5900 pulser/receiver. The received radiofrequency (RF)signals were acquired using a digital oscilloscope (Lec-roy 9354TM, Chestnut Ridge, NY, USA) and down-loaded to a PC computer for postprocessing. The oscil-loscope digitized using 8-bit samples at a sampling rateof 200 MS/s. The transducers were moved laterallyacross the tumor by a micropositioning system with a
distance of 50 �m between adjacent scan lines. The
1642 Ultrasound in Medicine and Biology Volume 32, Number 11, 2006
attenuation for both kinds of tumors was 0.4 dB MHz–1
cm–1 based on insertion loss measurements made usingsliced carcinoma and sarcoma tumor tissues.
Estimation routinesAcoustic-scattering theories for biologic tissues as-
sume that the tissues can be modeled as inhomogeneousfluids (Insana and Brown 1993). Scattering occurs whenan acoustic wave interacts with a region that has differentacoustic impedance relative to the surrounding tissue orfluid. Acoustic signals backscattered from biologic tis-sues contain information about the size, shape, numberand relative acoustic impedance of the scattering regionswithin the tissues. Analysis of the frequency content ofbackscattered signals (the normalized backscatteredpower spectrum) from tissues allows the estimation ofcertain average scatterer properties. These estimates rep-resent ensemble averages of scatterer properties fromspecified ROIs.
Estimates of the average scatterer properties arefound by comparing the normalized backscattered powerspectrum of the RF signal gated from each ROI to atheoretical backscattered power spectrum. The backscat-tered power spectrum is the squared magnitude of theFourier transform of the range gated RF signal. Thetheoretical backscattered power spectrum has been mod-eled from a three-dimensional (3-D) spatial autocorrela-tion function (SAF) describing the shape and distributionof scatterers in the medium (Insana et al. 1991; Insanaand Brown 1993; Lizzi et al. 1987, 1997a; Oelze et al.2002). The SAF models assume plane wave incidence,the Born approximation (Ishimaru 1978), single scatter-ing, and the absence of shear waves (Insana et al. 1990;Morse and Ingard 1968).
An SAF model that has been used commonly todescribe soft tissue scattering is the spherical Gaussianmodel. The spherical Gaussian model has been used formany years and for many applications to obtain estimatesof scatter properties (Lizzi et al. 1997a; Nassiri and Hill1986; Nicholas 1982). The spherical Gaussian model hasbeen used because at low frequency the shape of thenormalized backscattered power spectrum appeared to fitmany tissue scattering measurements. Furthermore, theproperties of the spherical Gaussian model allowed rapidclassification schemes because it could be linearized inlog space (Oelze et al. 2002).
A theoretical power spectrum has been constructedthat incorporated range gating effects using a Hanningwindow and lateral beam pattern effects by Lizzi et al.for the spherical Gaussian scatterers (Lizzi et al. 1983,
1987, 1997a; Feleppa et al. 1986),Wtheor�f� �185Lq2aef f
6 nz f 4
�1 � 2.66f(qaef f)2�e�12.3 f 2aef f
2
, (1)
where f is the frequency (MHz), aeff, is the effectivescatterer radius (mm), nz, the AAC of scatterers (mm–3),L is the axial length of the range gated region (Hanningwindow) and q is the ratio of the aperture radius todistance from the ROI. The effective scatterer radiusrepresents the correlation length associated with a spatialimpedance profile described by a Gaussian function. TheASD was estimated by doubling the effective scattererradius. Equation (1) describes the scattering from an ROIlocated spatially within the depth of field of a weaklyfocused transducer where the wavefront can be assumedto be planar. The AAC is defined as the number densityof scatterers times the square of the impedance mis-
match, i.e.,Zscat�Zback
Zback, between scatterer and back-
ground.The measured backscattered power spectrum for an
ROI was constructed by averaging the backscatteredpower spectra measured from the echo signals of the setof scan lines within the ROI. The measured backscat-tered power spectrum is given by (Insana and Hall 1990),
Wcomp�f� �1
NA�f, L��
n�1
N
�FT�pn�t���2
Wref�f� , (2)
where FT�pn�t�� represents the Fourier transform of thegated RF signal of the nth scan line, N is the number ofgated scan lines contained within an ROI, A(f,L) is afrequency-dependent attenuation-compensation function(Oelze and O’Brien 2002) and Wref�f� is a referencepower spectrum. The reference power spectrum wasobtained by recording RF signals from reflections off asmooth planar surface of known reflectivity normal tothe transducer beam axis. The planar reflector was trans-lated from location at the front of the depth of field of thetransducer to the back of the depth of field with adistance of 75 �m (the wavelength at 20 MHz) betweensteps. At each point the RF signal reflected from thesmooth planar surface was recorded. The referencepower spectrum for an ROI was calculated by averagingthe squared magnitude of the Fourier transform of eachreflected RF signal corresponding to the axial location ofthe ROI. The effects of the equipment on the powerspectrum measurement were factored out by dividing bythe reference power spectrum (Insana and Hall 1990;Lizzi et al. 1983; Oelze et al. 2002). Dividing by thereference power spectrum normalized the measuredbackscattered power spectrum. The measured backscat-tered power spectrum was compensated for attenuation
losses according to the frequency-dependent attenuation-
Quantitative ultrasound analysis ● M. L. OELZE AND J. F. ZACHARY 1643
compensation function, A(f,L), derived for echo signalsgated with Hanning windows (Oelze and O’Brien 2002).
Estimates of the scatterer properties were madeusing the technique of Oelze et al. (2002) by comparingthe logarithm of the measured backscattered power spec-trum, eqn (2), with the logarithm of the theoretical powerspectrum, eqn (1) (Oelze et al. 2002),
10log10Wcomp�f� � 10log10 f 4 � m�aef f, q�f 2
� b�nz, aef f, L, q�. (3)
Subtracting 10log10 f 4 from both sides of eqn (3) andletting x � f2 yields
y � 10log10Wcomp�x� � 10log10 x2 � m�aef f, q�x
� b�nz, aef f, q, L�. (4)
Equation (4) describes a straight line vs. x where theslope, m, is a function of aeff and q, and the intercept, b,is a function of aeff, nz, q, and L. The quantity q isdetermined by the characteristics of the operating trans-ducer and L is known. To obtain the scatterer estimates,least-squares analysis was used to find the best-fit slopeand intercept from the log of the averaged backscatteredpower spectrum of eqn (4) (Oelze et al. 2002). Once theaverage effective scatterer radius (ASD) was estimatedfrom the slope of eqn (4), the AAC was estimated fromthe intercept and estimate of the ASD. Typically, AACvalues span a large dynamic range. Therefore, estimatesof AAC were expressed in a decibel scale,
nzdB� 10lognz, (5)
referenced to an acoustic concentration, nz, equal tounity.
Construction of quantitative ultrasound imagesBefore QUS images were constructed, B-mode im-
ages were generated from the RF data acquired in themouse scans. From the B-mode images, ROIs were se-lected inside the tumors where the B-mode images ap-peared to be homogeneous (no interfaces or large ech-oes). The axial length of an ROI corresponded to therange-gated RF echo with length of 1.5 mm. The laterallength of an ROI was also held at 1.5 mm (correspondingto 30 scan lines separated by 50 �m). Estimates ofscatterer properties were made for each ROI from the RFsignals using QUS analysis and eqn (4). ROIs werechosen within the tumor so that axially and laterally anoverlap of 66% existed from one ROI to the next.
Images revealing the spatial mapping of the scat-terer-property estimates within the tumor were createdby depicting the scatterer-property estimate at a particu-lar location with a specific pixel color. Each pixel rep-
resented the average scatterer-property estimates fromthree or more overlapping ROIs. The colored pixels werethen superimposed on the original grey-scale B-modeimage of the tumor to form the enhanced QUS image.
RESULTS
Enhanced QUS images of the carcinomas and sar-comas utilizing the estimates of the ASDs are displayedin Fig. 1. Initial estimates were obtained using the spher-ical Gaussian model with an analysis bandwidth of 10 to25 MHz. The colorbar in Fig. 1 corresponds to scattererdiameter estimates ranging from 0.0 to 160.0 �m. Thelarge range of ASD values was used because previousQUS studies of benign mammary fibroadenomas in ro-dent models revealed estimated ASDs of as much as160.0 �m (Oelze et al. 2004) Examination of the QUSimages does not allow distinguishing of carcinomas fromthe sarcomas. The ASD estimates for both tumors aregiven in the histogram of Fig. 2a. The average estimatedASDs for both tumors were 31.7 � 9.36 �m and 31.0 �7.20 �m for the carcinomas and sarcomas, respectively.Analysis of variance (ANOVA) was used to determinestatistically significant differences between the ASD es-timates from the carcinomas and sarcomas. A statisti-cally significant difference was not observed between thecarcinomas and sarcomas from the ASD estimates (p �0.83).
Enhanced QUS images of the carcinomas and sar-comas utilizing the estimates of the AAC are displayedin Fig. 3. The large range of AAC denoted by the
Fig. 1. Representative ASD images of mouse carcinomas (leftpanel) and mouse sarcomas (right panel).
colorbar was chosen based on previous QUS studies of

eprese
1644 Ultrasound in Medicine and Biology Volume 32, Number 11, 2006
benign mammary fibroadenomas in rodent models(Oelze et al. 2004). Examination of these images doesnot allow the distinguishing of the carcinomas from thesarcomas. The actual AAC values for both tumors aregiven in the histogram of Fig. 2b. The estimated AACvalues for both tumors were 6.77 � 8.75 dB (mm–3) and9.87 � 9.24 dB (mm–3) for the carcinomas and sarco-mas, respectively. A statistically significant differencewas not observed between the carcinomas and sarcomasfrom the AAC estimates (p � 0.86).
A feature analysis plot (Fig. 4) of the AAC vs. theASD indicates that the carcinomas and sarcomas are notseparable based on the scatterer property estimates ob-tained by using the spherical Gaussian model for ultra-sound backscatter with the initial analysis bandwidth.
Fig. 2. Histograms representing the (a) ASD and (b) thesarcomas. The error bars r
Fig. 3. AAC images of mouse carcinomas (left panel) and
mouse sarcomas (right panel).The points representing the two different kinds of tumorsfall on top of each other and no line can be drawn in Fig.4 separating one kind of tumor from the other. Further-more, examination of Fig. 4 reveals that larger ASDestimates correlate to smaller AAC estimates.
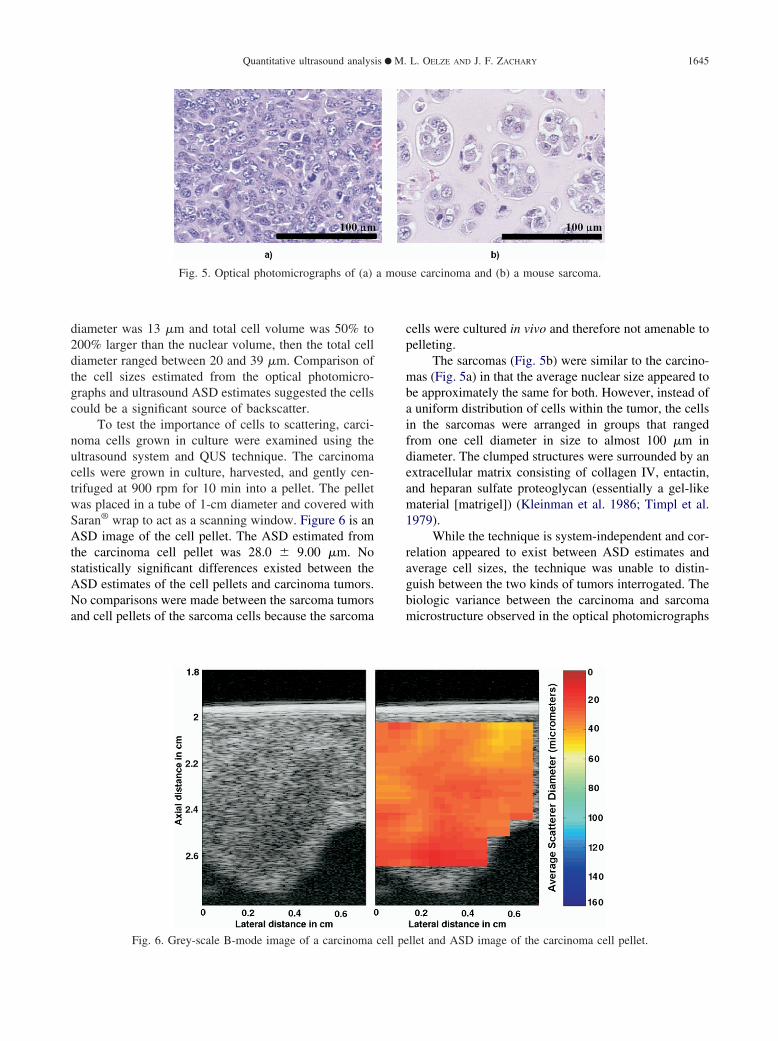
Examination of optical photomicrographs of thetwo kinds of tumors did reveal significant structuraldifferences between the carcinomas and sarcomas. Fig-ure 5a and b are optical photomicrographs of the carci-nomas and sarcomas. The carcinomas had relatively uni-form morphology (i.e., homogenous scatterer environ-ment) and minimal extracellular matrix. The cells wereoval to polygonal in shape with prominent nuclei and acytoplasmic volume 50% to 200% greater than the nu-clear volume. The ratio of cytoplasmic area relative tonuclear area was made by visually estimating the nucleararea from the two-dimensional (2-D) optical photomi-crographs of the tumors and the total area of the pho-tomicrograph slide. The average nuclear diameter wascalculated to be 13 �m, and details of this analysis can befound in Oelze et al. (2004). If the average nuclear
estimated from the 10 mouse carcinomas and 10 mousent one standard deviation.
Fig. 4. Feature analysis plot of the AAC vs. the ASD for the 10mouse carcinomas, Œ, and 10 mouse sarcomas, □, using the
AAC
analysis bandwidth of 10 to 25 MHz.
a mou
Quantitative ultrasound analysis ● M. L. OELZE AND J. F. ZACHARY 1645
diameter was 13 �m and total cell volume was 50% to200% larger than the nuclear volume, then the total celldiameter ranged between 20 and 39 �m. Comparison ofthe cell sizes estimated from the optical photomicro-graphs and ultrasound ASD estimates suggested the cellscould be a significant source of backscatter.
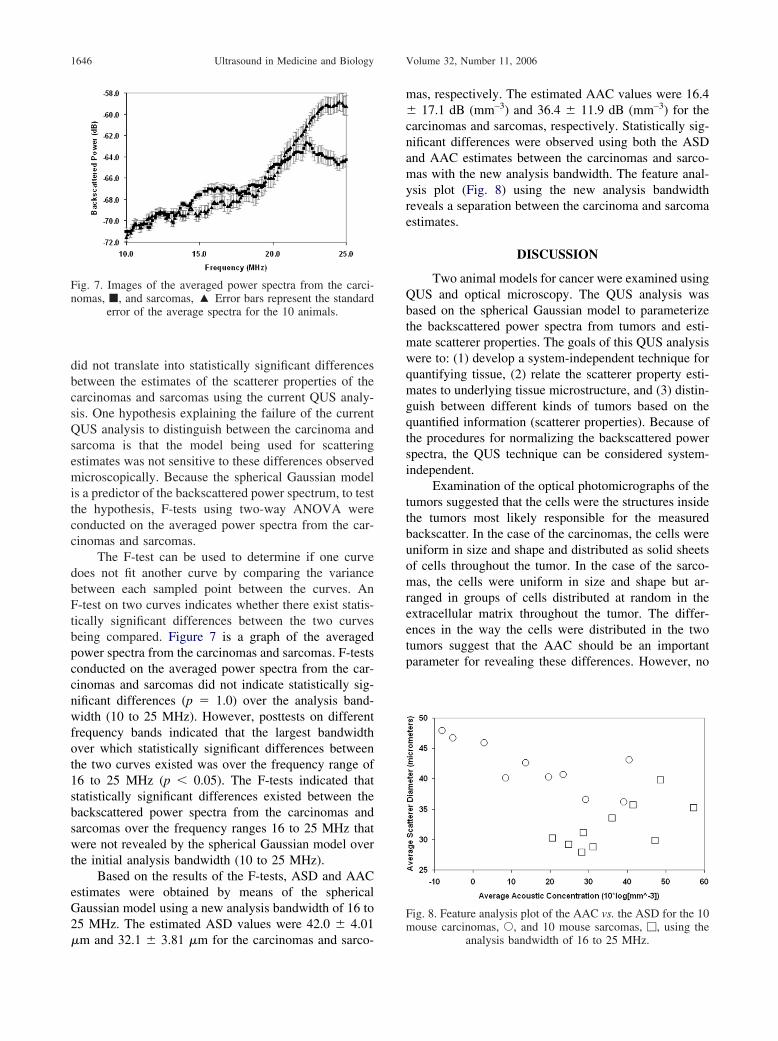
To test the importance of cells to scattering, carci-noma cells grown in culture were examined using theultrasound system and QUS technique. The carcinomacells were grown in culture, harvested, and gently cen-trifuged at 900 rpm for 10 min into a pellet. The pelletwas placed in a tube of 1-cm diameter and covered withSaran® wrap to act as a scanning window. Figure 6 is anASD image of the cell pellet. The ASD estimated fromthe carcinoma cell pellet was 28.0 � 9.00 �m. Nostatistically significant differences existed between theASD estimates of the cell pellets and carcinoma tumors.No comparisons were made between the sarcoma tumorsand cell pellets of the sarcoma cells because the sarcoma
Fig. 5. Optical photomicrographs of (a)
Fig. 6. Grey-scale B-mode image of a carcinoma cell pe
cells were cultured in vivo and therefore not amenable topelleting.
The sarcomas (Fig. 5b) were similar to the carcino-mas (Fig. 5a) in that the average nuclear size appeared tobe approximately the same for both. However, instead ofa uniform distribution of cells within the tumor, the cellsin the sarcomas were arranged in groups that rangedfrom one cell diameter in size to almost 100 �m indiameter. The clumped structures were surrounded by anextracellular matrix consisting of collagen IV, entactin,and heparan sulfate proteoglycan (essentially a gel-likematerial [matrigel]) (Kleinman et al. 1986; Timpl et al.1979).
While the technique is system-independent and cor-relation appeared to exist between ASD estimates andaverage cell sizes, the technique was unable to distin-guish between the two kinds of tumors interrogated. Thebiologic variance between the carcinoma and sarcomamicrostructure observed in the optical photomicrographs
se carcinoma and (b) a mouse sarcoma.
llet and ASD image of the carcinoma cell pellet.
1646 Ultrasound in Medicine and Biology Volume 32, Number 11, 2006
did not translate into statistically significant differencesbetween the estimates of the scatterer properties of thecarcinomas and sarcomas using the current QUS analy-sis. One hypothesis explaining the failure of the currentQUS analysis to distinguish between the carcinoma andsarcoma is that the model being used for scatteringestimates was not sensitive to these differences observedmicroscopically. Because the spherical Gaussian modelis a predictor of the backscattered power spectrum, to testthe hypothesis, F-tests using two-way ANOVA wereconducted on the averaged power spectra from the car-cinomas and sarcomas.
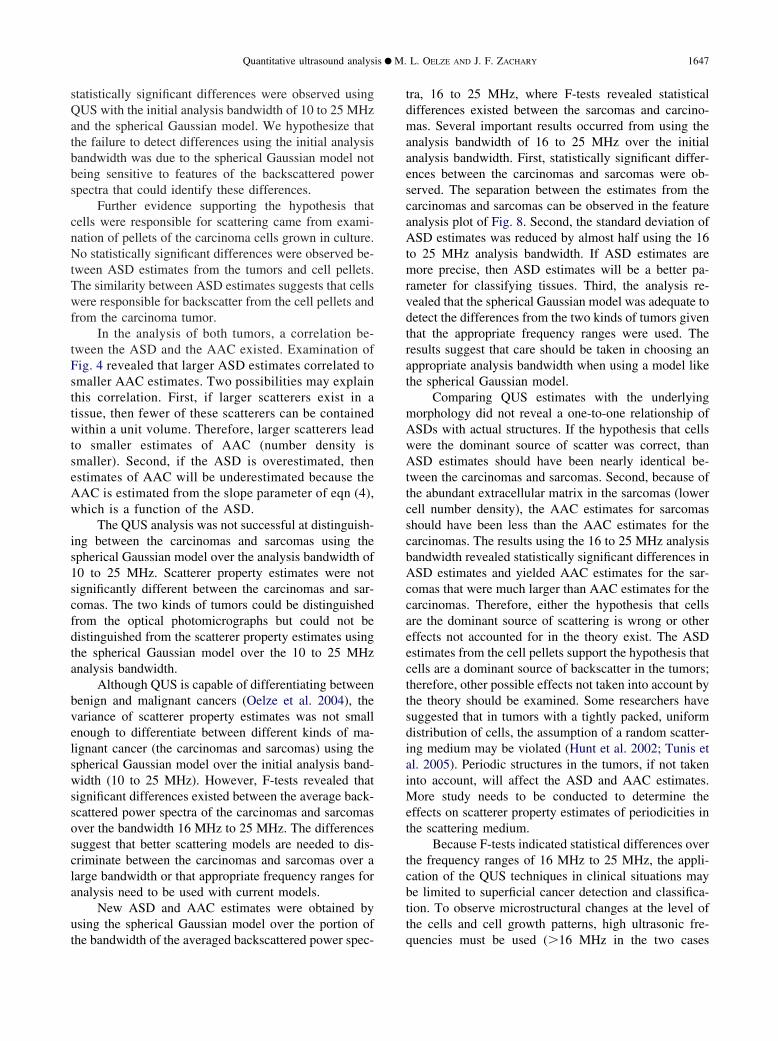
The F-test can be used to determine if one curvedoes not fit another curve by comparing the variancebetween each sampled point between the curves. AnF-test on two curves indicates whether there exist statis-tically significant differences between the two curvesbeing compared. Figure 7 is a graph of the averagedpower spectra from the carcinomas and sarcomas. F-testsconducted on the averaged power spectra from the car-cinomas and sarcomas did not indicate statistically sig-nificant differences (p � 1.0) over the analysis band-width (10 to 25 MHz). However, posttests on differentfrequency bands indicated that the largest bandwidthover which statistically significant differences betweenthe two curves existed was over the frequency range of16 to 25 MHz (p � 0.05). The F-tests indicated thatstatistically significant differences existed between thebackscattered power spectra from the carcinomas andsarcomas over the frequency ranges 16 to 25 MHz thatwere not revealed by the spherical Gaussian model overthe initial analysis bandwidth (10 to 25 MHz).
Based on the results of the F-tests, ASD and AACestimates were obtained by means of the sphericalGaussian model using a new analysis bandwidth of 16 to25 MHz. The estimated ASD values were 42.0 � 4.01
Fig. 7. Images of the averaged power spectra from the carci-nomas, �, and sarcomas, ‘ Error bars represent the standard
error of the average spectra for the 10 animals.
�m and 32.1 � 3.81 �m for the carcinomas and sarco-
mas, respectively. The estimated AAC values were 16.4� 17.1 dB (mm–3) and 36.4 � 11.9 dB (mm–3) for thecarcinomas and sarcomas, respectively. Statistically sig-nificant differences were observed using both the ASDand AAC estimates between the carcinomas and sarco-mas with the new analysis bandwidth. The feature anal-ysis plot (Fig. 8) using the new analysis bandwidthreveals a separation between the carcinoma and sarcomaestimates.
DISCUSSION
Two animal models for cancer were examined usingQUS and optical microscopy. The QUS analysis wasbased on the spherical Gaussian model to parameterizethe backscattered power spectra from tumors and esti-mate scatterer properties. The goals of this QUS analysiswere to: (1) develop a system-independent technique forquantifying tissue, (2) relate the scatterer property esti-mates to underlying tissue microstructure, and (3) distin-guish between different kinds of tumors based on thequantified information (scatterer properties). Because ofthe procedures for normalizing the backscattered powerspectra, the QUS technique can be considered system-independent.
Examination of the optical photomicrographs of thetumors suggested that the cells were the structures insidethe tumors most likely responsible for the measuredbackscatter. In the case of the carcinomas, the cells wereuniform in size and shape and distributed as solid sheetsof cells throughout the tumor. In the case of the sarco-mas, the cells were uniform in size and shape but ar-ranged in groups of cells distributed at random in theextracellular matrix throughout the tumor. The differ-ences in the way the cells were distributed in the twotumors suggest that the AAC should be an importantparameter for revealing these differences. However, no
Fig. 8. Feature analysis plot of the AAC vs. the ASD for the 10mouse carcinomas, Œ, and 10 mouse sarcomas, □, using the
analysis bandwidth of 16 to 25 MHz.
Quantitative ultrasound analysis ● M. L. OELZE AND J. F. ZACHARY 1647
statistically significant differences were observed usingQUS with the initial analysis bandwidth of 10 to 25 MHzand the spherical Gaussian model. We hypothesize thatthe failure to detect differences using the initial analysisbandwidth was due to the spherical Gaussian model notbeing sensitive to features of the backscattered powerspectra that could identify these differences.
Further evidence supporting the hypothesis thatcells were responsible for scattering came from exami-nation of pellets of the carcinoma cells grown in culture.No statistically significant differences were observed be-tween ASD estimates from the tumors and cell pellets.The similarity between ASD estimates suggests that cellswere responsible for backscatter from the cell pellets andfrom the carcinoma tumor.
In the analysis of both tumors, a correlation be-tween the ASD and the AAC existed. Examination ofFig. 4 revealed that larger ASD estimates correlated tosmaller AAC estimates. Two possibilities may explainthis correlation. First, if larger scatterers exist in atissue, then fewer of these scatterers can be containedwithin a unit volume. Therefore, larger scatterers leadto smaller estimates of AAC (number density issmaller). Second, if the ASD is overestimated, thenestimates of AAC will be underestimated because theAAC is estimated from the slope parameter of eqn (4),which is a function of the ASD.
The QUS analysis was not successful at distinguish-ing between the carcinomas and sarcomas using thespherical Gaussian model over the analysis bandwidth of10 to 25 MHz. Scatterer property estimates were notsignificantly different between the carcinomas and sar-comas. The two kinds of tumors could be distinguishedfrom the optical photomicrographs but could not bedistinguished from the scatterer property estimates usingthe spherical Gaussian model over the 10 to 25 MHzanalysis bandwidth.
Although QUS is capable of differentiating betweenbenign and malignant cancers (Oelze et al. 2004), thevariance of scatterer property estimates was not smallenough to differentiate between different kinds of ma-lignant cancer (the carcinomas and sarcomas) using thespherical Gaussian model over the initial analysis band-width (10 to 25 MHz). However, F-tests revealed thatsignificant differences existed between the average back-scattered power spectra of the carcinomas and sarcomasover the bandwidth 16 MHz to 25 MHz. The differencessuggest that better scattering models are needed to dis-criminate between the carcinomas and sarcomas over alarge bandwidth or that appropriate frequency ranges foranalysis need to be used with current models.
New ASD and AAC estimates were obtained byusing the spherical Gaussian model over the portion of
the bandwidth of the averaged backscattered power spec-tra, 16 to 25 MHz, where F-tests revealed statisticaldifferences existed between the sarcomas and carcino-mas. Several important results occurred from using theanalysis bandwidth of 16 to 25 MHz over the initialanalysis bandwidth. First, statistically significant differ-ences between the carcinomas and sarcomas were ob-served. The separation between the estimates from thecarcinomas and sarcomas can be observed in the featureanalysis plot of Fig. 8. Second, the standard deviation ofASD estimates was reduced by almost half using the 16to 25 MHz analysis bandwidth. If ASD estimates aremore precise, then ASD estimates will be a better pa-rameter for classifying tissues. Third, the analysis re-vealed that the spherical Gaussian model was adequate todetect the differences from the two kinds of tumors giventhat the appropriate frequency ranges were used. Theresults suggest that care should be taken in choosing anappropriate analysis bandwidth when using a model likethe spherical Gaussian model.
Comparing QUS estimates with the underlyingmorphology did not reveal a one-to-one relationship ofASDs with actual structures. If the hypothesis that cellswere the dominant source of scatter was correct, thanASD estimates should have been nearly identical be-tween the carcinomas and sarcomas. Second, because ofthe abundant extracellular matrix in the sarcomas (lowercell number density), the AAC estimates for sarcomasshould have been less than the AAC estimates for thecarcinomas. The results using the 16 to 25 MHz analysisbandwidth revealed statistically significant differences inASD estimates and yielded AAC estimates for the sar-comas that were much larger than AAC estimates for thecarcinomas. Therefore, either the hypothesis that cellsare the dominant source of scattering is wrong or othereffects not accounted for in the theory exist. The ASDestimates from the cell pellets support the hypothesis thatcells are a dominant source of backscatter in the tumors;therefore, other possible effects not taken into account bythe theory should be examined. Some researchers havesuggested that in tumors with a tightly packed, uniformdistribution of cells, the assumption of a random scatter-ing medium may be violated (Hunt et al. 2002; Tunis etal. 2005). Periodic structures in the tumors, if not takeninto account, will affect the ASD and AAC estimates.More study needs to be conducted to determine theeffects on scatterer property estimates of periodicities inthe scattering medium.
Because F-tests indicated statistical differences overthe frequency ranges of 16 MHz to 25 MHz, the appli-cation of the QUS techniques in clinical situations maybe limited to superficial cancer detection and classifica-tion. To observe microstructural changes at the level ofthe cells and cell growth patterns, high ultrasonic fre-
quencies must be used (�16 MHz in the two cases
1648 Ultrasound in Medicine and Biology Volume 32, Number 11, 2006
examined). For example, the most precise scatterer sizeestimates can be made when ka �1.0 (Insana et al.1990). At 20 MHz in tissue (speed of sound �1540 m/s),QUS is most sensitive to ASD estimates of 24.5 �m(about the size of the cancer cells examined). Due totissue attenuation, examination of deep-seeded tumorswith high-frequency ultrasound (�16 MHz) may not bepossible. However, for superficial cancers (e.g., ocular,thyroid, cervical, prostate, skin and superficial breasttumors) interrogating with higher frequency ultrasoundand QUS techniques is possible.
Acknowledgements—We acknowledge the technical assistance of RitaJ. Miller and James P. Blue, Jr., on this project. The authors recognizethat the pioneering work of the late Dr. Frederic Lizzi has led to thepresent study. This work was supported by NIH F32 CA96419 (toMLO) and by start-up funds provided by the Department of Electricaland Computer Engineering at the University of Illinois at Urbana-Champaign.
REFERENCES
Aslakson CJ, Miller FR. Selective events in the metastatic process definedby analysis of the sequential dissemination of subpopulations of amouse mammary tumor. Cancer Res 1992;52:1399–1405.
Balaji KC, Fair WR, Feleppa EJ, et al. Role of advanced 2 and3-dimensional ultrasound for detecting prostate cancer. J Urol2002;168:2422–2425.
Cotran RS, V Kumar, T Collins Pathologic basis of disease (6th ed)Philadelphia: WB. Saunders Co., 1999.
Drukker K, Giger ML, Horsch K, et al. Computerized lesion detectionon breast ultrasound. Med Phys 2002;29:1438–1446.
Feleppa EJ, Lizzi FL, Coleman DJ, Yaremko MM. Diagnostic spec-trum analysis in ophthalmology: A physical perspective. Ultra-sound Med Biol 1986;12:623–631.
Feleppa EJ, Lizzi FL, Coleman DJ. Ultrasonic analysis for ocular tumorcharacterization and therapy assessment. News Physiol Sci 1988;3:193–197.
Feleppa EJ, Kalisz A, Sokil-Melgar JB, et al. Typing of prostate tissueby ultrasonic spectrum analysis. IEEE Trans Ultrason Ferro FreqCont 1996;43:609–619.
Feleppa EJ, Liu T, Kalisz A, et al. Ultrasonic spectral-parameterimaging of the prostate. Int J Imaging Syst Technol 1997;8:11–25.
Feleppa EJ, Fair WR, Tsai H, et al. Progress in two-dimensional andthree-dimensional ultrasonic tissue-type imaging of the prostatebased on spectrum analysis and nonlinear classifiers. Molec Urol1999;3:303–310.
Garra BS, Insana MF, Sesterhenn IA, et al. Quantitative ultrasonicdetection of parenchymal structural change in diffuse renal disease.Invest Rad 1994;29:134–140.
Hall TJ, Insana MF, Harrison LA, Cox GG. Ultrasonic measurement ofglomerular diameters in normal adult humans Ultrasound Med Biol1996;22:987–997.
Hunt JW, Worthington AE, Xuan A, et al. A model based upon pseudoregular spacing of cells combined with the randomization of the nucleican explain the significant changes in high-frequency ultrasound sig-nals during apoptosis. Ultrasound Med Biol 2002;28:217–226.
Insana MF, Wagner RF, Brown DG, Hall TJ Describing small-scalestructure in random media using pulse-echo ultrasound. J AcoustSoc Am 1990;87:179–192.
Insana MF, Hall TJ. Parametric ultrasound imaging from backscattercoefficient measurements—Image-formation and interpretation.Ultrasonic Imag 1990;12:245–267.
Insana MF, Hall TJ, Fishback JL. Identifying acoustic scatteringsources in normal renal parenchyma from the anisotropy in acoustic
properties. Ultrasound Med Biol 1991;17:613–626.Insana MF, Wood JG, Hall TJ. Identifying acoustic scattering sourcesin normal renal parenchyma in vivo by varying arterial and ureteralpressures. Ultrasound Med Biol 1992;18:587–599.
Insana MF, Brown DG. Acoustic scattering theory applied to soft biolog-ical tissues. In: Shung KK, Thieme GA, eds. Ultrasonic scattering inbiological tissues. Boca Raton, FL: CRC Press, 1993:75–124.
Ishimaru A. Wave propagation and scattering in random media. NewYork: Academic Press, 1978:331–334.
Kleinman HK, McGarvey ML, Hassell JR, et al. Basement membranecomplexes with biological activity. Biochemistry 1986;25:312–318.
Lizzi FL, Greenebaum M, Feleppa EJ, Elbaum M, Coleman DJ. The-oretical framework for spectrum analysis in ultrasonic tissue char-acterization. J Acoust Soc Am 1983;73:1366–1373.
Lizzi FL, Ostromogilsky M, Feleppa EJ, Rorke MC, Yaremko MM.Relationship Of ultrasonic spectral parameters to features of tissuemicrostructure. IEEE Trans Ultrason Ferro Freq Cont 1987;34:319–329.
Lizzi FL, Astor M, Liu T, et al. Ultrasonic spectrum analysis for tissueassays and therapy evaluation. Int J Imaging Syst Technol 1997a;8:3–10.
Lizzi FL, Feleppa EJ, Astor M, Kalisz. Statistics of ultrasonic spectralparameters for prostate and liver examinations. IEEE Trans Ultra-son Ferro Freq Cont 1997b;44:935–942.
Miller JG, Perez JE, Mottley JG, et al. Myocardial tissue characteriza-tion: An approach based on quantitative backscatter and attenua-tion. Ultrasonics Symp Proc 1983;2:782–793.
Morse PM, Ingard KU. Theoretical acoustics. New York: McGraw-Hill, 1968.
Nassiri DK, Hill CR. The use of angular scattering measurements toestimate structural parameters of human and animal tissues. JAcoust Soc Am 1986;79:2048–2054.
Nicholas D. Evaluation of backscattering coefficients for excised hu-man tissues: Results interpretation, and associated measurements.Ultrasound Med Biol 1982;8:17–28.
Oelze ML, O’Brien WD Jr. Frequency-dependent attenuation-compen-sation functions for ultrasonic signals backscattered from randommedia. J Acous Soc Am 2002;111:2308–2319.
Oelze ML, Zachary JF, O’Brien WD Jr. Characterization of tissuemicrostructure using ultrasonic backscatter: Theory and techniqueoptimization using a Gaussian form factor. J Acoust Soc Am2002;112:1202–1211.
Oelze ML, Zachary JF, O’Brien WD Jr. Differentiation and characteriza-tion of mammary fibroadenomas and 4T1 Carcinomas using ultra-sound parametric imaging. IEEE Trans Med Imag 2004;23:764–771.
Pulaski BA, Ostrand-Rosenberg S. Reduction of established spontane-ous mammary carcinoma metastases following immunotherapywith major histocompatibility complex class II and B7.1 cell-basedtumor vaccines. Cancer Res 1998;58:1486–1493.
Pulaski BA, Terman DS, Kahn S, Muller E, Ostrand-Rosenberg S.Cooperativity of Staphylococcal aureus enterotoxin B superanti-gen, major histocompatibility complex class H, and CD80 forimmunotherapy of advanced spontaneous metastases in a clinicallyrelevant postoperative mouse breast cancer model. Cancer Res2000;60:2710–2715.
Silverman RH, Rondeau MJ, Lizzi FL, Coleman DJ. Three-dimen-sional high-frequency ultrasonic parameter imaging of anteriorsegment pathology. Ophthalmology 1995;102:837–843.
Silverman RH, Folberg R, Boldt HC, et al. Correlation of ultrasoundparameter imaging with microcirculatory patterns in uveal melano-mas. Ultrasound Med Biol 1997;23:573–581.
Stavros AT, Thickman D, Rapp CL, et al. Solid breast nodules: Use ofsonography to distinguish between benign and malignant lesions.Radiology 1995;196:123–134.
Timpl R, Rohde H, Robey PG, et al. Laminin—A glycoprotein frombasement membranes. J Biol Chem 1979;254:9933–9937.
Tunis AS, Czarnota GJ, Giles A, et al. Monitoring structural changes incells with high-frequency ultrasound signal statistics. Ultrasound
Med Biol 2005;31:1041–1049.![Persistent Scatterer InSAR - Indico [Home]indico.ictp.it/event/a12203/session/4/contribution/3/material/0/0.pdf · Persistent Scatterer InSAR Synthetic Aperture Radar: A Global Solution](https://static.fdocuments.net/doc/165x107/5ab661e77f8b9ab7638d9cd0/persistent-scatterer-insar-indico-home-scatterer-insar-synthetic-aperture-radar.jpg)