Origin of the vast height difference between the African ...
27
Origin of the vast height difference between the African and Pacific 1 LLSVPs 2 Qian Yuan 1* , Mingming Li 1 3 1 Arizona State University, School of Earth and Space Exploration, PO Box 876004, Tempe, 4 AZ85287-6004, USA 5 Correspondence: [email protected] 6 7 Abstract 8 Seismic observations have revealed two Large Low Shear Velocity Provinces (LLSVPs) beneath 9 Africa and the Pacific Ocean in the lowermost mantle 1–4 . However, the detailed morphology and 10 stability of the LLSVPs and their interaction with the surrounding mantle remain unclear. Here 11 we show that, whereas the maximum height of the Pacific LLSVP is ~500 – 700 km, the African 12 LLSVP reaches a height of ~1,500 – 1,800 km from the core-mantle boundary. With numerical 13 modeling experiments, we find that the height of the Pacific LLSVP can be reconciled by a wide 14 range of the LLSVP density and surrounding mantle viscosity. However, the large height of the 15 African LLSVP indicates that it may be less dense and thus less stable than the Pacific LLSVP. 16 17 Main Text 18 Understanding the density and viscosity structure of the Earth’s deep mantle remains one 19 of the most challenging and important tasks in solid Earth sciences. Seismic observations have 20 revealed two large low shear velocity provinces (LLSVPs) in the lowermost mantle beneath 21 Africa and the Pacific Ocean 1–4 . The morphology of the LLSVPs is controlled by the nature of 22 mantle convection, which is in turn controlled by, and thus provides important information on, 23 the density and viscosity structure of the deep mantle 5–7 . 24 The morphology of the LLSVPs has been investigated through seismic observations 8–12 , 25 which have shown that the height of the LLSVPs varies from place to place. However, the 26 maximum height of the two LLSVPs reach remains unclear 8,10 . Here, we used a novel approach 27 to estimate the maximum height of the LLSVPs. For each global seismic shear wave tomography 28 model, we calculated the average as a function of depth in vertical cross-sections that cut 29
Transcript of Origin of the vast height difference between the African ...

Origin of the vast height difference between the African and Pacific 1
LLSVPs 2
Qian Yuan1*
, Mingming Li1 3
1 Arizona State University, School of Earth and Space Exploration, PO Box 876004, Tempe, 4
AZ85287-6004, USA 5
Correspondence: [email protected] 6
7
Abstract 8
Seismic observations have revealed two Large Low Shear Velocity Provinces (LLSVPs) beneath 9
Africa and the Pacific Ocean in the lowermost mantle1–4
. However, the detailed morphology and 10
stability of the LLSVPs and their interaction with the surrounding mantle remain unclear. Here 11
we show that, whereas the maximum height of the Pacific LLSVP is ~500 – 700 km, the African 12
LLSVP reaches a height of ~1,500 – 1,800 km from the core-mantle boundary. With numerical 13
modeling experiments, we find that the height of the Pacific LLSVP can be reconciled by a wide 14
range of the LLSVP density and surrounding mantle viscosity. However, the large height of the 15
African LLSVP indicates that it may be less dense and thus less stable than the Pacific LLSVP. 16
17
Main Text 18
Understanding the density and viscosity structure of the Earth’s deep mantle remains one 19
of the most challenging and important tasks in solid Earth sciences. Seismic observations have 20
revealed two large low shear velocity provinces (LLSVPs) in the lowermost mantle beneath 21
Africa and the Pacific Ocean1–4
. The morphology of the LLSVPs is controlled by the nature of 22
mantle convection, which is in turn controlled by, and thus provides important information on, 23
the density and viscosity structure of the deep mantle5–7
. 24
The morphology of the LLSVPs has been investigated through seismic observations8–12
, 25
which have shown that the height of the LLSVPs varies from place to place. However, the 26
maximum height of the two LLSVPs reach remains unclear8,10
. Here, we used a novel approach 27
to estimate the maximum height of the LLSVPs. For each global seismic shear wave tomography 28
model, we calculated the average 𝑑𝑉𝑠 as a function of depth in vertical cross-sections that cut 29

through the LLSVP regions (e.g., Fig. 1a). We computed this depth-𝑑𝑉𝑠 profile for 17 global 30
tomography models (see Extended Data Fig. 1 for references) and calculated their average (Fig. 31
1b-1c). It is found that the 𝑑𝑉𝑠 is the most negative near the core-mantle boundary (CMB) and 32
increases linearly with radius (Figs. 1b-1c) until a turning point (e.g., gray regions in Figs. 1b-1c) 33
where the rate of increase changes significantly. The increase of the average 𝑑𝑉𝑠 with radius 34
below the turning point may be caused by that the LLSVPs have wider base and narrower top. 35
The turning point may therefore mark the transition from depths with LLSVPs to depths without 36
LLSVPs and is thus defined as the maximum height of the LLSVPs. If there are two or more 37
turning points, as is the case for the African_Bb curve in Fig. 1c, the one with 𝑑𝑉𝑠 value closest 38
to zero is adopted. We examined 31 vertical cross-sections through the LLSVPs (Extended Data 39
Figs. 1-3) and found 4 of them with the maximum height of the LLSVPs. With this approach, the 40
maximum height estimated is ~500 – 700 km for the Pacific LLSVP, and ~1,500 to 1,800 km for 41
the African LLSVP (Figs. 1b-c). 42
The question is what causes the large height difference between the two LLSVPs. The 43
LLSVPs have been hypothesized to be caused by compositionally-distinct materials that are 44
intrinsically denser than the surrounding mantle13–16
. Previous numerical modeling and 45
laboratory experiments have shown that the height of a thermochemical pile is greatly controlled 46
by its density and viscosity compared to the surrounding mantle5,14,17–20
. However, it remains 47
unclear through what mechanism these properties control the height of a pile, and how to explain 48
the vast height difference between the two LLSVPs. 49
Here, we perform systematic numerical calculations to quantify the relationship between 50
the height of thermochemical piles and the density and viscosity structure of the mantle. The 51
conservation equations of mass, momentum and energy were solved under the Boussinesq 52
approximation with the Citcom code in a 2D Cartesian geometry21
. Most models have an aspect 53
ratio of 1:1, with 256×256 elements. Our models contain 2 compositional components: the pile 54
material and the background mantle material. The intrinsic density anomaly of the pile materials 55
is non-dimensionalized as the buoyancy number, which is defined as 𝐵 = Δ𝜌/𝜌𝛼Δ𝑇 , where 56
Δ𝜌/𝜌 is the intrinsic density anomaly of the pile material compared to the background mantle, 𝛼 57
is thermal expansivity and Δ𝑇 is reference temperature. Non-dimensional Rayleigh number (Ra) 58
is defined as 𝑎 = (𝜌0𝑔𝑎0Δ𝑇ℎ3)/(𝜂0𝜅0), where 𝜌0, 𝑔, 𝛼0, 𝜂0 and 𝜅0 are the background mantle 59
reference density, the gravitational acceleration, the reference thermal expansivity, the reference 60

viscosity, and the reference thermal diffusivity, respectively, and ℎ is the thickness of the mantle. 61
The reference values are listed in Extended Data Table 1. The viscosity depends only on 62
composition for most models, but models with additional temperature dependence of viscosity 63
have also been performed. We employ a model input Rayleigh number of Ra = 1 × 10⁶ for all 64
cases, but mantle viscosity is varied case by case which leads to a wide range of effective 65
Rayleigh number and vigor of convection. 66
Shortly after the initial condition, the pile materials are pushed by cold downwellings into 67
a thermochemical pile and we focus on the maximum height that a pile can reach (Fig. 2). The 68
height of the thermochemical pile refers to the vertical distance from the bottom of the model to 69
depths where the lateral extent of the pile falls below 5% width of the base of the pile. The 70
average height is calculated for each calculation when the model reached statistically steady-state. 71
Additional details about model setup are in the Materials and Methods. Supplementary Data 1 72
lists the parameters for all models used in this study. 73
We define a reference case which has a buoyancy number of 0.8 and a viscosity of 74
2×10²⁰
Pa s for the pile materials that initially occupy the lowermost 7% of the model domain. 75
The background mantle viscosity for the reference case is 21022
Pa s. We first explored the 76
effect of initial volume of pile materials on the height of pile. The snapshots of three different 77
models are shown in Fig. 2, in which the intrinsically dense pile materials occupy the lowermost 78
4% (Fig. 2a-2d), 7% (Fig. 2b-2e) and 11% (Fig. 2c-2f) of the model domain, respectively, for 79
each model, whereas other parameters are the same as in the reference case. Interestingly, the 80
thermochemical piles in all 3 models reach similar maximum heights (Figs. 2d-2f). Fig. 3A 81
compares the pile height for 9 cases in which the initial pile volume ranges from 3% to 11% of 82
the model domain. We find that the pile height is not significantly affected by the volume of pile 83
materials. Adding more pile material to the model domain only increases the lateral extent of the 84
pile rather than its vertical elevation (Fig. 2d-2f). We do not consider cases in which the pile 85
material occupies more than 11% of the model domain, because then the pile material forms a 86
global layer which is different from the LLSVPs that are spatially isolated structures. In models 87
where the initial volume of pile material is less than 3% of the model domain, the pile becomes 88
very unstable and is quickly entrained into the ambient mantle, even after we double the model 89
resolution. 90

We investigated the impact of buoyancy number 𝐵 on the pile height. We find that when 91
𝐵 is smaller than 0.45 the pile material becomes unstable and is mixed into the background 92
mantle quickly, and when 𝐵 is larger than 1.25, the pile material forms a stable, global layer at 93
the bottom. Three snapshots of three cases with buoyancy number 0.5, 0.7 and 1.1 are shown in 94
Figs. 2g-2i. As expected, the pile height decreases accordingly with increasing buoyancy number. 95
Fig. 3B shows the pile height for 16 cases with B ranging from 0.5 to 1.25 while other 96
parameters are kept the same as in the reference case. We find that the decrease of pile height 97
with increasing buoyancy number can be described by ℎ’ (0.137 0.013) B
, where ℎ ’ 98
is the non-dimensional height normalized by mantle thickness, or ℎ (394 37) B
, 99
with h the dimensional height. 100
We investigated the influence of background mantle viscosity, 𝜂𝑏𝑔, on the height of the 101
pile. We gradually increased the mantle viscosity from 21022
Pa s to 51023
Pa s in 26 models, 102
while other parameters are kept the same as in the reference case. The lower row in Figs. 2j-2l 103
shows snapshots of three cases with 𝜂𝑏𝑔 = 11023
, 21023
, and 41023
Pa s, respectively. Clearly, 104
the pile height increases moderately with increasing background mantle viscosity. In Fig. 3c, the 105
results of 26 cases also show that the height of the pile increases with 𝜂𝑏𝑔 . The pile height 106
increases more rapidly from ~400 km to ~750 km in the 𝜂𝑏𝑔 interval between 11022
Pa s and 107
101022
Pa s. However, the increase of pile height with 𝜂𝑏𝑔 becomes slower when 𝜂𝑏𝑔 is larger 108
than ~101022
Pa s. The increases of pile height with 𝜂𝑏𝑔 as shown in Fig. 3c is best fitted by a 109
power law ℎ’ (0.175 0.024) 𝜂𝑏𝑔′ 0.25±0.04
, where 𝜂𝑏𝑔′ is the viscosity normalized by reference 110
viscosity of 21022
Pa s, or ℎ (503 70)𝜂𝑏𝑔0.25±0.04, with ℎ and 𝜂𝑏𝑔 the dimensional height and 111
viscosity, respectively. 112
We also explored how the viscosity of pile material affects pile height. We vary pile 113
viscosity from 1.41019
Pa s to 21025
Pa s for 32 cases with the background mantle viscosity 114
fixed at 21022
Pa s, and other parameters the same as in the reference case. We found that the 115
height of the piles is ~500 km for most cases while the height increases moderately (<150 km) if 116
the pile viscosity is at least hundreds of times higher than ambient mantle. Hence, the pile 117
viscosity is not a main factor controlling pile height (Fig. 3d). 118
The results shown and discussed above demonstrate that the height of a stable 119
thermochemical pile is mainly controlled by two factors: the background mantle viscosity and 120

the buoyancy number of the pile material. We next investigated the pile height for different 121
combinations of these two parameters. We systematically vary the buoyancy number from 0.4 to 122
1.25, and the background mantle viscosity from 21022
Pa s to 5 1023
Pa s. A total number of 123
450 models (defined here as individual models) were run for all combinations of the two 124
parameters with the above ranges (Supplementary Data 1). 125
To avoid the influence of the minor mantle temperature differences between models on 126
our results, we also performed a reference case and allowed the temperature field to reach quasi-127
steady state. We then restarted the case but changed the buoyancy number and the background 128
mantle viscosity. This gives us a second group of 450 models (defined here as re-run models; 129
Supplementary Data 1). We compute pile height when it reaches a new quasi-steady state, but 130
before there is any noticeable temperature changes (>95% similarity) in the mantle. This 131
approach thus allows all the calculations to have nearly the same temperature-controlled part of 132
the buoyancy fields and effective Rayleigh number. 133
Fig. 4 shows pile height as a function of buoyancy number and background mantle 134
viscosity for the 450 re-run models, whose results are nearly the same as the individual models 135
(Extended Data Fig. 4). The white stars (green triangles) mark the height of the pile at 500-700 136
km (1500-1800 km), corresponding to the maximum height of the Pacific LLSVP (African 137
LLSVP). We found that the height of the Pacific LLSVP can be explained by a very wide range 138
of background mantle viscosity and pile buoyancy number, and there is a clear trade-off between 139
the two parameters. However, the height of the African LLSVP can only be explained by a pile 140
buoyancy number in a narrow range of 0.45-0.50. In addition, for a pile buoyancy number of 141
0.50, the background mantle viscosity required to explain the height of the African LLSVP is 142
more than 31023
Pa s, which is unrealistically high22,23
. Even if the pile buoyancy number is 143
0.45, the background mantle viscosity needs to be larger than 1.21023
Pa s, which is near at the 144
maximum estimations of lower mantle viscosity22,23
. The thermochemical pile can become taller 145
as its buoyancy number further decreases; however, for a pile buoyancy number lower than 0.45, 146
the pile becomes unstable (gray inverse triangles in Fig. 4), with more than half of its volume 147
mixed into the background mantle after ~4.6 Gyr. This occurs even when the pile viscosity is 148
more than several hundred times higher than the background mantle. 149
In summary, given the assumption that the LLSVPs are caused by thermochemical piles, 150
Fig. 4 shows that, for the same background mantle viscosity, the African LLSVP needs to be at 151

least 0.5% intrinsically lighter than the Pacific LLSVP. The 1,500-1,800 km height of the 152
African LLSVP cannot not be explained solely by increasing the background mantle viscosity 153
but requires a relatively low pile buoyancy number, but a low buoyancy number also makes the 154
pile unstable. 155
We also performed cases with an aspect ratio of 6:1 for the model domain and found that 156
it only leads to minor changes of pile height (Extended Data Fig. 5). Cases with temperature 157
dependence of viscosity are also performed (Supplementary Data 1). In these cases, the 158
background mantle viscosity generally increases with the distance from the thermochemical piles 159
due to the decrease of temperature, and therefore, including temperature-dependent viscosity 160
reduces the height of piles. Interestingly, we find that for a case with temperature-dependent 161
viscosity to have similar pile height as a case with the same parameters but without temperature-162
dependence of viscosity, the average background mantle viscosity in regions within ~50 km from 163
the edges of thermochemical piles needs to be similar (Extended Data Fig. 6), indicating that the 164
viscosity in regions close to the pile edges plays a controlling role for the pile height, which is 165
consistent with previous laboratory experiments20,25,26
. As the degree of temperature-dependence 166
of viscosity increases, the viscosity at the pile margins decreases, and pile height is further 167
reduced (Extended Data Fig. 6). Therefore, it is even more difficult for a pile to reach the height 168
of African LLSVP when temperature-dependence of viscosity is considered. We here 169
intentionally used the simplest 2D Cartesian models to identify the most important parameters 170
that control the height of piles. More complexities such as 3D spherical geometry, phase 171
transition at 660 km, subduction history, and long wavelength convection would likely affect the 172
pile height, but it is unclear how they could cause the large (~1,000 km) height difference 173
between the two LLSVPs because they likely affect the heights of two thermochemical piles of 174
the Earth in the same way. 175
One idea is that the seismically-observed LLSVPs may contain an upper layer of thermal 176
mantle plumes or basaltic material27
with thickness comparable to or larger than the basal 177
thermochemical layer. In these scenarios, the maximum height of the LLSVPs we measured in 178
Fig. 1 is larger than the maximum height of the thermochemical piles. However, mantle plumes 179
or basaltic materials should occur on both LLSVPs, and this possibility still does not explain the 180
difference in height for the two LLSVPs. In addition, the seismic observations by28
provide 181

evidence that the thermochemical section of the African LLSVP reaches more than 1,500 km 182
above the CMB, which poses questions about this possibility. 183
It was proposed by Tan and Gurnis (2005)7 that if the pile material has larger bulk 184
modulus or is less compressible than the background mantle, metastable piles will form with 185
steep edges. However, the height of the piles in the metastable models of Tan and Gurnis (2005)7 186
is mostly less than ~1,000 km, much lower than the maximum height of the African LLSVP 187
which is ~1,500-1,800 km (Fig. 1). One of their metastable cases has height above ~1500 km, 188
but it requires a very large bulk modulus of pile material (8% higher than ambient mantle). We 189
also performed a series of calculations in which the buoyancy number of pile material decreases 190
with depth with similar parameterization to (7), and we find the pile can have a height similar to 191
African LLSVP but only when the pile buoyancy number is relatively small to make it unstable 192
(Extended Data Fig. 7). Nevertheless, this scenario does not explain the different height of the 193
two LLSVPs, unless they have different compositions and bulk moduli. Importantly, a recent 194
study of LLSVP density using Earth's tides found a higher density for the bottom two-thirds of 195
the LLSVPs 29
, in contrast to the assumption of Tan and Gurnis (2005)7 in which the intrinsic 196
density of piles decreases with depth. 197
Laboratory experiments by Davaille (1999)5 found that for a narrow range of pile 198
buoyancy number (~0.15-0.35), thermochemical piles that are ~10-10,000 times more viscous 199
than the background mantle oscillate between phases of growth and collapse, which may explain 200
different heights of the two LLSVPs if they are in different phases of oscillation. However, in 201
their experiments the pile materials cover more than half the depth of the tank, and a continuous 202
global layer is always covering the bottom of the tank during the oscillatory processes, which is 203
different from the two LLSVPs being spatially isolated. It remains unclear if such an oscillatory 204
mode will still occur if the volume of pile materials is only several volume percent of the mantle8. 205
The oscillating behavior of piles in this model means that they are not stable structures. 206
For a viscosity in the lower mantle of ~11023
Pa s23
, our experiments clearly show the 207
large height of the African LLSVP requires it to have low intrinsic density anomaly to make the 208
LLSVP unstable (Fig. 4). This is consistent with the studies by Tan and Gurnis (2005)7 and 209
Davaille (1999)5 which hinted that the African LLSVP is not stable. Our results (Fig. 4) show 210
that the African LLSVP may be in a more stable regime if the background viscosity is much 211
higher, but even though, the African LLSVP may be currently less intrinsically dense than the 212

Pacific LLSVP. If the two LLSVPs were originally made of the same primordial materials, their 213
density difference may be caused by long-term dynamic interactions with the surrounding mantle 214
which may entrain different amounts of background mantle materials and subducted materials 215
(which may have different intrinsic densities) into the LLSVPs. This is corroborated by a most 216
recent study of systematic radiogenic isotopes (lead, neodymium and strontium) on plume-217
induced basalts above the two LLSVPs, showing the African LLSVP is enriched by subducted 218
upper continental materials (less dense) during Pangaea supercontinent cycle but no such feature 219
in the Pacific LLSVP30
. 220
221
Main References 222
1. Garnero, E. J., McNamara, A. K. & Shim, S. H. Continent-sized anomalous zones with 223
low seismic velocity at the base of Earth’s mantle. Nat. Geosci. 9, 481–489 (2016). 224
2. Grand, S. P. Mantle shear-wave tomography and the fate of subducted slabs. Philos. Trans. 225
R. Soc. A Math. Phys. Eng. Sci. 360, 2475–2491 (2002). 226
3. Li, X. & Romanowicz, B. Global mantle shear velocity model developed using nonlinear 227
asymptotic coupling theory and Barbara. J. Geophys. Res. Solid Earth 101, 22245– 22272 228
(1996). 229
4. Ritsema, J., Heijst, H. J. Van & Woodhouse, J. H. Global transition zone tomography. J. 230
Geophys. Res. 109, B02302 (2004). 231
5. Davaille, A. Simultaneous generation of hotspots and superwells by convetion in a 232
heterogeneous planetary mantle. Nature 402, 756–760 (1999). 233
6. Li, M., Zhong, S. & Olson, P. Linking lowermost mantle structure, core-mantle boundary 234
heat flux and mantle plume formation. Phys. Earth Planet. Inter. 277, 10–29 (2018). 235
7. Tan, E. & Gurnis, M. Metastable superplumes and mantle compressibility. Geophys. Res. 236
Lett. 32, 1–4 (2005). 237
8. Cottaar, S. & Lekic, V. Morphology of seismically slow lower-mantle structures. Geophys. 238
J. Int. 207, 1122–1136 (2016). 239
9. He, Y. & Wen, L. Structural features and shear-velocity structure of the ‘Pacific 240
Anomaly’. J. Geophys. Res. Solid Earth 114, 1–17 (2009). 241
10. Lekic, V., Cottaar, S., Dziewonski, A. & Romanowicz, B. Cluster analysis of global lower 242
mantle tomography : A new class of structure and implications for chemical heterogeneity. 243

Earth Planet. Sci. Lett. 357–358, 68–77 (2012). 244
11. Ni, S. & Helmberger, D. V. Ridge-like lower mantle structure beneath South Africa. J. 245
Geophys. Res. 108, 2094 (2003). 246
12. Wang, Y. & Wen, L. Geometry and P and S velocity structure of the ‘African Anomaly’. J. 247
Geophys. Res. Solid Earth 112, 1–26 (2007). 248
13. Li, M. & Zhong, S. The source location of mantle plumes from 3D spherical models of 249
mantle convection. Earth Planet. Sci. Lett. 478, 47–57 (2017). 250
14. Tackley, P. J. Three-Dimensional Simulations of Mantle Convection with a Thermo-251
Chemical Basal Boundary Layer : D ”? AGU Geophys. Mongraph C. ed. M. Gurnis 1–18 252
(1998). 253
15. McNamara, A. K. & Zhong, S. Thermochemical structures beneath Africa and the Pacific 254
Ocean. Nature 437, 1136–1139 (2005). 255
16. Zhang, N., Zhong, S., Leng, W. & Li, Z. X. A model for the evolution of the Earth’s 256
mantle structure since the Early Paleozoic. J. Geophys. Res. Solid Earth 115, 1–22 (2010). 257
17. Davaille, A., Bars, M. Le & Carbonne, C. Thermal convection in a heterogeneous mantle 258
Convection thermique dans un manteau hétérogène. Comptes Rendus Geosci. 335, 141–259
156 (2003). 260
18. Jellinek, A. M. & Manga, M. Links between long-lived hot spots, mantle plumes, D″, and 261
plate tectonics. Rev. Geophys. 42, 1–35 (2004). 262
19. Kumagai, I., Davaille, A. & Kurita, K. On the fate of thermally buoyant mantle plumes at 263
density interfaces. Earth Planet. Sci. Lett. 254, 180–193 (2007). 264
20. Le Bars, M. & Davaille, A. Whole layer convection in a heterogeneous planetary mantle. 265
J. Geophys. Res. 109, 1–23 (2004). 266
21. Solomatov, V. S. & Moresi, L. N. Numerical Investigation of 2d Convection with 267
Extremely Large Viscosity Variations. Phys. Fluids 7, 2154–2162 (1995). 268
22. Mitrovica, J. X. & Forte, A. M. A new inference of mantle viscosity based upon joint 269
inversion of convection and glacial isostatic adjustment data. 225, 177–189 (2004). 270
23. Steinberger, B. & Calderwood, A. R. Models of large-scale viscous flow in the Earth’s 271
mantle with constraints from mineral physics and surface observations. Geophys. J. Int. 272
167, 1461–1481 (2006). 273
24. Seton, M. et al. Global continental and ocean basin reconstructions since 200Ma. Earth-274

Science Rev. 113, 212–270 (2012). 275
25. Davaille, A. & Jaupart, C. Transient High-Rayleigh-Number Thermal Convection With 276
Large Viscosity Variations. J. Fluid Mech. 253, 141–166 (1993). 277
26. Le Bars, M. & Davaille, A. Large interface deformation in two-layer thermal convection 278
of miscible viscous fluids. J. Fluid Mech. 499, 75–110 (2004). 279
27. Ballmer, M. D., Schumacher, L., Lekic, V., Thomas, C. & Ito, G. Geochemistry, 280
Geophysics, Geosystems. Geochemistry, Geophys. Geosystems 17, 4517–4533 (2016). 281
28. Simmons, N. A., Forte, A. M. & Grand, S. P. Thermochemical structure and dynamics of 282
the African superplume. Geophys. Res. Lett. 34, 1–5 (2007). 283
29. Lau, H. C. P. et al. Tidal tomography constrains Earth’s deep-mantle buoyancy. Nature 284
551, 321–326 (2017). 285
30. Doucet, L. S. et al. Distinct formation history for deep-mantle domains reflected in 286
geochemical differences. Nat. Geosci. 13, (2020). 287
31. Ritsema, J., Deuss, A., Van Heijst, H. J. & Woodhouse, J. H. S40RTS: A degree-40 shear-288
velocity model for the mantle from new Rayleigh wave dispersion, teleseismic traveltime 289
and normal-mode splitting function measurements. Geophys. J. Int. 184, 1223–1236 290
(2011). 291
32. Farrell, K. A. O. & Lowman, J. P. Emulating the thermal structure of spherical shell 292
convection in plane-layer geometry mantle convection models. Phys. Earth Planet. Inter. 293
182, 73–84 (2010). 294
33. Tackley, P. J. & King, S. D. Testing the tracer ratio method for modeling active 295
compositional fields in mantle convection simulations. Geochemistry, Geophys. 296
Geosystems 4, 1–15 (2003). 297
34. Hosseini, K. et al. SubMachine: Web-Based Tools for Exploring Seismic Tomography 298
and Other Models of Earth’s Deep Interior. Geochemistry, Geophys. Geosystems 19, 299
1464–1483 (2018). 300
35. Simmons, N. A., Forte, A. M., Boschi, L. & Grand, S. P. GyPSuM: A joint tomographic 301
model of mantle density and seismic wave speeds. J. Geophys. Res. Solid Earth 115, 1–24 302
(2010). 303
36. Houser, C., Masters, G., Shearer, P. & Laske, G. Shear and compressional velocity models 304
of the mantle from cluster analysis of long-period waveforms. Geophys. J. Int. 174, 195–305

212 (2008). 306
37. Montelli, R., Nolet, G., Dahlen, F. A. & Masters, G. A catalogue of deep mantle plumes: 307
New results from finitefrequency tomography. Geochemistry, Geophys. Geosystems 7, 308
(2006). 309
38. Koelemeijer, P., Ritsema, J., Deuss, A. & van Heijst, H. J. SP12RTS: A degree-12 model 310
of shear- and compressional-wave velocity for Earth’s mantle. Geophys. J. Int. 204, 1024–311
1039 (2016). 312
39. Tesoniero, A., Auer, L., Boschi, L. & Cammarano, F. Journal of Geophysical Research : 313
Solid Earth Hydration of marginal basins and compositional variations within the 314
continental lithospheric mantle inferred from a new global model of shear and 315
compressional velocity. J. Geophys. Res. 7789–7813 (2015). 316
doi:10.1002/2015JB012026.Received 317
40. Ritsema, J., Van Heijst, H. J. & Woodhouse, J. H. Complex shear wave velocity structure 318
imaged beneath Africa and Iceland. Science (80-. ). 286, 1925–1931 (1999). 319
41. Moulik, P. & Ekström, G. An anisotropic shear velocity model of the Earth’s mantle using 320
normal modes, body waves, surface waves and long-period waveforms. Geophys. J. Int. 321
199, 1713–1738 (2014). 322
42. Auer, L., Boschi, L., Becker, T. W. & Giardini, D. Journal of Geophysical Research : 323
Solid Earth Savani : A variable resolution whole-mantle model of anisotropic shear 324
velocity variations based. 3006–3034 (2014). doi:10.1002/2013JB010773.Received 325
43. Panning, M. P., Lekić, V. & Romanowicz, B. A. Importance of crustal corrections in the 326
development of a new global model of radial anisotropy. J. Geophys. Res. Solid Earth 115, 327
1–18 (2010). 328
44. French, S. W. & Romanowicz, B. A. Whole-mantle radially anisotropic shear velocity 329
structure from spectral-element waveform tomography. Geophys. J. Int. 199, 1303–1327 330
(2014). 331
45. Lekić, V. & Romanowicz, B. Inferring upper-mantle structure by full waveform 332
tomography with the spectral element method. Geophys. J. Int. 185, 799–831 (2011). 333
46. Chang, S. J., Ferreira, A. M. G., Ritsema, J., Van Heijst, H. J. & Woodhouse, J. H. Joint 334
inversion for global isotropic and radially anisotropic mantle structure including crustal 335
thickness perturbations. J. Geophys. Res. Solid Earth 120, 4278–4300 (2015). 336

47. Lu, C. & Grand, S. P. The effect of subducting slabs in global shear wave tomography. 337
Geophys. J. Int. 205, 1074–1085 (2016). 338
48. Durand, S., Debayle, E., Ricard, Y. & Lambotte, S. Seismic evidence for a change in the 339
large-scale tomographic pattern across the D′′ layer. Geophys. Res. Lett. 43, 7928–7936 340
(2016). 341
49. Durand, S., Debayle, E., Ricard, Y., Zaroli, C. & Lambotte, S. Confirmation of a change 342
in the global shear velocity pattern at around 1000km depth. Geophys. J. Int. 211, 1628–343
1639 (2017). 344
345
346
347
348
349
350
351
352
353
354
355
356
357
358
359
360
361
362
363
364
365
366
367

368
369
370
371
372
Figures 373
374
Figure 1 | Depth profiles of the averaged 𝑽𝒔 anomaly at 4 vertical cross-section locations 375
through the LLSVPs. a. the yellow colors highlight 30% of the CMB area at 2800 km depth 376
with the lowest 𝑉𝑠 from the seismic tomography model S40RTS31
. The thick, solid curves mark 377
the locations of vertical cross-section for which the horizontally averaged 𝑉𝑠 anomalies of 17 378

tomography models as a function of depth, or the depth- 𝑉𝑠 profile, are shown in panels b-c. b. 379
the horizontally averaged 𝑉𝑠 anomalies of 17 models as a function of depth for the 4 vertical 380
cross-sections as shown in panel a. c. similar to panel b, but only the negative values of 𝑉𝑠 are 381
used when calculating the horizontal average. 382
383

384
Figure 2 | The effects of volume of pile materials, buoyancy number and mantle viscosity on 385
the height of piles. The first row (a-c) and second row (d-f), respectively, show the snapshots of 386
temperature and compositional fields (red shows pile materials, black shows background mantle 387
materials, and green shows a mixture between the two) for 3 cases with the volume of pile 388

materials occupying 4% (a, d), 7% (b, e) and 12% (c, f) of the model domain. The white dotted 389
lines in (d-f) show the initial height of the pile materials before the calculation starts, and the h 390
shows the height of the pile. g-i, snapshots of the compositional fields for 3 cases in which the 391
buoyancy numbers of pile materials are 0.5 (g), 0.7 (h) and 1.1 (i). j-l, snapshots of viscosity 392
fields for 3 cases in which the background mantle viscosity is 1×10²³
Pa s (j), 2×10²³
Pa s (k), 393
and 4×10²³
Pa s (l). 394
395
396
Figure 3 | The effects of model parameters on the height of piles. Model parameters tested 397
here include the volume percentage of pile materials with respective to the model domain (a), the 398
buoyancy number of pile materials (b), the viscosity of the background mantle materials (c), and 399
the viscosity of the pile materials (d). The blue dots show the average height after the model 400
reaches statistically steady state, with the error bars showing the standard deviation. One model 401
parameter is modified for each case, with the other parameters the same as the reference case 402
which uses a buoyancy number of 0.8 and pile viscosity of 2×10²⁰
Pa s. The controls of pile 403

buoyancy number and viscosity of the background mantle on the pile height are best fitted by the 404
orange dashed curves in panels b and c, respectively, with the dimensional fitting equations 405
included in each panel. 406
407
408
Figure 4 | The height of piles as a function of pile buoyancy number and background 409
mantle viscosity. The height of piles for different combinations of buoyancy number of pile 410
materials and the viscosity of the background mantle. White stars show cases in which the height 411
of piles is 500 – 700 km, and green triangle shows cases in which the pile height is 1,500 – 1,800 412
km. The gray triangles show cases in which the thermochemical piles are not stable. 413
414
Methods 415
Governing equations 416
We perform geodynamic calculations by solving the following non-dimensional equations of 417
conservation of mass, momentum and energy under the Boussinesq approximation: 418
∇ ⋅ u⃗ = 0 (1) 419
−∇𝑃 + ∇ ⋅ (𝜂𝜖) = 𝑅𝑎(𝑇 − 𝐵𝐶)𝑧 (2)

𝜕𝑇
𝜕𝑡+ (𝑢 ⋅ 𝛻)𝑇 = 𝛻2𝑇 + 𝑄 (3)
where �⃗� is the velocity, 𝑃 is the dynamic pressure, 𝜂 is the viscosity, 𝜖 is the strain rate, 𝑅𝑎 is the 420
Rayleigh number, 𝑇 is the temperature, 𝐵 and 𝐶 are the buoyancy number and composition, 421
respectively. 𝑧 is the unit vector in the vertical direction, 𝑡 is the time, 𝑄 is the internal heating 422
rate. 𝛼 and 𝜅 are thermal expansivity and thermal diffusivity, respectively. 423
The advection of the composition C is given by: 424
𝜕𝐶
𝜕𝑡+ (u ⋅ ∇)𝐶 = 0 (4)
Most cases are computed in 2‐ D Cartesian geometry with aspect ratio of 1 with exception for a 425
few models with aspect ratio of 6 cases, which were found to have little difference compared 426
with square geometry. To solve the conservation equations, we use a modified version of the 427
convection code, Citcom21
, that includes thermochemical convection and composition‐428
dependent rheology. We exclude internal heating for all models in this study, which is more 429
appropriate for our 2D Cartesian models32
. The initial temperature is 0.5 everywhere with small 430
perturbations. The top and the bottom surface are isothermal with T=0 and T=1, respectively. All 431
boundaries are free-slip. The side boundaries are reflective and insulating. 432
433
A ratio tracer method33
with eight million tracers was used for the advection of the compositional 434
field. On average, each element has 20 randomly distributed tracers which are advected with 435
mantle flow. Initially, a global layer of pile material was introduced to the lowermost mantle, 436
which was later pushed by cold downwellings into a thermochemical pile to the side boundaries 437
of the model domain. 438
439
Pile materials are consistently entrained up and mixed into the background mantle, affecting the 440
density of the background mantle. We therefore change pile materials into background mantle 441
materials once they are entrained to the upper mantle. Some background mantle materials are 442
mixed into the thermochemical piles as well, but they do not significantly affect the intrinsic 443
density of the piles. For example, the intrinsic density of the thermochemical pile in the reference 444
case changes by less than 0.3% after ~4.6 Gyr. 445

446
The parameters for all cases used in this study are listed in Supplementary Data 1. 447
448
449
Methods References 450
32. Farrell, K. A. O. & Lowman, J. P. Emulating the thermal structure of spherical shell 451
convection in plane-layer geometry mantle convection models. Phys. Earth Planet. Inter. 452
182, 73–84 (2010). 453
33. Tackley, P. J. & King, S. D. Testing the tracer ratio method for modeling active 454
compositional fields in mantle convection simulations. Geochemistry, Geophys. 455
Geosystems 4, 1–15 (2003). 456
457
458
Data Availability 459
All data and parameters are available in the main text or the supplementary materials. 460
461
Code availability 462
Request about the modified 2D Citcom code using in this paper is available from the 463
corresponding author upon request. 464
465
Acknowledgement 466
We are grateful to the extensive discussions with Ed Garnero. We also thank Kasra Hosseini for 467
SubMachine datasets processing and Yongming Wang and Shule Yu for valuable comments. 468
The numerical models are performed on the Agave cluster at Arizona State University. Funding: 469
This work is supported by National Science Foundation grant of EAR-1849949 and EAR-470
1855624. 471
472
Author Contributions 473
Author contributions: M.M.L conceived the project and Q.Y performed all experiments. Both 474
analyzed the data and wrote the manuscript. 475

476
Competing Interests 477
The authors declare no competing interests. 478
479
Additional Information 480
Additional data related to this paper should be sent to Q.Y. 481
482
Extended Data Figure Legends 483
484
Extended Data Figure 1 | Cross-section locations through two LLSVPs used for depth 485
profiles of the averaged Vs anomaly. A1-A10 and B1-B5 are for African LLSVP while C1-C3 486
and D1-D13 performed for Pacific LLSVP. A4, B4 and C1, D6 are the four cross-sections that 487
were found bear the maximum height for African and Pacific LLSVP, respectively. They are 488
respectively named as Aa, Bb and Cc, Dd in the main text. All section data were downloaded 489
from the SubMachine website34
. The 17 global S-wave models are GyPSuM-S35
, HMSL-S0636
, 490
PRI-S0537
, SP12RTS-S38
, SPani-S39
, S20RTS40
, S362ANI+M41
, S40RTS31
, SAVANI42
, 491
SAW642ANb43
, SEMUCB-WM144
, SEMum45
, SGLOBE-rani46
, TX20112, TX2015
47, 492
SEISGLOB148
, SEISGLOB249
. 493
494

495
Extended Data Figure 2 | Depth profiles of the averaged 𝑽𝒔 anomaly at 15 vertical cross-496
section locations through the African LLSVP. a, the horizontally averaged 𝑉𝑠 anomaly as a 497
function of depth for the 10 vertical cross-sections as shown in Extended Data Fig. 1. b, similar 498
to panel a, but only the negative values of 𝑉𝑠 are used when calculating the horizontal average. c, 499
the horizontally averaged 𝑉𝑠 anomaly as a function of depth for the 5 vertical cross-sections as 500
shown in Extended Data Fig. 1. d, similar to panel c, but only the negative values of 𝑉𝑠 are used 501
when calculating the horizontal average. The gray rectangles mark the turning point we defined 502
as the maximum height in main text. 503
504

505
Extended Data Figure 3 | Depth profiles of the averaged 𝑽𝒔 anomaly at 16 vertical cross-506
section locations through the Pacific LLSVP. a, the horizontally averaged 𝑉𝑠 anomaly as a 507
function of depth for the 3 vertical cross-sections as shown in Extended Data Fig. 1. b, similar to 508
panel a, but only the negative values of 𝑉𝑠 are used when calculating the horizontal average. c, 509
the horizontally averaged 𝑉𝑠 anomaly as a function of depth for the 13 vertical cross-sections as 510
shown in Extended Data Fig. 1. d, similar to panel c, but only the negative values of 𝑉𝑠 are used 511
when calculating the horizontal average. The gray rectangles mark the turning point we defined 512
as the maximum height in main text. 513
514

515
Extended Data Figure 4 | Pile height as a function of pile buoyancy number and 516
background mantle viscosity for 450 individual models. 517
518

519
Extended Data Figure 5 | The effect of different geometry on pile height. a and b show the 520
composition and temperature fields respectively for a model of same parameters with the 521
reference case but with aspect ratio of 6. c, Blue solid circles show the height of pile from 522
models with aspect ratio of 1, and orange solid circles show the height of pile from models with 523
aspect ratio of 6. 524
525
526
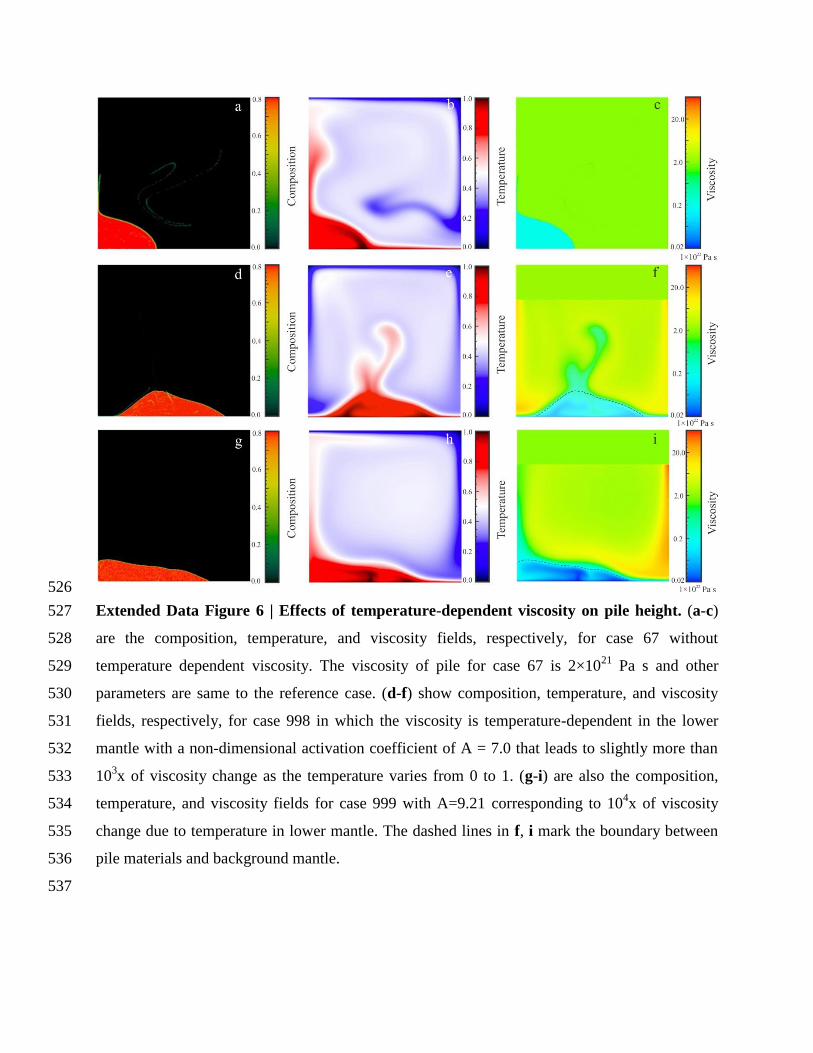
Extended Data Figure 6 | Effects of temperature-dependent viscosity on pile height. (a-c) 527
are the composition, temperature, and viscosity fields, respectively, for case 67 without 528
temperature dependent viscosity. The viscosity of pile for case 67 is 2×10²¹
Pa s and other 529
parameters are same to the reference case. (d-f) show composition, temperature, and viscosity 530
fields, respectively, for case 998 in which the viscosity is temperature-dependent in the lower 531
mantle with a non-dimensional activation coefficient of A = 7.0 that leads to slightly more than 532
103x of viscosity change as the temperature varies from 0 to 1. (g-i) are also the composition, 533
temperature, and viscosity fields for case 999 with A=9.21 corresponding to 104x of viscosity 534
change due to temperature in lower mantle. The dashed lines in f, i mark the boundary between 535
pile materials and background mantle. 536
537

538
Extended Data Figure 7 | Pile height for cases in which the intrinsic density anomaly of pile 539
material decreases with depth. The left (a, d) and middle column (b, e) show the snapshots of 540
temperature and compositional fields, respectively, for 2 cases in which the intrinsic density 541
anomaly of pile materials decreases linearly with depth from 1.38 to 0.23 for the top case (c), and 542
from 0.84 to 0.28 for the bottom case (f), as shown in the right column. A non-dimensional 543
activation coefficient of A = 4.61 is used, like that in (Tan and Gurnis, 2005) (7). The 544
thermochemical pile of the bottom case can temporally reach similar height to African LLSVP, 545
but it is also very unstable. 546
547
548
549
550
551
552
553
554
555

556
Extended Data Table 1 | Physical and model parameters. 557
Parameter Symbol Value
Input Rayleigh number 𝑅𝑎 110
Mantle thickness 𝑅 6371 km
Core-mantle boundary radius 𝑟 3503 km
Mantle thickness ℎ 2868 km
Thermal expansivity 𝛼0 110–5
/K
Thermal diffusivity 𝜅0 110–6
m2/s
Gravitational acceleration 𝑔0 9.8 m/s
2
Temperature difference between
surface and core-mantle boundary Δ𝑇 2500 K
Background mantle
reference density 𝜌0 4000 km/m
3
Reference viscosity 𝜂0 21022
Pa s
558
Supplementary Information 559
Supplementary Data 1. Physical parameters and results for all cases in this study. 560