
Origin Aplng
67
Origin-APLNG Operational Review and Asset Visit David Baldwin, Chief Executive Officer LNG 29 & 30 May 2014
description
Origin Aplng
Transcript of Origin Aplng

Origin-APLNG Operational Review and Asset Visit David Baldwin, Chief Executive Officer LNG
29 & 30 May 2014

Important Notice
Forward looking statements
This presentation contains forward looking statements, including statements of current intention, statements of opinion and predictions as to possible future events. Such statements are not statements of fact and there can be no certainty of outcome in relation to the matters to which the statements relate. These forward looking statements involve known and unknown risks, uncertainties, assumptions and other important factors that could cause the actual outcomes to be materially different from the events or results expressed or implied by such statements. Those risks, uncertainties, assumptions and other important factors are not all within the control of Origin and cannot be predicted by Origin and include changes in circumstances or events that may cause objectives to change as well as risks, circumstances and events specific to the industry, countries and markets in which Origin and its related bodies corporate, joint ventures and associated undertakings operate. They also include general economic conditions, exchange rates, interest rates, the regulatory environment, competitive pressures, selling price, market demand and conditions in the financial markets which may cause objectives to change or may cause outcomes not to be realised.
None of Origin Energy Limited or any of its respective subsidiaries, affiliates and associated companies (or any of their respective officers, employees or agents) (the Relevant Persons) makes any representation, assurance or guarantee as to the accuracy or likelihood of fulfilment of any forward looking statement or any outcomes expressed or implied in any forward looking statements. The forward looking statements in this presentation reflect views held only at the date of this presentation.
Statements about past performance are not necessarily indicative of future performance.
Except as required by applicable law or the ASX Listing Rules, the Relevant Persons disclaim any obligation or undertaking to publicly update any forward looking statements, whether as a result of new information or future events.
No offer of securities
This presentation does not constitute investment advice, or an inducement or recommendation to acquire or dispose of any securities in Origin, in any jurisdiction.
2 |

7.3
4.7
0
500
1,000
1,500
2,000
2,500
1
2
3
4
5
6
7
8
Man
Hou
rs (
x1,0
00)
Reco
rdab
le In
juri
es /
TRI
FR
LNG TRIFR
Total Man Hours LNG TRIFR (Rolling 12 Months)
LNG TRIFR
3 |
Safety is our first priority
Operational Review and Asset Visit
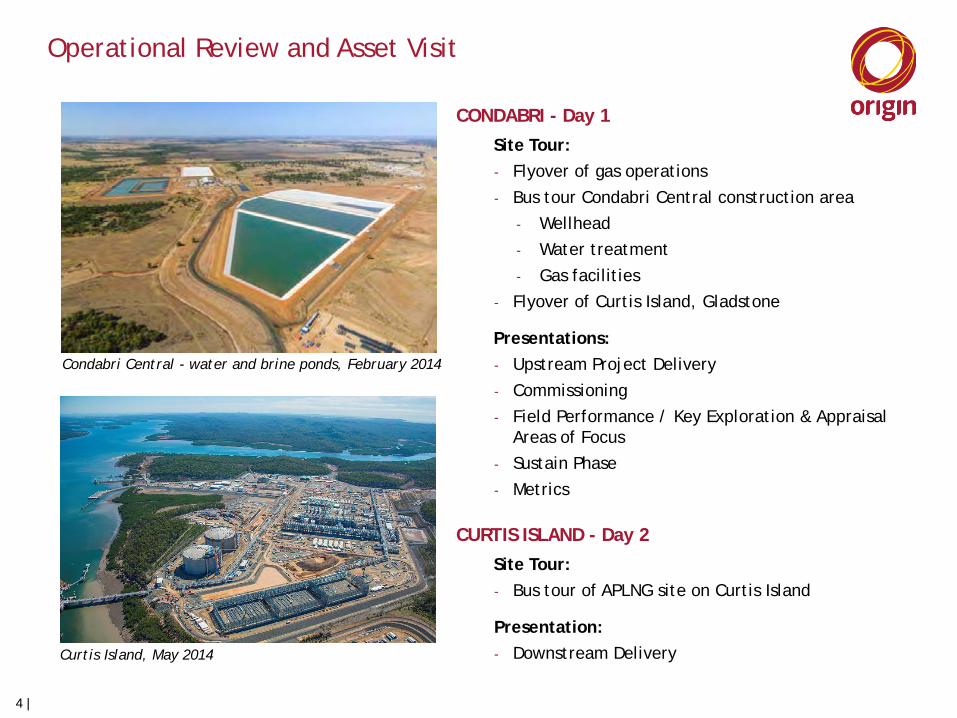
CONDABRI - Day 1 Site Tour: - Flyover of gas operations
- Bus tour Condabri Central construction area
- Wellhead
- Water treatment
- Gas facilities
- Flyover of Curtis Island, Gladstone
Presentations: - Upstream Project Delivery
- Commissioning
- Field Performance / Key Exploration & Appraisal Areas of Focus
- Sustain Phase
- Metrics
CURTIS ISLAND - Day 2 Site Tour: - Bus tour of APLNG site on Curtis Island
Presentation: - Downstream Delivery
4 |
Condabri Central - water and brine ponds, February 2014
Curtis Island, May 2014

Australia Pacific LNG has world leading operators
UPSTREAM – 71% complete • Operated by Origin
• Over 16 years’ CSG production experience in Australia
• Complemented by over 25 years of ConocoPhillips’ CSG experience
DOWNSTREAM – 70% complete • Operated by ConocoPhillips
• Over 40 years’ LNG production experience
• Using ConocoPhillips’ Optimised Cascade® technology licence, Bechtel has delivered 8 LNG trains globally
5 |
Drilling Gathering Gas & water facilities
Electrification Water disposal/ treatment
Pipelines
LNG Plant, Tanks and LNG Terminal

Upstream Project Delivery

-
200
400
600
800
1,000
1,200
1,400
1,600
1,800
2,000
Gas
Pro
duct
ion
Rate
, TJ/
d
demand
7 |
APLNG is progressing in line with budget and is on track for first LNG in mid-2015 …
Production Demand
… with full production from both trains in 2016
• Demand includes domestic contracts, committed ramp gas sales and LNG contracts
• Opportunity exists to use some or all production capacity to deliver or utilise turndown strategies
Mid-2015 2016

Upstream Project Goals
• Health and Safety •Zero Harm 1
• Environment and Land •Honour our Commitments 2
• Safe & Operable Production System •Automation from central control room 3
8 |
• Project within schedule and budget •On track to support LNG trains 4
• Team effectiveness •Operations team ready and Commissioning underway 5

Upstream Project progress - 71% complete and on track at 30 April 2014
9 |
Upstream Operated Goals FY2014 Plan Actual Progress to 30 April 2014
First gas and water production from Reedy Creek (western area) Q3 Accomplished May 2014
Main pipelines complete Q3 Accomplished
Condabri Central Train 1 commissioned Q4 On Track
First gas and water production from Orana (eastern area) Q4 On Track
Talinga pipeline compression station mechanical completion Q4 Accomplished
Orana Train 1 mechanical completion Q1 FY15 On Track
Reedy Creek Train 1 mechanical completion Q1 FY15 On Track

Upstream development land, environmental and stakeholder management is progressing
10 |
Gas and water gathering
Drilling and completion
Lease acquisition
969
18
766
330
700
397
0
200
400
600
800
1000
1200
Approvals Gathering (well equivalent)
Drilling
Fully approvedCompensation Arrangements AgreedGathering Lines InstalledGathering Design CompletedDrilled (spudded)To be drilled

• Western Fields Spring Gully Combabula / Reedy Creek
• Eastern Fields Condabri Talinga / Orana
Upstream development implementation – Phase 1 operated well progress – April 2014
11 |

12 |
Drilling Completions
Upstream development implementation - Drilling and Completion
Progress Update (30 April 2014):
• 700 Phase 1 operated wells drilled
• 587 Phase 1 wells completed
• 11 drilling rigs
• 7 completion rigs
• 3 flush-by rigs

13 |
Well head technology
3D Model of APLNG Phase 1 Wellhead Separator
Key features that enable a wellhead separator to operate under a wide range of operating conditions include the following:
1. Automated Control System – includes instrumentation, communication/Telemetry to a central control room to enable operator assisted start-up/shut-down, monitoring and ongoing optimisation.
2. Separator Design (internals)
Cyclone Inlet Device with Perforated Baffle Plate
This device provides the primary Gas/Water Separation with the remaining volume in the separator predominantly utilised for well water surge buffering capacity

Upstream development implementation - Gathering
Progress Update (30 April 2014)
• 791 drilling lease preps
• 452 diameter-kilometres of flow lines installed (766 equivalent wells)
• Installation of cable, gas and water High Density Polyethylene (HDPE) pipe to wells through trenching operations
• 3 contractors constructing simultaneously across a wide geographical area
14 |
WHS SHIPMENT 23, 12 Vessels Mounted on Skids, Pipe Fit Ups Commenced
First Weld at Seven Trees Reedy Creek Orana completed Wellhead Separator Installation

Upstream development implementation – Gas and Water Facilities
• All 15 compressor trains and modules in Queensland
• Construction under way on all gas processing and water treatment facilities
• First production wells in Condabri Central commissioned in August 2013, with gas flowing into gathering network and flared, and produced water flowing into ponds
• First production wells in Reedy Creek commissioned in May 2014
• First production wells in Orana on track to be commissioned in June 2014
• Condabri Central 1st compression train under commissioning
• Condabri Central Water Treatment Facility under commissioning
15 |
Condabri Central - Gas Processing Facility Orana – Gas Processing Facility
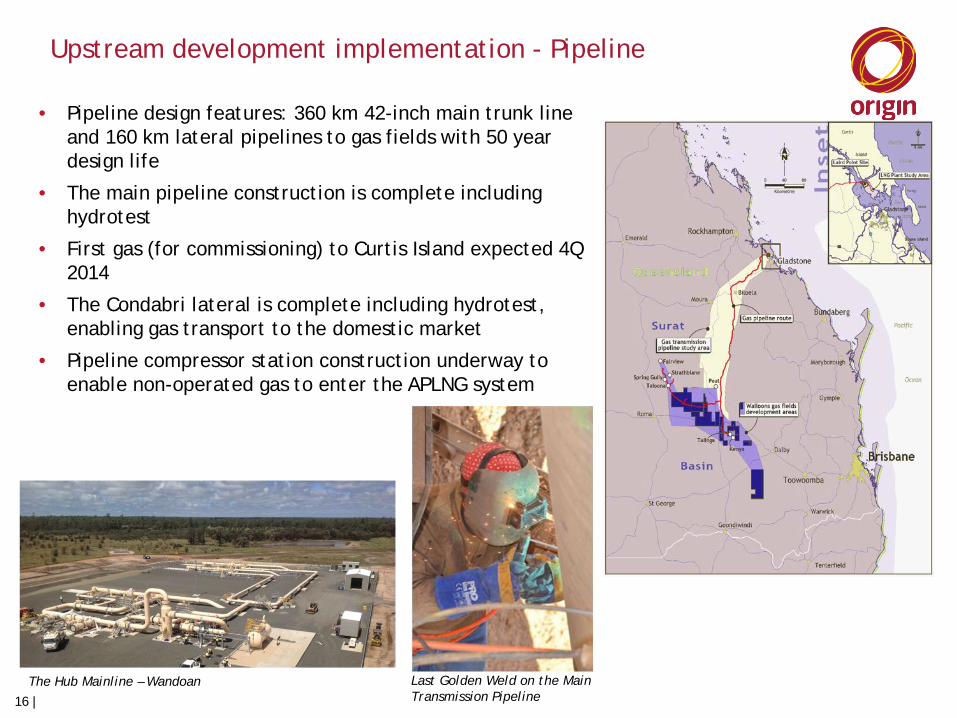
Upstream development implementation - Pipeline
• Pipeline design features: 360 km 42-inch main trunk line and 160 km lateral pipelines to gas fields with 50 year design life
• The main pipeline construction is complete including hydrotest
• First gas (for commissioning) to Curtis Island expected 4Q 2014
• The Condabri lateral is complete including hydrotest, enabling gas transport to the domestic market
• Pipeline compressor station construction underway to enable non-operated gas to enter the APLNG system
16 |
Last Golden Weld on the Main Transmission Pipeline
The Hub Mainline – Wandoan

`
Roma
275kV/132 kV Network “Wandoan South to Eurombah Transmission Project” Forecast first transmission line construction activity to commence in Q3 calendar year 2014.
Power Stations: Reedy Creek 1 (30MW) – complete, awaiting gas Reedy Creek 2 (30MW) – planned mobilisation June 2014 Powerlink 132kV: Contractor mobilised, switchyard pad well advanced
Upstream development implementation - Electrification
17 |
• Power available in the East • Western region progressing supported by temporary power stations
Power Station: Combabula (6MW) – earth grid installation underway. Powerlink 132kV: Contractor mobilised, switchyard pad well advanced
Power Stations: EC 1 (27 MW) – equipment deliveries commenced, bulk civils complete. Powerlink 132kV/275kV: Plan to mobilise late May 2014.

• Eastern water management systems are in place and operating,
– Produced water connections between Condabri, Talinga, Orana and QGC Kenya facility completed
– Treated water connection between Talinga and Condabri completed with Monreagh storage and Fairymeadow Road irrigation operational
– Condabri treatment facility well advanced, commissioning underway
• Western water management systems are well advanced
– First produced water stored in completed brine ponds
– Aquifer injection system wells and pipe distribution system nearing completion
– Construction of the Reedy Creek treatment facility, which duplicates Condabri Central, is underway
Upstream development implementation - Water
18 |
Condabri Central – Feed Pump Station
Water to Landholders. Simon Drury – First Water 14 April 2014

Commissioning and Operational Readiness
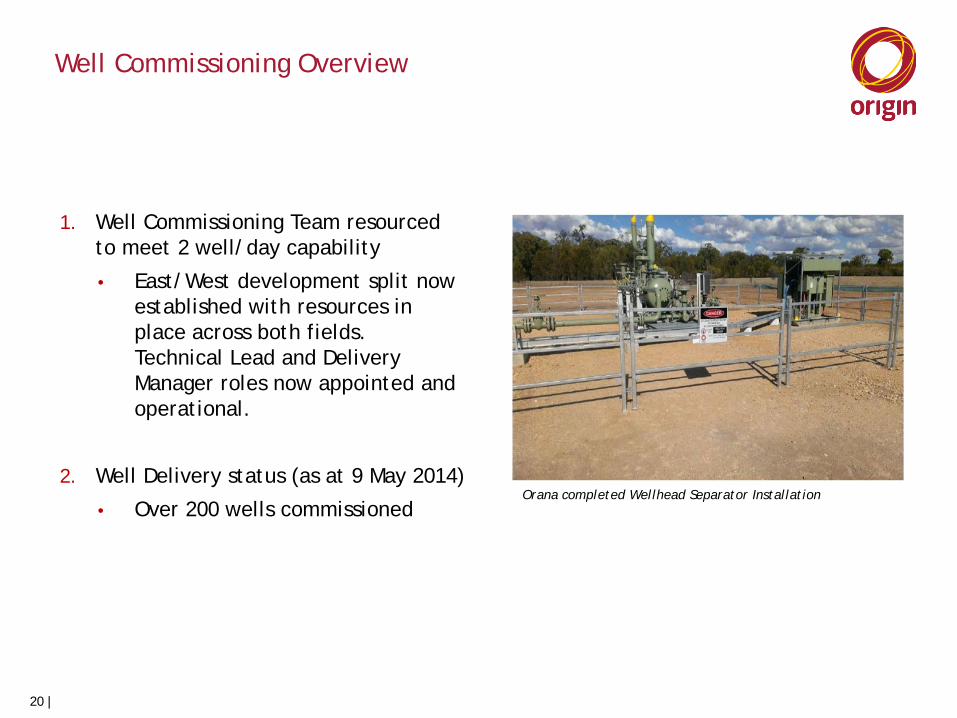
Well Commissioning Overview
1. Well Commissioning Team resourced to meet 2 well/day capability
• East/West development split now established with resources in place across both fields. Technical Lead and Delivery Manager roles now appointed and operational.
2. Well Delivery status (as at 9 May 2014)
• Over 200 wells commissioned
20 |
Orana completed Wellhead Separator Installation

Gas Facilities Commissioning Overview
21 |
Eastern Region
1. Condabri
a) Full commissioning team in place for Train 1 Condabri Central
b) 100% of process systems achieved mechanical completion; instrumentation loop testing >97% complete
c) Utilities fully commissioned
2. Orana
a) Partial commissioning team to support energising of main high voltage substation and early flare construction walkdowns
b) Full resources to be mobilised by end May
Western Region
a) Full Commissioning team mobilised for early flare and Reedy Creek asset commissioning

Pipelines Commissioning Overview
1. Pipelines
a) Wet commissioning completed on Condabri Talinga water pipeline
b) Orana Talinga water pipeline pre-commissioned
c) Condabri Talinga high pressure gas pipeline hydrocarbon packed
d) Condabri Lateral North pipeline pre-commissioned
e) Woleebee receiver pre-commissioned
f) Ruby spur line hydrocarbon filled and operational
g) Resources in place to commission and gas fill main pipeline to Curtis Island to support commissioning of early LNG utility systems
2. Pipeline Compression / Interconnect Facilities (PCIF)
a) Commissioning complete at Condabri Talinga Wallumbilla facility to support Condabri Central Train 1 startup
b) Walkdowns initiated at Talinga pipeline compression interconnect facility
22 |

Operations Readiness Key Focus Areas
23 |
Activities to ensure we meet the targets set out in Final Investment Decision for SAFETY, AVAILABILITY and PRODUCTION.
Current Focus Areas
• Safe Start Up of Condabri Central with Pre-Start Up Safety Review scheduled end of May
• Brisbane Control Room ready to commission increasing number of wells and facilities
• Safety Management Plan implementation across new assets
• Critical Processes and Procedures development and implementation
• Ensuring competent / trained operators in the field

Field Performance / Key Exploration & Appraisal Areas of Focus

Origin has over 16 years of CSG production experience
25 |
APLNG tenure in the Surat and Bowen basins at 30 April 2014
APLNG has prime acreage in both “sweet spots” in Queensland, with 2P reserves more than sufficient to cover gas requirements for all domestic contracts, as well as off-takes from both LNG trains

Looking ahead, APLNG has significant remaining development in high confidence areas with proven success …
… followed by development expanding into greenfield areas ( ) Gilbert Gully
26 |

27 |
Maximum well deliverability considerably higher than current production levels indicate …
(1) Excludes domestic gas sales and pre LNG-start up gas sales to QGC. (2) Maximum average observable rate sustained over a week, looking back over one year, from wells that have been online for more than 6 months.
• The operated wells to be drilled for Phase 1 are expected to produce around 1,200 TJ/d1, with an additional 200 TJ/d1 from non-operated assets
• The observed maximum average well deliverability2 across operated areas is considerably higher than targeted average well rate
• Well production is turned down to meet market demand but operationally cycled to maintain confidence in deliverability
Averages over Quarter to 31st March 2014
Maximum average well deliverability2
Talinga 2.1 TJ/d
Spring Gully 1.1 TJ/d
… whilst Phase 1 planning assumes 1.2 TJ/d per well on average
15% of Talinga wells have maximum
deliverability over 4 TJ/d

Typical Phase 1 Well Forecast
• Typical phase 1 well forecast to have: – peak gas rate 1-2 TJ/d – peak water rate 500-1000
bbl/d – approx 50-70% of well’s
reserves produced within first 5 years
Prod
ucti
on R
ate
Gas
Dewatering Stage
Water
Stable Production Stage Decline Stage
Time
28 |
Spring Gully (Phase 1) Condabri
Combabula/Reedy Creek
Spring Gully (pre-LNG) Talinga

Spring Gully Production Performance
• Chart shows average performance per well for the online duration of each well
• Rates per well are consistent with typical Spring Gully well performance of around 1 TJ/d
... gas performance of new Phase 1 wells tracking well
•Normalised Months Online refers to average well performance for the online duration of each well •Average production rates are determined by all online commissioned Phase 1 wells
0
200
400
600
800
1000
1200
1400
0 2 4 6 8 10
Aver
age
Gas R
ate
(GJ/
d)
Normalised Months Online
Spring Gully Phase 1 Gas Rate Comparison
Actual Gas Average (GJ/d)
Phase 1 Wellhead
Spring Gully Phase 1 – Average Well Performance
29 |
0
100
200
300
400
500
600
700
800
900
0 1 2 3 4 5 6 7
Gas A
vera
ge (G
J/d)
Normalised Months Online
Condabri Gas Rate
Actual Gas Average (GJ/d)
Adjusted Gas Rates (inclusion of achieved rates) GJ/d
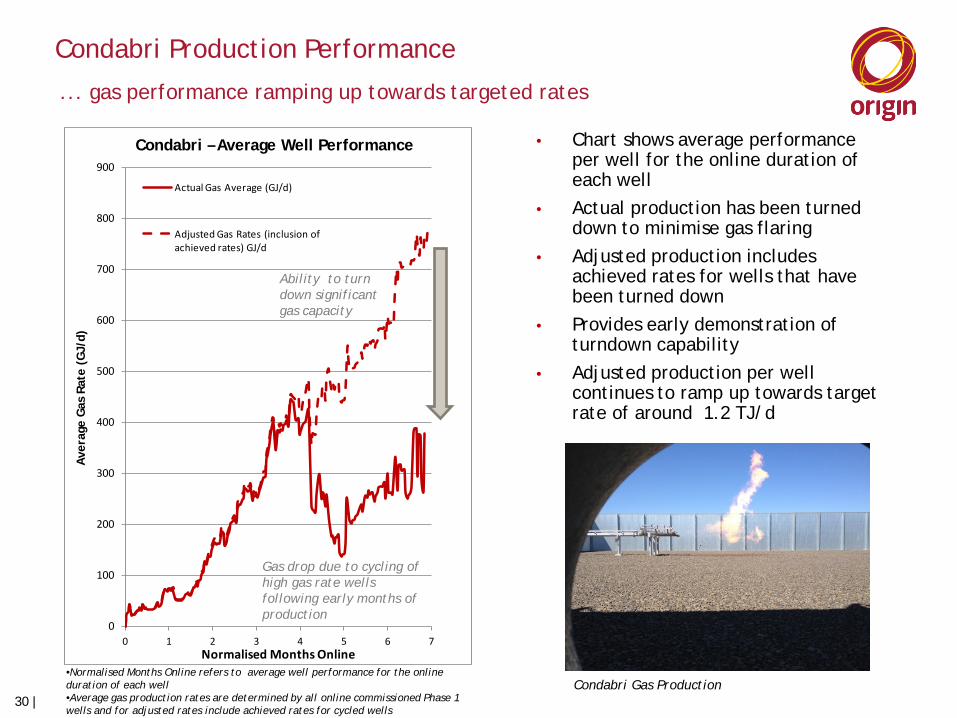
Condabri Production Performance
... gas performance ramping up towards targeted rates
Gas drop due to cycling of high gas rate wells following early months of production
•Normalised Months Online refers to average well performance for the online duration of each well •Average gas production rates are determined by all online commissioned Phase 1 wells and for adjusted rates include achieved rates for cycled wells
Ability to turn down significant gas capacity
• Chart shows average performance per well for the online duration of each well
• Actual production has been turned down to minimise gas flaring
• Adjusted production includes achieved rates for wells that have been turned down
• Provides early demonstration of turndown capability
• Adjusted production per well continues to ramp up towards target rate of around 1.2 TJ/d
Condabri – Average Well Performance
Ave
rage
Gas
Rat
e (G
J/d)
Condabri Gas Production 30 |

0
500
1000
1500
2000
2500
3000
3500
4000
4500
5000
0
500
1000
1500
2000
2500
3000
3500
4000
4500
5000
Max
imum
Mon
thly
Wat
er A
vera
ge (b
bl/d
)
Max
imum
Wel
l Del
iver
baili
ty (G
J/d)
Wells
Talinga Gas and Water Production
Maximum Well Deliverability (GJ/d)Maximum Water Monthly Average (Bbl/d)
0
500
1000
1500
2000
2500
3000
3500
4000
4500
5000
0
500
1000
1500
2000
2500
3000
3500
4000
4500
5000
Max
imum
Mon
thly
Wat
er A
vera
ge (b
bl/d
)
Max
imum
Wel
l Del
iver
abili
ty (G
J/d)
Wells
Condabri Gas and Water Production Maximum Well Deliverability for Gas (GJ/d)Maximum Water Monthly Average (bbl/d)
Condabri Outlook
Talinga field~5 years production Condabri field ~6 months production
... water performance lower than Talinga (as expected) but still very productive, expect gas performance to grow with time
*Maximum average observable rate sustained over a week, looking back over one year, from wells that have been online for more than 6 months. Maximum Monthly Water Average is defined as : peak monthly water average per well for the online duration of each well
* *
expect Condabri gas performance to grow with time
Condabri water indicates high productivity
31 |

Combabula/Reedy Creek
Chart shows water production rate observed during completion operation
This provides an indication of ultimate well performance
Talinga wells produce over a range with the best wells peaking at over 4TJ/d
Best Condabri well to date has produced at 3 TJ/d
...early water rates are in line with expectations
Wat
er R
ate
(bbl
/d) t
este
d by
com
plet
ion
rig
Flow Test Results
Talinga/Orana Condabri Wells Combabula/Reedy Creek Wells
More Productive
Less Productive
32 |

CSG Water – Update on Brine Solutions
Base case strategy for brine management (outlined in the EIS) is holding brine in ponds prior to storage in a mixed salt storage facility
APLNG has investigated Selective Salt Recovery, Ocean Outfall and Brine Injection as alternatives to the base case
Produced Water ~4,000 TDS
Pre-Treatment /RO Plant
RO Reject ~40,000 TDS
Permeate
Brine Concentration Plant
Distillate
Brine Ponds
To Permeate Management Solution
Crystallisation Plant
Conc. Brine ~180,000 TDS
Mixed Salt Storage Facility
Mixed Salt <15% moisture
Going forward, the focus is on the base case and Brine Injection
Optimization studies show that construction of a limited number of additional brine ponds allows for deferral of significant capital associated with Brine Concentration and Crystallisation
Conc. Brine
33 |

Northern Bowen –Multi-well vertical pilots underway. Frac Pilots and Horizontal well pilots planned.
Bowen E&A programme CY14/15
Reids Dome – Excellent results obtained. Follow up pilots planned.
Spring Gully Flank – Good results
from Horizontal wells. Follow up wells planned to
extend depth cut-off.
• Looking forward, Exploration & Appraisal is focused on areas outside the core high confidence development areas
• Objectives are to prove up additional reserves and inform subsequent development
34 |

Surat E&A programme
CY14/15
Walloons Low Perm –
encouraging pilot results. Frac
Pilots underway.
Exploration Upside – Deep
Conventional Test
Condabri South – Prove up reserves & secure tenure
as PL
35 |

Sustain Phase

Drilling continues in the Walloons and Spring Gully areas through to 2020 …
37 |
Development focused on Walloons and Spring Gully in period to 2020: • Moving out from, and infill drilling in,
initial development areas • ~75% of wells in the Walloons • Low percentage of fracced wells • Focus on reducing drill & connect
costs and testing new well designs • Expect to drill around 300 operated
wells per year on average • Expect to participate in around 300
non-operated wells per year on average
• Expect to invest in further non-operated gas processing facilities prior to 2020
• APLNG has equity share in non-operated permits of between 20%-40%
… and extends to broader geographical areas, incorporating new technology plays, in the longer term

A key focus of the sustain phase is optimisation of current Drill Complete Connect costs of approximately $3 million per well
38 |
Opportunities for reducing Drill Complete Connect costs:
• Process improvement
• Contracting strategy
• Technology and Innovations:
• Horizontal drilling and other new well designs
• Fracture stimulation
• Co-mingling of water and gas gathering lines
• Standardisation across the industry
• Common training with other proponents
• Resource planning across the industry
Low permeability pilot well

Existing CSG fields
LNG development
fields
Sustain Phase Operations
$/G
J
Extracting scale benefits, utilising new technologies and maximising productivity to drive operating cost reductions
39 |
As more wells come online expect to realise scale benefits, driving down operating costs, with specific areas of focus to optimise activities:
• Labour and associated costs
• Reliability and maintenance
• Well workovers
• Well head technology
• Productivity improvements
Upstream operating costs include:
• Well and facilities maintenance and reliability
• Camp operations
• Power Usage
Decreasing operating
costs
National Electricity Forecasting Report 2013 (AEMO) - FY14 to FY18 large industrial energy growth of 8,153 GWh, driven mainly by three confirmed LNG projects

Metrics

The first full year of earnings and cash flows from both APLNG trains is expected to be FY2017…
(1) Distributable amount is cash flow after revenues, operational expenditure, ongoing capital expenditure, project finance interest and repayments, and taxation.
… with distributable cash flow1 of around US$1 billion (Origin 37.5% share) on average per year
• With the phased start up of Train 1 and Train 2, APLNG’s FY2016 financial results will be subject to the following factors:
• The rate at which LNG production ramps up from ready for start up to full production
from both trains
• Gas sales as APLNG and other LNG projects ramp up gas production in readiness for LNG production
• Accounting considerations through ramp up period • APLNG is not expected to pay tax in the early years of LNG production given deductibility of
previous expenditure
41 |

APLNG Reference Information
42 |
Sales
Reference Metric Source
LNG Train Capacity 9.0 mtpa FID2 Presentation 4 July 2012
Contract LNG Export Volumes 8.6 mtpa FID2 Presentation 4 July 2012
LNG Export Contracts Terms 20 year contracted off-take agreements with Sinopec and Kansai Electric, based on JCC - linked pricing: - Sinopec 4.3 mtpa; signed April 2011 - Sinopec 3.3 mtpa; signed January 2012 - Kansai 1.0 mtpa; signed June 2012
ASX releases: 21 April 2011 20 January 2012 29 June 2012
Domestic volumes Historical domestic sales volumes of 115 PJe (FY2012) and 119 PJe (FY2013)
Origin Energy Operating and Financial Reviews issued 23 August 2012 and 22 August 2013
QGC Gas Sale agreement QGC contracted sales for a 20 year term following commencement of commercial operations at QCLNG
ASX release 25 February 2010
Reference information in respect of the APLNG project and operations

APLNG Reference Information
43 |
Reference Metric Source
Operating expenditure Key components comprise • Downstream liquefaction costs • Upstream operating expenditure includes:
• Upstream well & facilities maintenance and reliability
• Upstream field power costs
This presentation
Royalties • Methodology is subject to ongoing discussions with the Queensland State Government
Operating Expenditure
Project Finance
Reference Metric Source
Quantum US$8.5 billion facility ASX Release 24 May 2012
Banks US EXIM, China EXIM, Commercial Banks ASX Release 24 May 2012
Terms 16 – 17 years from inception
2028 – Commercial banks
2029 – US EXIM
2028 – China EXIM
ASX Release 24 May 2012

APLNG Reference Information
44 |
Reference Metric Source
Upstream sustaining capital expenditure
• Expect around 300 operated wells drilled per year in near term
• Drill, complete, connect cost approximately $3m per operated well, with cost reductions targeted through ongoing operations
• Expect to participate in around 300 non-operated wells per year
• Expected to invest in further gas processing facilities post LNG production, operated and non-operated
• Non-operated permit equity share between 20%-40%
This presentation
Upstream Sustaining Capital Expenditure
Reference Metric Source
Upstream Permit information Details of Operated and Non-Operated permit information including percentage interests
Quarterly Production report released 30 April 2014
Upstream Permit Information

Downstream Project Delivery

Curtis Island has been designated as an LNG precinct by the State and Federal governments
46 | 46 |

• Two trains of 4.5 mtpa capacity, consisting of: – 6 General Electric (GE) Model LM 2500+ G4
drivers
– Turbine inlet air chilling
– Redesigned nitrogen rejection units
– Waste heat recovery
• EIS approval for four trains • Two LNG storage tanks
– Capacity of 160,000 m3 each • LNG loading berth and jetty
– Suitable for ships with capacity up to 220,000 m3
• Utilities - power generation, water and sewerage (from the mainland), air and nitrogen, ground flares
• Control room capable of operating four trains (with expansion)
• Temporary facilities set-up for construction include 2,600 man camp, offices, laydown area
APLNG Downstream Facilities
47 |
Liquefaction of natural gas is an established technology. The project utilises the Optimised Cascade Technology similar to the Darwin LNG project which has operated since 2006
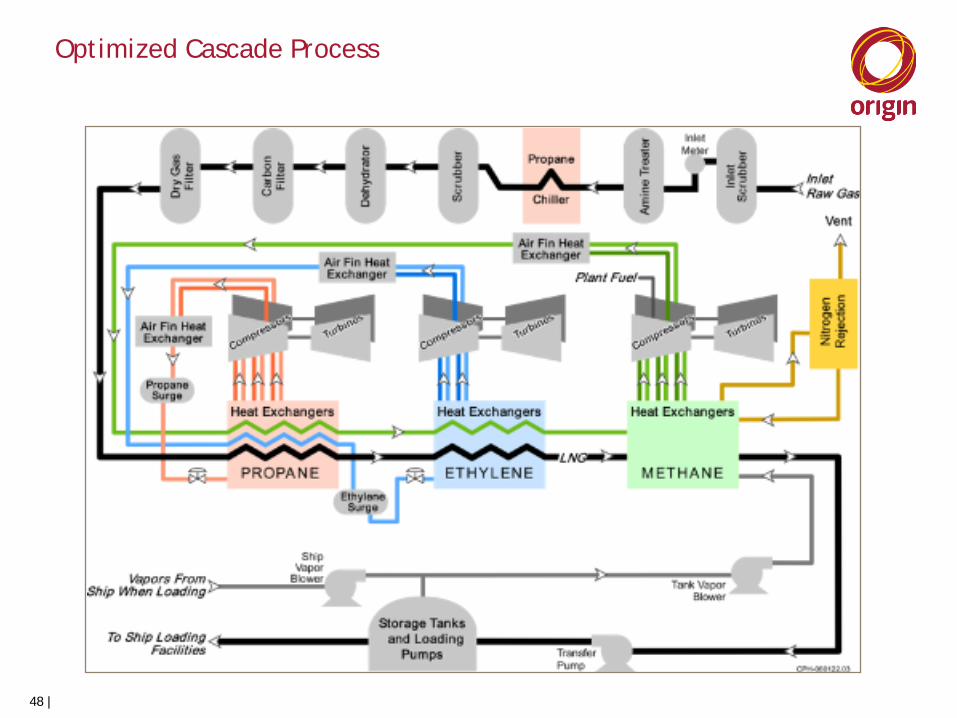
Optimized Cascade Process
48 |

Downstream Project progress - 70% complete and on track at 30 April 2014
49 |
Downstream Operated Goals FY2014 Plan Actual Progress to 30 April 2014
First cryo modules set Q3 Accomplished: Feb 2014
Last Train 2 refrigeration compressor set Q3 Accomplished: Mar 2014
Complete loading platform for LNG jetty Q4 To be completed in 1Q15 – no impact to critical path
All OSBL modules set Q4 Accomplished: March 2014
LNG Tank A hydrostatic test complete Q4 On Track
Last Train 1 module set Q4 On Track
Last Train 2 module set Q2 FY15 On Track
LNG Tanks, May 2014 Curtis Island site, May 2014 Overview of Train 1 Inside Battery Limits (ISBL)

Project Highlights
• Downstream project is on schedule
– Engineering is effectively complete with no holds for construction remaining
– Procurement is in line with plan. All major equipment has now been delivered and set. Minor critical items are expedited as necessary
– All dredging is now complete. The contractor has demobilised from the harbour
– Logistics facilities are complete. MOF and Rock & Ferry causeway are fully operational
– Site accommodation village is complete with 2,600 rooms available
– Construction manning is at peak and will remain at peak until Q1 CY2015
– Focus on the transition to operations and reliable production
50 |

Downstream project current status - Construction
51 |
MARINE FACILITIES
• Piling has been completed. The loading arms have been installed
• The jetty is expected to be complete by year end and is not on the critical path to first cargo
MODULE FABRICATION, INDONESIA
• All Train 1 and OSBL modules shipped
• Forecast to complete all modules by year end
DREDGING
• Done
TEMPORARY WORKERS’ ACCOMMODATION FACILITY (TWAF)
• All 2,600 beds available and utilised
LNG TRAINS
• Train 1 construction approaching 60% complete. All equipment has been set. One module remaining (due to be set early June). Critical path currently runs through the installation of the compression system piping
• Train 2 construction progressing. All equipment has been set ahead of plan. Critical path runs through the module deliveries
LNG TANKS
• Tanks A & B: are nearing mechanical completion. Tank A hydrotest will commence shortly followed by Tank B
• Both tanks are expected to be complete by 1Q15 and are not on the critical path to first cargo

Downstream project current status - Construction
52 |
Train 2 Cold Boxes loaded out for shipment Module 101DA delivered to site

Full operations
53 |
• Key data
• 4.5mmtpa per train
• ~730TJ/day gas rate per train
• ~30,000m3/day of LNG per train
• ~6 days to fill a Tank when one train running ~3 days to fill a tank when two trains running
• Ship every 6 days with one train & 3 days with two trains
• <12-14hrs to fill a ship (165,000m3 ship) (total time ~36hrs)
• Minor maintenance (one train, half rate for 2-5 days) every 6 months (per train)
• Major Maintenance (one train, full rate for 30 days) every 3-5 years (per train)

Fishermans Landing Northern Expansion (FLNE) Bund Wall
54 |

Port of Gladstone Overview
55 |

Curtis Island Site – May 2014
56 |
Utilities
Tank B
Tank A
Train 2
Train 1 MOF
RO/RO Ramp
Construction Facilities
Control & Maintenance
Accommodation Village
LNG Jetty
Ferry & Rock Causeway

Trains 1 & 2 Outside Battery Limits (OSBL) – May 2014
57 |

Trains 1 & 2 Inside Battery Limits (ISBL) – May 2014
58 |

Train 1 – May 2014
Hot Oil Heater/Incinerator Area – Piping Installation
59 |
Propane Refrigeration Area – Setting “Candy Cane” on Propane Suction Drum

Train 2 Area – May 2014
60 |

Train 2 – May 2014
Propane Suction Drums Set
61 |
Compressor Substation being moved into position

LNG Tanks – May 2014
62 |

Permanent Buildings – May 2014
63 |

LNG Jetty – May 2014
64 |
Loading Platform & Trestle
Loading Arms installed on Platform

Module Yard – April / May 2014
65
Final Train 1 Module (Propane Chiller 101JA) & First Train 2 Module (Sub-Cooler 202 NE) shipped on 22 April
Propane Condenser 202ND shipped 13 May
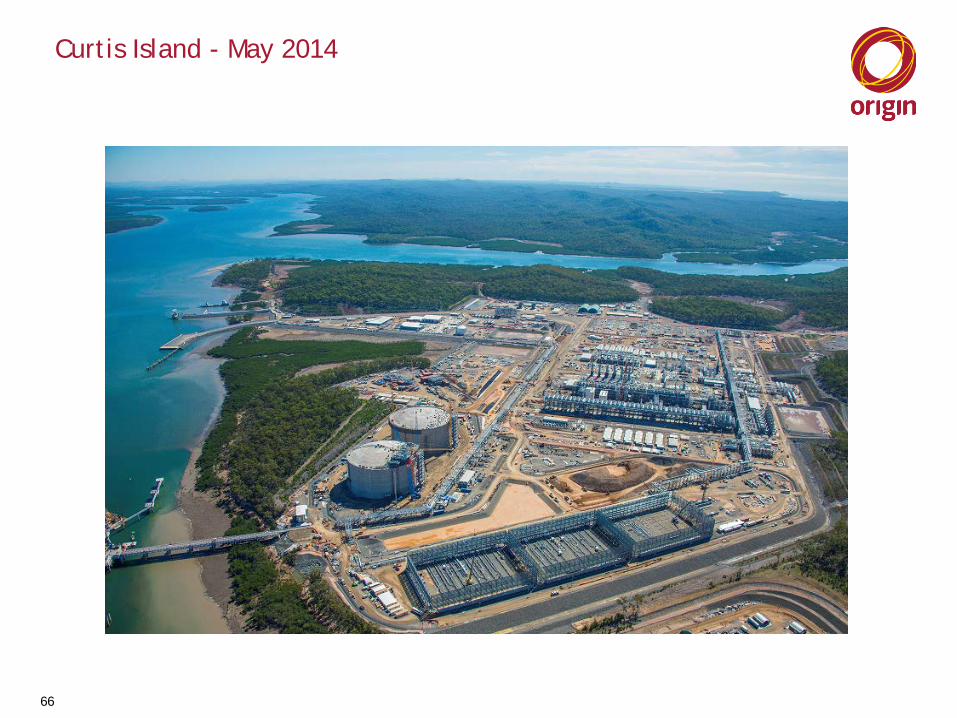
Curtis Island - May 2014
66

Thank you